Makoti, ND
Makoti Map
Makoti Overview
86
TOTAL POPULATION
51
MALE POPULATION
35
FEMALE POPULATION
145.71
MALES / 100 FEMALES
68.63
FEMALES / 100 MALES
57.3
MEDIAN AGE
2.5
AVG FAMILY SIZE
1.8
AVG HOUSEHOLD SIZE
$27,773
PER CAPITA INCOME
$92,857
AVG FAMILY INCOME
$49,000
AVG HOUSEHOLD INCOME
0.40
INEQUALITY / GINI INDEX
35
LABOR FORCE [ PEOPLE ]
47.9%
PERCENT IN LABOR FORCE
5.7%
UNEMPLOYMENT RATE
Makoti Zip Codes
Makoti Area Codes
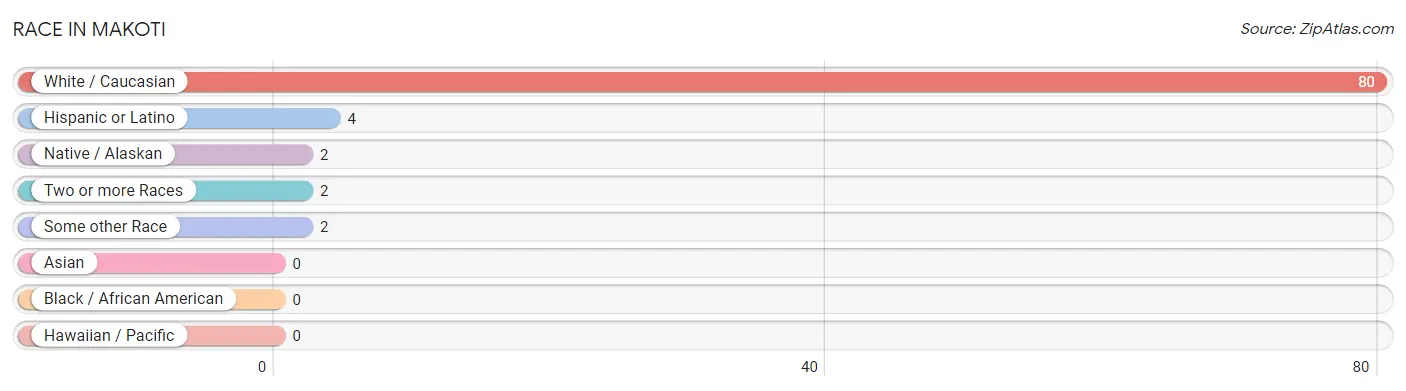
Race in Makoti
The most populous races in Makoti are White / Caucasian (80 | 93.0%), Hispanic or Latino (4 | 4.6%), and Native / Alaskan (2 | 2.3%).
| Race | # Population | % Population |
| Asian | 0 | 0.0% |
| Black / African American | 0 | 0.0% |
| Hawaiian / Pacific | 0 | 0.0% |
| Hispanic or Latino | 4 | 4.6% |
| Native / Alaskan | 2 | 2.3% |
| White / Caucasian | 80 | 93.0% |
| Two or more Races | 2 | 2.3% |
| Some other Race | 2 | 2.3% |
| Total | 86 | 100.0% |
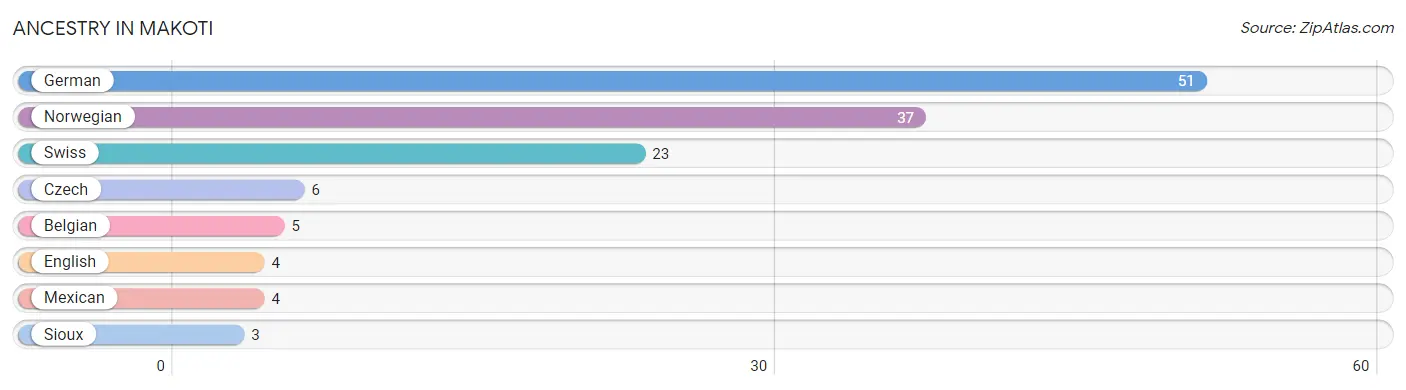
Ancestry in Makoti
The most populous ancestries reported in Makoti are German (51 | 59.3%), Norwegian (37 | 43.0%), Swiss (23 | 26.7%), Czech (6 | 7.0%), and Belgian (5 | 5.8%), together accounting for 141.9% of all Makoti residents.
| Ancestry | # Population | % Population |
| Belgian | 5 | 5.8% |
| Czech | 6 | 7.0% |
| English | 4 | 4.6% |
| German | 51 | 59.3% |
| Mexican | 4 | 4.6% |
| Norwegian | 37 | 43.0% |
| Sioux | 3 | 3.5% |
| Swiss | 23 | 26.7% | View All 8 Rows |
Immigrants in Makoti

| Immigration Origin | # Population | % Population | View All 0 Rows |
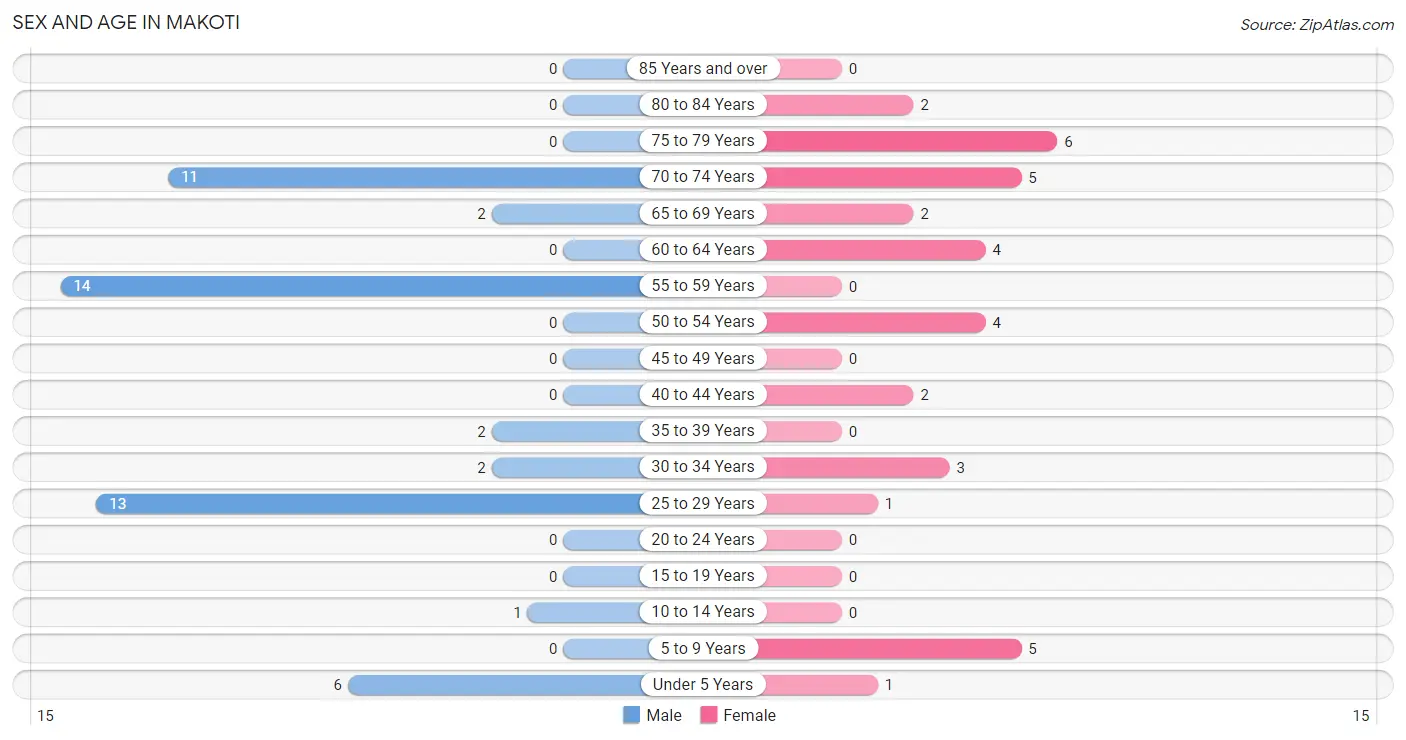
Sex and Age in Makoti
Sex and Age in Makoti
The most populous age groups in Makoti are 55 to 59 Years (14 | 27.5%) for men and 75 to 79 Years (6 | 17.1%) for women.
| Age Bracket | Male | Female |
| Under 5 Years | 6 (11.8%) | 1 (2.9%) |
| 5 to 9 Years | 0 (0.0%) | 5 (14.3%) |
| 10 to 14 Years | 1 (2.0%) | 0 (0.0%) |
| 15 to 19 Years | 0 (0.0%) | 0 (0.0%) |
| 20 to 24 Years | 0 (0.0%) | 0 (0.0%) |
| 25 to 29 Years | 13 (25.5%) | 1 (2.9%) |
| 30 to 34 Years | 2 (3.9%) | 3 (8.6%) |
| 35 to 39 Years | 2 (3.9%) | 0 (0.0%) |
| 40 to 44 Years | 0 (0.0%) | 2 (5.7%) |
| 45 to 49 Years | 0 (0.0%) | 0 (0.0%) |
| 50 to 54 Years | 0 (0.0%) | 4 (11.4%) |
| 55 to 59 Years | 14 (27.5%) | 0 (0.0%) |
| 60 to 64 Years | 0 (0.0%) | 4 (11.4%) |
| 65 to 69 Years | 2 (3.9%) | 2 (5.7%) |
| 70 to 74 Years | 11 (21.6%) | 5 (14.3%) |
| 75 to 79 Years | 0 (0.0%) | 6 (17.1%) |
| 80 to 84 Years | 0 (0.0%) | 2 (5.7%) |
| 85 Years and over | 0 (0.0%) | 0 (0.0%) |
| Total | 51 (100.0%) | 35 (100.0%) |
Families and Households in Makoti
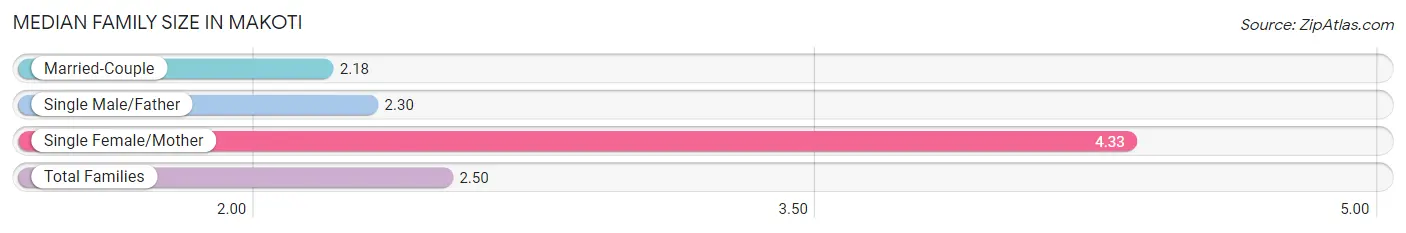
Median Family Size in Makoti
The median family size in Makoti is 2.50 persons per family, with single female/mother families (3 | 12.5%) accounting for the largest median family size of 4.33 persons per family. On the other hand, married-couple families (11 | 45.8%) represent the smallest median family size with 2.18 persons per family.
| Family Type | # Families | Family Size |
| Married-Couple | 11 (45.8%) | 2.18 |
| Single Male/Father | 10 (41.7%) | 2.30 |
| Single Female/Mother | 3 (12.5%) | 4.33 |
| Total Families | 24 (100.0%) | 2.50 |
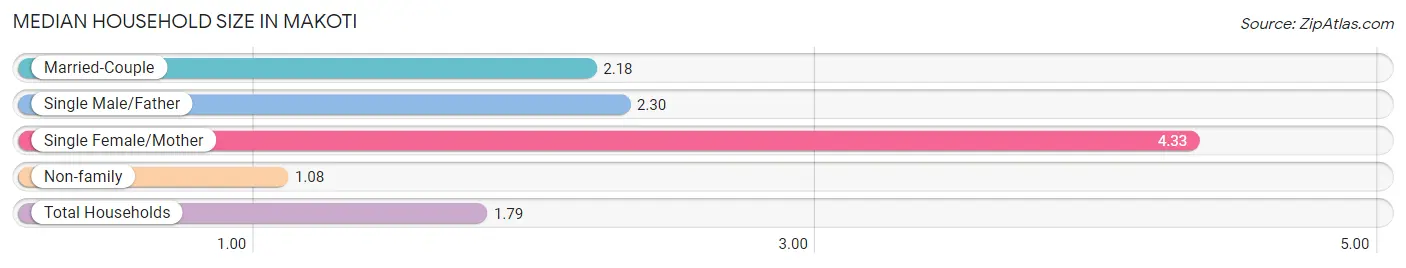
Median Household Size in Makoti
The median household size in Makoti is 1.79 persons per household, with single female/mother households (3 | 6.2%) accounting for the largest median household size of 4.33 persons per household. non-family households (24 | 50.0%) represent the smallest median household size with 1.08 persons per household.
| Household Type | # Households | Household Size |
| Married-Couple | 11 (22.9%) | 2.18 |
| Single Male/Father | 10 (20.8%) | 2.30 |
| Single Female/Mother | 3 (6.2%) | 4.33 |
| Non-family | 24 (50.0%) | 1.08 |
| Total Households | 48 (100.0%) | 1.79 |
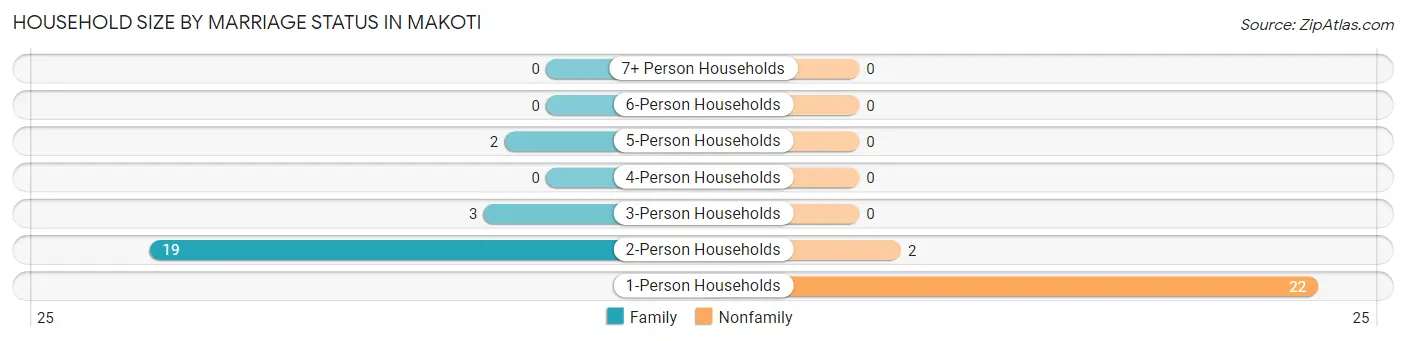
Household Size by Marriage Status in Makoti
Out of a total of 48 households in Makoti, 24 (50.0%) are family households, while 24 (50.0%) are nonfamily households. The most numerous type of family households are 2-person households, comprising 19, and the most common type of nonfamily households are 1-person households, comprising 22.
| Household Size | Family Households | Nonfamily Households |
| 1-Person Households | - | 22 (45.8%) |
| 2-Person Households | 19 (39.6%) | 2 (4.2%) |
| 3-Person Households | 3 (6.2%) | 0 (0.0%) |
| 4-Person Households | 0 (0.0%) | 0 (0.0%) |
| 5-Person Households | 2 (4.2%) | 0 (0.0%) |
| 6-Person Households | 0 (0.0%) | 0 (0.0%) |
| 7+ Person Households | 0 (0.0%) | 0 (0.0%) |
| Total | 24 (50.0%) | 24 (50.0%) |
Female Fertility in Makoti
Fertility by Age in Makoti
| Age Bracket | Women with Births | Births / 1,000 Women |
| 15 to 19 years | 0 (0.0%) | 0.0 |
| 20 to 34 years | 0 (0.0%) | 0.0 |
| 35 to 50 years | 0 (0.0%) | 0.0 |
| Total | 0 (0.0%) | 0.0 |
Fertility by Age by Marriage Status in Makoti
| Age Bracket | Married | Unmarried |
| 15 to 19 years | 0 (0.0%) | 0 (0.0%) |
| 20 to 34 years | 0 (0.0%) | 0 (0.0%) |
| 35 to 50 years | 0 (0.0%) | 0 (0.0%) |
| Total | 0 (0.0%) | 0 (0.0%) |
Fertility by Education in Makoti
| Educational Attainment | Women with Births | Births / 1,000 Women |
| Less than High School | 0 (0.0%) | 0.0 |
| High School Diploma | 0 (0.0%) | 0.0 |
| College or Associate's Degree | 0 (0.0%) | 0.0 |
| Bachelor's Degree | 0 (0.0%) | 0.0 |
| Graduate Degree | 0 (0.0%) | 0.0 |
| Total | 0 (0.0%) | 0.0 |
Fertility by Education by Marriage Status in Makoti
| Educational Attainment | Married | Unmarried |
| Less than High School | 0 (0.0%) | 0 (0.0%) |
| High School Diploma | 0 (0.0%) | 0 (0.0%) |
| College or Associate's Degree | 0 (0.0%) | 0 (0.0%) |
| Bachelor's Degree | 0 (0.0%) | 0 (0.0%) |
| Graduate Degree | 0 (0.0%) | 0 (0.0%) |
| Total | 0 (0.0%) | 0 (0.0%) |
Income in Makoti
Income Overview in Makoti
Per Capita Income in Makoti is $27,773, while median incomes of families and households are $92,857 and $49,000 respectively.
| Characteristic | Number | Measure |
| Per Capita Income | 86 | $27,773 |
| Median Family Income | 24 | $92,857 |
| Mean Family Income | 24 | $76,100 |
| Median Household Income | 48 | $49,000 |
| Mean Household Income | 48 | $50,583 |
| Income Deficit | 24 | $0 |
| Wage / Income Gap (%) | 86 | 0.00% |
| Wage / Income Gap ($) | 86 | 100.00¢ per $1 |
| Gini / Inequality Index | 86 | 0.40 |
Earnings by Sex in Makoti
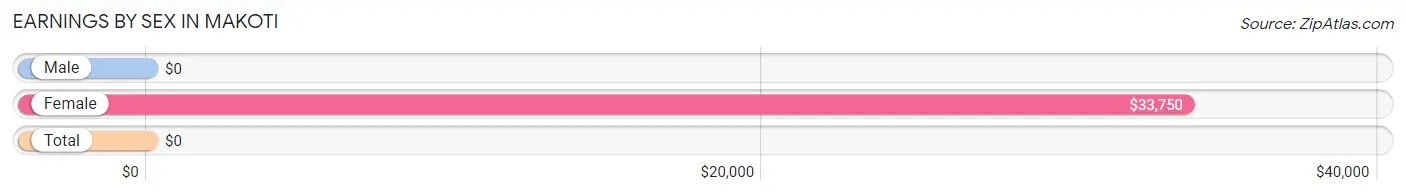
| Sex | Number | Average Earnings |
| Male | 21 (60.0%) | $0 |
| Female | 14 (40.0%) | $33,750 |
| Total | 35 (100.0%) | $0 |
Earnings by Sex by Income Bracket in Makoti
The most common earnings brackets in Makoti are $15,000 to $17,499 for men (13 | 61.9%) and $30,000 to $34,999 for women (4 | 28.6%).
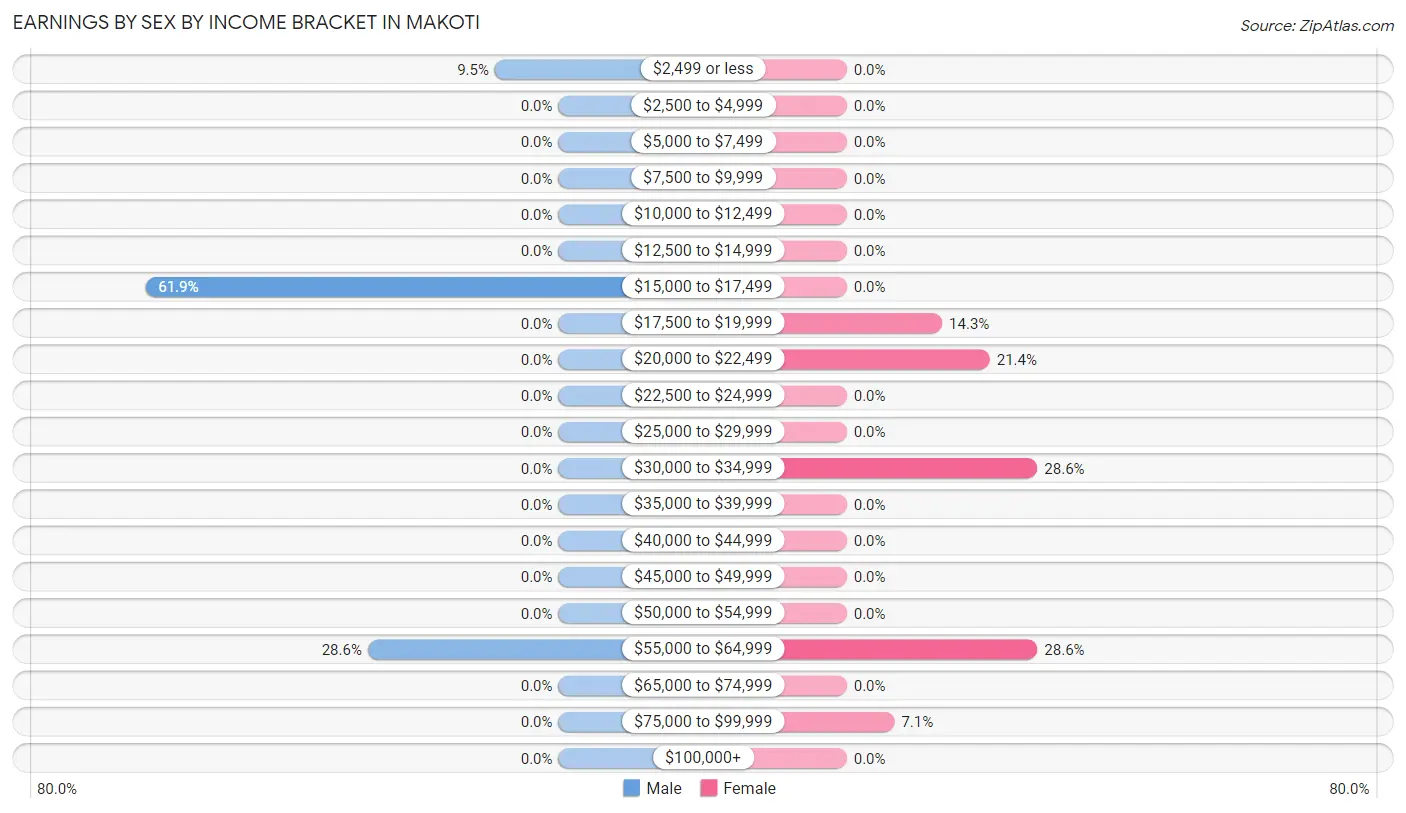
| Income | Male | Female |
| $2,499 or less | 2 (9.5%) | 0 (0.0%) |
| $2,500 to $4,999 | 0 (0.0%) | 0 (0.0%) |
| $5,000 to $7,499 | 0 (0.0%) | 0 (0.0%) |
| $7,500 to $9,999 | 0 (0.0%) | 0 (0.0%) |
| $10,000 to $12,499 | 0 (0.0%) | 0 (0.0%) |
| $12,500 to $14,999 | 0 (0.0%) | 0 (0.0%) |
| $15,000 to $17,499 | 13 (61.9%) | 0 (0.0%) |
| $17,500 to $19,999 | 0 (0.0%) | 2 (14.3%) |
| $20,000 to $22,499 | 0 (0.0%) | 3 (21.4%) |
| $22,500 to $24,999 | 0 (0.0%) | 0 (0.0%) |
| $25,000 to $29,999 | 0 (0.0%) | 0 (0.0%) |
| $30,000 to $34,999 | 0 (0.0%) | 4 (28.6%) |
| $35,000 to $39,999 | 0 (0.0%) | 0 (0.0%) |
| $40,000 to $44,999 | 0 (0.0%) | 0 (0.0%) |
| $45,000 to $49,999 | 0 (0.0%) | 0 (0.0%) |
| $50,000 to $54,999 | 0 (0.0%) | 0 (0.0%) |
| $55,000 to $64,999 | 6 (28.6%) | 4 (28.6%) |
| $65,000 to $74,999 | 0 (0.0%) | 0 (0.0%) |
| $75,000 to $99,999 | 0 (0.0%) | 1 (7.1%) |
| $100,000+ | 0 (0.0%) | 0 (0.0%) |
| Total | 21 (100.0%) | 14 (100.0%) |
Earnings by Sex by Educational Attainment in Makoti
| Educational Attainment | Male Income | Female Income |
| Less than High School | - | - |
| High School Diploma | - | - |
| College or Associate's Degree | - | - |
| Bachelor's Degree | - | - |
| Graduate Degree | - | - |
| Total | - | - |
Family Income in Makoti
Family Income Brackets in Makoti
According to the Makoti family income data, there are 16 families falling into the $75,000 to $99,999 income range, which is the most common income bracket and makes up 66.7% of all families.
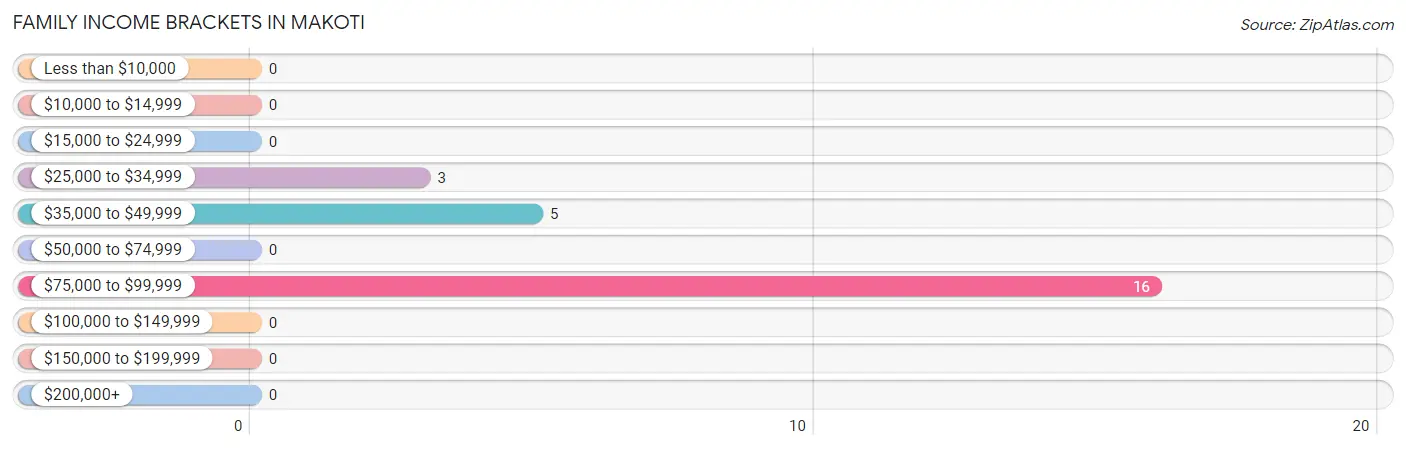
| Income Bracket | # Families | % Families |
| Less than $10,000 | 0 | 0.0% |
| $10,000 to $14,999 | 0 | 0.0% |
| $15,000 to $24,999 | 0 | 0.0% |
| $25,000 to $34,999 | 3 | 12.5% |
| $35,000 to $49,999 | 5 | 20.8% |
| $50,000 to $74,999 | 0 | 0.0% |
| $75,000 to $99,999 | 16 | 66.7% |
| $100,000 to $149,999 | 0 | 0.0% |
| $150,000 to $199,999 | 0 | 0.0% |
| $200,000+ | 0 | 0.0% |
Family Income by Famaliy Size in Makoti
2-person families (19 | 79.2%) account for the highest median family income in Makoti with $93,304 per family, while 2-person families (19 | 79.2%) have the highest median income of $46,652 per family member.
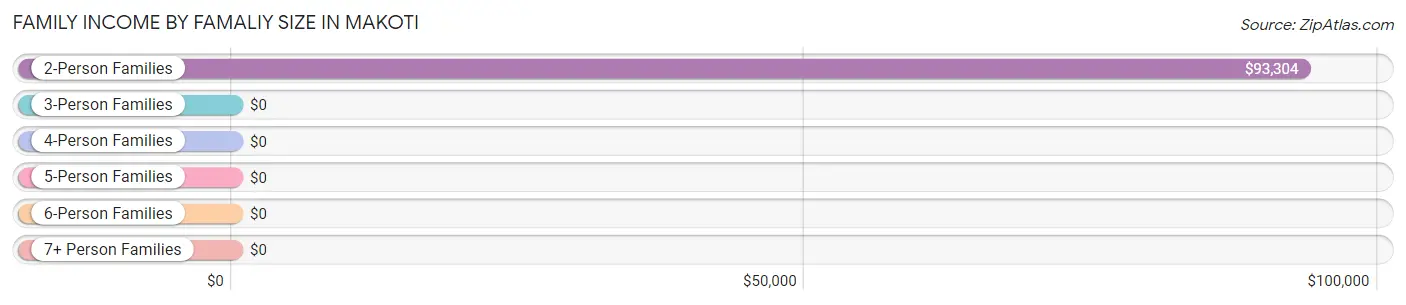
| Income Bracket | # Families | Median Income |
| 2-Person Families | 19 (79.2%) | $93,304 |
| 3-Person Families | 3 (12.5%) | $0 |
| 4-Person Families | 0 (0.0%) | $0 |
| 5-Person Families | 2 (8.3%) | $0 |
| 6-Person Families | 0 (0.0%) | $0 |
| 7+ Person Families | 0 (0.0%) | $0 |
| Total | 24 (100.0%) | $92,857 |
Family Income by Number of Earners in Makoti
| Number of Earners | # Families | Median Income |
| No Earners | 5 (20.8%) | $0 |
| 1 Earner | 13 (54.2%) | $0 |
| 2 Earners | 6 (25.0%) | $0 |
| 3+ Earners | 0 (0.0%) | $0 |
| Total | 24 (100.0%) | $92,857 |
Household Income in Makoti
Household Income Brackets in Makoti
With 18 households falling in the category, the $75,000 to $99,999 income range is the most frequent in Makoti, accounting for 37.5% of all households.
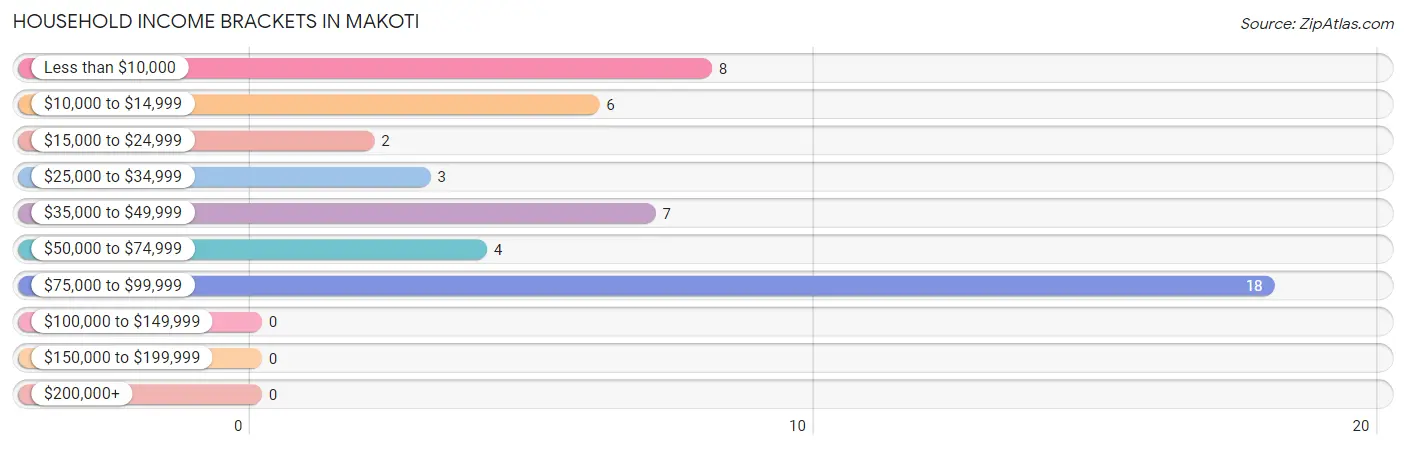
| Income Bracket | # Households | % Households |
| Less than $10,000 | 8 | 16.7% |
| $10,000 to $14,999 | 6 | 12.5% |
| $15,000 to $24,999 | 2 | 4.2% |
| $25,000 to $34,999 | 3 | 6.3% |
| $35,000 to $49,999 | 7 | 14.6% |
| $50,000 to $74,999 | 4 | 8.3% |
| $75,000 to $99,999 | 18 | 37.5% |
| $100,000 to $149,999 | 0 | 0.0% |
| $150,000 to $199,999 | 0 | 0.0% |
| $200,000+ | 0 | 0.0% |
Household Income by Householder Age in Makoti
The median household income in Makoti is $49,000, with the highest median household income of $93,393 found in the 45 to 64 years age bracket for the primary householder. A total of 18 households (37.5%) fall into this category.
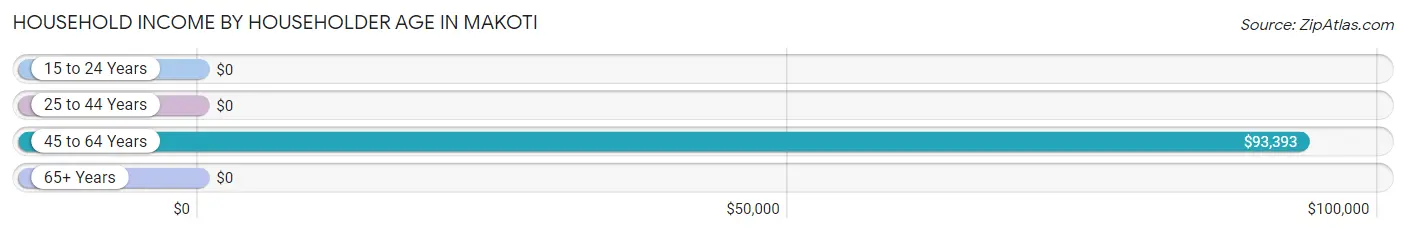
| Income Bracket | # Households | Median Income |
| 15 to 24 Years | 0 (0.0%) | $0 |
| 25 to 44 Years | 7 (14.6%) | $0 |
| 45 to 64 Years | 18 (37.5%) | $93,393 |
| 65+ Years | 23 (47.9%) | $0 |
| Total | 48 (100.0%) | $49,000 |
Poverty in Makoti
Income Below Poverty by Sex and Age in Makoti
With 11.8% poverty level for males and 22.9% for females among the residents of Makoti, 65 to 74 year old males and 75 year old and over females are the most vulnerable to poverty, with 6 males (46.2%) and 8 females (100.0%) in their respective age groups living below the poverty level.
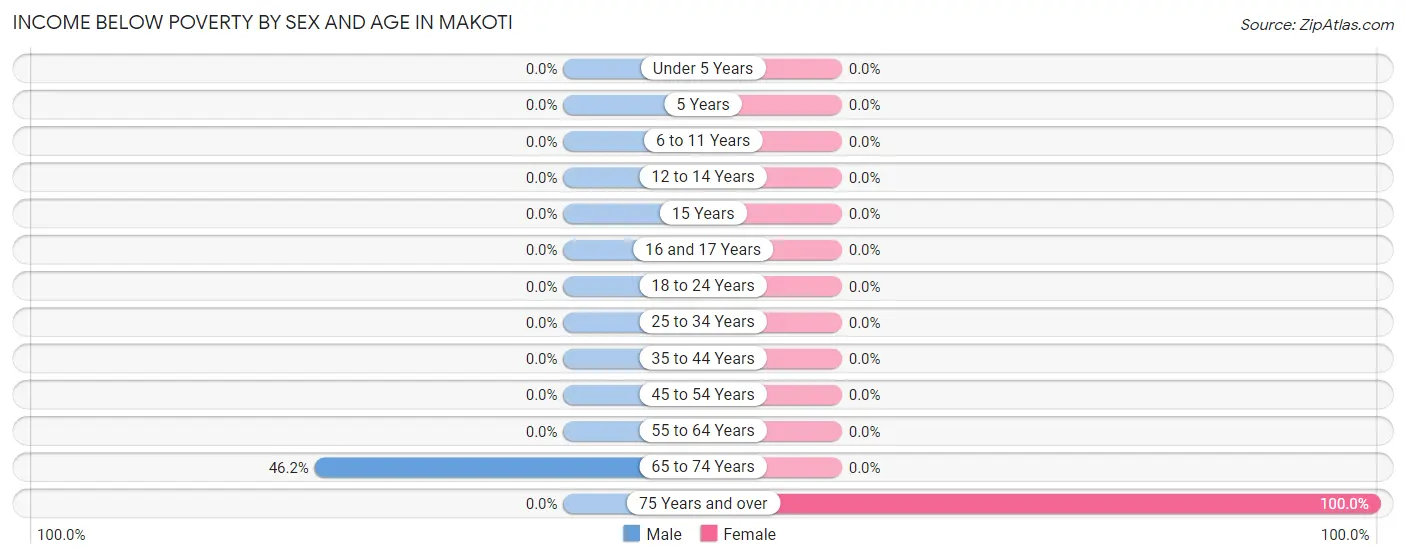
| Age Bracket | Male | Female |
| Under 5 Years | 0 (0.0%) | 0 (0.0%) |
| 5 Years | 0 (0.0%) | 0 (0.0%) |
| 6 to 11 Years | 0 (0.0%) | 0 (0.0%) |
| 12 to 14 Years | 0 (0.0%) | 0 (0.0%) |
| 15 Years | 0 (0.0%) | 0 (0.0%) |
| 16 and 17 Years | 0 (0.0%) | 0 (0.0%) |
| 18 to 24 Years | 0 (0.0%) | 0 (0.0%) |
| 25 to 34 Years | 0 (0.0%) | 0 (0.0%) |
| 35 to 44 Years | 0 (0.0%) | 0 (0.0%) |
| 45 to 54 Years | 0 (0.0%) | 0 (0.0%) |
| 55 to 64 Years | 0 (0.0%) | 0 (0.0%) |
| 65 to 74 Years | 6 (46.2%) | 0 (0.0%) |
| 75 Years and over | 0 (0.0%) | 8 (100.0%) |
| Total | 6 (11.8%) | 8 (22.9%) |
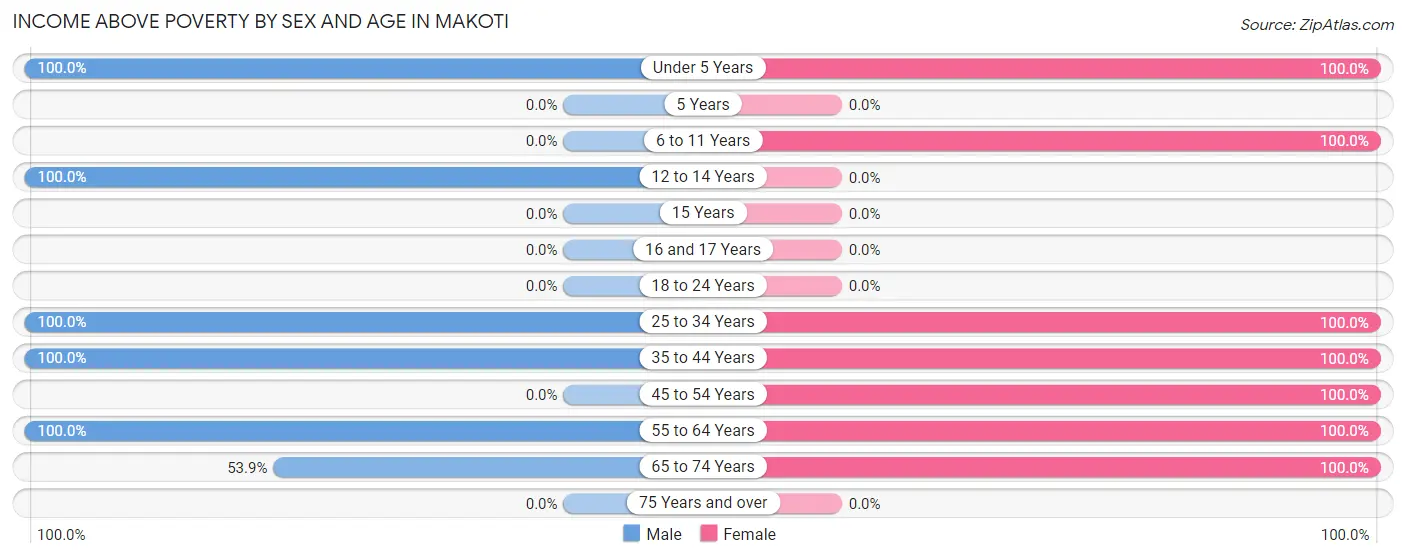
Income Above Poverty by Sex and Age in Makoti
According to the poverty statistics in Makoti, males aged under 5 years and females aged under 5 years are the age groups that are most secure financially, with 100.0% of males and 100.0% of females in these age groups living above the poverty line.
| Age Bracket | Male | Female |
| Under 5 Years | 6 (100.0%) | 1 (100.0%) |
| 5 Years | 0 (0.0%) | 0 (0.0%) |
| 6 to 11 Years | 0 (0.0%) | 5 (100.0%) |
| 12 to 14 Years | 1 (100.0%) | 0 (0.0%) |
| 15 Years | 0 (0.0%) | 0 (0.0%) |
| 16 and 17 Years | 0 (0.0%) | 0 (0.0%) |
| 18 to 24 Years | 0 (0.0%) | 0 (0.0%) |
| 25 to 34 Years | 15 (100.0%) | 4 (100.0%) |
| 35 to 44 Years | 2 (100.0%) | 2 (100.0%) |
| 45 to 54 Years | 0 (0.0%) | 4 (100.0%) |
| 55 to 64 Years | 14 (100.0%) | 4 (100.0%) |
| 65 to 74 Years | 7 (53.8%) | 7 (100.0%) |
| 75 Years and over | 0 (0.0%) | 0 (0.0%) |
| Total | 45 (88.2%) | 27 (77.1%) |
Income Below Poverty Among Married-Couple Families in Makoti
| Children | Above Poverty | Below Poverty |
| No Children | 9 (100.0%) | 0 (0.0%) |
| 1 or 2 Children | 0 (0.0%) | 0 (0.0%) |
| 3 or 4 Children | 2 (100.0%) | 0 (0.0%) |
| 5 or more Children | 0 (0.0%) | 0 (0.0%) |
| Total | 11 (100.0%) | 0 (0.0%) |
Income Below Poverty Among Single-Parent Households in Makoti
| Children | Single Father | Single Mother |
| No Children | 0 (0.0%) | 0 (0.0%) |
| 1 or 2 Children | 0 (0.0%) | 0 (0.0%) |
| 3 or 4 Children | 0 (0.0%) | 0 (0.0%) |
| 5 or more Children | 0 (0.0%) | 0 (0.0%) |
| Total | 0 (0.0%) | 0 (0.0%) |
Income Below Poverty Among Married-Couple vs Single-Parent Households in Makoti
| Children | Married-Couple Families | Single-Parent Households |
| No Children | 0 (0.0%) | 0 (0.0%) |
| 1 or 2 Children | 0 (0.0%) | 0 (0.0%) |
| 3 or 4 Children | 0 (0.0%) | 0 (0.0%) |
| 5 or more Children | 0 (0.0%) | 0 (0.0%) |
| Total | 0 (0.0%) | 0 (0.0%) |
Employment Characteristics in Makoti
Employment by Class of Employer in Makoti
Among the 33 employed individuals in Makoti, private company employees (29 | 87.9%), federal government employees (3 | 9.1%), and local government employees (1 | 3.0%) make up the most common classes of employment.
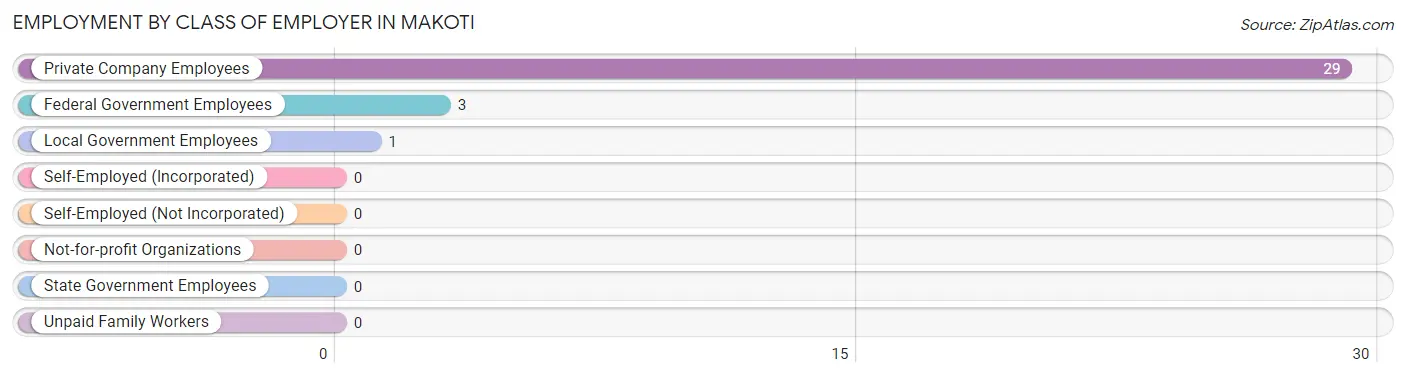
| Employer Class | # Employees | % Employees |
| Private Company Employees | 29 | 87.9% |
| Self-Employed (Incorporated) | 0 | 0.0% |
| Self-Employed (Not Incorporated) | 0 | 0.0% |
| Not-for-profit Organizations | 0 | 0.0% |
| Local Government Employees | 1 | 3.0% |
| State Government Employees | 0 | 0.0% |
| Federal Government Employees | 3 | 9.1% |
| Unpaid Family Workers | 0 | 0.0% |
| Total | 33 | 100.0% |
Employment Status by Age in Makoti
According to the labor force statistics for Makoti, out of the total population over 16 years of age (73), 47.9% or 35 individuals are in the labor force, with 5.7% or 2 of them unemployed. The age group with the highest labor force participation rate is 25 to 29 years, with 100.0% or 14 individuals in the labor force. Within the labor force, the 30 to 34 years age range has the highest percentage of unemployed individuals, with 40.0% or 2 of them being unemployed.
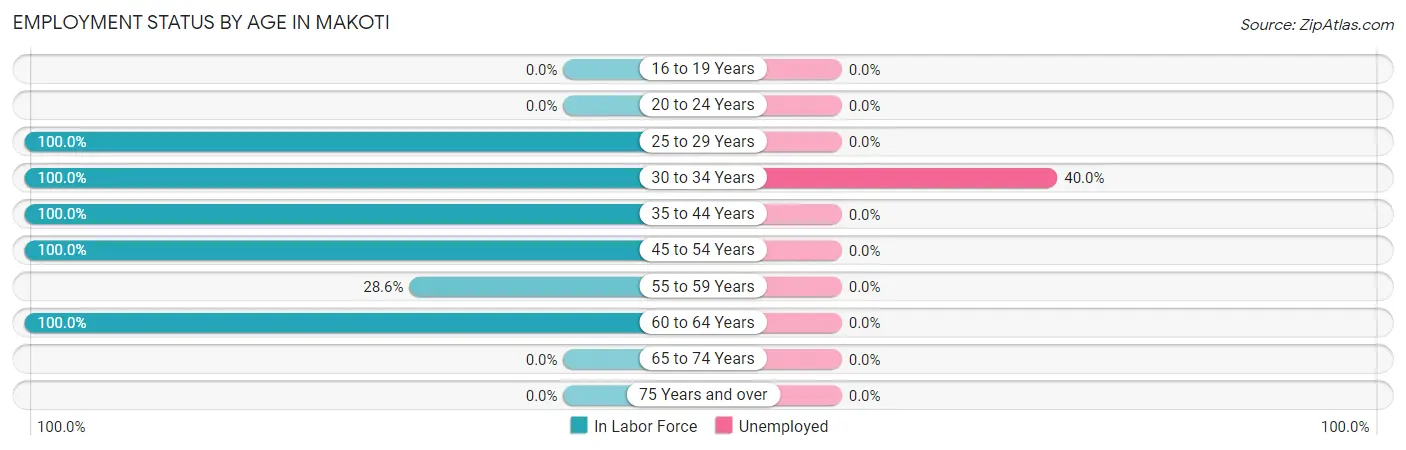
| Age Bracket | In Labor Force | Unemployed |
| 16 to 19 Years | 0 (0.0%) | 0 (0.0%) |
| 20 to 24 Years | 0 (0.0%) | 0 (0.0%) |
| 25 to 29 Years | 14 (100.0%) | 0 (0.0%) |
| 30 to 34 Years | 5 (100.0%) | 2 (40.0%) |
| 35 to 44 Years | 4 (100.0%) | 0 (0.0%) |
| 45 to 54 Years | 4 (100.0%) | 0 (0.0%) |
| 55 to 59 Years | 4 (28.6%) | 0 (0.0%) |
| 60 to 64 Years | 4 (100.0%) | 0 (0.0%) |
| 65 to 74 Years | 0 (0.0%) | 0 (0.0%) |
| 75 Years and over | 0 (0.0%) | 0 (0.0%) |
| Total | 35 (47.9%) | 2 (5.7%) |
Employment Status by Educational Attainment in Makoti
According to labor force statistics for Makoti, 77.8% of individuals (35) out of the total population between 25 and 64 years of age (45) are in the labor force, with 5.7% or 2 of them being unemployed. The group with the highest labor force participation rate are those with the educational attainment of less than high school, with 100.0% or 6 individuals in the labor force. Within the labor force, individuals with college / associate degree education have the highest percentage of unemployment, with 22.2% or 2 of them being unemployed.
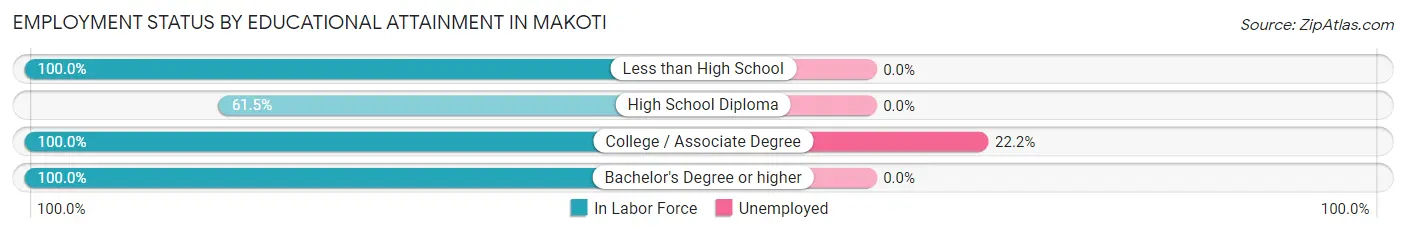
| Educational Attainment | In Labor Force | Unemployed |
| Less than High School | 6 (100.0%) | 0 (0.0%) |
| High School Diploma | 16 (61.5%) | 0 (0.0%) |
| College / Associate Degree | 9 (100.0%) | 2 (22.2%) |
| Bachelor's Degree or higher | 4 (100.0%) | 0 (0.0%) |
| Total | 35 (77.8%) | 3 (5.7%) |
Employment Occupations by Sex in Makoti
Management, Business, Science and Arts Occupations
Management, Business, Science and Arts Occupations by Sex
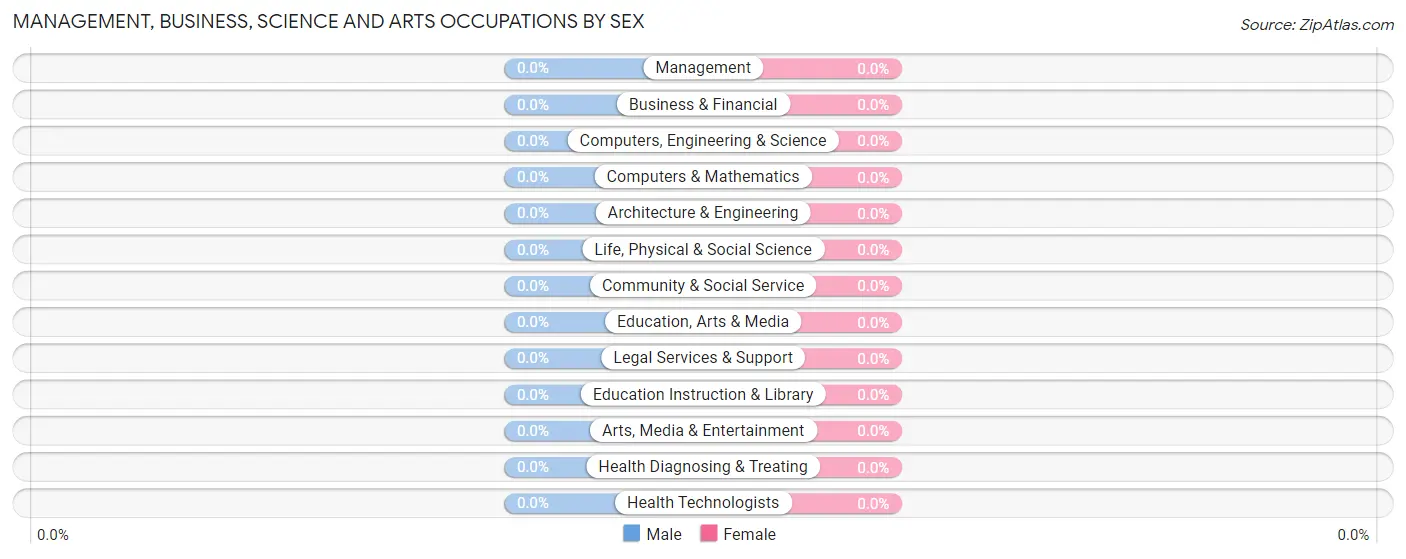
| Occupation | Male | Female |
| Management | 0 (0.0%) | 0 (0.0%) |
| Business & Financial | 0 (0.0%) | 0 (0.0%) |
| Computers, Engineering & Science | 0 (0.0%) | 0 (0.0%) |
| Computers & Mathematics | 0 (0.0%) | 0 (0.0%) |
| Architecture & Engineering | 0 (0.0%) | 0 (0.0%) |
| Life, Physical & Social Science | 0 (0.0%) | 0 (0.0%) |
| Community & Social Service | 0 (0.0%) | 0 (0.0%) |
| Education, Arts & Media | 0 (0.0%) | 0 (0.0%) |
| Legal Services & Support | 0 (0.0%) | 0 (0.0%) |
| Education Instruction & Library | 0 (0.0%) | 0 (0.0%) |
| Arts, Media & Entertainment | 0 (0.0%) | 0 (0.0%) |
| Health Diagnosing & Treating | 0 (0.0%) | 0 (0.0%) |
| Health Technologists | 0 (0.0%) | 0 (0.0%) |
| Total (Category) | 0 (0.0%) | 0 (0.0%) |
| Total (Overall) | 19 (57.6%) | 14 (42.4%) |
Services Occupations
The most common Services occupations in Makoti are , and Food Preparation & Serving (13 | 39.4%).
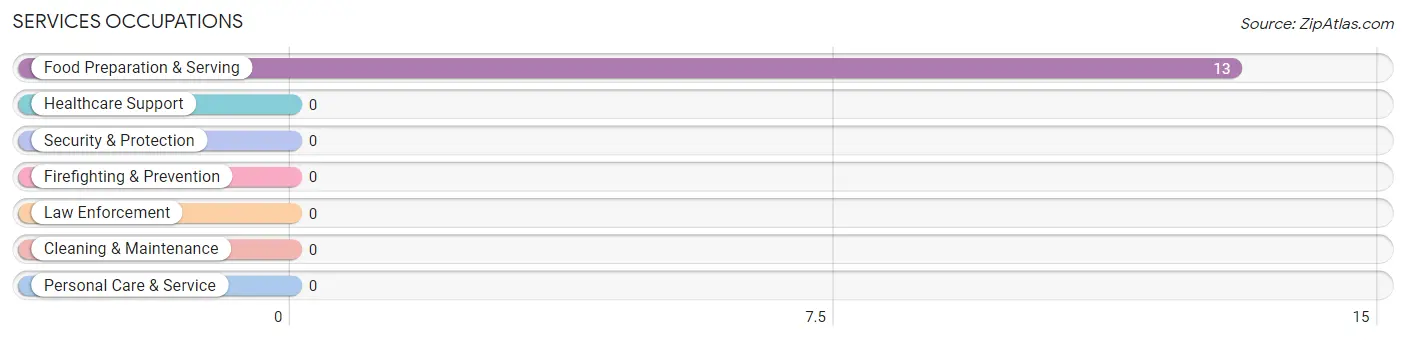
Services Occupations by Sex
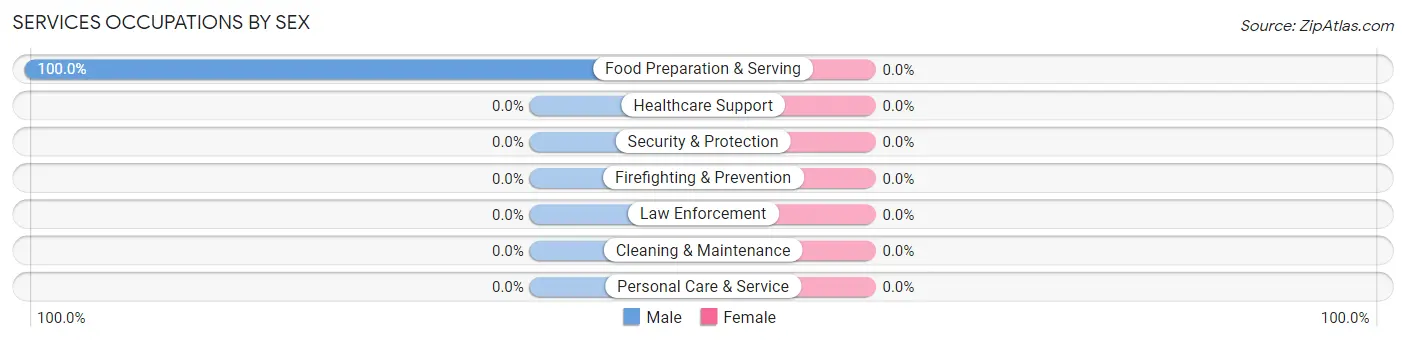
| Occupation | Male | Female |
| Healthcare Support | 0 (0.0%) | 0 (0.0%) |
| Security & Protection | 0 (0.0%) | 0 (0.0%) |
| Firefighting & Prevention | 0 (0.0%) | 0 (0.0%) |
| Law Enforcement | 0 (0.0%) | 0 (0.0%) |
| Food Preparation & Serving | 13 (100.0%) | 0 (0.0%) |
| Cleaning & Maintenance | 0 (0.0%) | 0 (0.0%) |
| Personal Care & Service | 0 (0.0%) | 0 (0.0%) |
| Total (Category) | 13 (100.0%) | 0 (0.0%) |
| Total (Overall) | 19 (57.6%) | 14 (42.4%) |
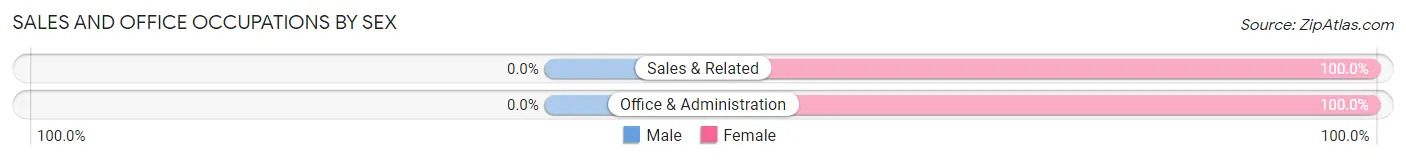
Sales and Office Occupations
The most common Sales and Office occupations in Makoti are Office & Administration (9 | 27.3%), and Sales & Related (4 | 12.1%).
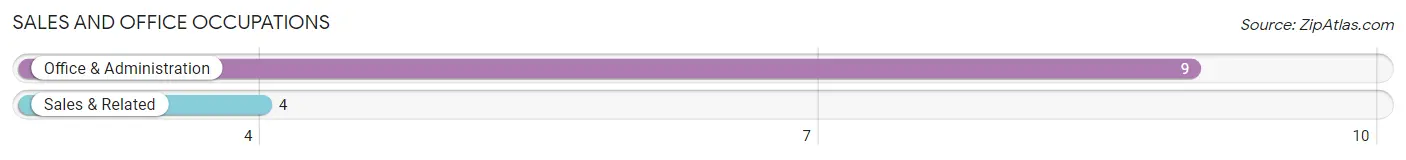
Sales and Office Occupations by Sex
| Occupation | Male | Female |
| Sales & Related | 0 (0.0%) | 4 (100.0%) |
| Office & Administration | 0 (0.0%) | 9 (100.0%) |
| Total (Category) | 0 (0.0%) | 13 (100.0%) |
| Total (Overall) | 19 (57.6%) | 14 (42.4%) |
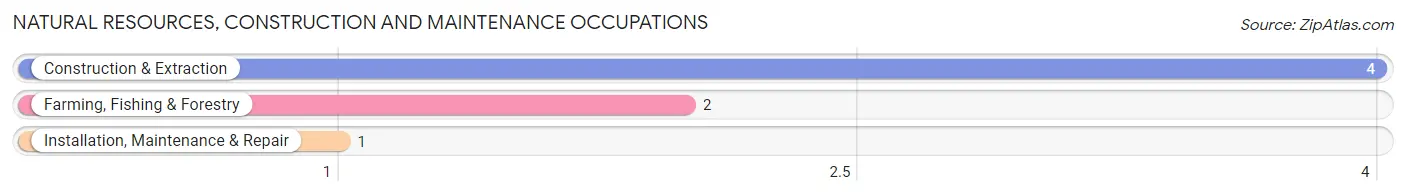
Natural Resources, Construction and Maintenance Occupations
The most common Natural Resources, Construction and Maintenance occupations in Makoti are Construction & Extraction (4 | 12.1%), Farming, Fishing & Forestry (2 | 6.1%), and Installation, Maintenance & Repair (1 | 3.0%).
Natural Resources, Construction and Maintenance Occupations by Sex
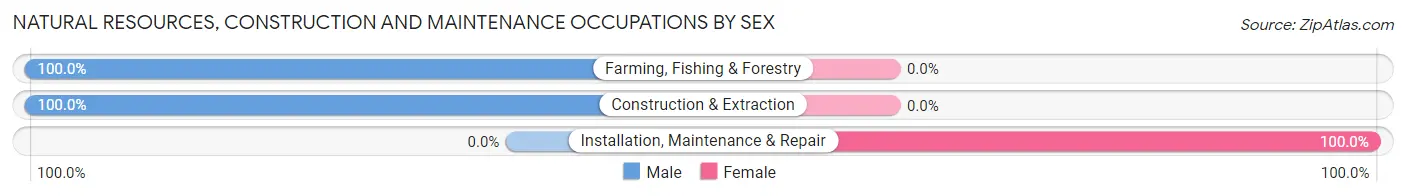
| Occupation | Male | Female |
| Farming, Fishing & Forestry | 2 (100.0%) | 0 (0.0%) |
| Construction & Extraction | 4 (100.0%) | 0 (0.0%) |
| Installation, Maintenance & Repair | 0 (0.0%) | 1 (100.0%) |
| Total (Category) | 6 (85.7%) | 1 (14.3%) |
| Total (Overall) | 19 (57.6%) | 14 (42.4%) |
Production, Transportation and Moving Occupations
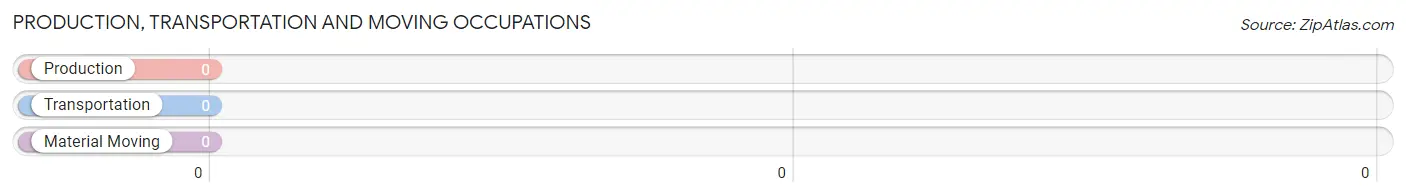
Production, Transportation and Moving Occupations by Sex
| Occupation | Male | Female |
| Production | 0 (0.0%) | 0 (0.0%) |
| Transportation | 0 (0.0%) | 0 (0.0%) |
| Material Moving | 0 (0.0%) | 0 (0.0%) |
| Total (Category) | 0 (0.0%) | 0 (0.0%) |
| Total (Overall) | 19 (57.6%) | 14 (42.4%) |
Employment Industries by Sex in Makoti
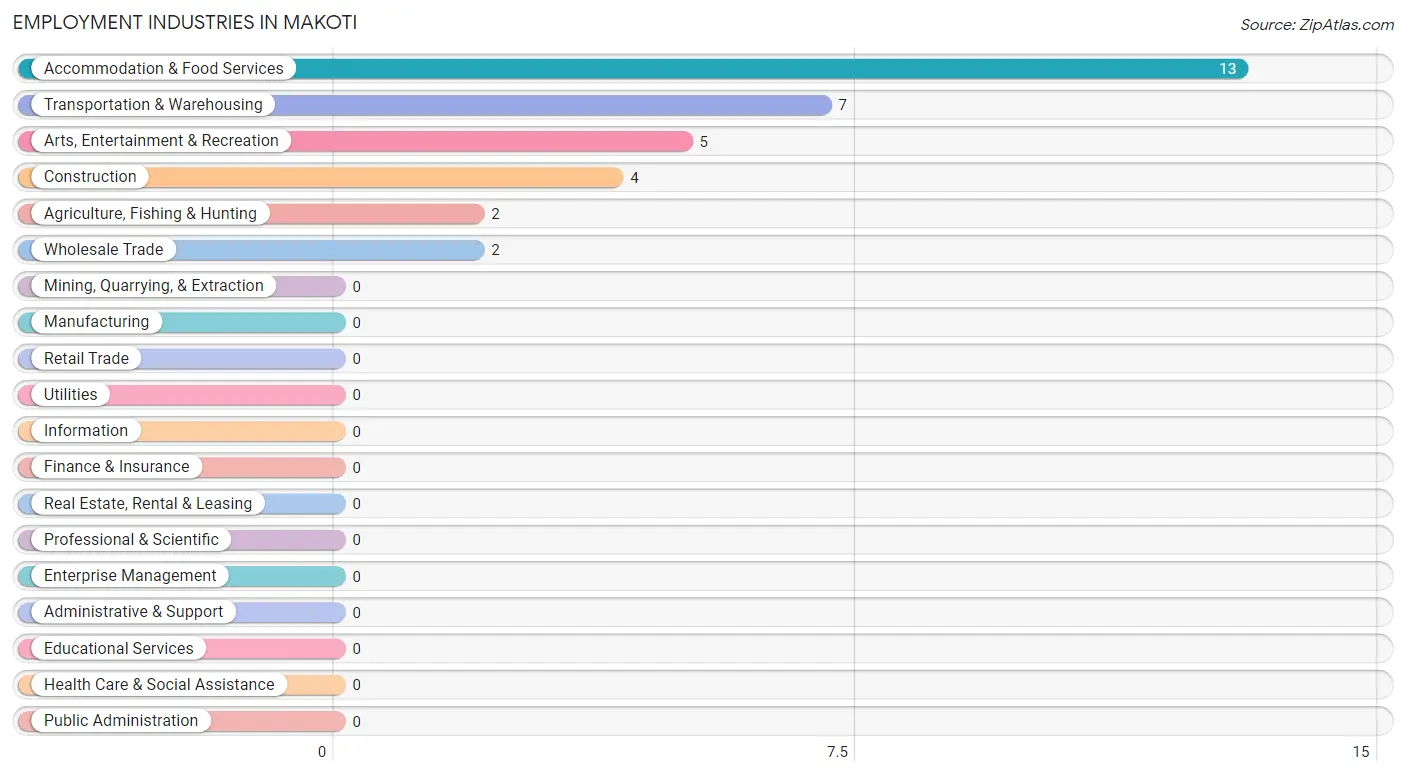
Employment Industries in Makoti
The major employment industries in Makoti include Accommodation & Food Services (13 | 39.4%), Transportation & Warehousing (7 | 21.2%), Arts, Entertainment & Recreation (5 | 15.1%), Construction (4 | 12.1%), and Agriculture, Fishing & Hunting (2 | 6.1%).
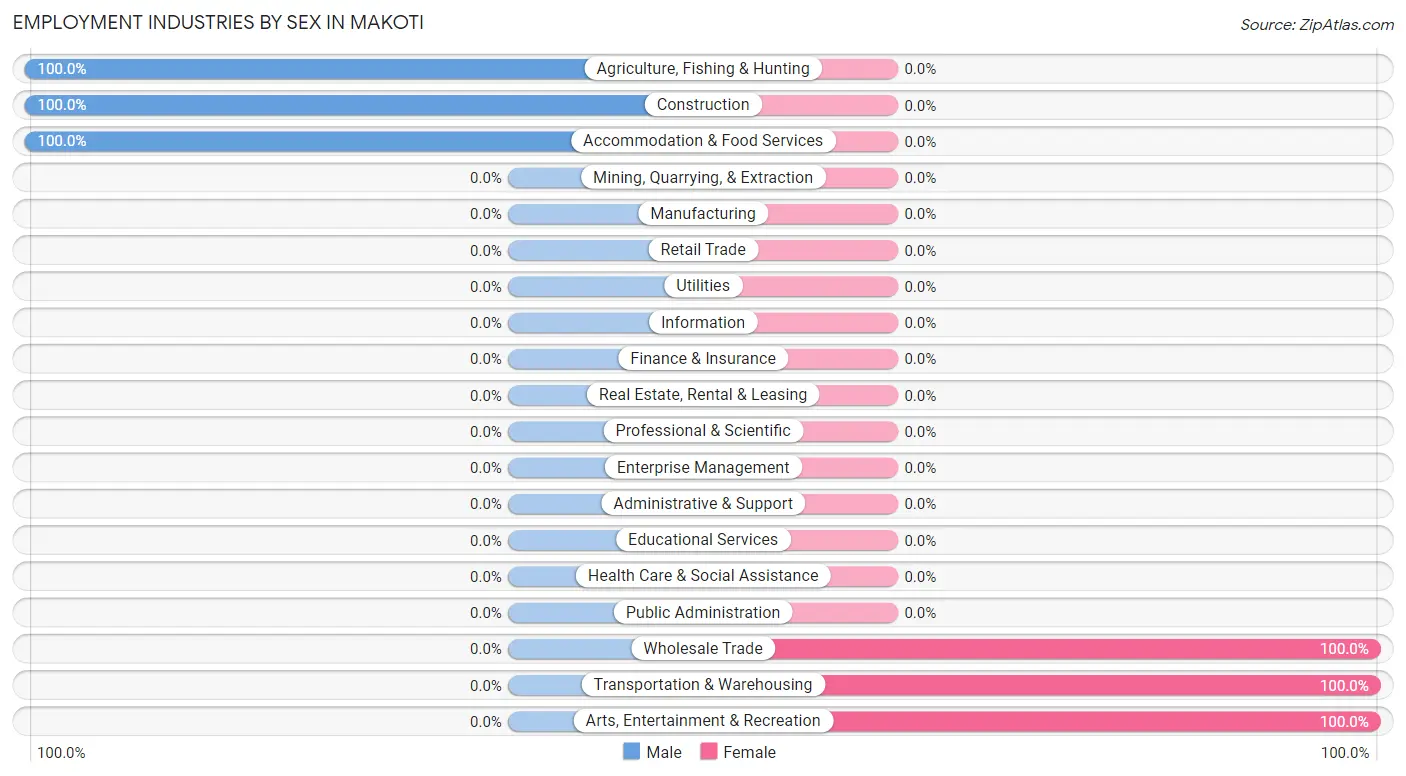
Employment Industries by Sex in Makoti
The Makoti industries that see more men than women are Agriculture, Fishing & Hunting (100.0%), Construction (100.0%), and Accommodation & Food Services (100.0%), whereas the industries that tend to have a higher number of women are Wholesale Trade (100.0%), Transportation & Warehousing (100.0%), and Arts, Entertainment & Recreation (100.0%).
| Industry | Male | Female |
| Agriculture, Fishing & Hunting | 2 (100.0%) | 0 (0.0%) |
| Mining, Quarrying, & Extraction | 0 (0.0%) | 0 (0.0%) |
| Construction | 4 (100.0%) | 0 (0.0%) |
| Manufacturing | 0 (0.0%) | 0 (0.0%) |
| Wholesale Trade | 0 (0.0%) | 2 (100.0%) |
| Retail Trade | 0 (0.0%) | 0 (0.0%) |
| Transportation & Warehousing | 0 (0.0%) | 7 (100.0%) |
| Utilities | 0 (0.0%) | 0 (0.0%) |
| Information | 0 (0.0%) | 0 (0.0%) |
| Finance & Insurance | 0 (0.0%) | 0 (0.0%) |
| Real Estate, Rental & Leasing | 0 (0.0%) | 0 (0.0%) |
| Professional & Scientific | 0 (0.0%) | 0 (0.0%) |
| Enterprise Management | 0 (0.0%) | 0 (0.0%) |
| Administrative & Support | 0 (0.0%) | 0 (0.0%) |
| Educational Services | 0 (0.0%) | 0 (0.0%) |
| Health Care & Social Assistance | 0 (0.0%) | 0 (0.0%) |
| Arts, Entertainment & Recreation | 0 (0.0%) | 5 (100.0%) |
| Accommodation & Food Services | 13 (100.0%) | 0 (0.0%) |
| Public Administration | 0 (0.0%) | 0 (0.0%) |
| Total | 19 (57.6%) | 14 (42.4%) |
Education in Makoti
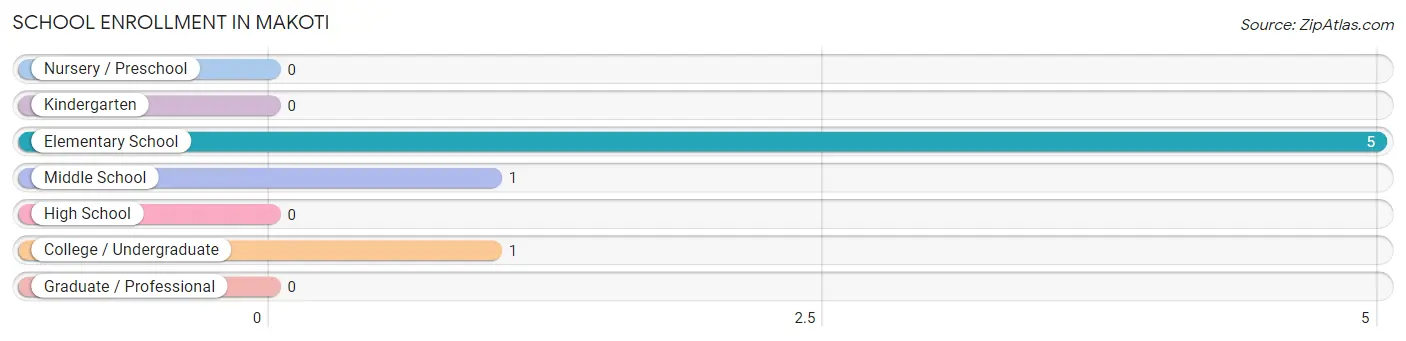
School Enrollment in Makoti
The most common levels of schooling among the 7 students in Makoti are elementary school (5 | 71.4%), middle school (1 | 14.3%), and college / undergraduate (1 | 14.3%).
| School Level | # Students | % Students |
| Nursery / Preschool | 0 | 0.0% |
| Kindergarten | 0 | 0.0% |
| Elementary School | 5 | 71.4% |
| Middle School | 1 | 14.3% |
| High School | 0 | 0.0% |
| College / Undergraduate | 1 | 14.3% |
| Graduate / Professional | 0 | 0.0% |
| Total | 7 | 100.0% |
School Enrollment by Age by Funding Source in Makoti
Out of a total of 7 students who are enrolled in schools in Makoti, 1 (14.3%) attend a private institution, while the remaining 6 (85.7%) are enrolled in public schools. The age group of 25 to 34 year olds has the highest likelihood of being enrolled in private schools, with 1 (100.0% in the age bracket) enrolled. Conversely, the age group of 5 to 9 year old has the lowest likelihood of being enrolled in a private school, with 5 (100.0% in the age bracket) attending a public institution.
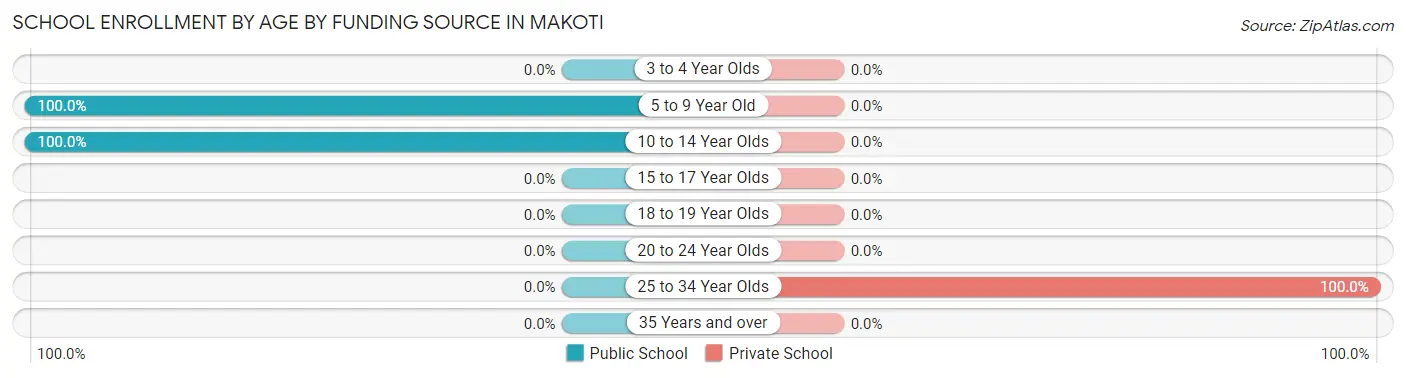
| Age Bracket | Public School | Private School |
| 3 to 4 Year Olds | 0 (0.0%) | 0 (0.0%) |
| 5 to 9 Year Old | 5 (100.0%) | 0 (0.0%) |
| 10 to 14 Year Olds | 1 (100.0%) | 0 (0.0%) |
| 15 to 17 Year Olds | 0 (0.0%) | 0 (0.0%) |
| 18 to 19 Year Olds | 0 (0.0%) | 0 (0.0%) |
| 20 to 24 Year Olds | 0 (0.0%) | 0 (0.0%) |
| 25 to 34 Year Olds | 0 (0.0%) | 1 (100.0%) |
| 35 Years and over | 0 (0.0%) | 0 (0.0%) |
| Total | 6 (85.7%) | 1 (14.3%) |
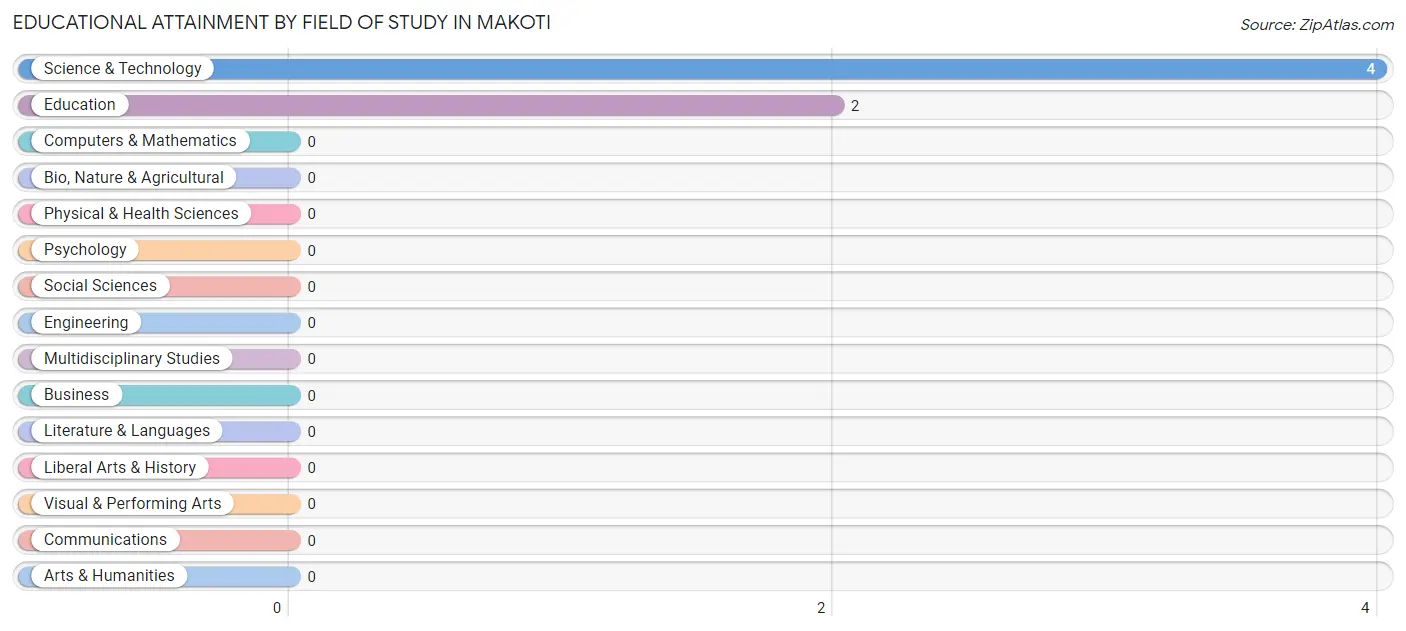
Educational Attainment by Field of Study in Makoti
Science & technology (4 | 66.7%), and education (2 | 33.3%) are the most common fields of study among 6 individuals in Makoti who have obtained a bachelor's degree or higher.
| Field of Study | # Graduates | % Graduates |
| Computers & Mathematics | 0 | 0.0% |
| Bio, Nature & Agricultural | 0 | 0.0% |
| Physical & Health Sciences | 0 | 0.0% |
| Psychology | 0 | 0.0% |
| Social Sciences | 0 | 0.0% |
| Engineering | 0 | 0.0% |
| Multidisciplinary Studies | 0 | 0.0% |
| Science & Technology | 4 | 66.7% |
| Business | 0 | 0.0% |
| Education | 2 | 33.3% |
| Literature & Languages | 0 | 0.0% |
| Liberal Arts & History | 0 | 0.0% |
| Visual & Performing Arts | 0 | 0.0% |
| Communications | 0 | 0.0% |
| Arts & Humanities | 0 | 0.0% |
| Total | 6 | 100.0% |
Transportation & Commute in Makoti
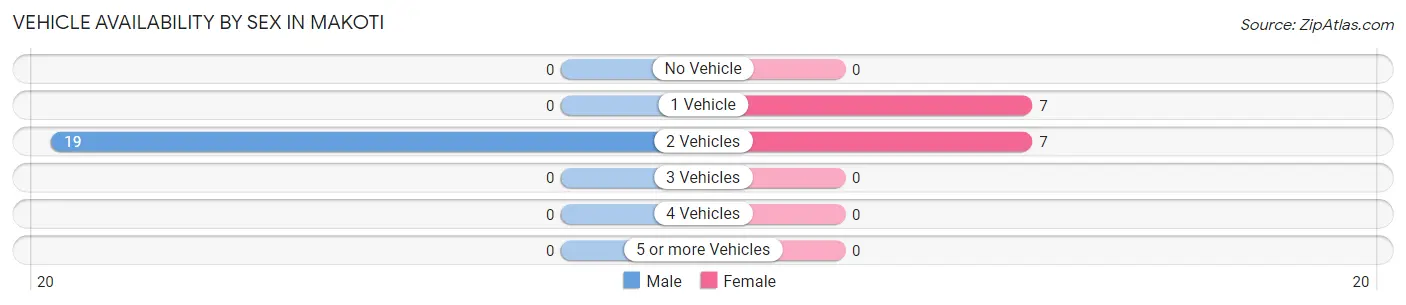
Vehicle Availability by Sex in Makoti
The most prevalent vehicle ownership categories in Makoti are males with 2 vehicles (19, accounting for 100.0%) and females with 2 vehicles (7, making up 135.7%).
| Vehicles Available | Male | Female |
| No Vehicle | 0 (0.0%) | 0 (0.0%) |
| 1 Vehicle | 0 (0.0%) | 7 (50.0%) |
| 2 Vehicles | 19 (100.0%) | 7 (50.0%) |
| 3 Vehicles | 0 (0.0%) | 0 (0.0%) |
| 4 Vehicles | 0 (0.0%) | 0 (0.0%) |
| 5 or more Vehicles | 0 (0.0%) | 0 (0.0%) |
| Total | 19 (100.0%) | 14 (100.0%) |
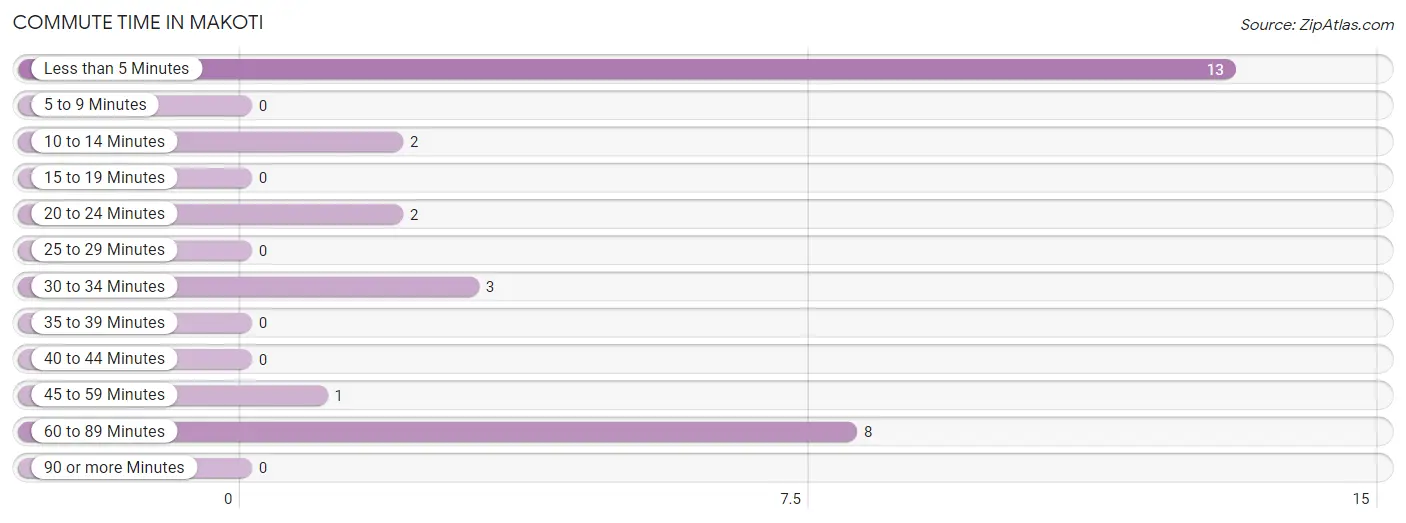
Commute Time in Makoti
The most frequently occuring commute durations in Makoti are less than 5 minutes (13 commuters, 44.8%), 60 to 89 minutes (8 commuters, 27.6%), and 30 to 34 minutes (3 commuters, 10.3%).
| Commute Time | # Commuters | % Commuters |
| Less than 5 Minutes | 13 | 44.8% |
| 5 to 9 Minutes | 0 | 0.0% |
| 10 to 14 Minutes | 2 | 6.9% |
| 15 to 19 Minutes | 0 | 0.0% |
| 20 to 24 Minutes | 2 | 6.9% |
| 25 to 29 Minutes | 0 | 0.0% |
| 30 to 34 Minutes | 3 | 10.3% |
| 35 to 39 Minutes | 0 | 0.0% |
| 40 to 44 Minutes | 0 | 0.0% |
| 45 to 59 Minutes | 1 | 3.5% |
| 60 to 89 Minutes | 8 | 27.6% |
| 90 or more Minutes | 0 | 0.0% |
Commute Time by Sex in Makoti
The most common commute times in Makoti are less than 5 minutes (13 commuters, 68.4%) for males and 60 to 89 minutes (4 commuters, 40.0%) for females.
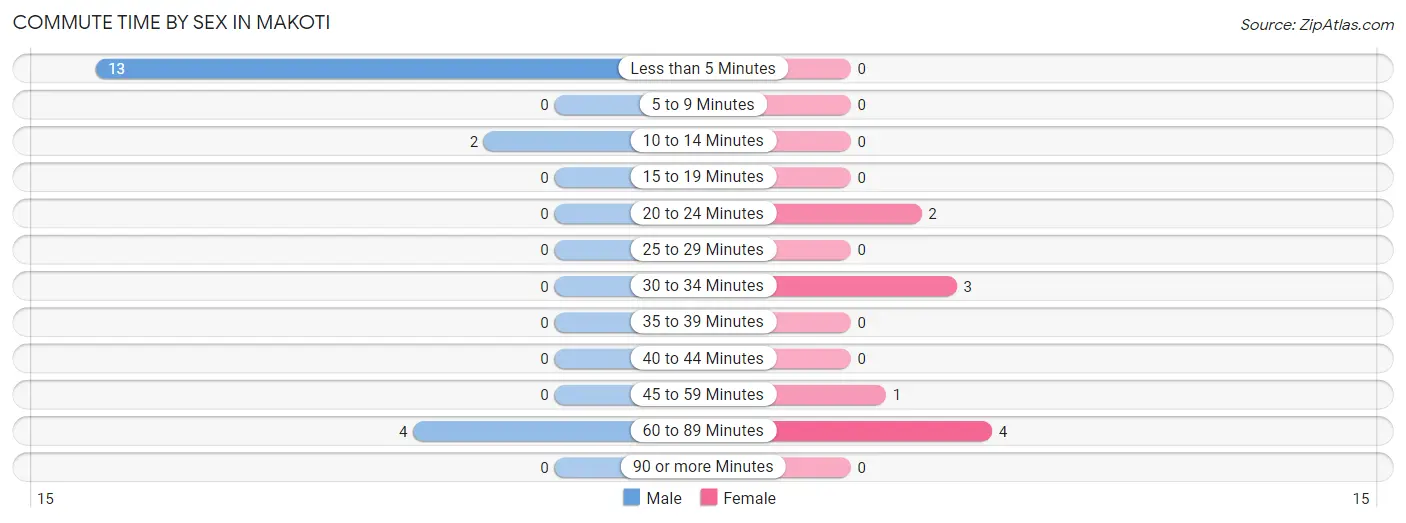
| Commute Time | Male | Female |
| Less than 5 Minutes | 13 (68.4%) | 0 (0.0%) |
| 5 to 9 Minutes | 0 (0.0%) | 0 (0.0%) |
| 10 to 14 Minutes | 2 (10.5%) | 0 (0.0%) |
| 15 to 19 Minutes | 0 (0.0%) | 0 (0.0%) |
| 20 to 24 Minutes | 0 (0.0%) | 2 (20.0%) |
| 25 to 29 Minutes | 0 (0.0%) | 0 (0.0%) |
| 30 to 34 Minutes | 0 (0.0%) | 3 (30.0%) |
| 35 to 39 Minutes | 0 (0.0%) | 0 (0.0%) |
| 40 to 44 Minutes | 0 (0.0%) | 0 (0.0%) |
| 45 to 59 Minutes | 0 (0.0%) | 1 (10.0%) |
| 60 to 89 Minutes | 4 (21.0%) | 4 (40.0%) |
| 90 or more Minutes | 0 (0.0%) | 0 (0.0%) |
Time of Departure to Work by Sex in Makoti
The most frequent times of departure to work in Makoti are 7:00 AM to 7:29 AM (13, 68.4%) for males and 6:30 AM to 6:59 AM (4, 40.0%) for females.
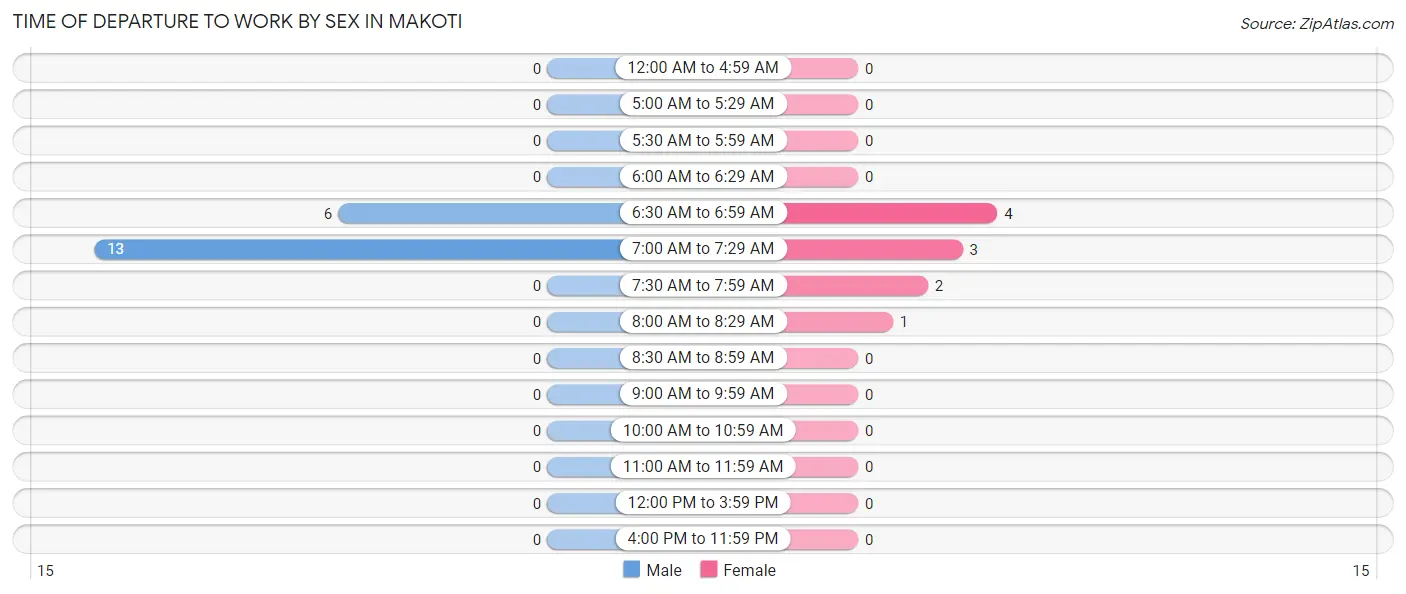
| Time of Departure | Male | Female |
| 12:00 AM to 4:59 AM | 0 (0.0%) | 0 (0.0%) |
| 5:00 AM to 5:29 AM | 0 (0.0%) | 0 (0.0%) |
| 5:30 AM to 5:59 AM | 0 (0.0%) | 0 (0.0%) |
| 6:00 AM to 6:29 AM | 0 (0.0%) | 0 (0.0%) |
| 6:30 AM to 6:59 AM | 6 (31.6%) | 4 (40.0%) |
| 7:00 AM to 7:29 AM | 13 (68.4%) | 3 (30.0%) |
| 7:30 AM to 7:59 AM | 0 (0.0%) | 2 (20.0%) |
| 8:00 AM to 8:29 AM | 0 (0.0%) | 1 (10.0%) |
| 8:30 AM to 8:59 AM | 0 (0.0%) | 0 (0.0%) |
| 9:00 AM to 9:59 AM | 0 (0.0%) | 0 (0.0%) |
| 10:00 AM to 10:59 AM | 0 (0.0%) | 0 (0.0%) |
| 11:00 AM to 11:59 AM | 0 (0.0%) | 0 (0.0%) |
| 12:00 PM to 3:59 PM | 0 (0.0%) | 0 (0.0%) |
| 4:00 PM to 11:59 PM | 0 (0.0%) | 0 (0.0%) |
| Total | 19 (100.0%) | 10 (100.0%) |
Housing Occupancy in Makoti
Occupancy by Ownership in Makoti
Of the total 48 dwellings in Makoti, owner-occupied units account for 42 (87.5%), while renter-occupied units make up 6 (12.5%).
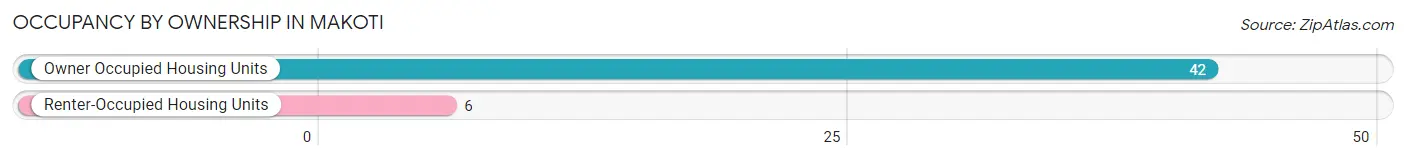
| Occupancy | # Housing Units | % Housing Units |
| Owner Occupied Housing Units | 42 | 87.5% |
| Renter-Occupied Housing Units | 6 | 12.5% |
| Total Occupied Housing Units | 48 | 100.0% |
Occupancy by Household Size in Makoti
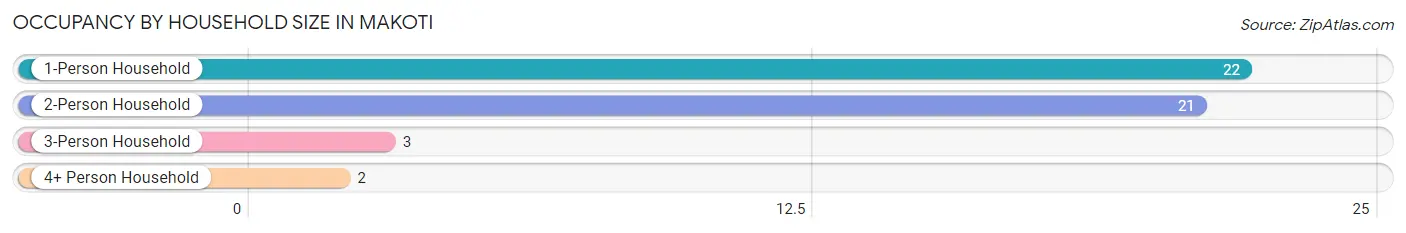
| Household Size | # Housing Units | % Housing Units |
| 1-Person Household | 22 | 45.8% |
| 2-Person Household | 21 | 43.8% |
| 3-Person Household | 3 | 6.2% |
| 4+ Person Household | 2 | 4.2% |
| Total Housing Units | 48 | 100.0% |
Occupancy by Ownership by Household Size in Makoti
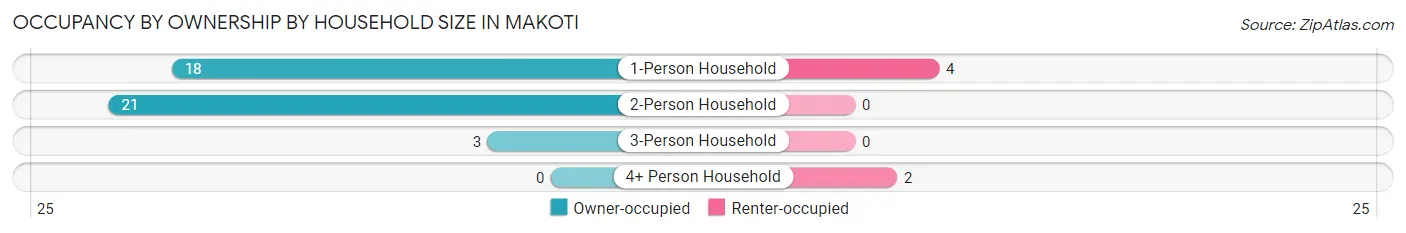
| Household Size | Owner-occupied | Renter-occupied |
| 1-Person Household | 18 (81.8%) | 4 (18.2%) |
| 2-Person Household | 21 (100.0%) | 0 (0.0%) |
| 3-Person Household | 3 (100.0%) | 0 (0.0%) |
| 4+ Person Household | 0 (0.0%) | 2 (100.0%) |
| Total Housing Units | 42 (87.5%) | 6 (12.5%) |
Occupancy by Educational Attainment in Makoti
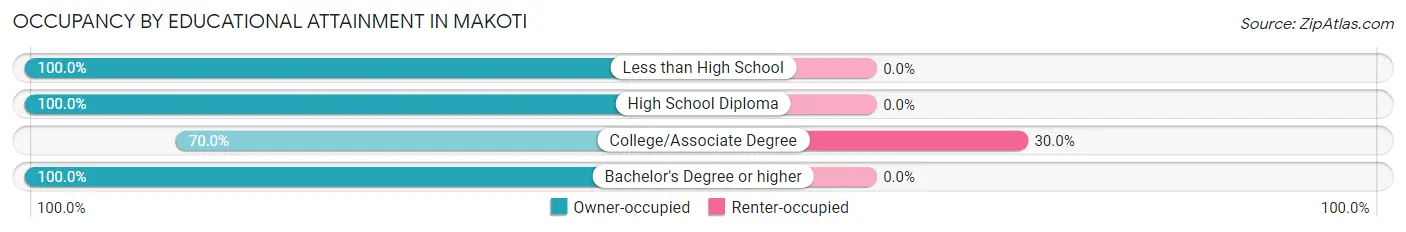
| Household Size | Owner-occupied | Renter-occupied |
| Less than High School | 4 (100.0%) | 0 (0.0%) |
| High School Diploma | 22 (100.0%) | 0 (0.0%) |
| College/Associate Degree | 14 (70.0%) | 6 (30.0%) |
| Bachelor's Degree or higher | 2 (100.0%) | 0 (0.0%) |
Occupancy by Age of Householder in Makoti
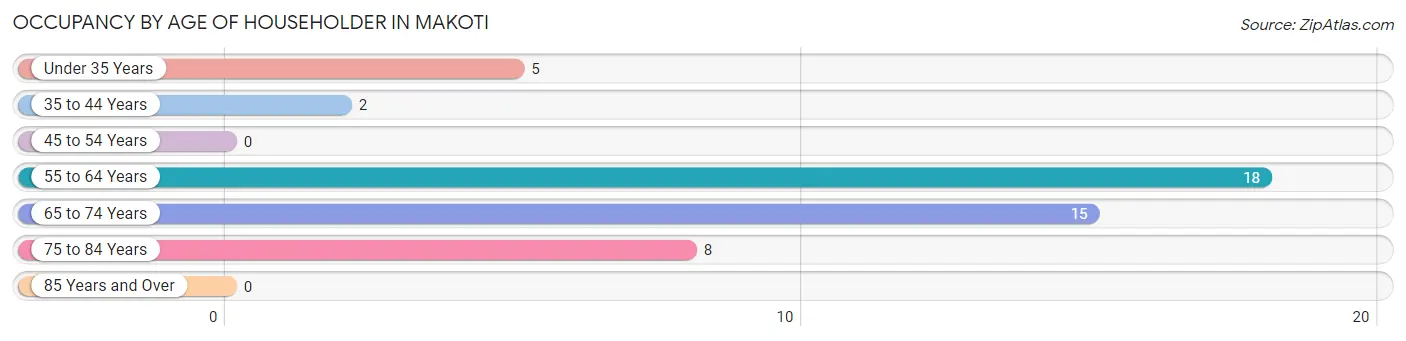
| Age Bracket | # Households | % Households |
| Under 35 Years | 5 | 10.4% |
| 35 to 44 Years | 2 | 4.2% |
| 45 to 54 Years | 0 | 0.0% |
| 55 to 64 Years | 18 | 37.5% |
| 65 to 74 Years | 15 | 31.2% |
| 75 to 84 Years | 8 | 16.7% |
| 85 Years and Over | 0 | 0.0% |
| Total | 48 | 100.0% |
Housing Finances in Makoti
Median Income by Occupancy in Makoti
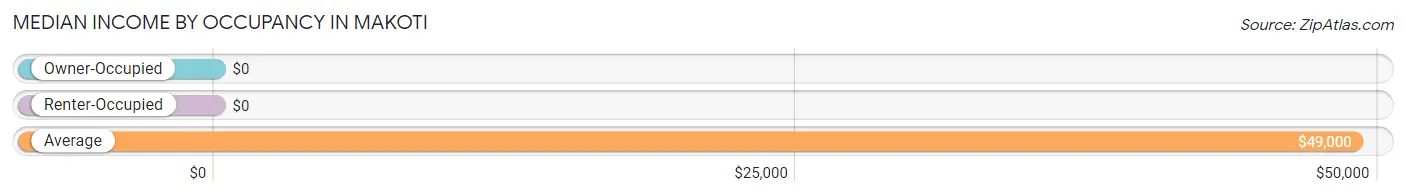
| Occupancy Type | # Households | Median Income |
| Owner-Occupied | 42 (87.5%) | $0 |
| Renter-Occupied | 6 (12.5%) | $0 |
| Average | 48 (100.0%) | $49,000 |
Occupancy by Householder Income Bracket in Makoti
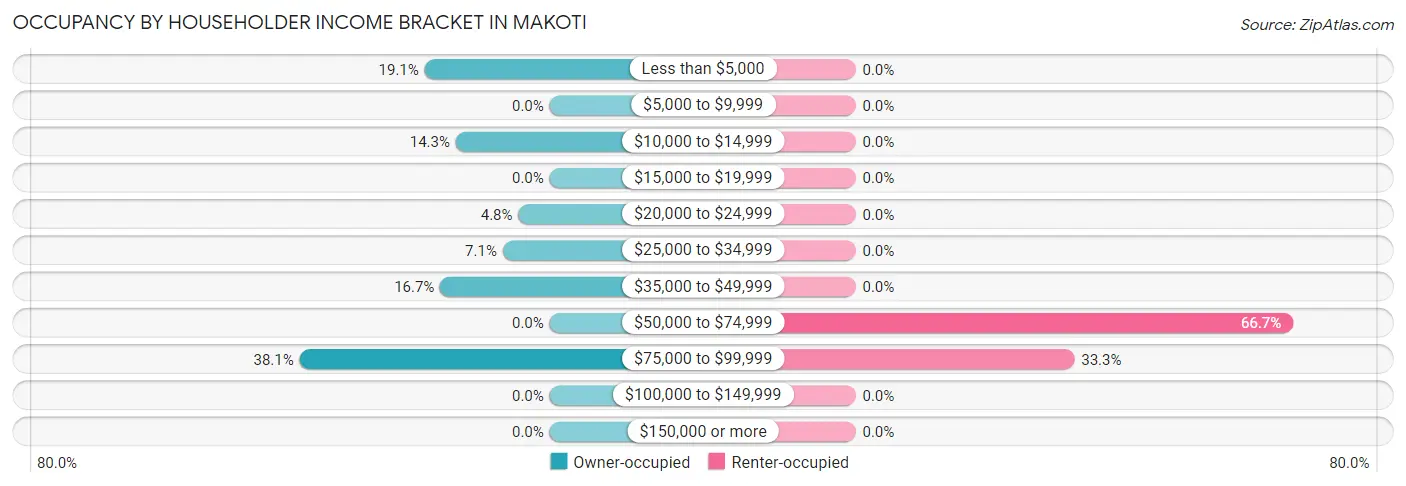
| Income Bracket | Owner-occupied | Renter-occupied |
| Less than $5,000 | 8 (19.1%) | 0 (0.0%) |
| $5,000 to $9,999 | 0 (0.0%) | 0 (0.0%) |
| $10,000 to $14,999 | 6 (14.3%) | 0 (0.0%) |
| $15,000 to $19,999 | 0 (0.0%) | 0 (0.0%) |
| $20,000 to $24,999 | 2 (4.8%) | 0 (0.0%) |
| $25,000 to $34,999 | 3 (7.1%) | 0 (0.0%) |
| $35,000 to $49,999 | 7 (16.7%) | 0 (0.0%) |
| $50,000 to $74,999 | 0 (0.0%) | 4 (66.7%) |
| $75,000 to $99,999 | 16 (38.1%) | 2 (33.3%) |
| $100,000 to $149,999 | 0 (0.0%) | 0 (0.0%) |
| $150,000 or more | 0 (0.0%) | 0 (0.0%) |
| Total | 42 (100.0%) | 6 (100.0%) |
Monthly Housing Cost Tiers in Makoti
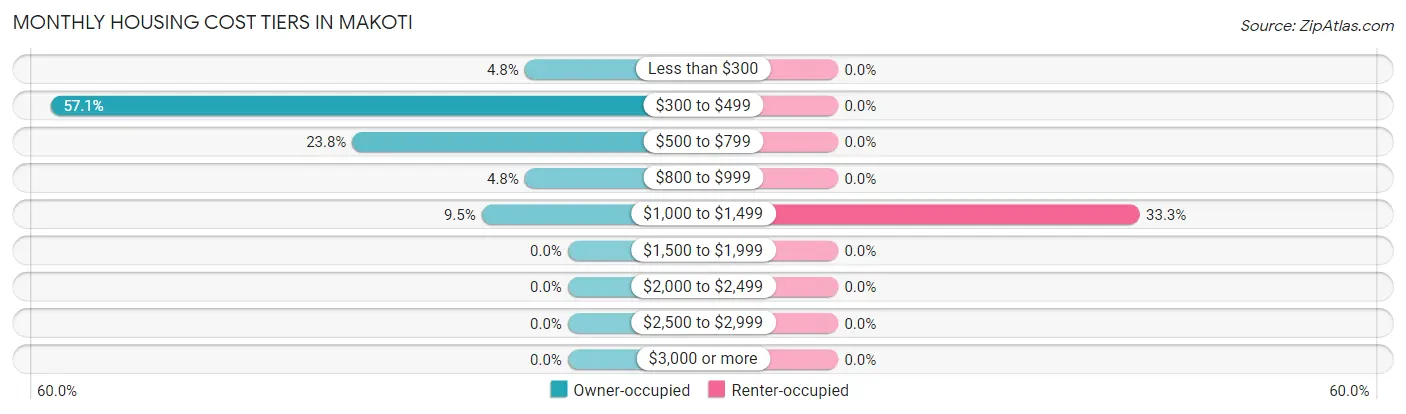
| Monthly Cost | Owner-occupied | Renter-occupied |
| Less than $300 | 2 (4.8%) | 0 (0.0%) |
| $300 to $499 | 24 (57.1%) | 0 (0.0%) |
| $500 to $799 | 10 (23.8%) | 0 (0.0%) |
| $800 to $999 | 2 (4.8%) | 0 (0.0%) |
| $1,000 to $1,499 | 4 (9.5%) | 2 (33.3%) |
| $1,500 to $1,999 | 0 (0.0%) | 0 (0.0%) |
| $2,000 to $2,499 | 0 (0.0%) | 0 (0.0%) |
| $2,500 to $2,999 | 0 (0.0%) | 0 (0.0%) |
| $3,000 or more | 0 (0.0%) | 0 (0.0%) |
| Total | 42 (100.0%) | 6 (100.0%) |
Physical Housing Characteristics in Makoti
Housing Structures in Makoti
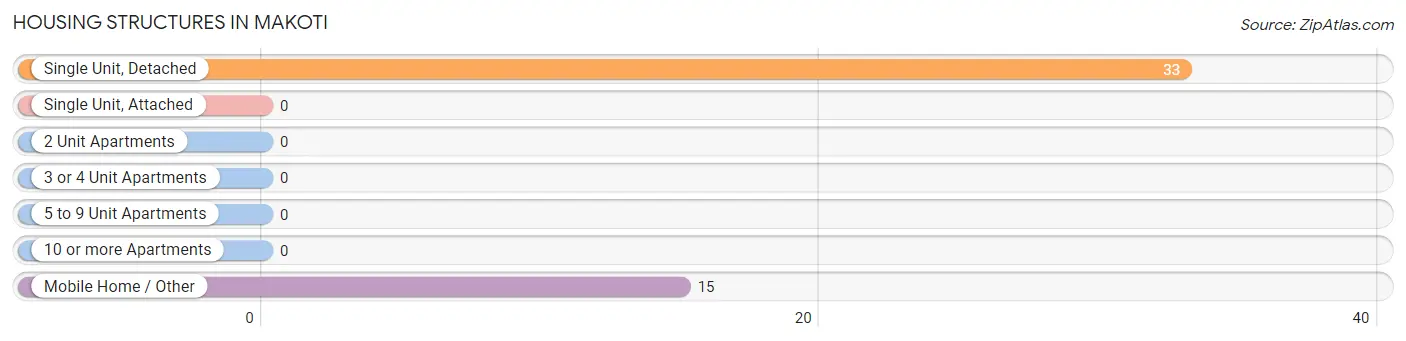
| Structure Type | # Housing Units | % Housing Units |
| Single Unit, Detached | 33 | 68.8% |
| Single Unit, Attached | 0 | 0.0% |
| 2 Unit Apartments | 0 | 0.0% |
| 3 or 4 Unit Apartments | 0 | 0.0% |
| 5 to 9 Unit Apartments | 0 | 0.0% |
| 10 or more Apartments | 0 | 0.0% |
| Mobile Home / Other | 15 | 31.2% |
| Total | 48 | 100.0% |
Housing Structures by Occupancy in Makoti
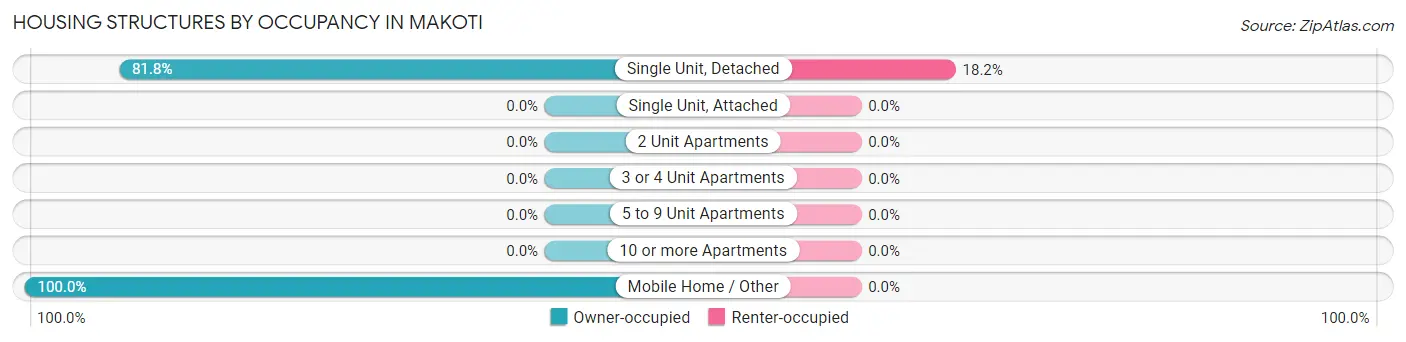
| Structure Type | Owner-occupied | Renter-occupied |
| Single Unit, Detached | 27 (81.8%) | 6 (18.2%) |
| Single Unit, Attached | 0 (0.0%) | 0 (0.0%) |
| 2 Unit Apartments | 0 (0.0%) | 0 (0.0%) |
| 3 or 4 Unit Apartments | 0 (0.0%) | 0 (0.0%) |
| 5 to 9 Unit Apartments | 0 (0.0%) | 0 (0.0%) |
| 10 or more Apartments | 0 (0.0%) | 0 (0.0%) |
| Mobile Home / Other | 15 (100.0%) | 0 (0.0%) |
| Total | 42 (87.5%) | 6 (12.5%) |
Housing Structures by Number of Rooms in Makoti
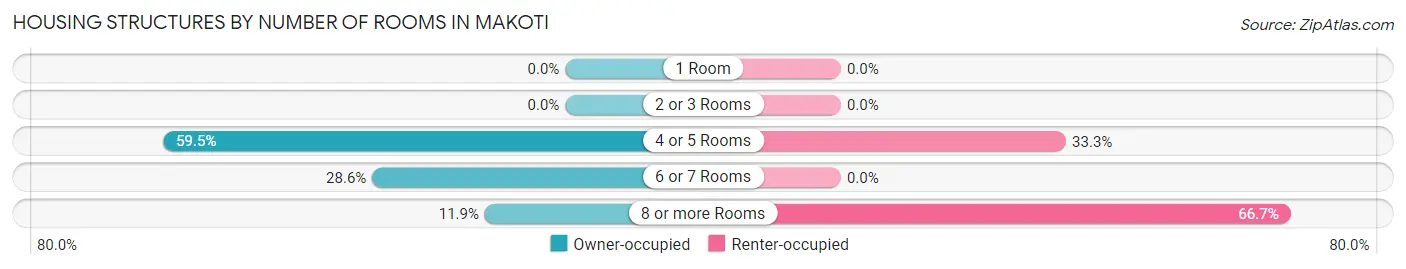
| Number of Rooms | Owner-occupied | Renter-occupied |
| 1 Room | 0 (0.0%) | 0 (0.0%) |
| 2 or 3 Rooms | 0 (0.0%) | 0 (0.0%) |
| 4 or 5 Rooms | 25 (59.5%) | 2 (33.3%) |
| 6 or 7 Rooms | 12 (28.6%) | 0 (0.0%) |
| 8 or more Rooms | 5 (11.9%) | 4 (66.7%) |
| Total | 42 (100.0%) | 6 (100.0%) |
Housing Structure by Heating Type in Makoti
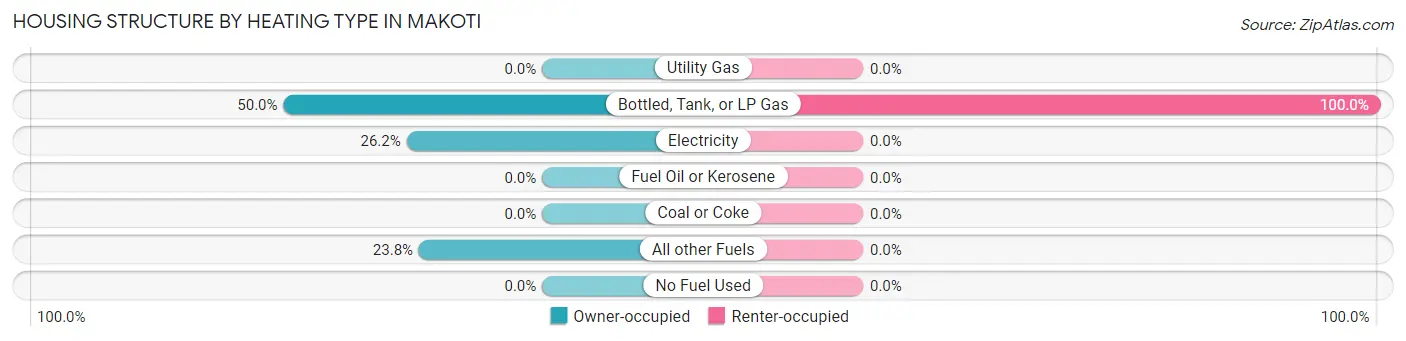
| Heating Type | Owner-occupied | Renter-occupied |
| Utility Gas | 0 (0.0%) | 0 (0.0%) |
| Bottled, Tank, or LP Gas | 21 (50.0%) | 6 (100.0%) |
| Electricity | 11 (26.2%) | 0 (0.0%) |
| Fuel Oil or Kerosene | 0 (0.0%) | 0 (0.0%) |
| Coal or Coke | 0 (0.0%) | 0 (0.0%) |
| All other Fuels | 10 (23.8%) | 0 (0.0%) |
| No Fuel Used | 0 (0.0%) | 0 (0.0%) |
| Total | 42 (100.0%) | 6 (100.0%) |
Household Vehicle Usage in Makoti
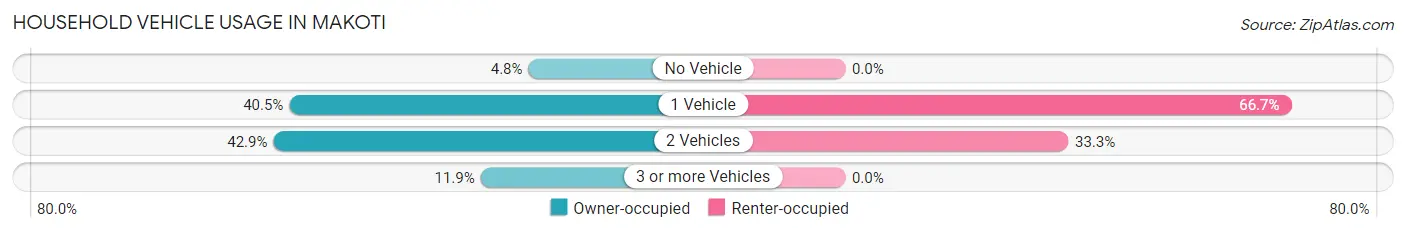
| Vehicles per Household | Owner-occupied | Renter-occupied |
| No Vehicle | 2 (4.8%) | 0 (0.0%) |
| 1 Vehicle | 17 (40.5%) | 4 (66.7%) |
| 2 Vehicles | 18 (42.9%) | 2 (33.3%) |
| 3 or more Vehicles | 5 (11.9%) | 0 (0.0%) |
| Total | 42 (100.0%) | 6 (100.0%) |
Real Estate & Mortgages in Makoti
Real Estate and Mortgage Overview in Makoti
| Characteristic | Without Mortgage | With Mortgage |
| Housing Units | 38 | 4 |
| Median Property Value | $83,600 | $0 |
| Median Household Income | - | - |
| Monthly Housing Costs | $456 | $0 |
| Real Estate Taxes | $1,063 | $0 |
Property Value by Mortgage Status in Makoti
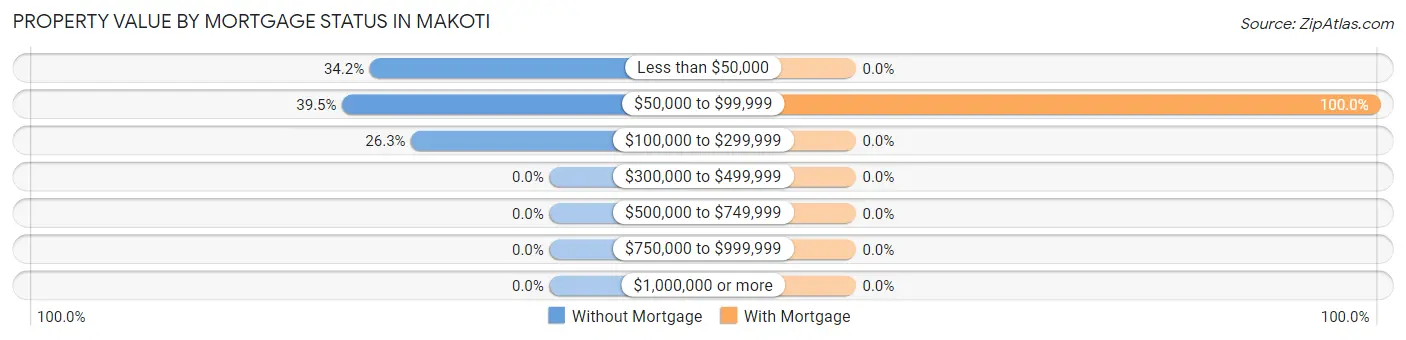
| Property Value | Without Mortgage | With Mortgage |
| Less than $50,000 | 13 (34.2%) | 0 (0.0%) |
| $50,000 to $99,999 | 15 (39.5%) | 4 (100.0%) |
| $100,000 to $299,999 | 10 (26.3%) | 0 (0.0%) |
| $300,000 to $499,999 | 0 (0.0%) | 0 (0.0%) |
| $500,000 to $749,999 | 0 (0.0%) | 0 (0.0%) |
| $750,000 to $999,999 | 0 (0.0%) | 0 (0.0%) |
| $1,000,000 or more | 0 (0.0%) | 0 (0.0%) |
| Total | 38 (100.0%) | 4 (100.0%) |
Household Income by Mortgage Status in Makoti
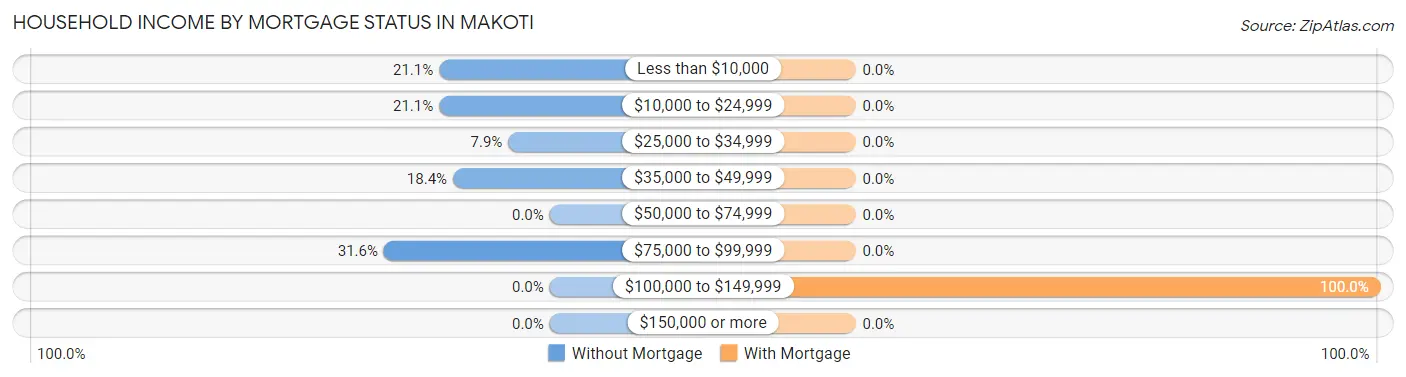
| Household Income | Without Mortgage | With Mortgage |
| Less than $10,000 | 8 (21.0%) | 0 (0.0%) |
| $10,000 to $24,999 | 8 (21.0%) | 0 (0.0%) |
| $25,000 to $34,999 | 3 (7.9%) | 0 (0.0%) |
| $35,000 to $49,999 | 7 (18.4%) | 0 (0.0%) |
| $50,000 to $74,999 | 0 (0.0%) | 0 (0.0%) |
| $75,000 to $99,999 | 12 (31.6%) | 0 (0.0%) |
| $100,000 to $149,999 | 0 (0.0%) | 4 (100.0%) |
| $150,000 or more | 0 (0.0%) | 0 (0.0%) |
| Total | 38 (100.0%) | 4 (100.0%) |
Property Value to Household Income Ratio in Makoti
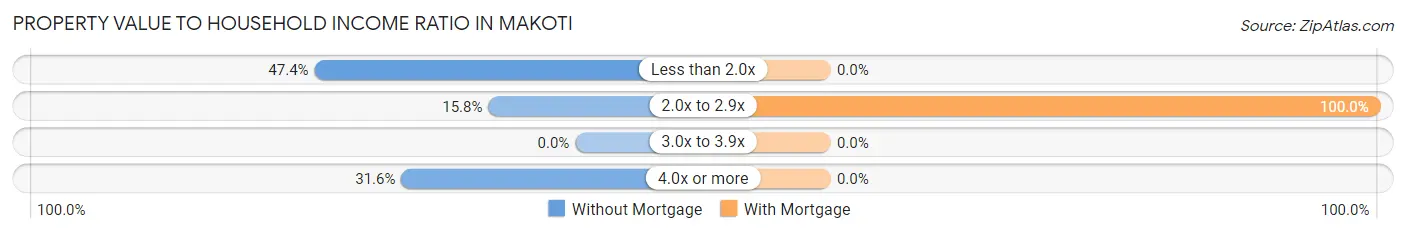
| Value-to-Income Ratio | Without Mortgage | With Mortgage |
| Less than 2.0x | 18 (47.4%) | 0 (0.0%) |
| 2.0x to 2.9x | 6 (15.8%) | 4 (100.0%) |
| 3.0x to 3.9x | 0 (0.0%) | 0 (0.0%) |
| 4.0x or more | 12 (31.6%) | 0 (0.0%) |
| Total | 38 (100.0%) | 4 (100.0%) |
Real Estate Taxes by Mortgage Status in Makoti
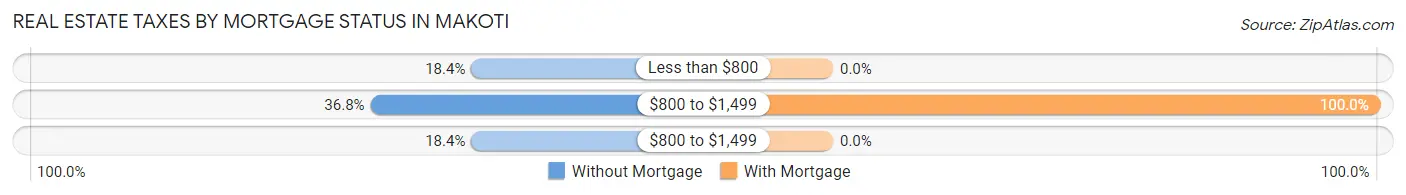
| Property Taxes | Without Mortgage | With Mortgage |
| Less than $800 | 7 (18.4%) | 0 (0.0%) |
| $800 to $1,499 | 14 (36.8%) | 4 (100.0%) |
| $800 to $1,499 | 7 (18.4%) | 0 (0.0%) |
| Total | 38 (100.0%) | 4 (100.0%) |
Health & Disability in Makoti
Health Insurance Coverage by Age in Makoti
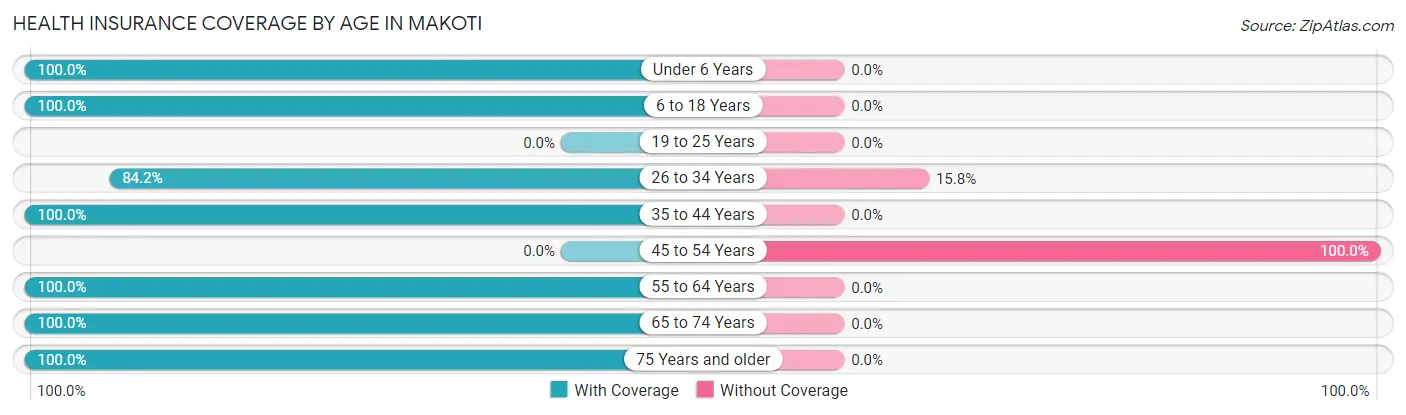
| Age Bracket | With Coverage | Without Coverage |
| Under 6 Years | 7 (100.0%) | 0 (0.0%) |
| 6 to 18 Years | 6 (100.0%) | 0 (0.0%) |
| 19 to 25 Years | 0 (0.0%) | 0 (0.0%) |
| 26 to 34 Years | 16 (84.2%) | 3 (15.8%) |
| 35 to 44 Years | 4 (100.0%) | 0 (0.0%) |
| 45 to 54 Years | 0 (0.0%) | 4 (100.0%) |
| 55 to 64 Years | 18 (100.0%) | 0 (0.0%) |
| 65 to 74 Years | 20 (100.0%) | 0 (0.0%) |
| 75 Years and older | 8 (100.0%) | 0 (0.0%) |
| Total | 79 (91.9%) | 7 (8.1%) |
Health Insurance Coverage by Citizenship Status in Makoti
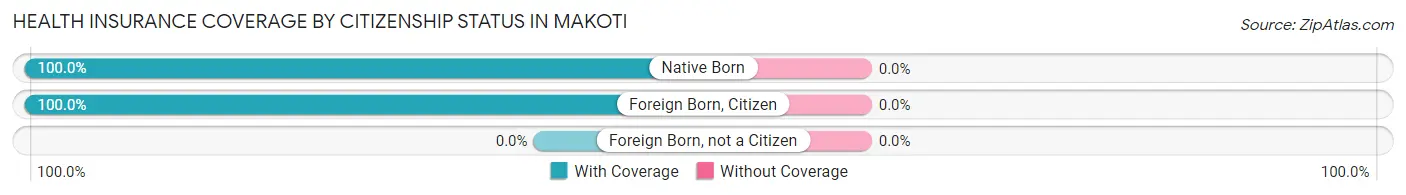
| Citizenship Status | With Coverage | Without Coverage |
| Native Born | 7 (100.0%) | 0 (0.0%) |
| Foreign Born, Citizen | 6 (100.0%) | 0 (0.0%) |
| Foreign Born, not a Citizen | 0 (0.0%) | 0 (0.0%) |
Health Insurance Coverage by Household Income in Makoti
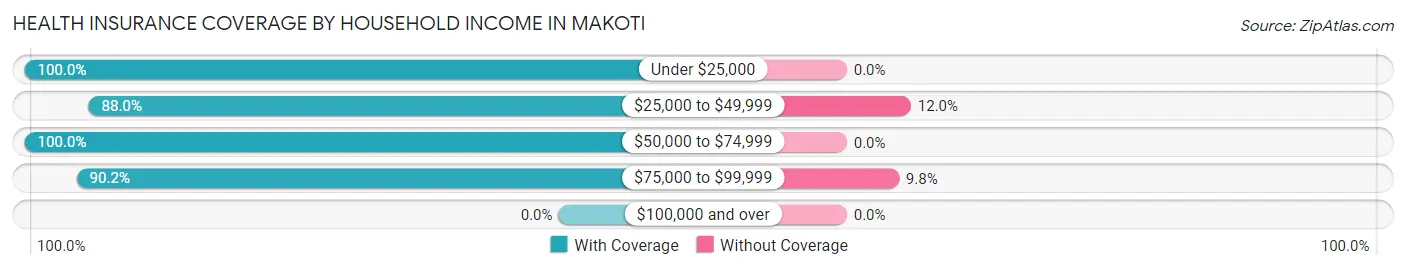
| Household Income | With Coverage | Without Coverage |
| Under $25,000 | 16 (100.0%) | 0 (0.0%) |
| $25,000 to $49,999 | 22 (88.0%) | 3 (12.0%) |
| $50,000 to $74,999 | 4 (100.0%) | 0 (0.0%) |
| $75,000 to $99,999 | 37 (90.2%) | 4 (9.8%) |
| $100,000 and over | 0 (0.0%) | 0 (0.0%) |
Public vs Private Health Insurance Coverage by Age in Makoti
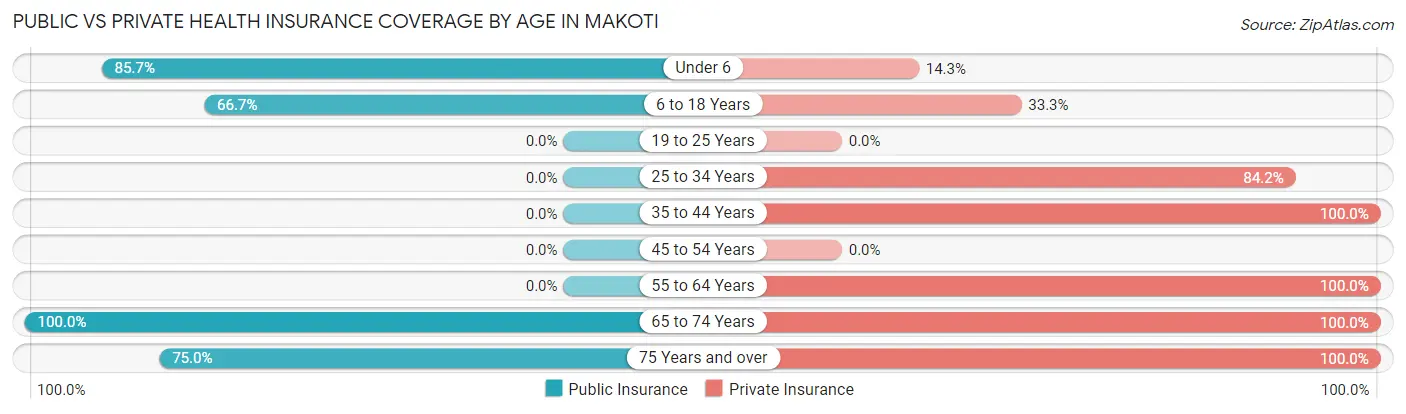
| Age Bracket | Public Insurance | Private Insurance |
| Under 6 | 6 (85.7%) | 1 (14.3%) |
| 6 to 18 Years | 4 (66.7%) | 2 (33.3%) |
| 19 to 25 Years | 0 (0.0%) | 0 (0.0%) |
| 25 to 34 Years | 0 (0.0%) | 16 (84.2%) |
| 35 to 44 Years | 0 (0.0%) | 4 (100.0%) |
| 45 to 54 Years | 0 (0.0%) | 0 (0.0%) |
| 55 to 64 Years | 0 (0.0%) | 18 (100.0%) |
| 65 to 74 Years | 20 (100.0%) | 20 (100.0%) |
| 75 Years and over | 6 (75.0%) | 8 (100.0%) |
| Total | 36 (41.9%) | 69 (80.2%) |
Disability Status by Sex by Age in Makoti
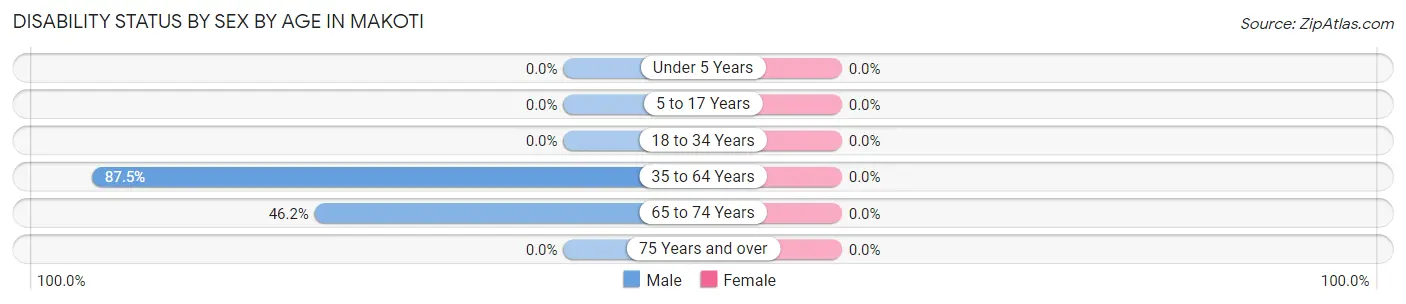
| Age Bracket | Male | Female |
| Under 5 Years | 0 (0.0%) | 0 (0.0%) |
| 5 to 17 Years | 0 (0.0%) | 0 (0.0%) |
| 18 to 34 Years | 0 (0.0%) | 0 (0.0%) |
| 35 to 64 Years | 14 (87.5%) | 0 (0.0%) |
| 65 to 74 Years | 6 (46.2%) | 0 (0.0%) |
| 75 Years and over | 0 (0.0%) | 0 (0.0%) |
Disability Class by Sex by Age in Makoti
Disability Class: Hearing Difficulty
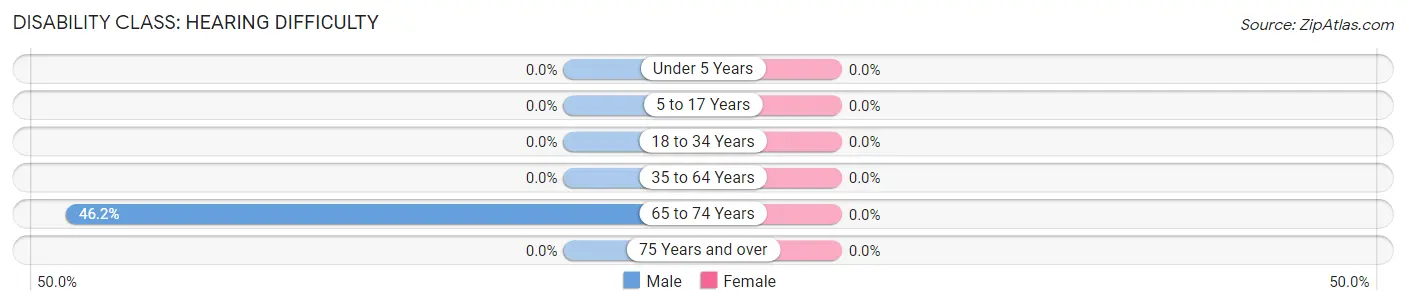
| Age Bracket | Male | Female |
| Under 5 Years | 0 (0.0%) | 0 (0.0%) |
| 5 to 17 Years | 0 (0.0%) | 0 (0.0%) |
| 18 to 34 Years | 0 (0.0%) | 0 (0.0%) |
| 35 to 64 Years | 0 (0.0%) | 0 (0.0%) |
| 65 to 74 Years | 6 (46.2%) | 0 (0.0%) |
| 75 Years and over | 0 (0.0%) | 0 (0.0%) |
Disability Class: Vision Difficulty
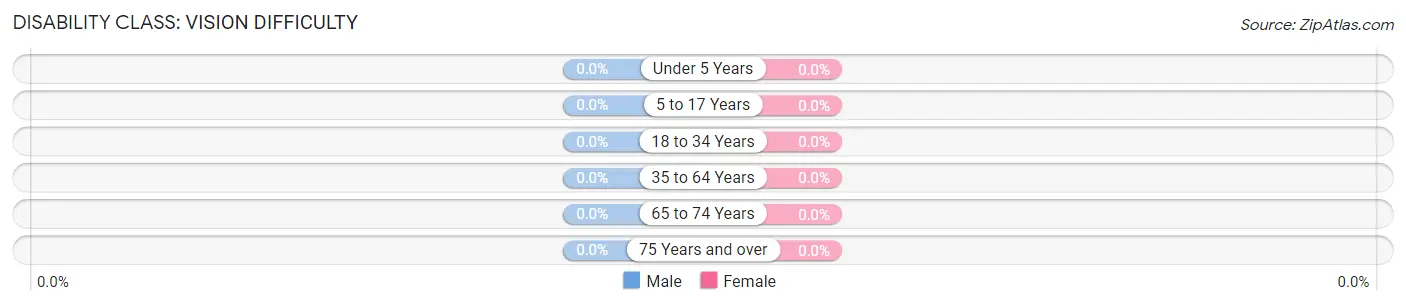
| Age Bracket | Male | Female |
| Under 5 Years | 0 (0.0%) | 0 (0.0%) |
| 5 to 17 Years | 0 (0.0%) | 0 (0.0%) |
| 18 to 34 Years | 0 (0.0%) | 0 (0.0%) |
| 35 to 64 Years | 0 (0.0%) | 0 (0.0%) |
| 65 to 74 Years | 0 (0.0%) | 0 (0.0%) |
| 75 Years and over | 0 (0.0%) | 0 (0.0%) |
Disability Class: Cognitive Difficulty
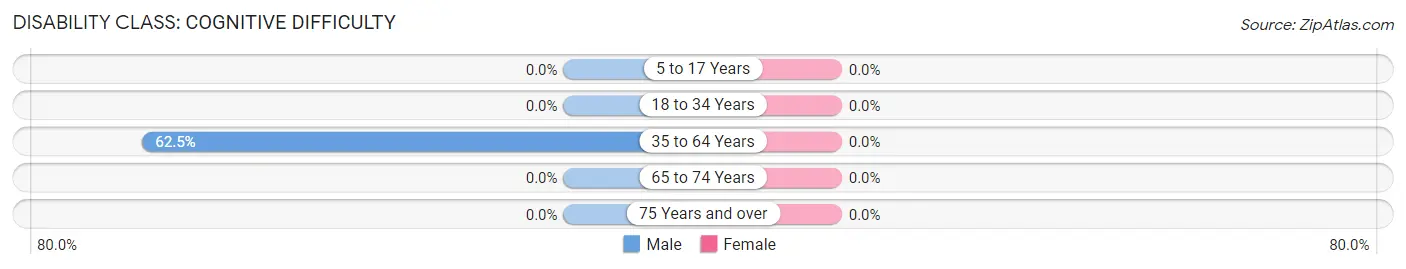
| Age Bracket | Male | Female |
| 5 to 17 Years | 0 (0.0%) | 0 (0.0%) |
| 18 to 34 Years | 0 (0.0%) | 0 (0.0%) |
| 35 to 64 Years | 10 (62.5%) | 0 (0.0%) |
| 65 to 74 Years | 0 (0.0%) | 0 (0.0%) |
| 75 Years and over | 0 (0.0%) | 0 (0.0%) |
Disability Class: Ambulatory Difficulty
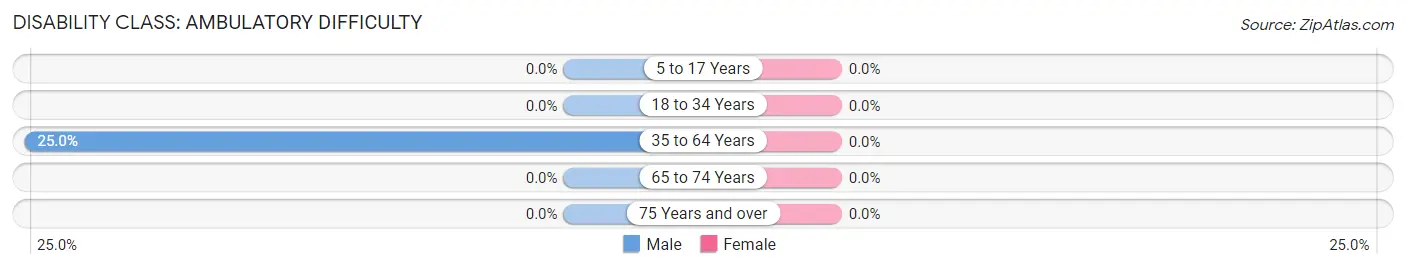
| Age Bracket | Male | Female |
| 5 to 17 Years | 0 (0.0%) | 0 (0.0%) |
| 18 to 34 Years | 0 (0.0%) | 0 (0.0%) |
| 35 to 64 Years | 4 (25.0%) | 0 (0.0%) |
| 65 to 74 Years | 0 (0.0%) | 0 (0.0%) |
| 75 Years and over | 0 (0.0%) | 0 (0.0%) |
Disability Class: Self-Care Difficulty
| Age Bracket | Male | Female |
| 5 to 17 Years | 0 (0.0%) | 0 (0.0%) |
| 18 to 34 Years | 0 (0.0%) | 0 (0.0%) |
| 35 to 64 Years | 0 (0.0%) | 0 (0.0%) |
| 65 to 74 Years | 0 (0.0%) | 0 (0.0%) |
| 75 Years and over | 0 (0.0%) | 0 (0.0%) |
Technology Access in Makoti
Computing Device Access in Makoti
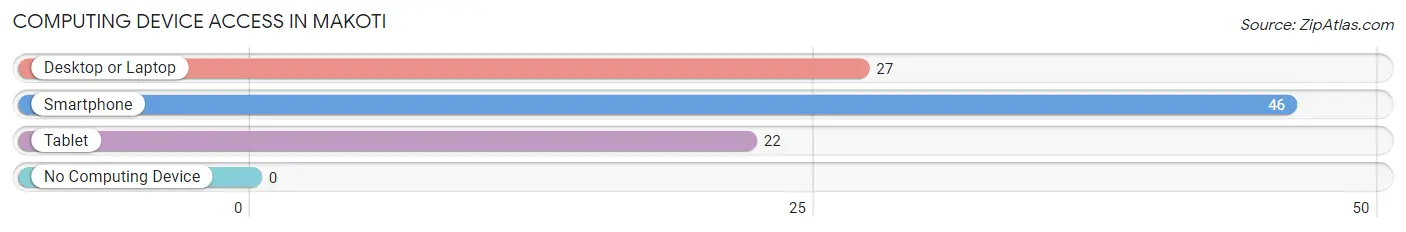
| Device Type | # Households | % Households |
| Desktop or Laptop | 27 | 56.2% |
| Smartphone | 46 | 95.8% |
| Tablet | 22 | 45.8% |
| No Computing Device | 0 | 0.0% |
| Total | 48 | 100.0% |
Internet Access in Makoti
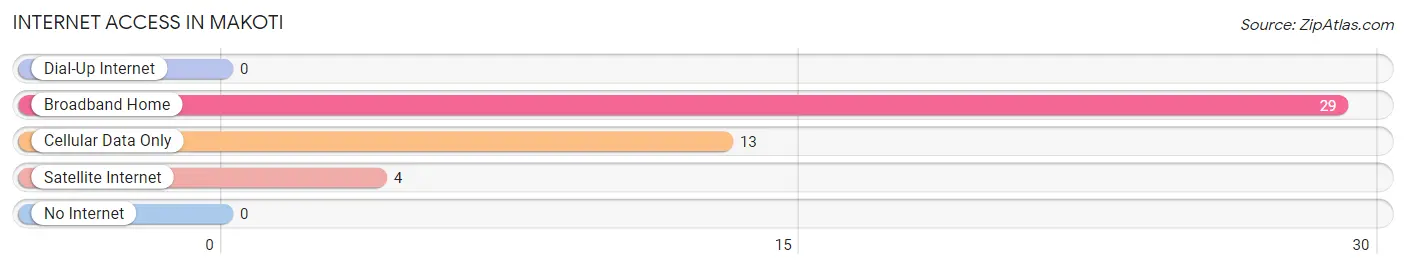
| Internet Type | # Households | % Households |
| Dial-Up Internet | 0 | 0.0% |
| Broadband Home | 29 | 60.4% |
| Cellular Data Only | 13 | 27.1% |
| Satellite Internet | 4 | 8.3% |
| No Internet | 0 | 0.0% |
| Total | 48 | 100.0% |
Makoti Summary
Makoti is a small city located in the northwestern corner of North Dakota, United States. It is situated in the heart of the Bakken oil fields, and is the county seat of Ward County. The city has a population of approximately 1,000 people, and is the smallest incorporated city in the state.
History
Makoti was founded in 1906 by a group of homesteaders who had come to the area to take advantage of the Homestead Act. The city was named after the nearby Makoti Creek, which was named after the Native American word for “big water”. The city was incorporated in 1910, and the first mayor was elected in 1911.
In the early years, Makoti was a small farming community, and the main industry was agriculture. However, in the 1950s, the discovery of oil in the area changed the city’s fortunes. The oil boom brought an influx of people and money to the city, and it quickly became a major center for oil production.
Geography
Makoti is located in the northwestern corner of North Dakota, in the heart of the Bakken oil fields. The city is situated on the banks of the Missouri River, and is surrounded by rolling hills and prairies. The city has a total area of 0.7 square miles, all of which is land.
Economy
Makoti’s economy is largely based on the oil industry. The city is home to several oil companies, and is a major center for oil production. In addition, the city is home to several businesses that provide services to the oil industry, such as drilling and engineering companies.
The city also has a small tourism industry, with several hotels and restaurants catering to visitors. The city is also home to several small businesses, such as retail stores, restaurants, and other services.
Demographics
As of the 2010 census, Makoti had a population of 1,000 people. The racial makeup of the city was 97.2% White, 0.7% Native American, 0.3% Asian, 0.2% from other races, and 1.6% from two or more races. The median household income was $45,000, and the median family income was $50,000.
Conclusion
Makoti is a small city located in the northwestern corner of North Dakota. It is situated in the heart of the Bakken oil fields, and is the county seat of Ward County. The city has a population of approximately 1,000 people, and is the smallest incorporated city in the state. The city’s economy is largely based on the oil industry, and it is also home to several small businesses and a small tourism industry. The city has a diverse population, with a median household income of $45,000 and a median family income of $50,000.
Common Questions
What is the Total Population of Makoti?
Total Population of Makoti is 86.
What is the Total Male Population of Makoti?
Total Male Population of Makoti is 51.
What is the Total Female Population of Makoti?
Total Female Population of Makoti is 35.
What is the Ratio of Males per 100 Females in Makoti?
There are 145.71 Males per 100 Females in Makoti.
What is the Ratio of Females per 100 Males in Makoti?
There are 68.63 Females per 100 Males in Makoti.
What is the Median Population Age in Makoti?
Median Population Age in Makoti is 57.3 Years.
What is the Average Family Size in Makoti
Average Family Size in Makoti is 2.5 People.
What is the Average Household Size in Makoti
Average Household Size in Makoti is 1.8 People.
What is Per Capita Income in Makoti?
Per Capita income in Makoti is $27,773.
What is the Median Family Income in Makoti?
Median Family Income in Makoti is $92,857.
What is the Median Household income in Makoti?
Median Household Income in Makoti is $49,000.
What is Inequality or Gini Index in Makoti?
Inequality or Gini Index in Makoti is 0.40.
How Large is the Labor Force in Makoti?
There are 35 People in the Labor Forcein in Makoti.
What is the Percentage of People in the Labor Force in Makoti?
47.9% of People are in the Labor Force in Makoti.
What is the Unemployment Rate in Makoti?
Unemployment Rate in Makoti is 5.7%.