Williams County, ND
Williams County Map
Williams County Overview
39,076
TOTAL POPULATION
21,134
MALE POPULATION
17,942
FEMALE POPULATION
117.79
MALES / 100 FEMALES
84.90
FEMALES / 100 MALES
31.9
MEDIAN AGE
3.2
AVG FAMILY SIZE
2.5
AVG HOUSEHOLD SIZE
$44,076
PER CAPITA INCOME
$104,948
AVG FAMILY INCOME
$86,139
AVG HOUSEHOLD INCOME
51.4%
WAGE / INCOME GAP [ % ]
48.6¢/ $1
WAGE / INCOME GAP [ $ ]
0.44
INEQUALITY / GINI INDEX
20,842
LABOR FORCE [ PEOPLE ]
74.0%
PERCENT IN LABOR FORCE
2.5%
UNEMPLOYMENT RATE
Williams County Area Codes
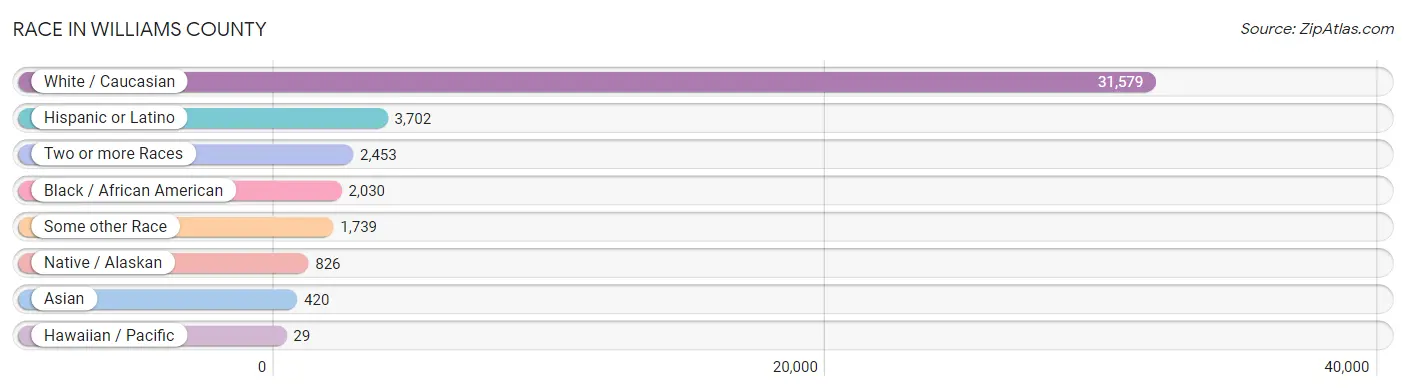
Race in Williams County
The most populous races in Williams County are White / Caucasian (31,579 | 80.8%), Hispanic or Latino (3,702 | 9.5%), and Two or more Races (2,453 | 6.3%).
| Race | # Population | % Population |
| Asian | 420 | 1.1% |
| Black / African American | 2,030 | 5.2% |
| Hawaiian / Pacific | 29 | 0.1% |
| Hispanic or Latino | 3,702 | 9.5% |
| Native / Alaskan | 826 | 2.1% |
| White / Caucasian | 31,579 | 80.8% |
| Two or more Races | 2,453 | 6.3% |
| Some other Race | 1,739 | 4.4% |
| Total | 39,076 | 100.0% |
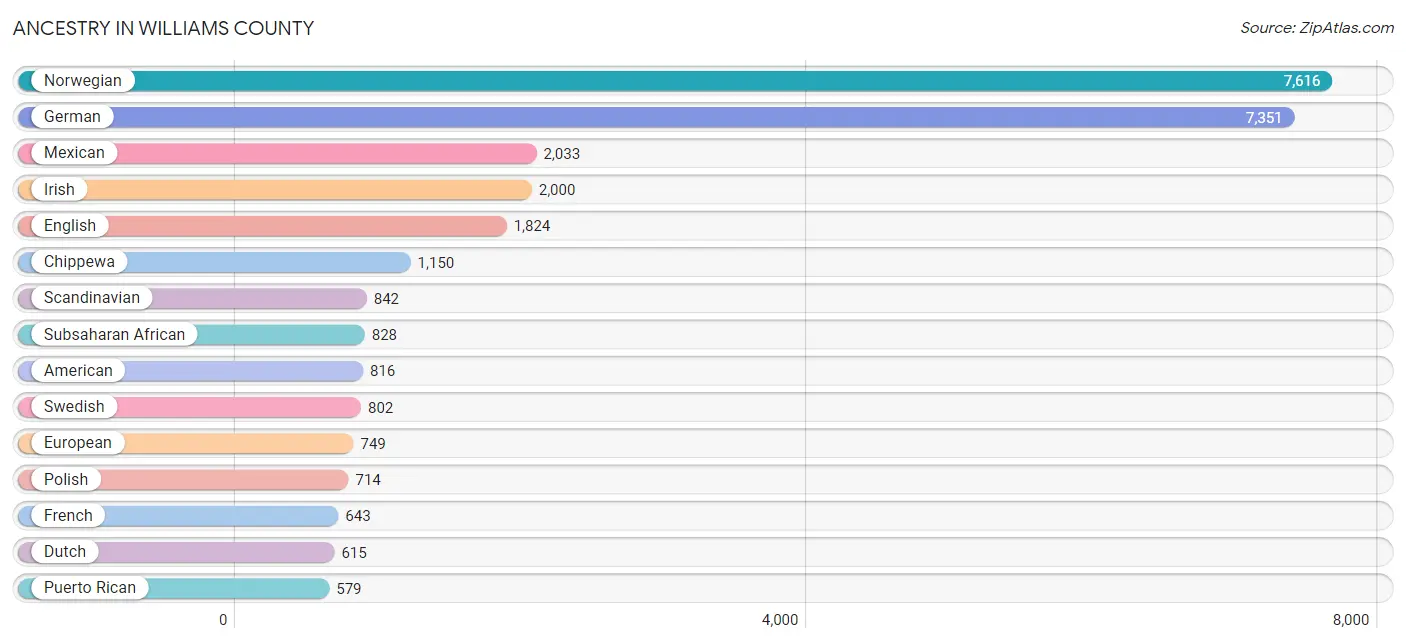
Ancestry in Williams County
The most populous ancestries reported in Williams County are Norwegian (7,616 | 19.5%), German (7,351 | 18.8%), Mexican (2,033 | 5.2%), Irish (2,000 | 5.1%), and English (1,824 | 4.7%), together accounting for 53.3% of all Williams County residents.
| Ancestry | # Population | % Population |
| African | 384 | 1.0% |
| American | 816 | 2.1% |
| Arab | 325 | 0.8% |
| Australian | 12 | 0.0% |
| Austrian | 96 | 0.3% |
| Basque | 10 | 0.0% |
| Belgian | 57 | 0.2% |
| Belizean | 3 | 0.0% |
| Bhutanese | 119 | 0.3% |
| Blackfeet | 13 | 0.0% |
| British | 50 | 0.1% |
| Burmese | 75 | 0.2% |
| Canadian | 10 | 0.0% |
| Central American | 185 | 0.5% |
| Cherokee | 79 | 0.2% |
| Cheyenne | 47 | 0.1% |
| Chilean | 146 | 0.4% |
| Chippewa | 1,150 | 2.9% |
| Choctaw | 60 | 0.2% |
| Colombian | 40 | 0.1% |
| Cree | 67 | 0.2% |
| Cuban | 13 | 0.0% |
| Czech | 158 | 0.4% |
| Czechoslovakian | 16 | 0.0% |
| Danish | 291 | 0.7% |
| Dominican | 147 | 0.4% |
| Dutch | 615 | 1.6% |
| Eastern European | 159 | 0.4% |
| English | 1,824 | 4.7% |
| European | 749 | 1.9% |
| Fijian | 131 | 0.3% |
| Finnish | 195 | 0.5% |
| French | 643 | 1.7% |
| French American Indian | 104 | 0.3% |
| French Canadian | 304 | 0.8% |
| German | 7,351 | 18.8% |
| Greek | 146 | 0.4% |
| Honduran | 4 | 0.0% |
| Houma | 199 | 0.5% |
| Icelander | 21 | 0.1% |
| Indian (Asian) | 121 | 0.3% |
| Irish | 2,000 | 5.1% |
| Italian | 423 | 1.1% |
| Jamaican | 79 | 0.2% |
| Korean | 314 | 0.8% |
| Latvian | 2 | 0.0% |
| Lebanese | 119 | 0.3% |
| Liberian | 357 | 0.9% |
| Lithuanian | 5 | 0.0% |
| Luxembourger | 1 | 0.0% |
| Mexican | 2,033 | 5.2% |
| Mexican American Indian | 14 | 0.0% |
| Native Hawaiian | 109 | 0.3% |
| Navajo | 15 | 0.0% |
| Northern European | 23 | 0.1% |
| Norwegian | 7,616 | 19.5% |
| Palestinian | 127 | 0.3% |
| Panamanian | 31 | 0.1% |
| Peruvian | 181 | 0.5% |
| Polish | 714 | 1.8% |
| Portuguese | 47 | 0.1% |
| Puerto Rican | 579 | 1.5% |
| Romanian | 35 | 0.1% |
| Russian | 321 | 0.8% |
| Salvadoran | 56 | 0.1% |
| Samoan | 11 | 0.0% |
| Scandinavian | 842 | 2.1% |
| Scotch-Irish | 229 | 0.6% |
| Scottish | 530 | 1.4% |
| Seminole | 3 | 0.0% |
| Shoshone | 25 | 0.1% |
| Sioux | 203 | 0.5% |
| Slovak | 10 | 0.0% |
| Somali | 2 | 0.0% |
| South African | 51 | 0.1% |
| South American | 367 | 0.9% |
| Spaniard | 168 | 0.4% |
| Subsaharan African | 828 | 2.1% |
| Swedish | 802 | 2.1% |
| Swiss | 44 | 0.1% |
| Syrian | 79 | 0.2% |
| Turkish | 85 | 0.2% |
| Ukrainian | 70 | 0.2% |
| Welsh | 147 | 0.4% |
| Zimbabwean | 32 | 0.1% | View All 85 Rows |
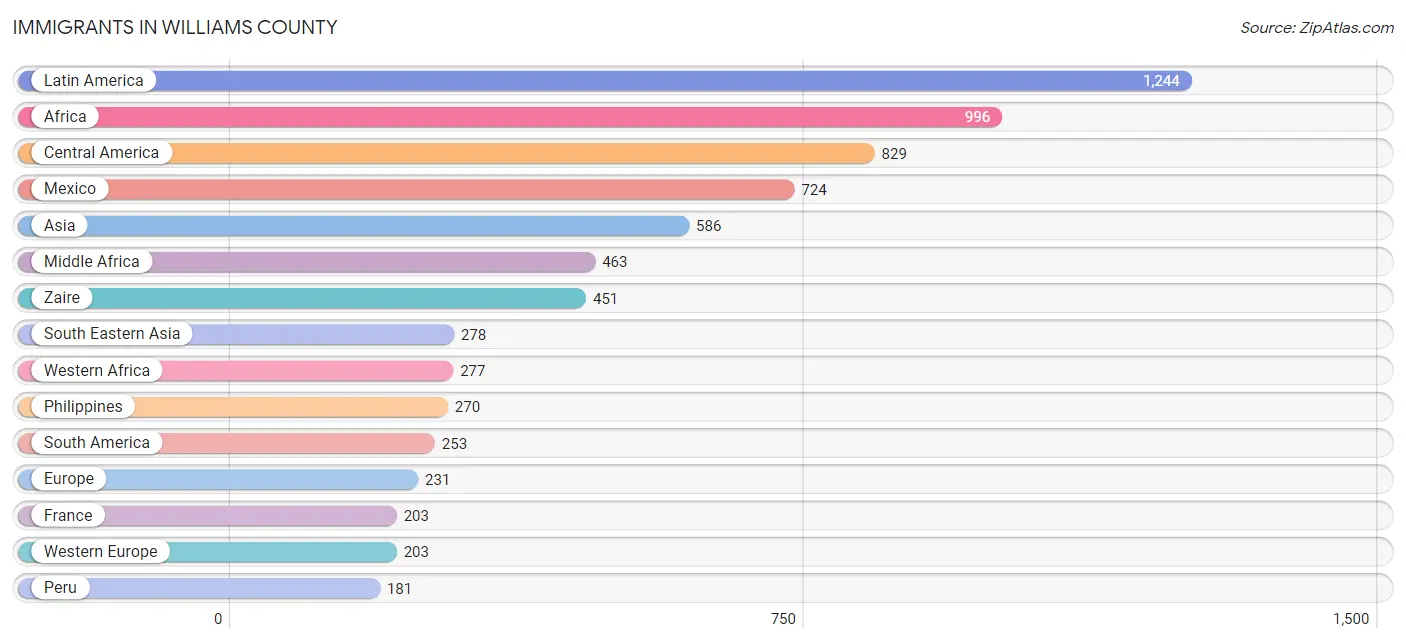
Immigrants in Williams County
The most numerous immigrant groups reported in Williams County came from Latin America (1,244 | 3.2%), Africa (996 | 2.5%), Central America (829 | 2.1%), Mexico (724 | 1.8%), and Asia (586 | 1.5%), together accounting for 11.2% of all Williams County residents.
| Immigration Origin | # Population | % Population |
| Africa | 996 | 2.5% |
| Asia | 586 | 1.5% |
| Australia | 12 | 0.0% |
| Belize | 3 | 0.0% |
| Cameroon | 10 | 0.0% |
| Canada | 180 | 0.5% |
| Caribbean | 162 | 0.4% |
| Central America | 829 | 2.1% |
| China | 32 | 0.1% |
| Colombia | 72 | 0.2% |
| Congo | 2 | 0.0% |
| Dominican Republic | 118 | 0.3% |
| Eastern Africa | 34 | 0.1% |
| Eastern Asia | 126 | 0.3% |
| Europe | 231 | 0.6% |
| France | 203 | 0.5% |
| Ghana | 85 | 0.2% |
| Honduras | 8 | 0.0% |
| Jamaica | 44 | 0.1% |
| Japan | 32 | 0.1% |
| Korea | 62 | 0.2% |
| Latin America | 1,244 | 3.2% |
| Liberia | 161 | 0.4% |
| Mexico | 724 | 1.8% |
| Middle Africa | 463 | 1.2% |
| Nigeria | 31 | 0.1% |
| Northern Europe | 28 | 0.1% |
| Oceania | 26 | 0.1% |
| Pakistan | 9 | 0.0% |
| Peru | 181 | 0.5% |
| Philippines | 270 | 0.7% |
| Scotland | 24 | 0.1% |
| Somalia | 2 | 0.0% |
| South Africa | 51 | 0.1% |
| South America | 253 | 0.6% |
| South Central Asia | 9 | 0.0% |
| South Eastern Asia | 278 | 0.7% |
| Taiwan | 16 | 0.0% |
| Thailand | 8 | 0.0% |
| Turkey | 85 | 0.2% |
| Western Africa | 277 | 0.7% |
| Western Asia | 85 | 0.2% |
| Western Europe | 203 | 0.5% |
| Zaire | 451 | 1.1% |
| Zimbabwe | 32 | 0.1% | View All 45 Rows |
Sex and Age in Williams County
Sex and Age in Williams County
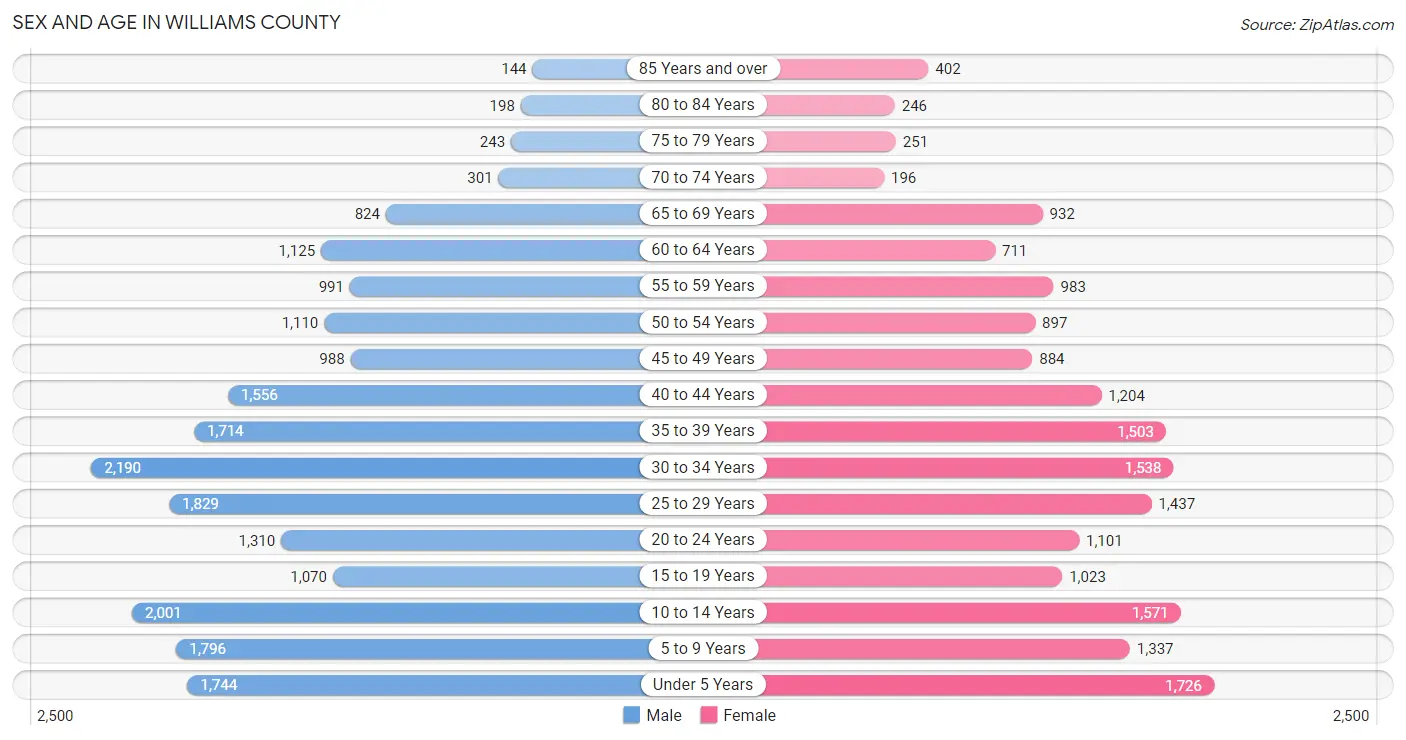
The most populous age groups in Williams County are 30 to 34 Years (2,190 | 10.4%) for men and Under 5 Years (1,726 | 9.6%) for women.
| Age Bracket | Male | Female |
| Under 5 Years | 1,744 (8.3%) | 1,726 (9.6%) |
| 5 to 9 Years | 1,796 (8.5%) | 1,337 (7.4%) |
| 10 to 14 Years | 2,001 (9.5%) | 1,571 (8.8%) |
| 15 to 19 Years | 1,070 (5.1%) | 1,023 (5.7%) |
| 20 to 24 Years | 1,310 (6.2%) | 1,101 (6.1%) |
| 25 to 29 Years | 1,829 (8.6%) | 1,437 (8.0%) |
| 30 to 34 Years | 2,190 (10.4%) | 1,538 (8.6%) |
| 35 to 39 Years | 1,714 (8.1%) | 1,503 (8.4%) |
| 40 to 44 Years | 1,556 (7.4%) | 1,204 (6.7%) |
| 45 to 49 Years | 988 (4.7%) | 884 (4.9%) |
| 50 to 54 Years | 1,110 (5.2%) | 897 (5.0%) |
| 55 to 59 Years | 991 (4.7%) | 983 (5.5%) |
| 60 to 64 Years | 1,125 (5.3%) | 711 (4.0%) |
| 65 to 69 Years | 824 (3.9%) | 932 (5.2%) |
| 70 to 74 Years | 301 (1.4%) | 196 (1.1%) |
| 75 to 79 Years | 243 (1.1%) | 251 (1.4%) |
| 80 to 84 Years | 198 (0.9%) | 246 (1.4%) |
| 85 Years and over | 144 (0.7%) | 402 (2.2%) |
| Total | 21,134 (100.0%) | 17,942 (100.0%) |
Families and Households in Williams County
Median Family Size in Williams County
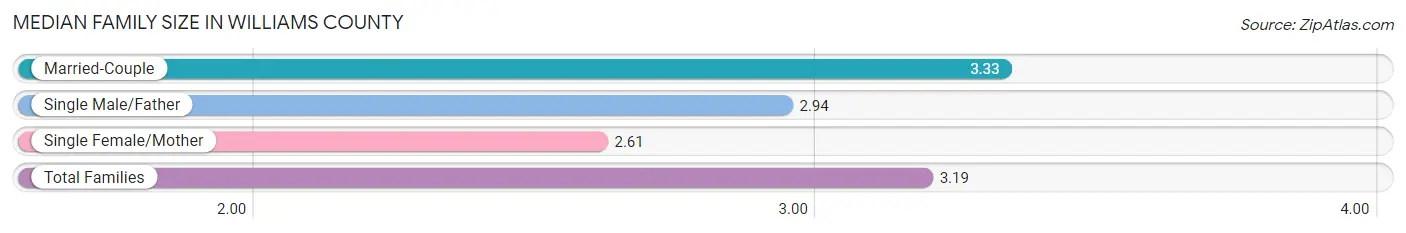
The median family size in Williams County is 3.19 persons per family, with married-couple families (7,013 | 73.5%) accounting for the largest median family size of 3.33 persons per family. On the other hand, single female/mother families (1,205 | 12.6%) represent the smallest median family size with 2.61 persons per family.
| Family Type | # Families | Family Size |
| Married-Couple | 7,013 (73.5%) | 3.33 |
| Single Male/Father | 1,320 (13.8%) | 2.94 |
| Single Female/Mother | 1,205 (12.6%) | 2.61 |
| Total Families | 9,538 (100.0%) | 3.19 |
Median Household Size in Williams County
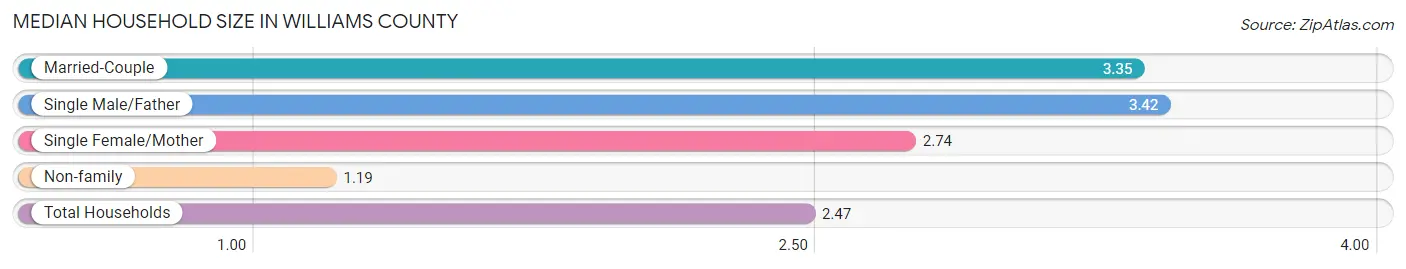
The median household size in Williams County is 2.47 persons per household, with single male/father households (1,320 | 8.5%) accounting for the largest median household size of 3.42 persons per household. non-family households (6,061 | 38.9%) represent the smallest median household size with 1.19 persons per household.
| Household Type | # Households | Household Size |
| Married-Couple | 7,013 (45.0%) | 3.35 |
| Single Male/Father | 1,320 (8.5%) | 3.42 |
| Single Female/Mother | 1,205 (7.7%) | 2.74 |
| Non-family | 6,061 (38.9%) | 1.19 |
| Total Households | 15,599 (100.0%) | 2.47 |
Household Size by Marriage Status in Williams County
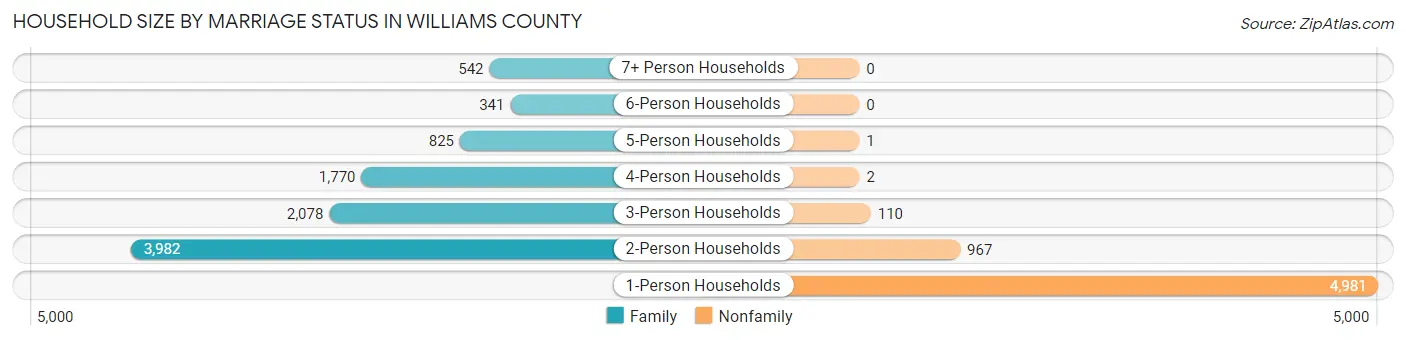
Out of a total of 15,599 households in Williams County, 9,538 (61.1%) are family households, while 6,061 (38.9%) are nonfamily households. The most numerous type of family households are 2-person households, comprising 3,982, and the most common type of nonfamily households are 1-person households, comprising 4,981.
| Household Size | Family Households | Nonfamily Households |
| 1-Person Households | - | 4,981 (31.9%) |
| 2-Person Households | 3,982 (25.5%) | 967 (6.2%) |
| 3-Person Households | 2,078 (13.3%) | 110 (0.7%) |
| 4-Person Households | 1,770 (11.4%) | 2 (0.0%) |
| 5-Person Households | 825 (5.3%) | 1 (0.0%) |
| 6-Person Households | 341 (2.2%) | 0 (0.0%) |
| 7+ Person Households | 542 (3.5%) | 0 (0.0%) |
| Total | 9,538 (61.1%) | 6,061 (38.9%) |
Female Fertility in Williams County
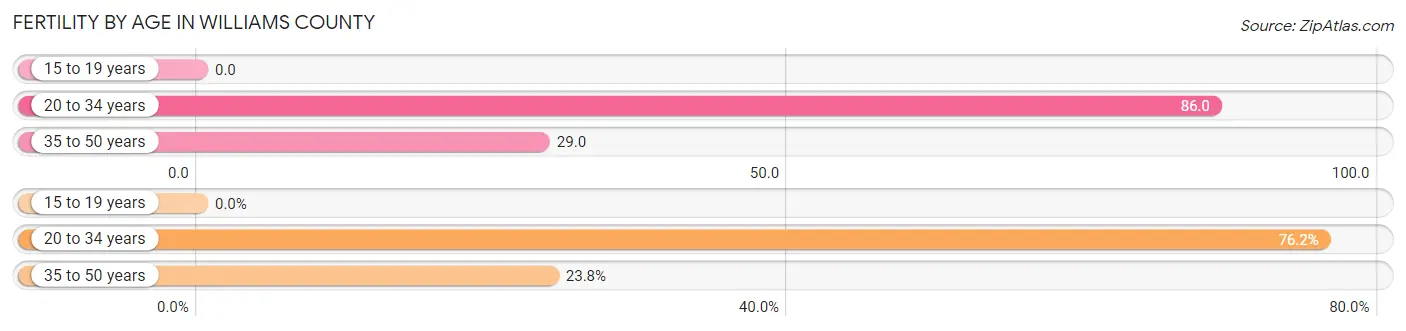
Fertility by Age in Williams County
Average fertility rate in Williams County is 52.0 births per 1,000 women. Women in the age bracket of 20 to 34 years have the highest fertility rate with 86.0 births per 1,000 women. Women in the age bracket of 20 to 34 years acount for 76.2% of all women with births.
| Age Bracket | Women with Births | Births / 1,000 Women |
| 15 to 19 years | 0 (0.0%) | 0.0 |
| 20 to 34 years | 352 (76.2%) | 86.0 |
| 35 to 50 years | 110 (23.8%) | 29.0 |
| Total | 462 (100.0%) | 52.0 |
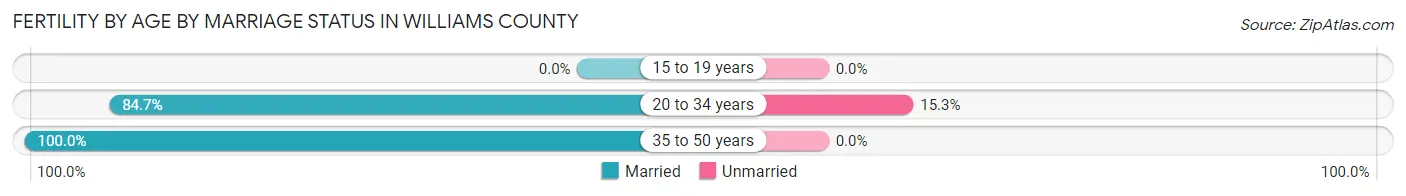
Fertility by Age by Marriage Status in Williams County
88.3% of women with births (462) in Williams County are married. The highest percentage of unmarried women with births falls into 20 to 34 years age bracket with 15.3% of them unmarried at the time of birth, while the lowest percentage of unmarried women with births belong to 35 to 50 years age bracket with 0.0% of them unmarried.
| Age Bracket | Married | Unmarried |
| 15 to 19 years | 0 (0.0%) | 0 (0.0%) |
| 20 to 34 years | 298 (84.7%) | 54 (15.3%) |
| 35 to 50 years | 110 (100.0%) | 0 (0.0%) |
| Total | 408 (88.3%) | 54 (11.7%) |
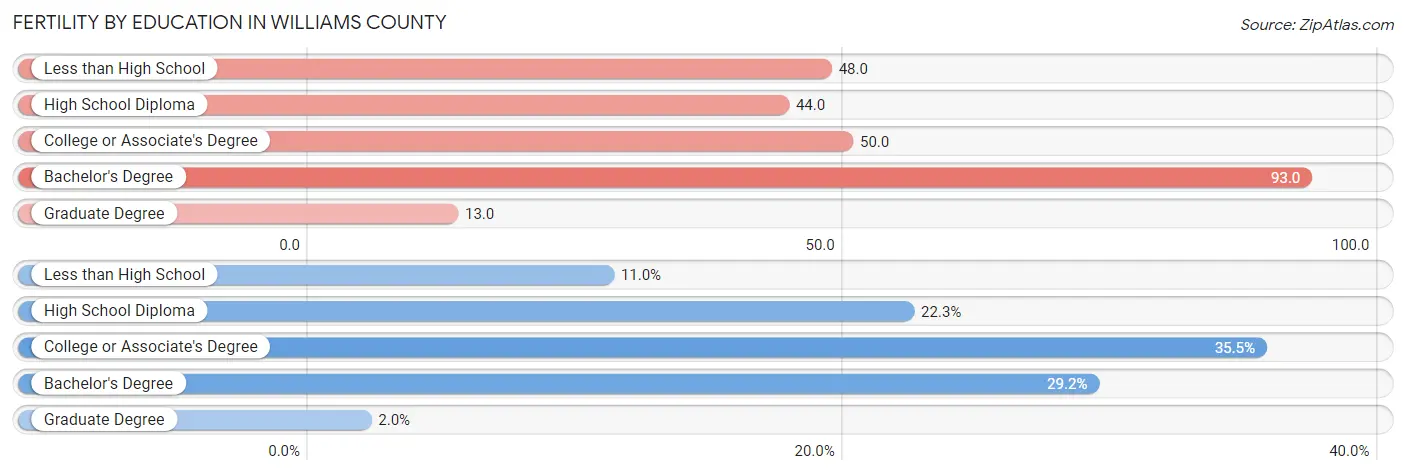
Fertility by Education in Williams County
Average fertility rate in Williams County is 52.0 births per 1,000 women. Women with the education attainment of bachelor's degree have the highest fertility rate of 93.0 births per 1,000 women, while women with the education attainment of graduate degree have the lowest fertility at 13.0 births per 1,000 women. Women with the education attainment of college or associate's degree represent 35.5% of all women with births.
| Educational Attainment | Women with Births | Births / 1,000 Women |
| Less than High School | 51 (11.0%) | 48.0 |
| High School Diploma | 103 (22.3%) | 44.0 |
| College or Associate's Degree | 164 (35.5%) | 50.0 |
| Bachelor's Degree | 135 (29.2%) | 93.0 |
| Graduate Degree | 9 (1.9%) | 13.0 |
| Total | 462 (100.0%) | 52.0 |
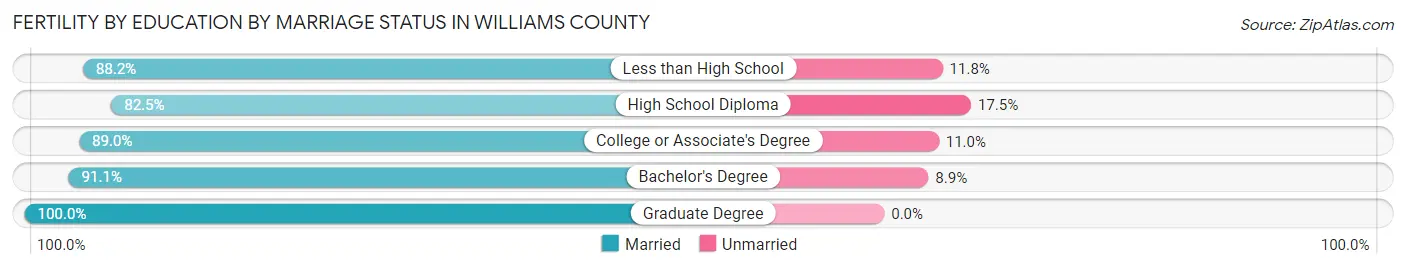
Fertility by Education by Marriage Status in Williams County
11.7% of women with births in Williams County are unmarried. Women with the educational attainment of graduate degree are most likely to be married with 100.0% of them married at childbirth, while women with the educational attainment of high school diploma are least likely to be married with 17.5% of them unmarried at childbirth.
| Educational Attainment | Married | Unmarried |
| Less than High School | 45 (88.2%) | 6 (11.8%) |
| High School Diploma | 85 (82.5%) | 18 (17.5%) |
| College or Associate's Degree | 146 (89.0%) | 18 (11.0%) |
| Bachelor's Degree | 123 (91.1%) | 12 (8.9%) |
| Graduate Degree | 9 (100.0%) | 0 (0.0%) |
| Total | 408 (88.3%) | 54 (11.7%) |
Income in Williams County
Income Overview in Williams County
Per Capita Income in Williams County is $44,076, while median incomes of families and households are $104,948 and $86,139 respectively.
| Characteristic | Number | Measure |
| Per Capita Income | 39,076 | $44,076 |
| Median Family Income | 9,538 | $104,948 |
| Mean Family Income | 9,538 | $132,985 |
| Median Household Income | 15,599 | $86,139 |
| Mean Household Income | 15,599 | $113,117 |
| Income Deficit | 9,538 | $0 |
| Wage / Income Gap (%) | 39,076 | 51.43% |
| Wage / Income Gap ($) | 39,076 | 48.57¢ per $1 |
| Gini / Inequality Index | 39,076 | 0.44 |
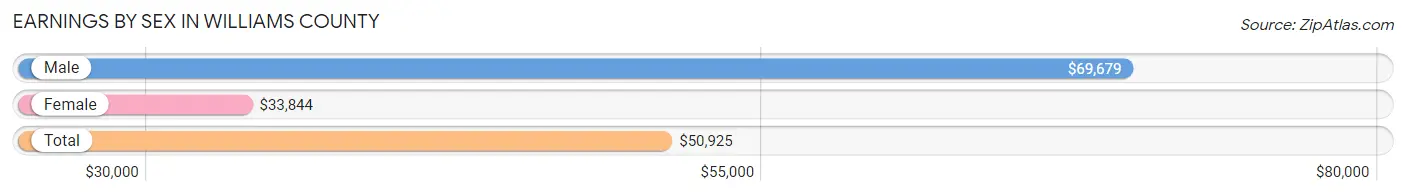
Earnings by Sex in Williams County
Average Earnings in Williams County are $50,925, $69,679 for men and $33,844 for women, a difference of 51.4%.
| Sex | Number | Average Earnings |
| Male | 12,705 (58.3%) | $69,679 |
| Female | 9,071 (41.7%) | $33,844 |
| Total | 21,776 (100.0%) | $50,925 |
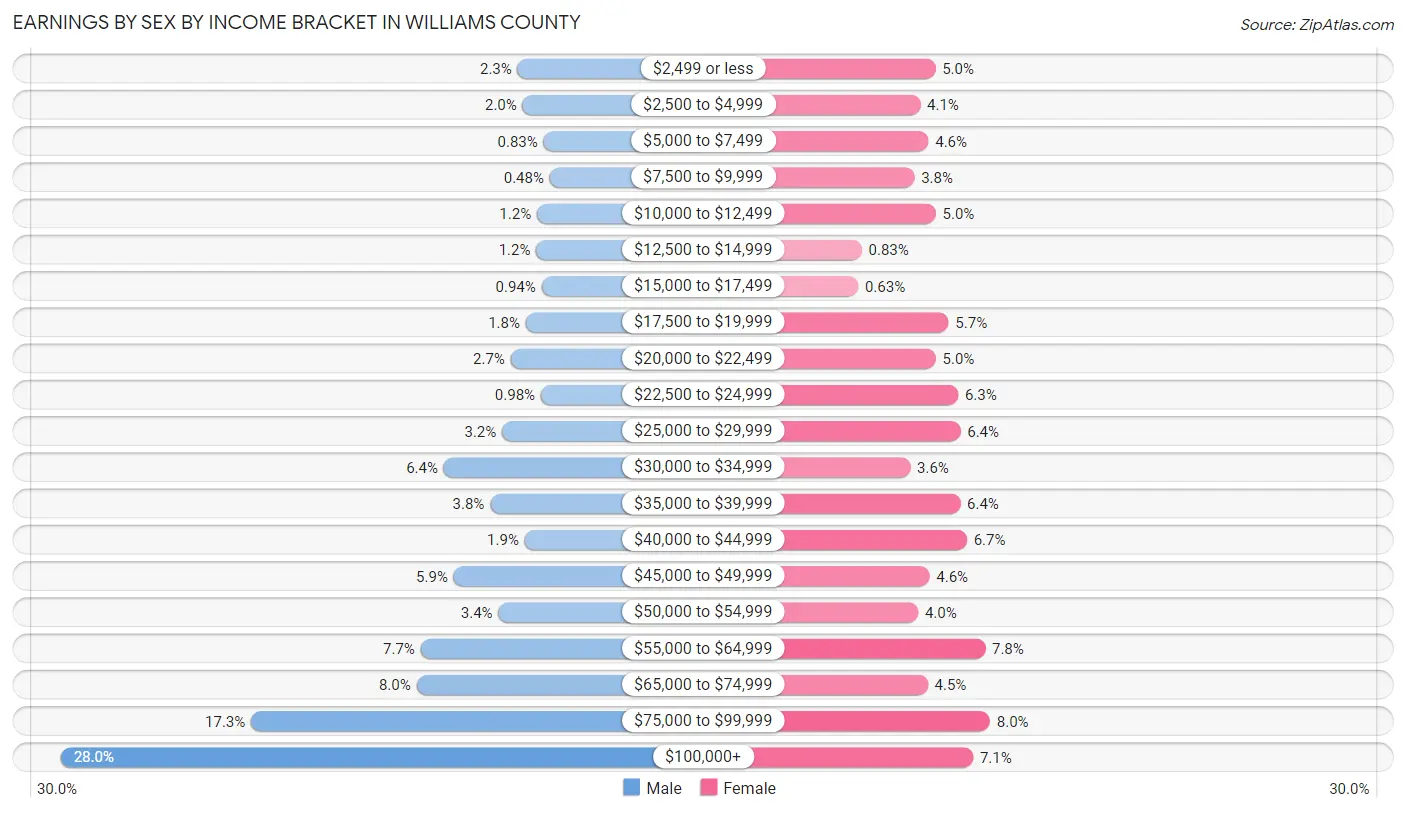
Earnings by Sex by Income Bracket in Williams County
The most common earnings brackets in Williams County are $100,000+ for men (3,553 | 28.0%) and $75,000 to $99,999 for women (729 | 8.0%).
| Income | Male | Female |
| $2,499 or less | 291 (2.3%) | 451 (5.0%) |
| $2,500 to $4,999 | 256 (2.0%) | 374 (4.1%) |
| $5,000 to $7,499 | 105 (0.8%) | 415 (4.6%) |
| $7,500 to $9,999 | 61 (0.5%) | 344 (3.8%) |
| $10,000 to $12,499 | 153 (1.2%) | 453 (5.0%) |
| $12,500 to $14,999 | 158 (1.2%) | 75 (0.8%) |
| $15,000 to $17,499 | 119 (0.9%) | 57 (0.6%) |
| $17,500 to $19,999 | 232 (1.8%) | 518 (5.7%) |
| $20,000 to $22,499 | 341 (2.7%) | 453 (5.0%) |
| $22,500 to $24,999 | 124 (1.0%) | 567 (6.2%) |
| $25,000 to $29,999 | 402 (3.2%) | 579 (6.4%) |
| $30,000 to $34,999 | 818 (6.4%) | 323 (3.6%) |
| $35,000 to $39,999 | 487 (3.8%) | 578 (6.4%) |
| $40,000 to $44,999 | 240 (1.9%) | 611 (6.7%) |
| $45,000 to $49,999 | 747 (5.9%) | 421 (4.6%) |
| $50,000 to $54,999 | 428 (3.4%) | 363 (4.0%) |
| $55,000 to $64,999 | 983 (7.7%) | 705 (7.8%) |
| $65,000 to $74,999 | 1,013 (8.0%) | 412 (4.5%) |
| $75,000 to $99,999 | 2,194 (17.3%) | 729 (8.0%) |
| $100,000+ | 3,553 (28.0%) | 643 (7.1%) |
| Total | 12,705 (100.0%) | 9,071 (100.0%) |
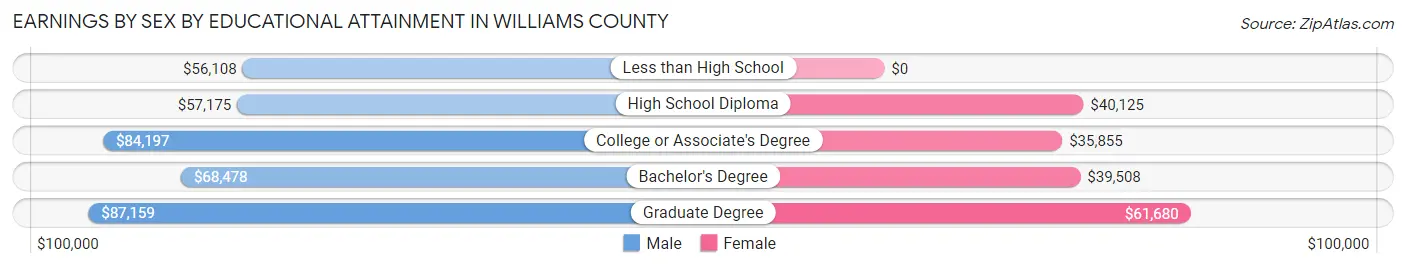
Earnings by Sex by Educational Attainment in Williams County
Average earnings in Williams County are $73,128 for men and $38,337 for women, a difference of 47.6%. Men with an educational attainment of graduate degree enjoy the highest average annual earnings of $87,159, while those with less than high school education earn the least with $56,108. Women with an educational attainment of graduate degree earn the most with the average annual earnings of $61,680, while those with college or associate's degree education have the smallest earnings of $35,855.
| Educational Attainment | Male Income | Female Income |
| Less than High School | $56,108 | $0 |
| High School Diploma | $57,175 | $40,125 |
| College or Associate's Degree | $84,197 | $35,855 |
| Bachelor's Degree | $68,478 | $39,508 |
| Graduate Degree | $87,159 | $61,680 |
| Total | $73,128 | $38,337 |
Family Income in Williams County
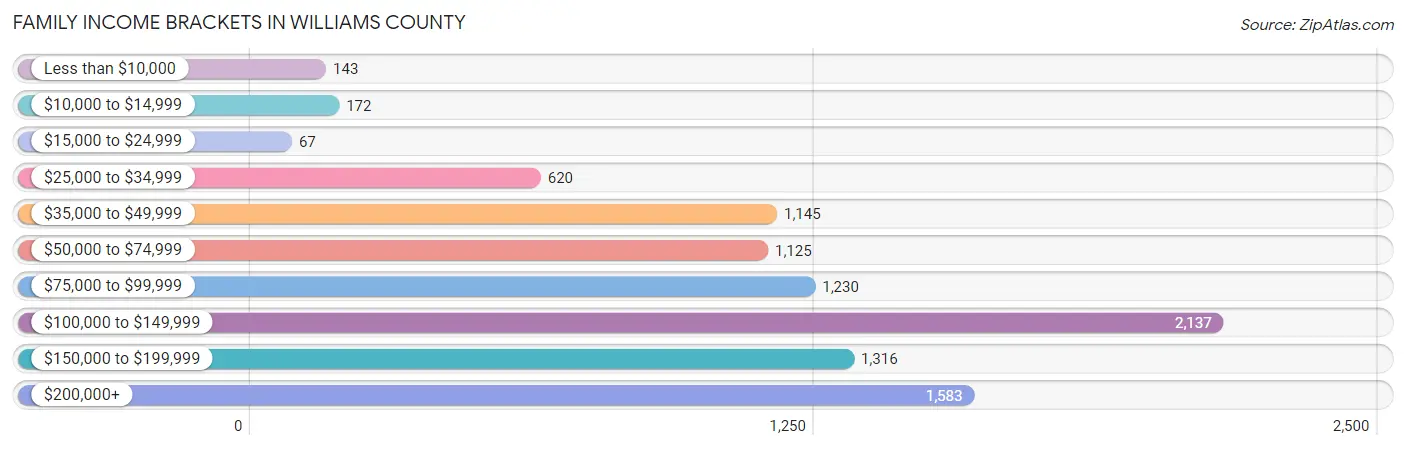
Family Income Brackets in Williams County
According to the Williams County family income data, there are 2,137 families falling into the $100,000 to $149,999 income range, which is the most common income bracket and makes up 22.4% of all families. Conversely, the $15,000 to $24,999 income bracket is the least frequent group with only 67 families (0.7%) belonging to this category.
| Income Bracket | # Families | % Families |
| Less than $10,000 | 143 | 1.5% |
| $10,000 to $14,999 | 172 | 1.8% |
| $15,000 to $24,999 | 67 | 0.7% |
| $25,000 to $34,999 | 620 | 6.5% |
| $35,000 to $49,999 | 1,145 | 12.0% |
| $50,000 to $74,999 | 1,125 | 11.8% |
| $75,000 to $99,999 | 1,230 | 12.9% |
| $100,000 to $149,999 | 2,137 | 22.4% |
| $150,000 to $199,999 | 1,316 | 13.8% |
| $200,000+ | 1,583 | 16.6% |
Family Income by Famaliy Size in Williams County
7+ person families (490 | 5.1%) account for the highest median family income in Williams County with $250,001 per family, while 2-person families (4,183 | 43.9%) have the highest median income of $52,386 per family member.
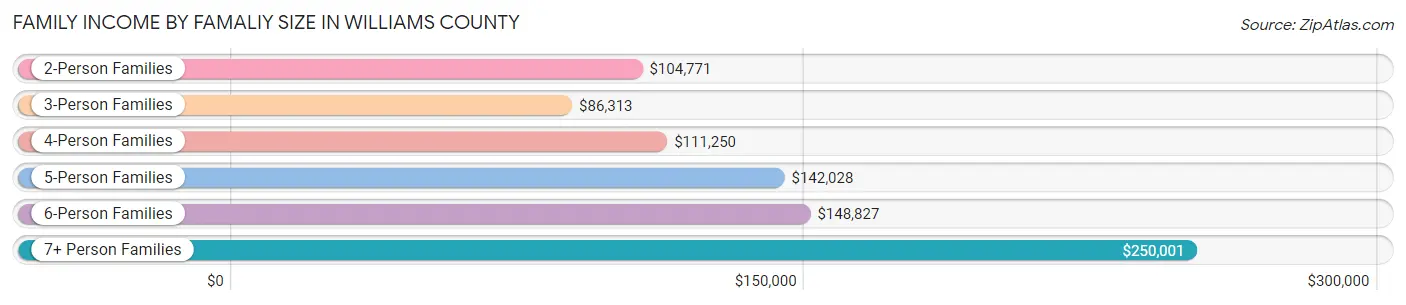
| Income Bracket | # Families | Median Income |
| 2-Person Families | 4,183 (43.9%) | $104,771 |
| 3-Person Families | 2,409 (25.3%) | $86,313 |
| 4-Person Families | 1,373 (14.4%) | $111,250 |
| 5-Person Families | 753 (7.9%) | $142,028 |
| 6-Person Families | 330 (3.5%) | $148,827 |
| 7+ Person Families | 490 (5.1%) | $250,001 |
| Total | 9,538 (100.0%) | $104,948 |
Family Income by Number of Earners in Williams County
The median family income in Williams County is $104,948, with families comprising 3+ earners (1,019) having the highest median family income of $250,001, while families with no earners (754) have the lowest median family income of $48,846, accounting for 10.7% and 7.9% of families, respectively.
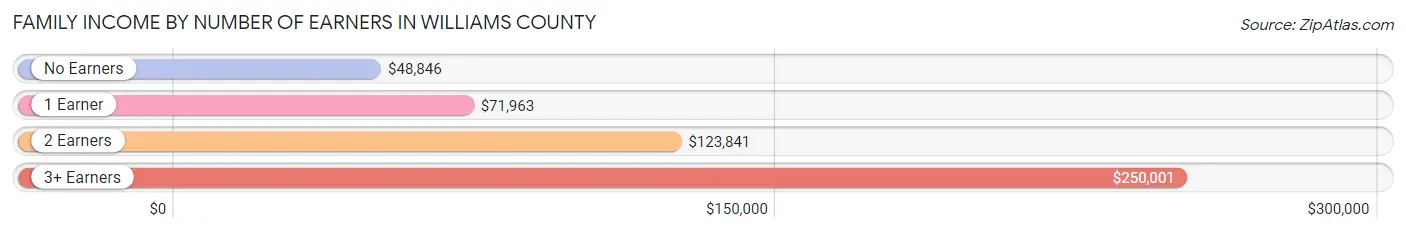
| Number of Earners | # Families | Median Income |
| No Earners | 754 (7.9%) | $48,846 |
| 1 Earner | 3,305 (34.6%) | $71,963 |
| 2 Earners | 4,460 (46.8%) | $123,841 |
| 3+ Earners | 1,019 (10.7%) | $250,001 |
| Total | 9,538 (100.0%) | $104,948 |
Household Income in Williams County
Household Income Brackets in Williams County
With 2,808 households falling in the category, the $100,000 to $149,999 income range is the most frequent in Williams County, accounting for 18.0% of all households. In contrast, only 359 households (2.3%) fall into the $15,000 to $24,999 income bracket, making it the least populous group.
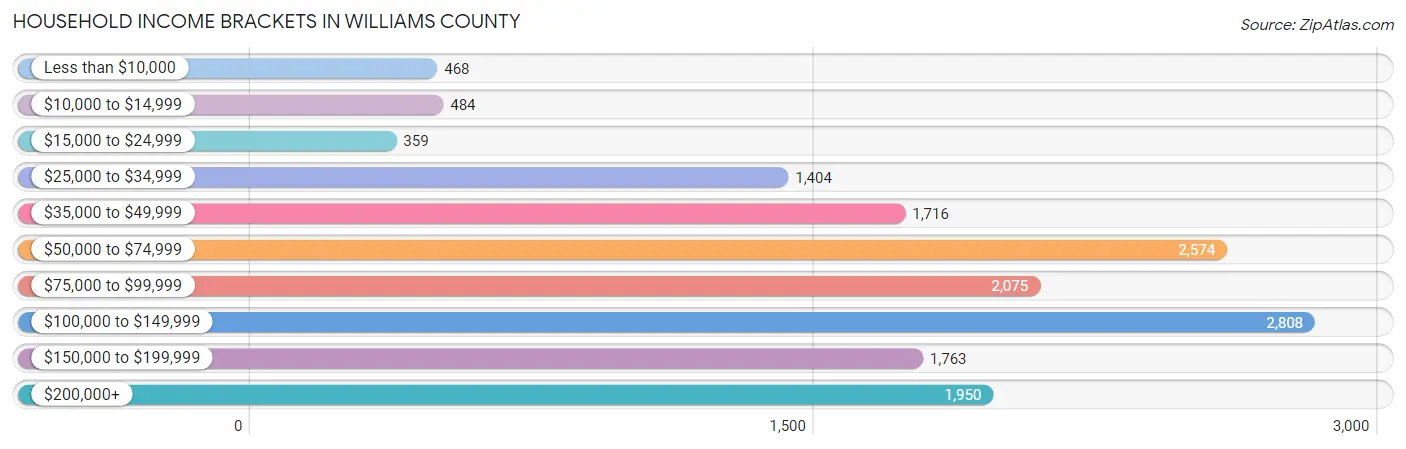
| Income Bracket | # Households | % Households |
| Less than $10,000 | 468 | 3.0% |
| $10,000 to $14,999 | 484 | 3.1% |
| $15,000 to $24,999 | 359 | 2.3% |
| $25,000 to $34,999 | 1,404 | 9.0% |
| $35,000 to $49,999 | 1,716 | 11.0% |
| $50,000 to $74,999 | 2,574 | 16.5% |
| $75,000 to $99,999 | 2,075 | 13.3% |
| $100,000 to $149,999 | 2,808 | 18.0% |
| $150,000 to $199,999 | 1,763 | 11.3% |
| $200,000+ | 1,950 | 12.5% |
Household Income by Householder Age in Williams County
The median household income in Williams County is $86,139, with the highest median household income of $109,500 found in the 45 to 64 years age bracket for the primary householder. A total of 4,542 households (29.1%) fall into this category. Meanwhile, the 65+ years age bracket for the primary householder has the lowest median household income of $43,965, with 2,387 households (15.3%) in this group.
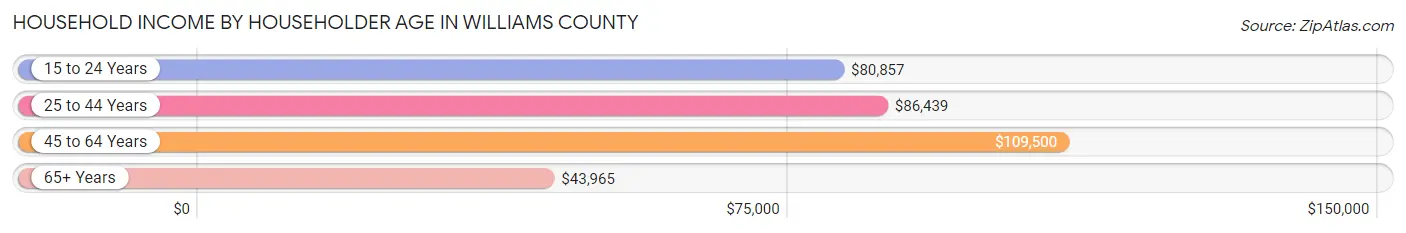
| Income Bracket | # Households | Median Income |
| 15 to 24 Years | 1,053 (6.8%) | $80,857 |
| 25 to 44 Years | 7,617 (48.8%) | $86,439 |
| 45 to 64 Years | 4,542 (29.1%) | $109,500 |
| 65+ Years | 2,387 (15.3%) | $43,965 |
| Total | 15,599 (100.0%) | $86,139 |
Poverty in Williams County
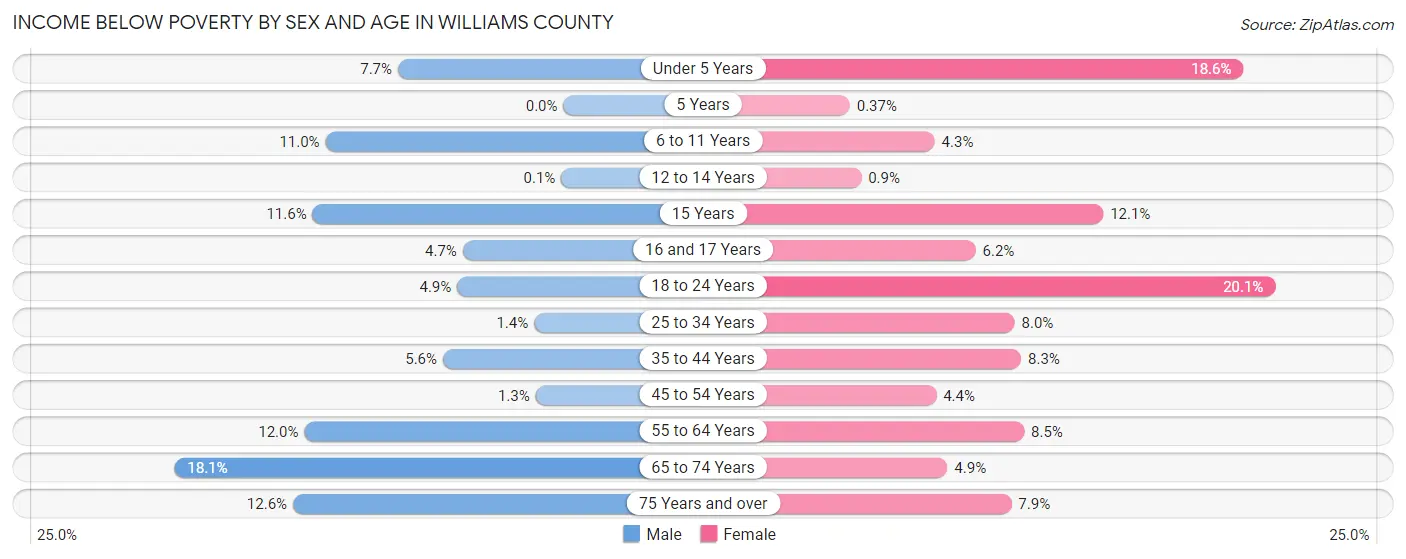
Income Below Poverty by Sex and Age in Williams County
With 6.3% poverty level for males and 8.7% for females among the residents of Williams County, 65 to 74 year old males and 18 to 24 year old females are the most vulnerable to poverty, with 202 males (18.0%) and 292 females (20.1%) in their respective age groups living below the poverty level.
| Age Bracket | Male | Female |
| Under 5 Years | 134 (7.7%) | 316 (18.6%) |
| 5 Years | 0 (0.0%) | 1 (0.4%) |
| 6 to 11 Years | 259 (11.0%) | 65 (4.3%) |
| 12 to 14 Years | 1 (0.1%) | 10 (0.9%) |
| 15 Years | 54 (11.6%) | 33 (12.1%) |
| 16 and 17 Years | 12 (4.7%) | 22 (6.2%) |
| 18 to 24 Years | 79 (4.9%) | 292 (20.1%) |
| 25 to 34 Years | 54 (1.4%) | 238 (8.0%) |
| 35 to 44 Years | 182 (5.6%) | 225 (8.3%) |
| 45 to 54 Years | 27 (1.3%) | 78 (4.4%) |
| 55 to 64 Years | 253 (12.0%) | 143 (8.5%) |
| 65 to 74 Years | 202 (18.0%) | 54 (4.9%) |
| 75 Years and over | 69 (12.6%) | 62 (7.9%) |
| Total | 1,326 (6.3%) | 1,539 (8.7%) |
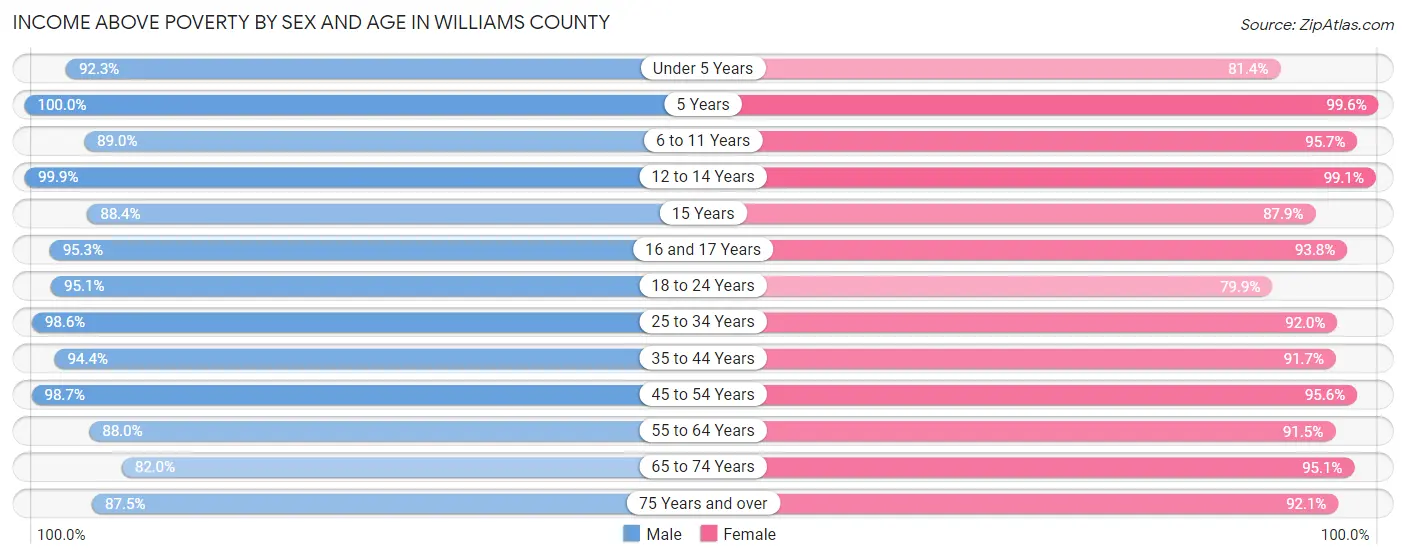
Income Above Poverty by Sex and Age in Williams County
According to the poverty statistics in Williams County, males aged 5 years and females aged 5 years are the age groups that are most secure financially, with 100.0% of males and 99.6% of females in these age groups living above the poverty line.
| Age Bracket | Male | Female |
| Under 5 Years | 1,610 (92.3%) | 1,380 (81.4%) |
| 5 Years | 417 (100.0%) | 266 (99.6%) |
| 6 to 11 Years | 2,088 (89.0%) | 1,444 (95.7%) |
| 12 to 14 Years | 1,026 (99.9%) | 1,102 (99.1%) |
| 15 Years | 410 (88.4%) | 239 (87.9%) |
| 16 and 17 Years | 245 (95.3%) | 332 (93.8%) |
| 18 to 24 Years | 1,525 (95.1%) | 1,160 (79.9%) |
| 25 to 34 Years | 3,906 (98.6%) | 2,731 (92.0%) |
| 35 to 44 Years | 3,074 (94.4%) | 2,480 (91.7%) |
| 45 to 54 Years | 2,067 (98.7%) | 1,703 (95.6%) |
| 55 to 64 Years | 1,851 (88.0%) | 1,548 (91.5%) |
| 65 to 74 Years | 917 (82.0%) | 1,048 (95.1%) |
| 75 Years and over | 481 (87.5%) | 726 (92.1%) |
| Total | 19,617 (93.7%) | 16,159 (91.3%) |
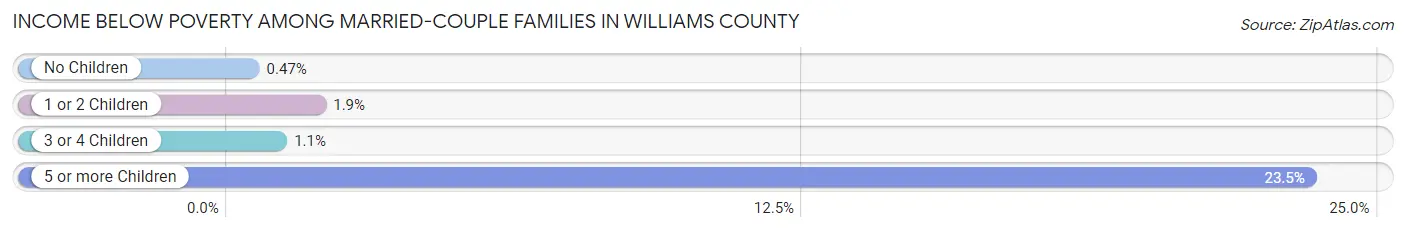
Income Below Poverty Among Married-Couple Families in Williams County
The poverty statistics for married-couple families in Williams County show that 2.5% or 175 of the total 7,013 families live below the poverty line. Families with 5 or more children have the highest poverty rate of 23.5%, comprising of 111 families. On the other hand, families with no children have the lowest poverty rate of 0.5%, which includes 18 families.
| Children | Above Poverty | Below Poverty |
| No Children | 3,796 (99.5%) | 18 (0.5%) |
| 1 or 2 Children | 1,942 (98.1%) | 38 (1.9%) |
| 3 or 4 Children | 738 (98.9%) | 8 (1.1%) |
| 5 or more Children | 362 (76.5%) | 111 (23.5%) |
| Total | 6,838 (97.5%) | 175 (2.5%) |
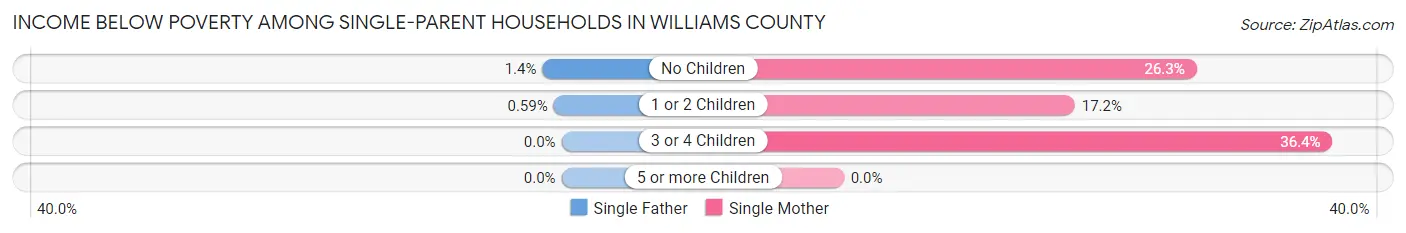
Income Below Poverty Among Single-Parent Households in Williams County
According to the poverty data in Williams County, 0.8% or 11 single-father households and 22.1% or 266 single-mother households are living below the poverty line. Among single-father households, those with no children have the highest poverty rate, with 6 households (1.4%) experiencing poverty. Likewise, among single-mother households, those with 3 or 4 children have the highest poverty rate, with 71 households (36.4%) falling below the poverty line.
| Children | Single Father | Single Mother |
| No Children | 6 (1.4%) | 61 (26.3%) |
| 1 or 2 Children | 5 (0.6%) | 134 (17.2%) |
| 3 or 4 Children | 0 (0.0%) | 71 (36.4%) |
| 5 or more Children | 0 (0.0%) | 0 (0.0%) |
| Total | 11 (0.8%) | 266 (22.1%) |
Income Below Poverty Among Married-Couple vs Single-Parent Households in Williams County
The poverty data for Williams County shows that 175 of the married-couple family households (2.5%) and 277 of the single-parent households (11.0%) are living below the poverty level. Within the married-couple family households, those with 5 or more children have the highest poverty rate, with 111 households (23.5%) falling below the poverty line. Among the single-parent households, those with 3 or 4 children have the highest poverty rate, with 71 household (29.1%) living below poverty.
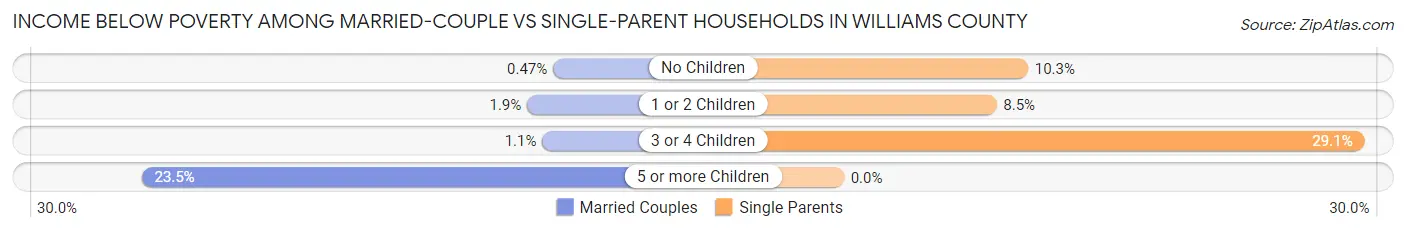
| Children | Married-Couple Families | Single-Parent Households |
| No Children | 18 (0.5%) | 67 (10.3%) |
| 1 or 2 Children | 38 (1.9%) | 139 (8.5%) |
| 3 or 4 Children | 8 (1.1%) | 71 (29.1%) |
| 5 or more Children | 111 (23.5%) | 0 (0.0%) |
| Total | 175 (2.5%) | 277 (11.0%) |
Employment Characteristics in Williams County
Employment by Class of Employer in Williams County
Among the 19,950 employed individuals in Williams County, private company employees (13,843 | 69.4%), not-for-profit organizations (1,686 | 8.5%), and local government employees (1,491 | 7.5%) make up the most common classes of employment.
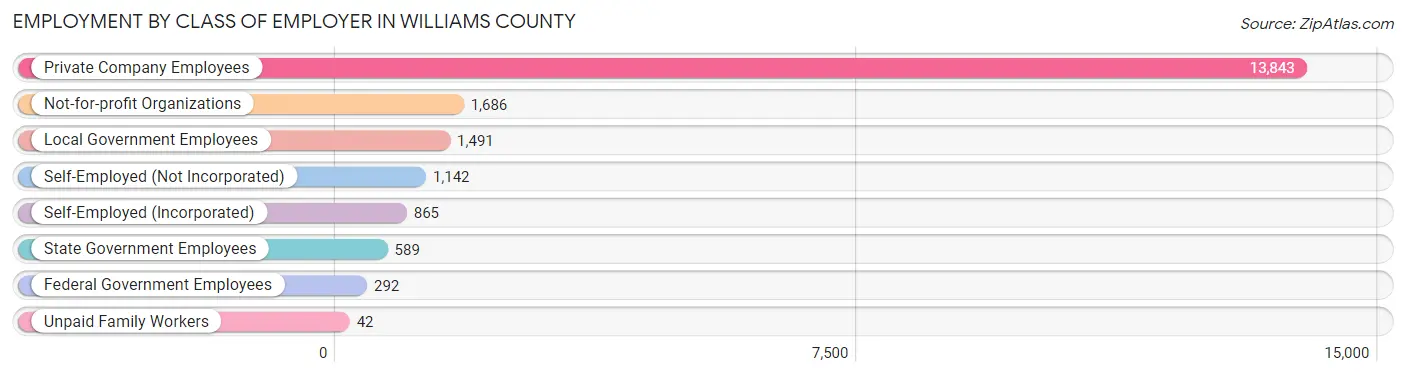
| Employer Class | # Employees | % Employees |
| Private Company Employees | 13,843 | 69.4% |
| Self-Employed (Incorporated) | 865 | 4.3% |
| Self-Employed (Not Incorporated) | 1,142 | 5.7% |
| Not-for-profit Organizations | 1,686 | 8.5% |
| Local Government Employees | 1,491 | 7.5% |
| State Government Employees | 589 | 2.9% |
| Federal Government Employees | 292 | 1.5% |
| Unpaid Family Workers | 42 | 0.2% |
| Total | 19,950 | 100.0% |
Employment Status by Age in Williams County
According to the labor force statistics for Williams County, out of the total population over 16 years of age (28,165), 74.0% or 20,842 individuals are in the labor force, with 2.5% or 521 of them unemployed. The age group with the highest labor force participation rate is 30 to 34 years, with 90.6% or 3,378 individuals in the labor force. Within the labor force, the 20 to 24 years age range has the highest percentage of unemployed individuals, with 9.3% or 188 of them being unemployed.
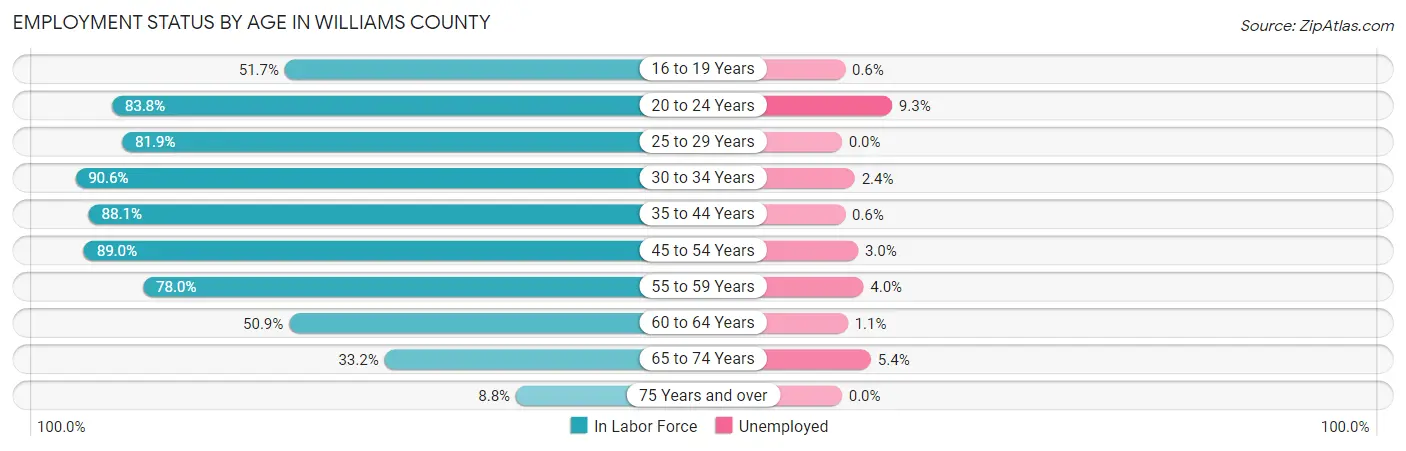
| Age Bracket | In Labor Force | Unemployed |
| 16 to 19 Years | 702 (51.7%) | 4 (0.6%) |
| 20 to 24 Years | 2,020 (83.8%) | 188 (9.3%) |
| 25 to 29 Years | 2,675 (81.9%) | 0 (0.0%) |
| 30 to 34 Years | 3,378 (90.6%) | 81 (2.4%) |
| 35 to 44 Years | 5,266 (88.1%) | 32 (0.6%) |
| 45 to 54 Years | 3,452 (89.0%) | 104 (3.0%) |
| 55 to 59 Years | 1,540 (78.0%) | 62 (4.0%) |
| 60 to 64 Years | 935 (50.9%) | 10 (1.1%) |
| 65 to 74 Years | 748 (33.2%) | 40 (5.4%) |
| 75 Years and over | 131 (8.8%) | 0 (0.0%) |
| Total | 20,842 (74.0%) | 521 (2.5%) |
Employment Status by Educational Attainment in Williams County
According to labor force statistics for Williams County, 83.5% of individuals (17,251) out of the total population between 25 and 64 years of age (20,660) are in the labor force, with 1.6% or 276 of them being unemployed. The group with the highest labor force participation rate are those with the educational attainment of bachelor's degree or higher, with 90.8% or 4,620 individuals in the labor force. Within the labor force, individuals with college / associate degree education have the highest percentage of unemployment, with 3.0% or 185 of them being unemployed.
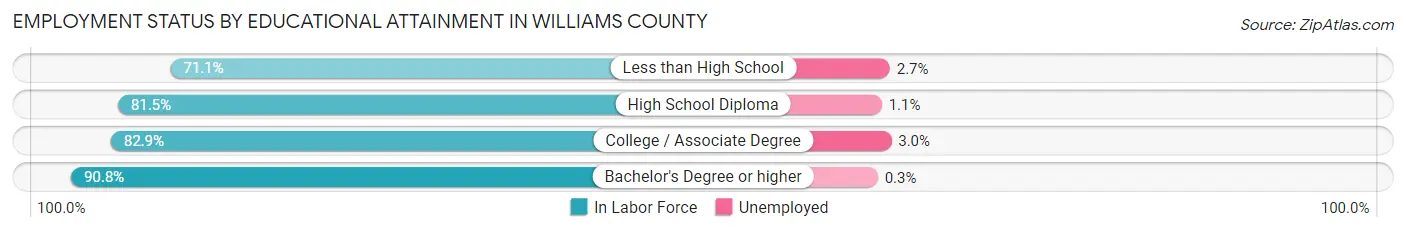
| Educational Attainment | In Labor Force | Unemployed |
| Less than High School | 1,138 (71.1%) | 43 (2.7%) |
| High School Diploma | 5,328 (81.5%) | 72 (1.1%) |
| College / Associate Degree | 6,164 (82.9%) | 223 (3.0%) |
| Bachelor's Degree or higher | 4,620 (90.8%) | 15 (0.3%) |
| Total | 17,251 (83.5%) | 331 (1.6%) |
Employment Occupations by Sex in Williams County
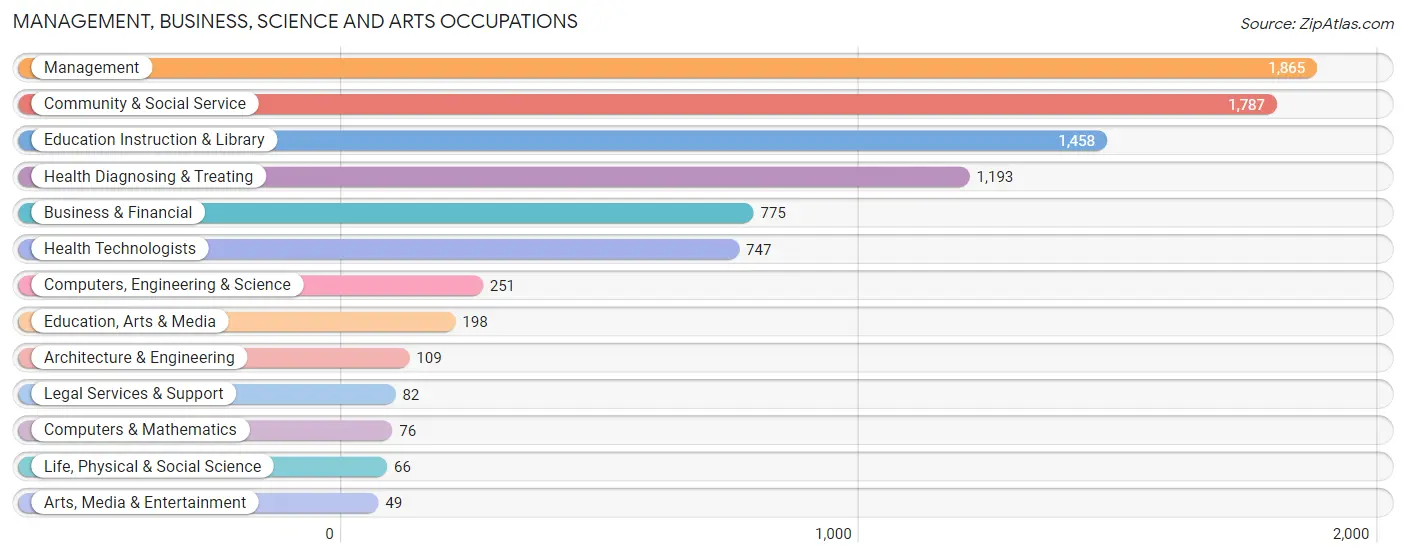
Management, Business, Science and Arts Occupations
The most common Management, Business, Science and Arts occupations in Williams County are Management (1,865 | 9.2%), Community & Social Service (1,787 | 8.8%), Education Instruction & Library (1,458 | 7.2%), Health Diagnosing & Treating (1,193 | 5.9%), and Business & Financial (775 | 3.8%).
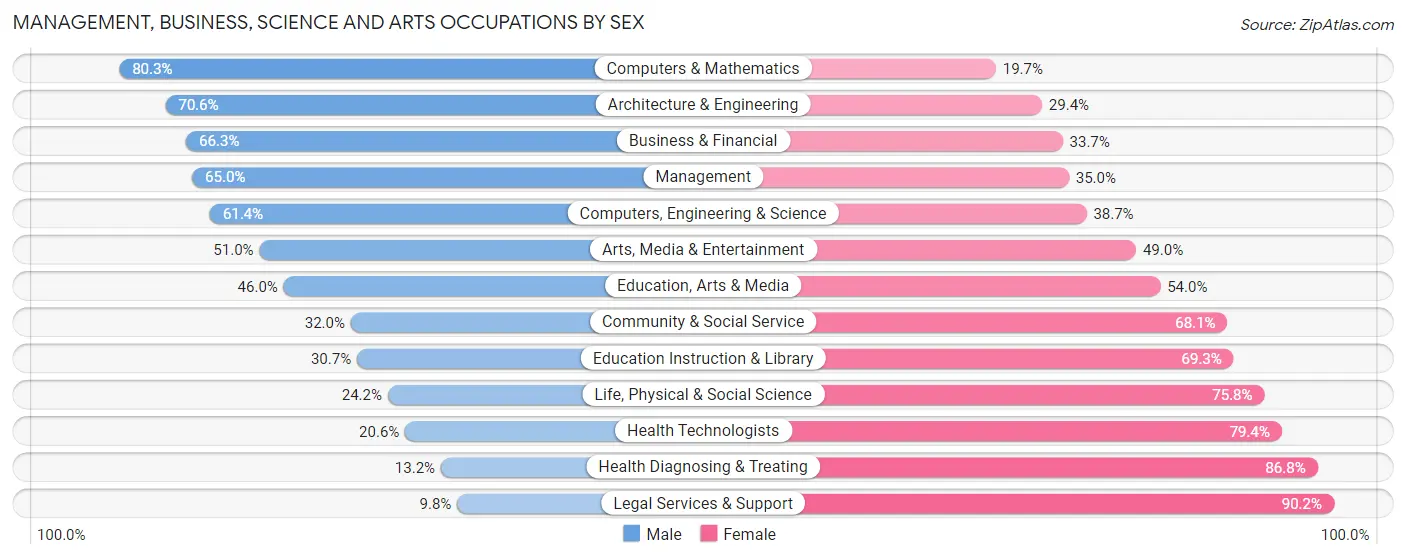
Management, Business, Science and Arts Occupations by Sex
Within the Management, Business, Science and Arts occupations in Williams County, the most male-oriented occupations are Computers & Mathematics (80.3%), Architecture & Engineering (70.6%), and Business & Financial (66.3%), while the most female-oriented occupations are Legal Services & Support (90.2%), Health Diagnosing & Treating (86.8%), and Health Technologists (79.4%).
| Occupation | Male | Female |
| Management | 1,213 (65.0%) | 652 (35.0%) |
| Business & Financial | 514 (66.3%) | 261 (33.7%) |
| Computers, Engineering & Science | 154 (61.4%) | 97 (38.7%) |
| Computers & Mathematics | 61 (80.3%) | 15 (19.7%) |
| Architecture & Engineering | 77 (70.6%) | 32 (29.4%) |
| Life, Physical & Social Science | 16 (24.2%) | 50 (75.8%) |
| Community & Social Service | 571 (32.0%) | 1,216 (68.0%) |
| Education, Arts & Media | 91 (46.0%) | 107 (54.0%) |
| Legal Services & Support | 8 (9.8%) | 74 (90.2%) |
| Education Instruction & Library | 447 (30.7%) | 1,011 (69.3%) |
| Arts, Media & Entertainment | 25 (51.0%) | 24 (49.0%) |
| Health Diagnosing & Treating | 157 (13.2%) | 1,036 (86.8%) |
| Health Technologists | 154 (20.6%) | 593 (79.4%) |
| Total (Category) | 2,609 (44.4%) | 3,262 (55.6%) |
| Total (Overall) | 11,841 (58.3%) | 8,471 (41.7%) |
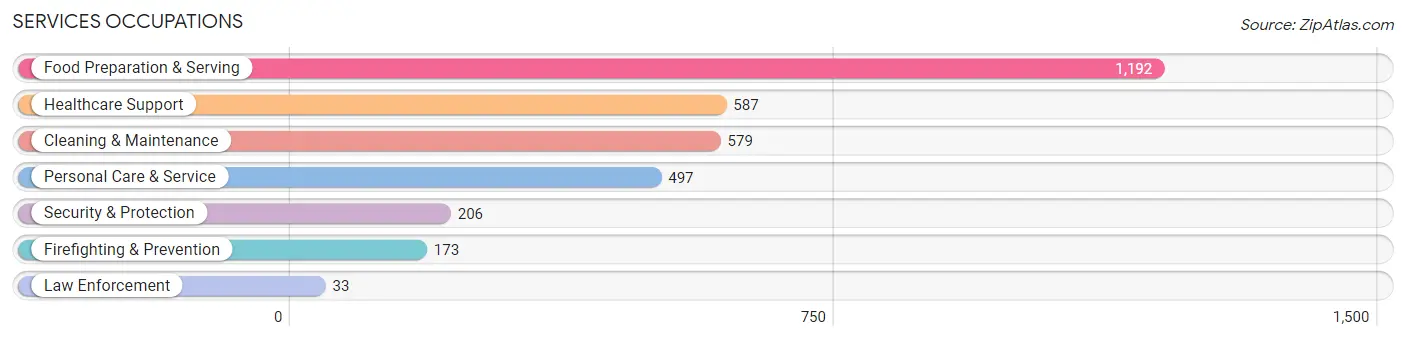
Services Occupations
The most common Services occupations in Williams County are Food Preparation & Serving (1,192 | 5.9%), Healthcare Support (587 | 2.9%), Cleaning & Maintenance (579 | 2.9%), Personal Care & Service (497 | 2.5%), and Security & Protection (206 | 1.0%).
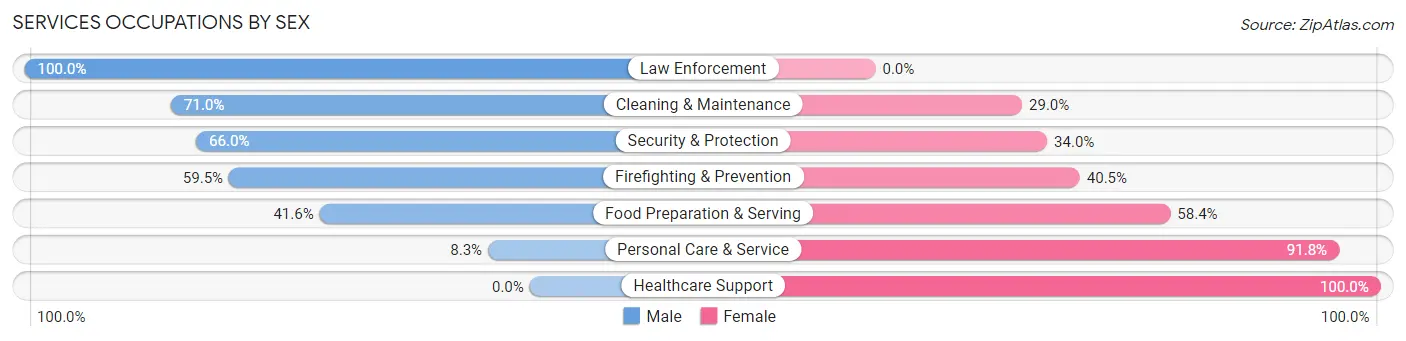
Services Occupations by Sex
Within the Services occupations in Williams County, the most male-oriented occupations are Law Enforcement (100.0%), Cleaning & Maintenance (71.0%), and Security & Protection (66.0%), while the most female-oriented occupations are Healthcare Support (100.0%), Personal Care & Service (91.7%), and Food Preparation & Serving (58.4%).
| Occupation | Male | Female |
| Healthcare Support | 0 (0.0%) | 587 (100.0%) |
| Security & Protection | 136 (66.0%) | 70 (34.0%) |
| Firefighting & Prevention | 103 (59.5%) | 70 (40.5%) |
| Law Enforcement | 33 (100.0%) | 0 (0.0%) |
| Food Preparation & Serving | 496 (41.6%) | 696 (58.4%) |
| Cleaning & Maintenance | 411 (71.0%) | 168 (29.0%) |
| Personal Care & Service | 41 (8.3%) | 456 (91.7%) |
| Total (Category) | 1,084 (35.4%) | 1,977 (64.6%) |
| Total (Overall) | 11,841 (58.3%) | 8,471 (41.7%) |
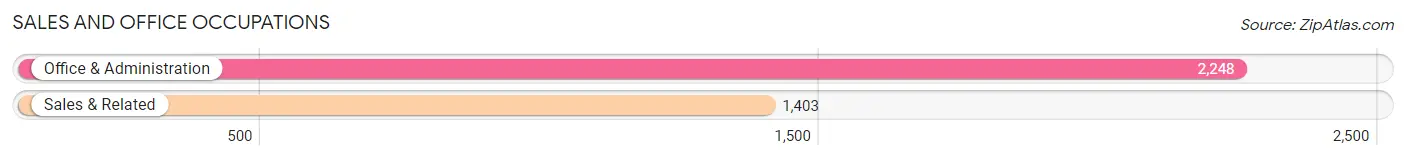
Sales and Office Occupations
The most common Sales and Office occupations in Williams County are Office & Administration (2,248 | 11.1%), and Sales & Related (1,403 | 6.9%).
Sales and Office Occupations by Sex
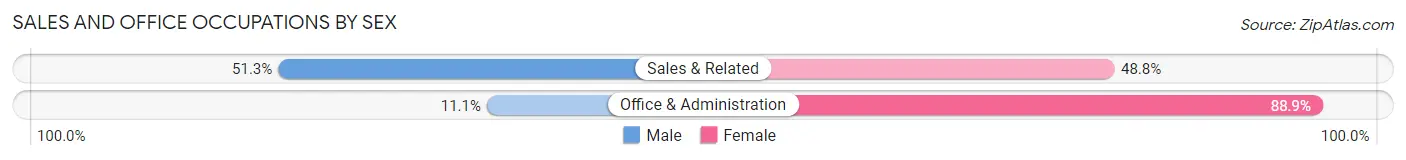
| Occupation | Male | Female |
| Sales & Related | 719 (51.2%) | 684 (48.7%) |
| Office & Administration | 250 (11.1%) | 1,998 (88.9%) |
| Total (Category) | 969 (26.5%) | 2,682 (73.5%) |
| Total (Overall) | 11,841 (58.3%) | 8,471 (41.7%) |
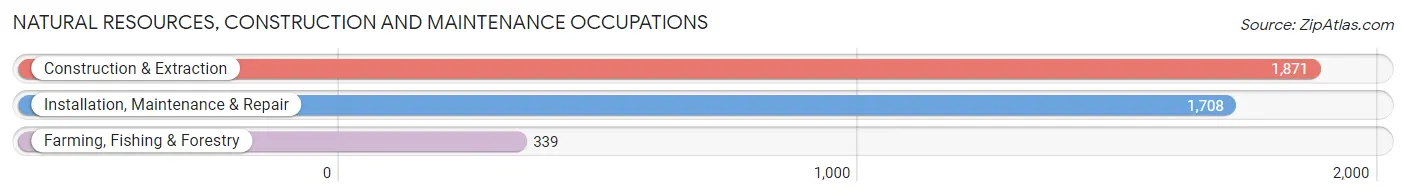
Natural Resources, Construction and Maintenance Occupations
The most common Natural Resources, Construction and Maintenance occupations in Williams County are Construction & Extraction (1,871 | 9.2%), Installation, Maintenance & Repair (1,708 | 8.4%), and Farming, Fishing & Forestry (339 | 1.7%).
Natural Resources, Construction and Maintenance Occupations by Sex
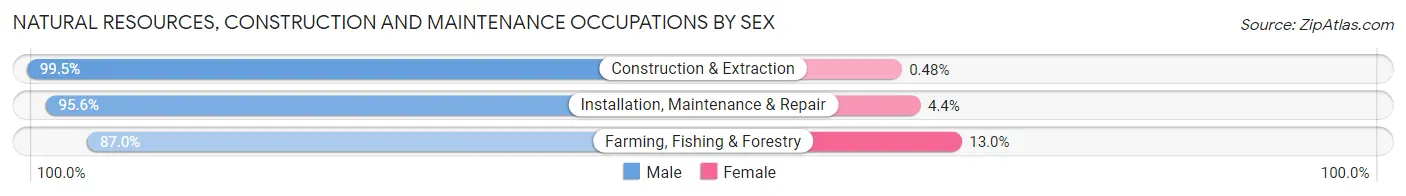
| Occupation | Male | Female |
| Farming, Fishing & Forestry | 295 (87.0%) | 44 (13.0%) |
| Construction & Extraction | 1,862 (99.5%) | 9 (0.5%) |
| Installation, Maintenance & Repair | 1,633 (95.6%) | 75 (4.4%) |
| Total (Category) | 3,790 (96.7%) | 128 (3.3%) |
| Total (Overall) | 11,841 (58.3%) | 8,471 (41.7%) |
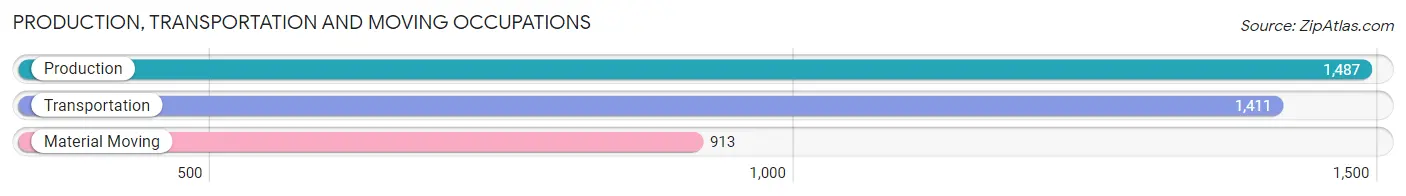
Production, Transportation and Moving Occupations
The most common Production, Transportation and Moving occupations in Williams County are Production (1,487 | 7.3%), Transportation (1,411 | 7.0%), and Material Moving (913 | 4.5%).
Production, Transportation and Moving Occupations by Sex
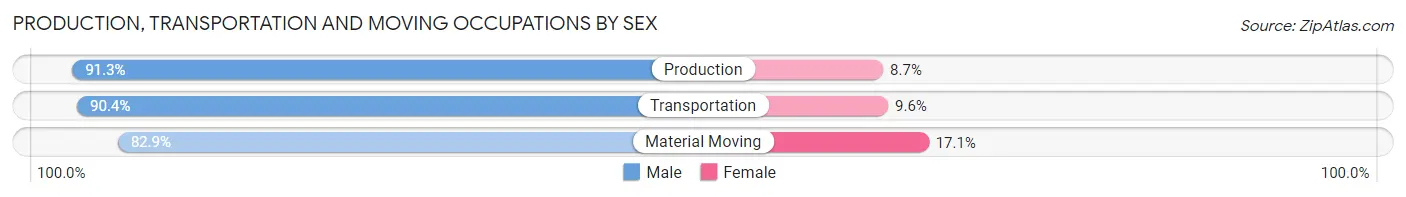
| Occupation | Male | Female |
| Production | 1,357 (91.3%) | 130 (8.7%) |
| Transportation | 1,275 (90.4%) | 136 (9.6%) |
| Material Moving | 757 (82.9%) | 156 (17.1%) |
| Total (Category) | 3,389 (88.9%) | 422 (11.1%) |
| Total (Overall) | 11,841 (58.3%) | 8,471 (41.7%) |
Employment Industries by Sex in Williams County
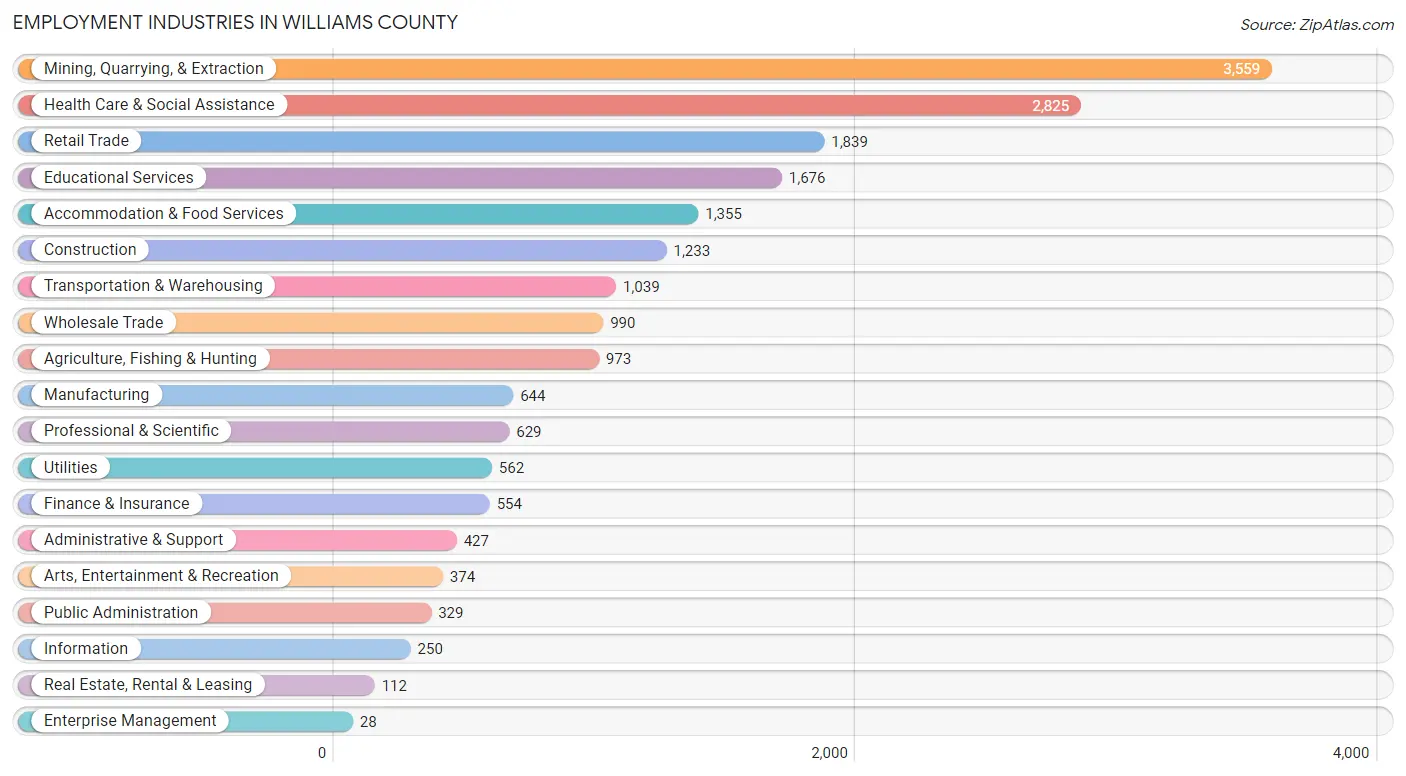
Employment Industries in Williams County
The major employment industries in Williams County include Mining, Quarrying, & Extraction (3,559 | 17.5%), Health Care & Social Assistance (2,825 | 13.9%), Retail Trade (1,839 | 9.0%), Educational Services (1,676 | 8.3%), and Accommodation & Food Services (1,355 | 6.7%).
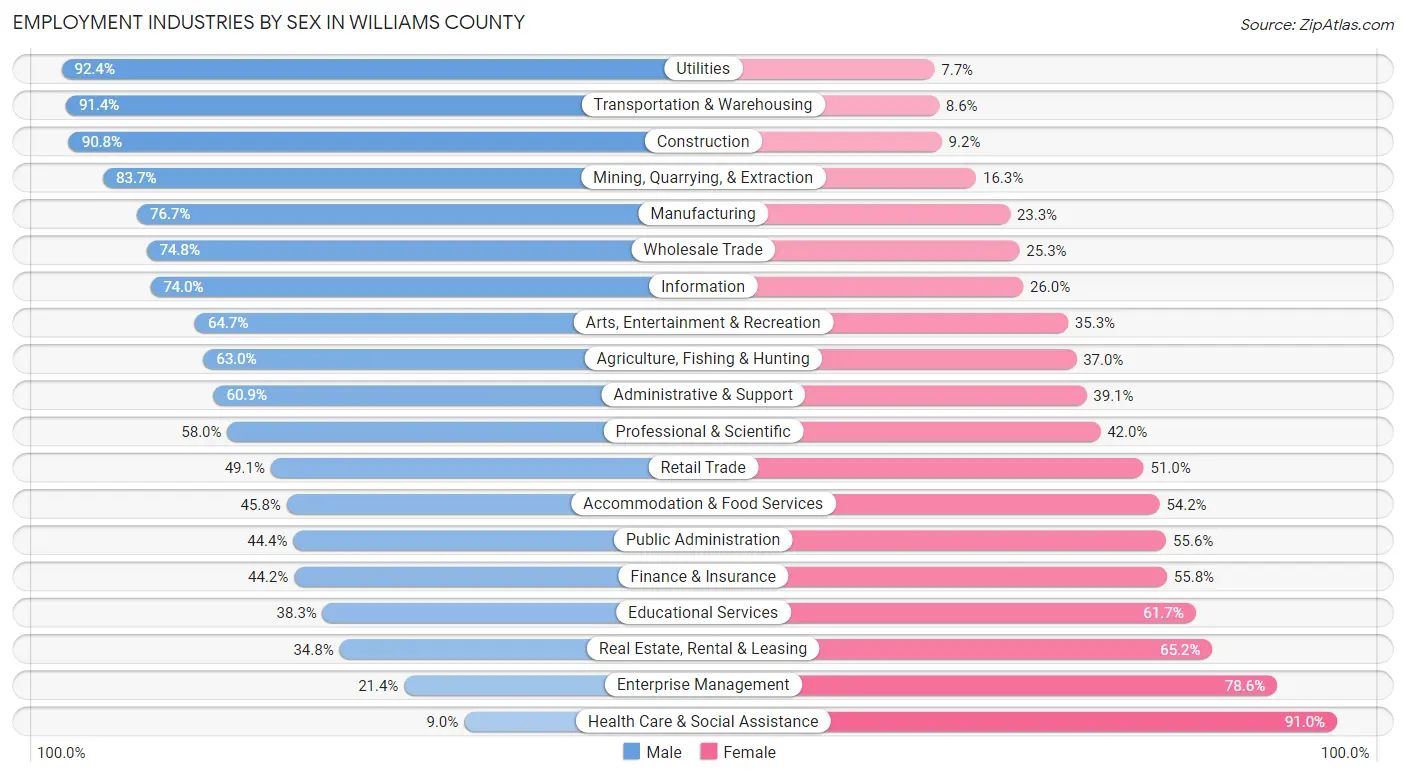
Employment Industries by Sex in Williams County
The Williams County industries that see more men than women are Utilities (92.3%), Transportation & Warehousing (91.4%), and Construction (90.8%), whereas the industries that tend to have a higher number of women are Health Care & Social Assistance (91.0%), Enterprise Management (78.6%), and Real Estate, Rental & Leasing (65.2%).
| Industry | Male | Female |
| Agriculture, Fishing & Hunting | 613 (63.0%) | 360 (37.0%) |
| Mining, Quarrying, & Extraction | 2,980 (83.7%) | 579 (16.3%) |
| Construction | 1,120 (90.8%) | 113 (9.2%) |
| Manufacturing | 494 (76.7%) | 150 (23.3%) |
| Wholesale Trade | 740 (74.8%) | 250 (25.3%) |
| Retail Trade | 902 (49.0%) | 937 (50.9%) |
| Transportation & Warehousing | 950 (91.4%) | 89 (8.6%) |
| Utilities | 519 (92.3%) | 43 (7.6%) |
| Information | 185 (74.0%) | 65 (26.0%) |
| Finance & Insurance | 245 (44.2%) | 309 (55.8%) |
| Real Estate, Rental & Leasing | 39 (34.8%) | 73 (65.2%) |
| Professional & Scientific | 365 (58.0%) | 264 (42.0%) |
| Enterprise Management | 6 (21.4%) | 22 (78.6%) |
| Administrative & Support | 260 (60.9%) | 167 (39.1%) |
| Educational Services | 642 (38.3%) | 1,034 (61.7%) |
| Health Care & Social Assistance | 255 (9.0%) | 2,570 (91.0%) |
| Arts, Entertainment & Recreation | 242 (64.7%) | 132 (35.3%) |
| Accommodation & Food Services | 620 (45.8%) | 735 (54.2%) |
| Public Administration | 146 (44.4%) | 183 (55.6%) |
| Total | 11,841 (58.3%) | 8,471 (41.7%) |
Education in Williams County
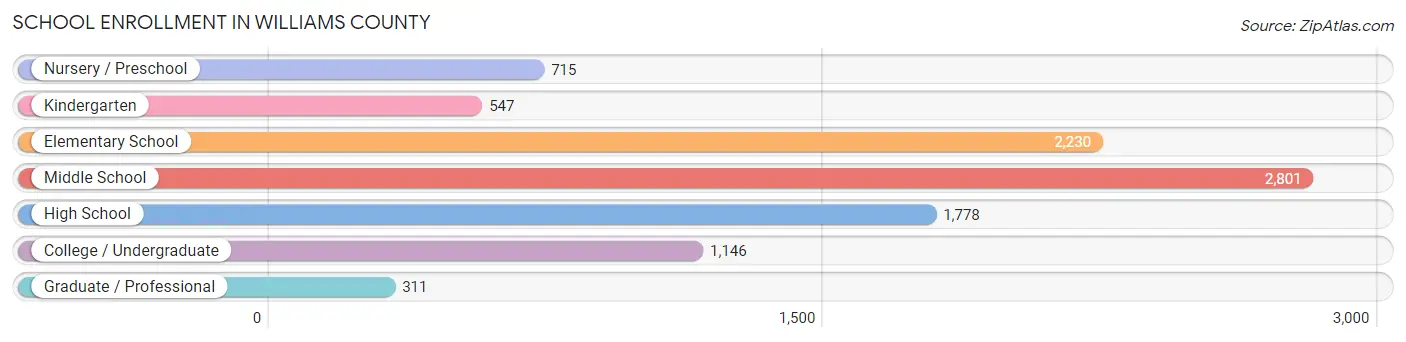
School Enrollment in Williams County
The most common levels of schooling among the 9,528 students in Williams County are middle school (2,801 | 29.4%), elementary school (2,230 | 23.4%), and high school (1,778 | 18.7%).
| School Level | # Students | % Students |
| Nursery / Preschool | 715 | 7.5% |
| Kindergarten | 547 | 5.7% |
| Elementary School | 2,230 | 23.4% |
| Middle School | 2,801 | 29.4% |
| High School | 1,778 | 18.7% |
| College / Undergraduate | 1,146 | 12.0% |
| Graduate / Professional | 311 | 3.3% |
| Total | 9,528 | 100.0% |
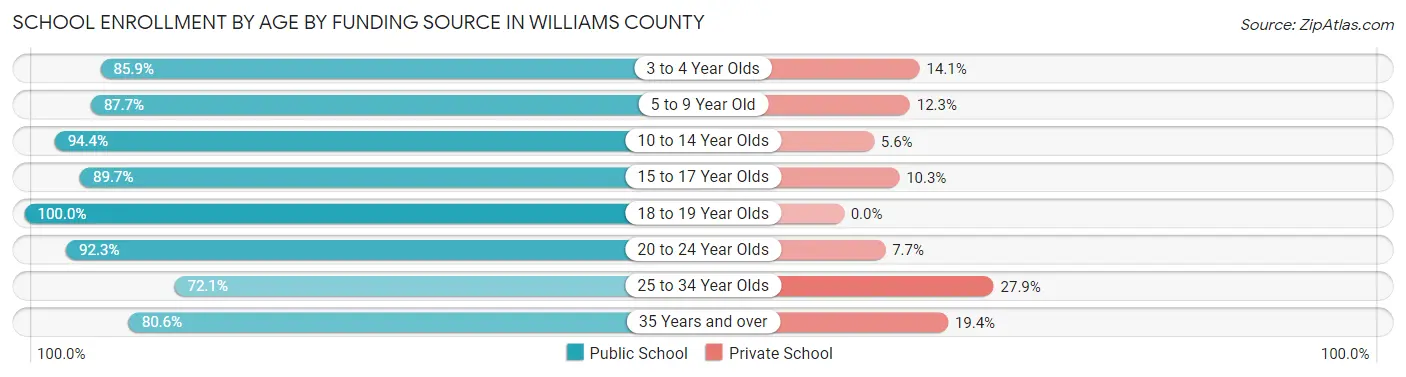
School Enrollment by Age by Funding Source in Williams County
Out of a total of 9,528 students who are enrolled in schools in Williams County, 915 (9.6%) attend a private institution, while the remaining 8,613 (90.4%) are enrolled in public schools. The age group of 25 to 34 year olds has the highest likelihood of being enrolled in private schools, with 62 (27.9% in the age bracket) enrolled. Conversely, the age group of 18 to 19 year olds has the lowest likelihood of being enrolled in a private school, with 548 (100.0% in the age bracket) attending a public institution.
| Age Bracket | Public School | Private School |
| 3 to 4 Year Olds | 419 (85.9%) | 69 (14.1%) |
| 5 to 9 Year Old | 2,299 (87.7%) | 323 (12.3%) |
| 10 to 14 Year Olds | 3,240 (94.4%) | 193 (5.6%) |
| 15 to 17 Year Olds | 1,119 (89.7%) | 129 (10.3%) |
| 18 to 19 Year Olds | 548 (100.0%) | 0 (0.0%) |
| 20 to 24 Year Olds | 417 (92.3%) | 35 (7.7%) |
| 25 to 34 Year Olds | 160 (72.1%) | 62 (27.9%) |
| 35 Years and over | 415 (80.6%) | 100 (19.4%) |
| Total | 8,613 (90.4%) | 915 (9.6%) |
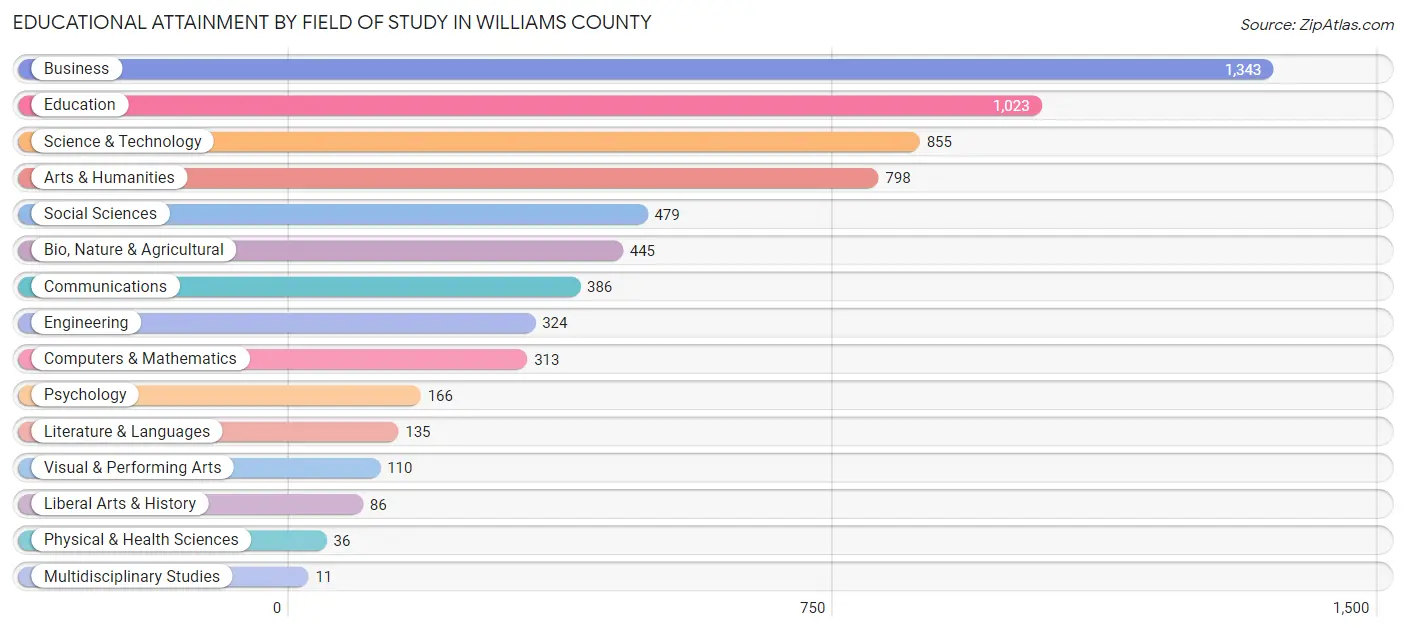
Educational Attainment by Field of Study in Williams County
Business (1,343 | 20.6%), education (1,023 | 15.7%), science & technology (855 | 13.1%), arts & humanities (798 | 12.3%), and social sciences (479 | 7.4%) are the most common fields of study among 6,510 individuals in Williams County who have obtained a bachelor's degree or higher.
| Field of Study | # Graduates | % Graduates |
| Computers & Mathematics | 313 | 4.8% |
| Bio, Nature & Agricultural | 445 | 6.8% |
| Physical & Health Sciences | 36 | 0.5% |
| Psychology | 166 | 2.5% |
| Social Sciences | 479 | 7.4% |
| Engineering | 324 | 5.0% |
| Multidisciplinary Studies | 11 | 0.2% |
| Science & Technology | 855 | 13.1% |
| Business | 1,343 | 20.6% |
| Education | 1,023 | 15.7% |
| Literature & Languages | 135 | 2.1% |
| Liberal Arts & History | 86 | 1.3% |
| Visual & Performing Arts | 110 | 1.7% |
| Communications | 386 | 5.9% |
| Arts & Humanities | 798 | 12.3% |
| Total | 6,510 | 100.0% |
Transportation & Commute in Williams County
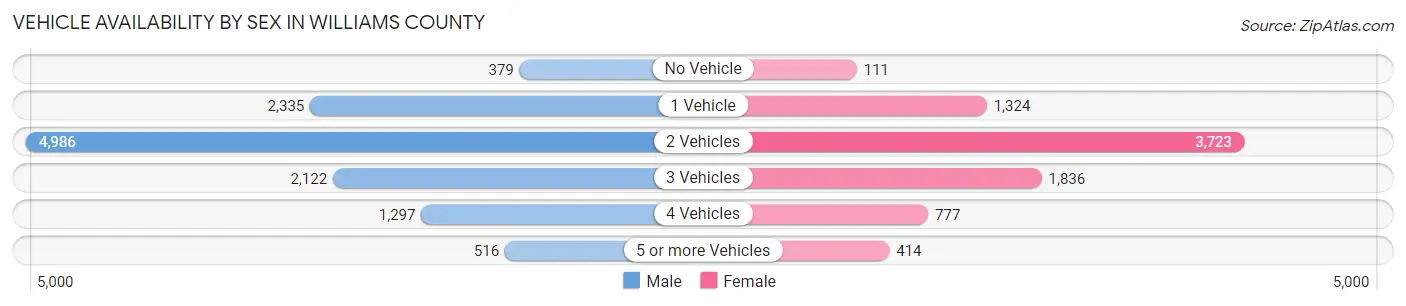
Vehicle Availability by Sex in Williams County
The most prevalent vehicle ownership categories in Williams County are males with 2 vehicles (4,986, accounting for 42.8%) and females with 2 vehicles (3,723, making up 60.9%).
| Vehicles Available | Male | Female |
| No Vehicle | 379 (3.3%) | 111 (1.4%) |
| 1 Vehicle | 2,335 (20.1%) | 1,324 (16.2%) |
| 2 Vehicles | 4,986 (42.8%) | 3,723 (45.5%) |
| 3 Vehicles | 2,122 (18.2%) | 1,836 (22.4%) |
| 4 Vehicles | 1,297 (11.2%) | 777 (9.5%) |
| 5 or more Vehicles | 516 (4.4%) | 414 (5.1%) |
| Total | 11,635 (100.0%) | 8,185 (100.0%) |
Commute Time in Williams County
The most frequently occuring commute durations in Williams County are 10 to 14 minutes (5,027 commuters, 26.0%), 15 to 19 minutes (4,419 commuters, 22.8%), and 5 to 9 minutes (3,785 commuters, 19.6%).
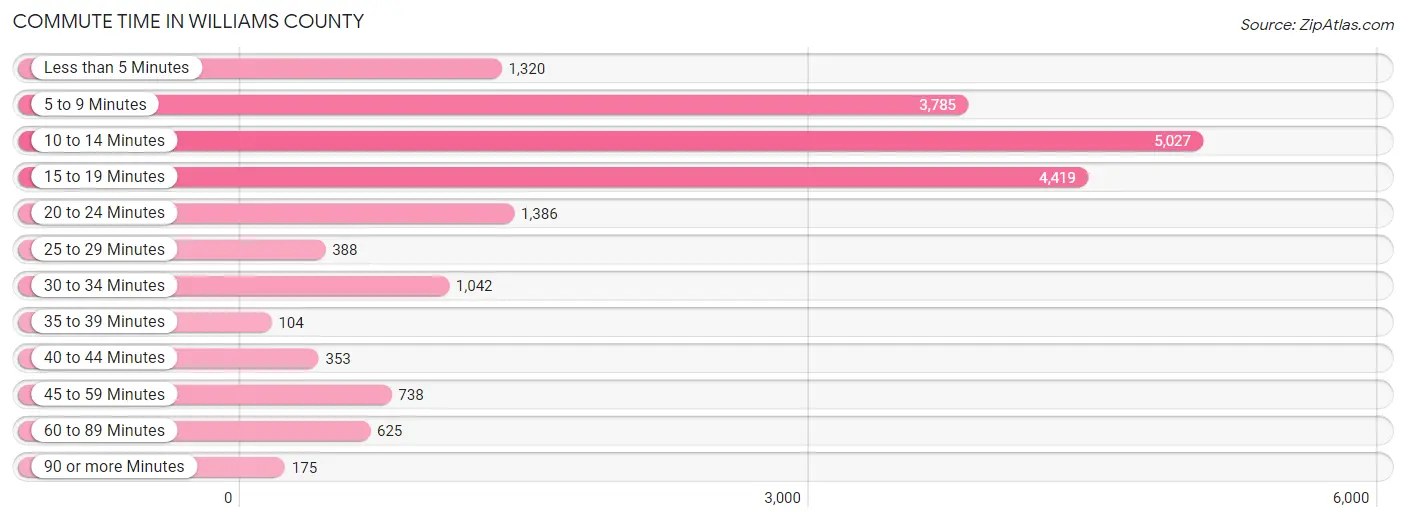
| Commute Time | # Commuters | % Commuters |
| Less than 5 Minutes | 1,320 | 6.8% |
| 5 to 9 Minutes | 3,785 | 19.6% |
| 10 to 14 Minutes | 5,027 | 26.0% |
| 15 to 19 Minutes | 4,419 | 22.8% |
| 20 to 24 Minutes | 1,386 | 7.2% |
| 25 to 29 Minutes | 388 | 2.0% |
| 30 to 34 Minutes | 1,042 | 5.4% |
| 35 to 39 Minutes | 104 | 0.5% |
| 40 to 44 Minutes | 353 | 1.8% |
| 45 to 59 Minutes | 738 | 3.8% |
| 60 to 89 Minutes | 625 | 3.2% |
| 90 or more Minutes | 175 | 0.9% |
Commute Time by Sex in Williams County
The most common commute times in Williams County are 15 to 19 minutes (3,146 commuters, 27.9%) for males and 10 to 14 minutes (2,654 commuters, 32.9%) for females.
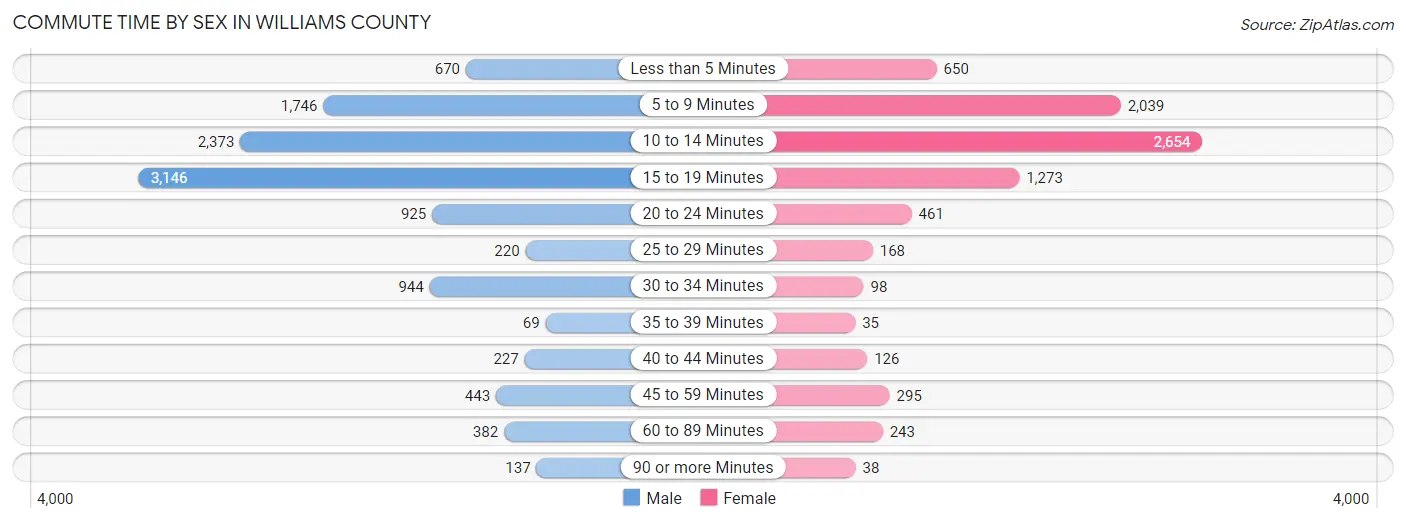
| Commute Time | Male | Female |
| Less than 5 Minutes | 670 (5.9%) | 650 (8.0%) |
| 5 to 9 Minutes | 1,746 (15.5%) | 2,039 (25.2%) |
| 10 to 14 Minutes | 2,373 (21.0%) | 2,654 (32.9%) |
| 15 to 19 Minutes | 3,146 (27.9%) | 1,273 (15.8%) |
| 20 to 24 Minutes | 925 (8.2%) | 461 (5.7%) |
| 25 to 29 Minutes | 220 (1.9%) | 168 (2.1%) |
| 30 to 34 Minutes | 944 (8.4%) | 98 (1.2%) |
| 35 to 39 Minutes | 69 (0.6%) | 35 (0.4%) |
| 40 to 44 Minutes | 227 (2.0%) | 126 (1.6%) |
| 45 to 59 Minutes | 443 (3.9%) | 295 (3.6%) |
| 60 to 89 Minutes | 382 (3.4%) | 243 (3.0%) |
| 90 or more Minutes | 137 (1.2%) | 38 (0.5%) |
Time of Departure to Work by Sex in Williams County
The most frequent times of departure to work in Williams County are 7:30 AM to 7:59 AM (2,082, 18.4%) for males and 7:30 AM to 7:59 AM (2,463, 30.5%) for females.
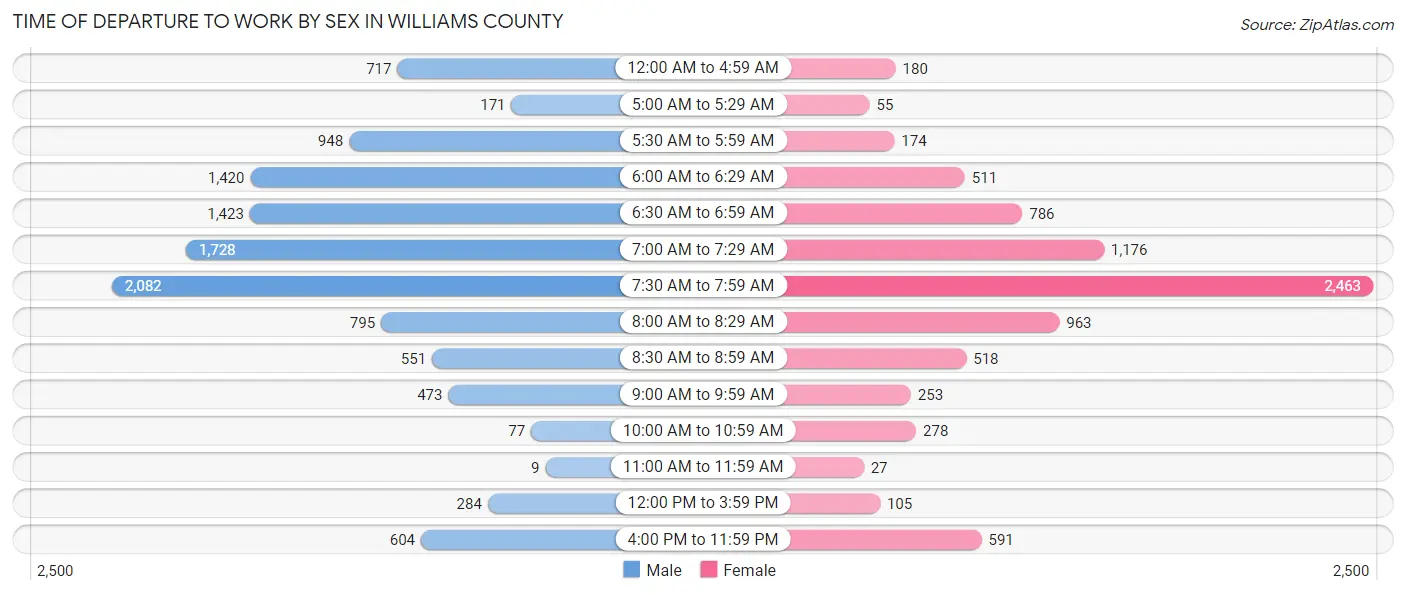
| Time of Departure | Male | Female |
| 12:00 AM to 4:59 AM | 717 (6.4%) | 180 (2.2%) |
| 5:00 AM to 5:29 AM | 171 (1.5%) | 55 (0.7%) |
| 5:30 AM to 5:59 AM | 948 (8.4%) | 174 (2.1%) |
| 6:00 AM to 6:29 AM | 1,420 (12.6%) | 511 (6.3%) |
| 6:30 AM to 6:59 AM | 1,423 (12.6%) | 786 (9.7%) |
| 7:00 AM to 7:29 AM | 1,728 (15.3%) | 1,176 (14.5%) |
| 7:30 AM to 7:59 AM | 2,082 (18.4%) | 2,463 (30.5%) |
| 8:00 AM to 8:29 AM | 795 (7.0%) | 963 (11.9%) |
| 8:30 AM to 8:59 AM | 551 (4.9%) | 518 (6.4%) |
| 9:00 AM to 9:59 AM | 473 (4.2%) | 253 (3.1%) |
| 10:00 AM to 10:59 AM | 77 (0.7%) | 278 (3.4%) |
| 11:00 AM to 11:59 AM | 9 (0.1%) | 27 (0.3%) |
| 12:00 PM to 3:59 PM | 284 (2.5%) | 105 (1.3%) |
| 4:00 PM to 11:59 PM | 604 (5.3%) | 591 (7.3%) |
| Total | 11,282 (100.0%) | 8,080 (100.0%) |
Housing Occupancy in Williams County
Occupancy by Ownership in Williams County
Of the total 15,599 dwellings in Williams County, owner-occupied units account for 8,375 (53.7%), while renter-occupied units make up 7,224 (46.3%).
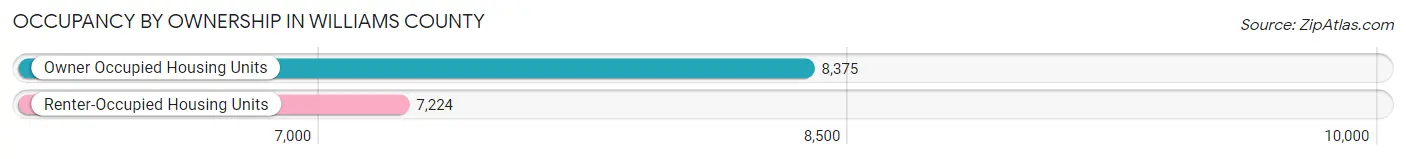
| Occupancy | # Housing Units | % Housing Units |
| Owner Occupied Housing Units | 8,375 | 53.7% |
| Renter-Occupied Housing Units | 7,224 | 46.3% |
| Total Occupied Housing Units | 15,599 | 100.0% |
Occupancy by Household Size in Williams County
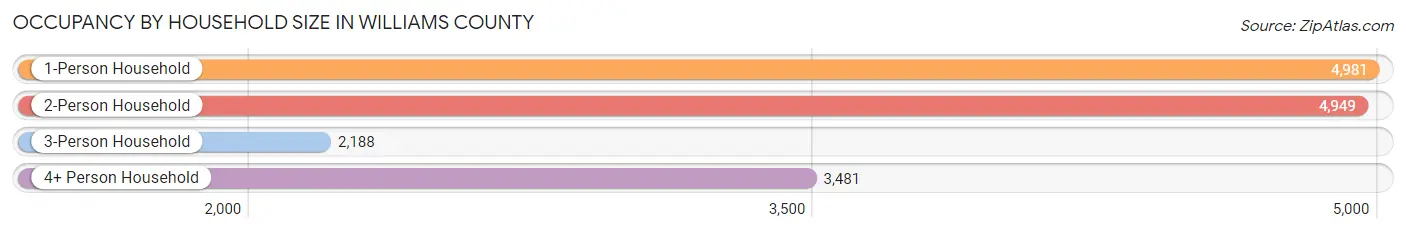
| Household Size | # Housing Units | % Housing Units |
| 1-Person Household | 4,981 | 31.9% |
| 2-Person Household | 4,949 | 31.7% |
| 3-Person Household | 2,188 | 14.0% |
| 4+ Person Household | 3,481 | 22.3% |
| Total Housing Units | 15,599 | 100.0% |
Occupancy by Ownership by Household Size in Williams County
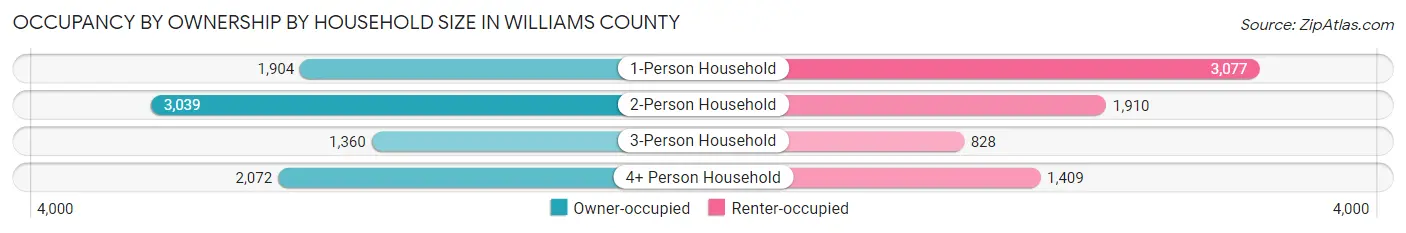
| Household Size | Owner-occupied | Renter-occupied |
| 1-Person Household | 1,904 (38.2%) | 3,077 (61.8%) |
| 2-Person Household | 3,039 (61.4%) | 1,910 (38.6%) |
| 3-Person Household | 1,360 (62.2%) | 828 (37.8%) |
| 4+ Person Household | 2,072 (59.5%) | 1,409 (40.5%) |
| Total Housing Units | 8,375 (53.7%) | 7,224 (46.3%) |
Occupancy by Educational Attainment in Williams County
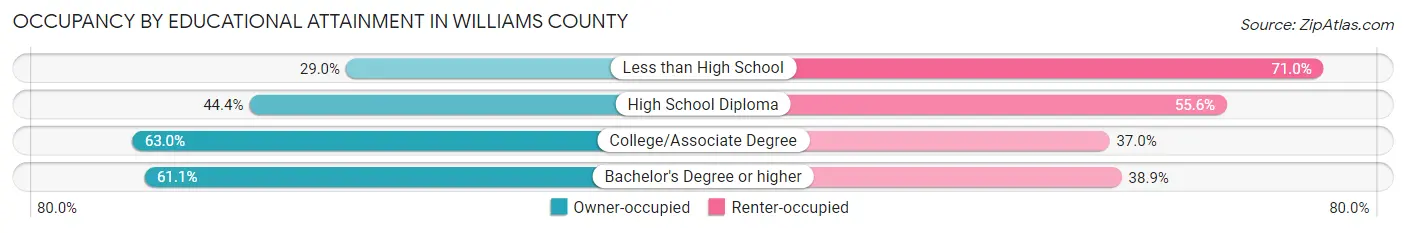
| Household Size | Owner-occupied | Renter-occupied |
| Less than High School | 413 (29.0%) | 1,009 (71.0%) |
| High School Diploma | 2,120 (44.4%) | 2,658 (55.6%) |
| College/Associate Degree | 3,360 (63.0%) | 1,974 (37.0%) |
| Bachelor's Degree or higher | 2,482 (61.1%) | 1,583 (38.9%) |
Occupancy by Age of Householder in Williams County
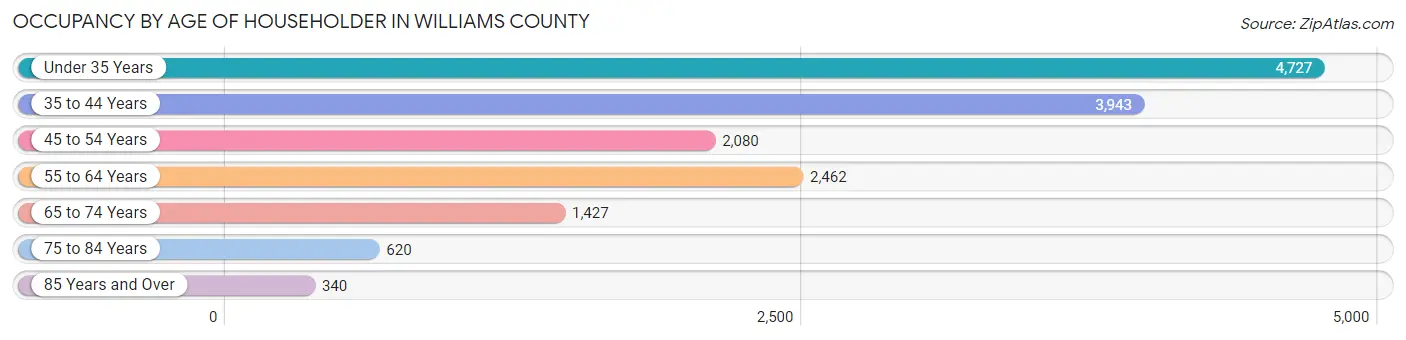
| Age Bracket | # Households | % Households |
| Under 35 Years | 4,727 | 30.3% |
| 35 to 44 Years | 3,943 | 25.3% |
| 45 to 54 Years | 2,080 | 13.3% |
| 55 to 64 Years | 2,462 | 15.8% |
| 65 to 74 Years | 1,427 | 9.1% |
| 75 to 84 Years | 620 | 4.0% |
| 85 Years and Over | 340 | 2.2% |
| Total | 15,599 | 100.0% |
Housing Finances in Williams County
Median Income by Occupancy in Williams County
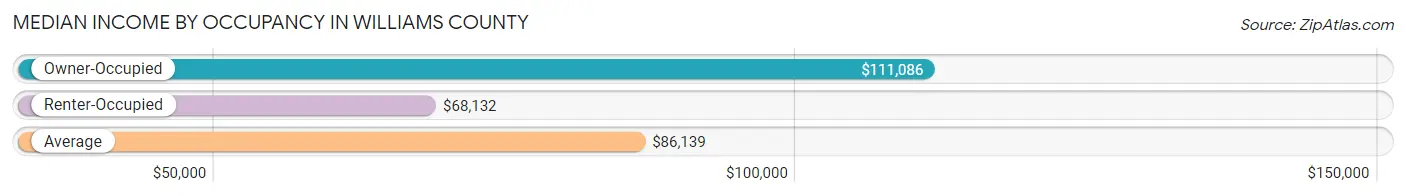
| Occupancy Type | # Households | Median Income |
| Owner-Occupied | 8,375 (53.7%) | $111,086 |
| Renter-Occupied | 7,224 (46.3%) | $68,132 |
| Average | 15,599 (100.0%) | $86,139 |
Occupancy by Householder Income Bracket in Williams County
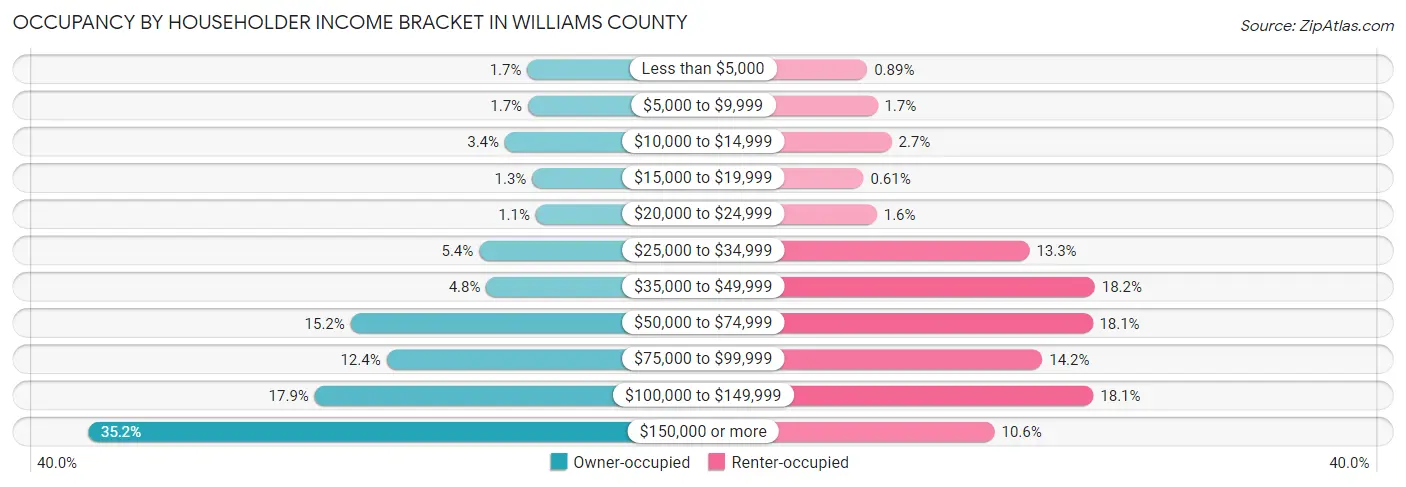
| Income Bracket | Owner-occupied | Renter-occupied |
| Less than $5,000 | 142 (1.7%) | 64 (0.9%) |
| $5,000 to $9,999 | 138 (1.7%) | 121 (1.7%) |
| $10,000 to $14,999 | 286 (3.4%) | 198 (2.7%) |
| $15,000 to $19,999 | 111 (1.3%) | 44 (0.6%) |
| $20,000 to $24,999 | 88 (1.1%) | 117 (1.6%) |
| $25,000 to $34,999 | 450 (5.4%) | 957 (13.3%) |
| $35,000 to $49,999 | 404 (4.8%) | 1,317 (18.2%) |
| $50,000 to $74,999 | 1,270 (15.2%) | 1,304 (18.0%) |
| $75,000 to $99,999 | 1,041 (12.4%) | 1,028 (14.2%) |
| $100,000 to $149,999 | 1,499 (17.9%) | 1,309 (18.1%) |
| $150,000 or more | 2,946 (35.2%) | 765 (10.6%) |
| Total | 8,375 (100.0%) | 7,224 (100.0%) |
Monthly Housing Cost Tiers in Williams County
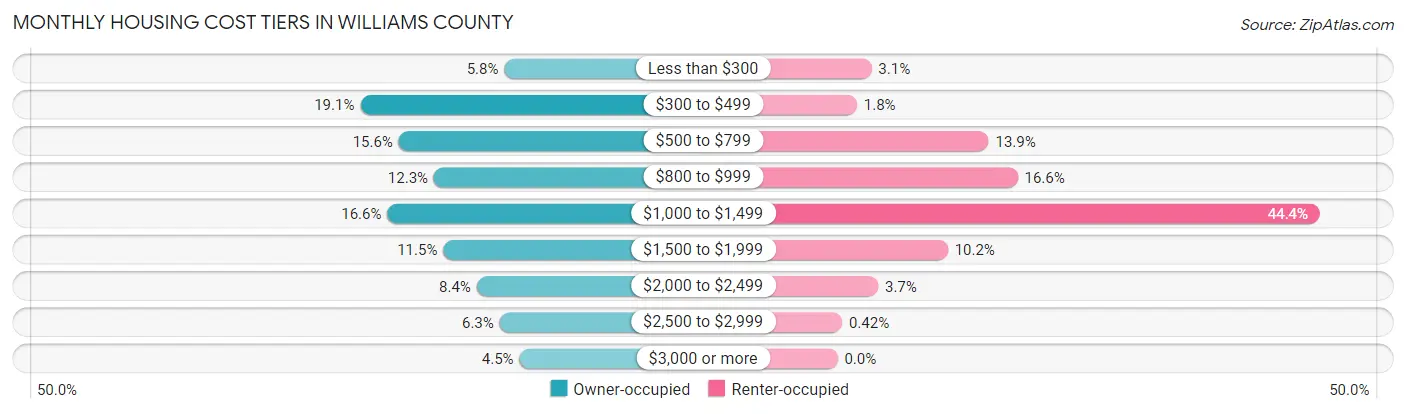
| Monthly Cost | Owner-occupied | Renter-occupied |
| Less than $300 | 489 (5.8%) | 226 (3.1%) |
| $300 to $499 | 1,600 (19.1%) | 129 (1.8%) |
| $500 to $799 | 1,303 (15.6%) | 1,005 (13.9%) |
| $800 to $999 | 1,032 (12.3%) | 1,198 (16.6%) |
| $1,000 to $1,499 | 1,391 (16.6%) | 3,208 (44.4%) |
| $1,500 to $1,999 | 960 (11.5%) | 733 (10.2%) |
| $2,000 to $2,499 | 702 (8.4%) | 270 (3.7%) |
| $2,500 to $2,999 | 525 (6.3%) | 30 (0.4%) |
| $3,000 or more | 373 (4.4%) | 0 (0.0%) |
| Total | 8,375 (100.0%) | 7,224 (100.0%) |
Physical Housing Characteristics in Williams County
Housing Structures in Williams County
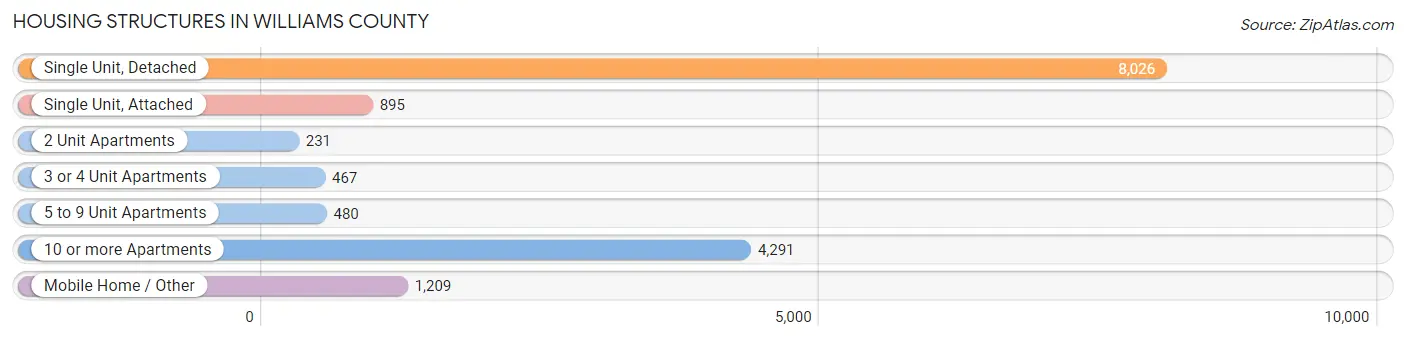
| Structure Type | # Housing Units | % Housing Units |
| Single Unit, Detached | 8,026 | 51.4% |
| Single Unit, Attached | 895 | 5.7% |
| 2 Unit Apartments | 231 | 1.5% |
| 3 or 4 Unit Apartments | 467 | 3.0% |
| 5 to 9 Unit Apartments | 480 | 3.1% |
| 10 or more Apartments | 4,291 | 27.5% |
| Mobile Home / Other | 1,209 | 7.7% |
| Total | 15,599 | 100.0% |
Housing Structures by Occupancy in Williams County
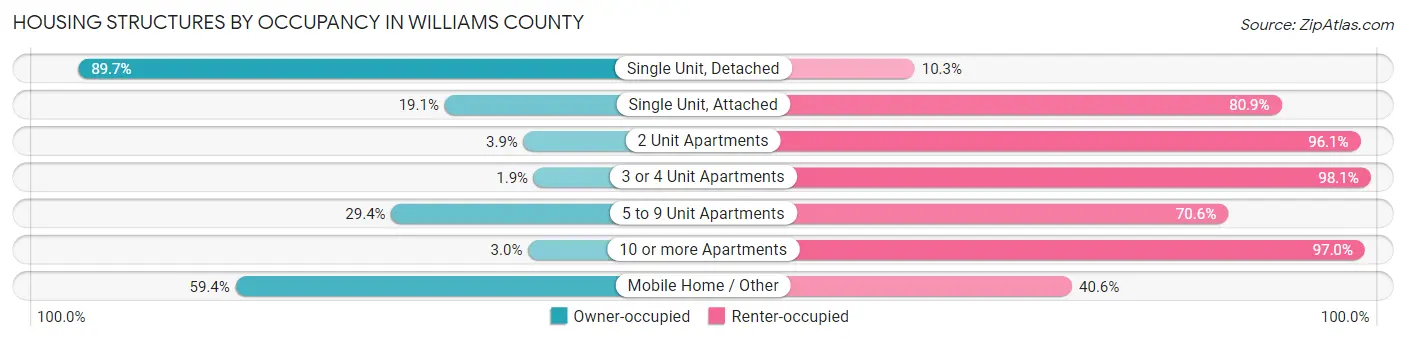
| Structure Type | Owner-occupied | Renter-occupied |
| Single Unit, Detached | 7,197 (89.7%) | 829 (10.3%) |
| Single Unit, Attached | 171 (19.1%) | 724 (80.9%) |
| 2 Unit Apartments | 9 (3.9%) | 222 (96.1%) |
| 3 or 4 Unit Apartments | 9 (1.9%) | 458 (98.1%) |
| 5 to 9 Unit Apartments | 141 (29.4%) | 339 (70.6%) |
| 10 or more Apartments | 130 (3.0%) | 4,161 (97.0%) |
| Mobile Home / Other | 718 (59.4%) | 491 (40.6%) |
| Total | 8,375 (53.7%) | 7,224 (46.3%) |
Housing Structures by Number of Rooms in Williams County
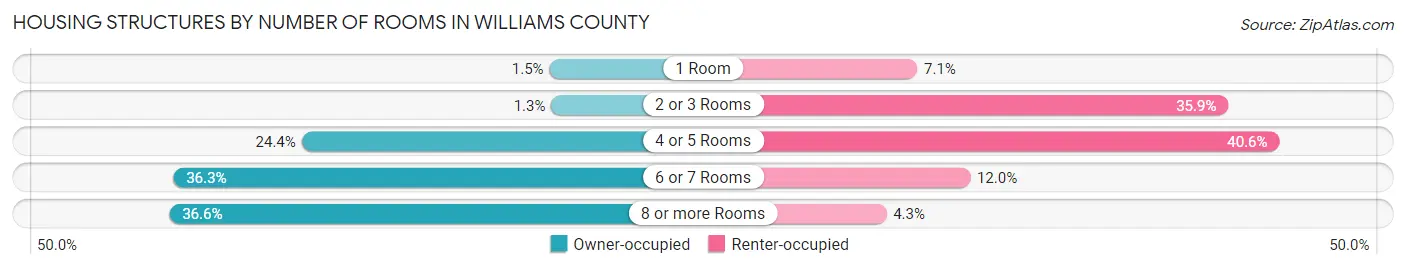
| Number of Rooms | Owner-occupied | Renter-occupied |
| 1 Room | 122 (1.5%) | 516 (7.1%) |
| 2 or 3 Rooms | 108 (1.3%) | 2,594 (35.9%) |
| 4 or 5 Rooms | 2,042 (24.4%) | 2,936 (40.6%) |
| 6 or 7 Rooms | 3,036 (36.2%) | 869 (12.0%) |
| 8 or more Rooms | 3,067 (36.6%) | 309 (4.3%) |
| Total | 8,375 (100.0%) | 7,224 (100.0%) |
Housing Structure by Heating Type in Williams County
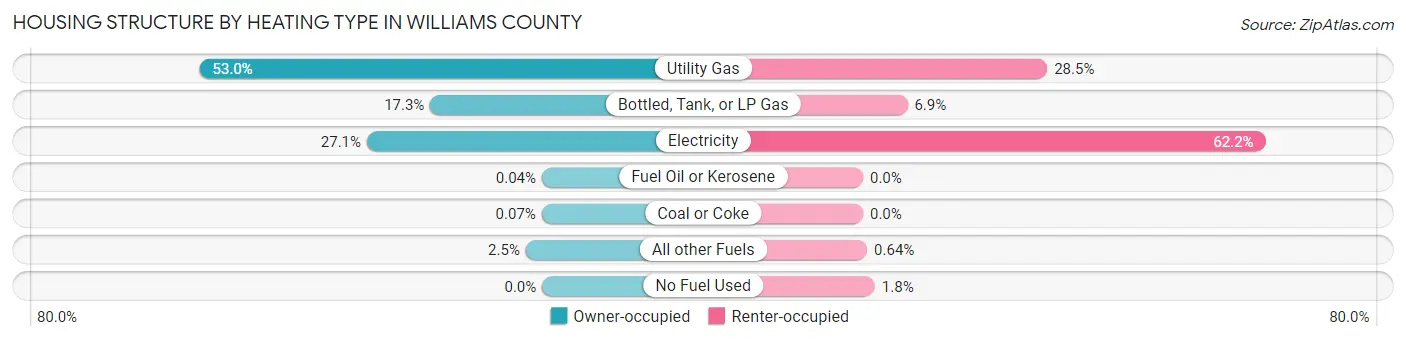
| Heating Type | Owner-occupied | Renter-occupied |
| Utility Gas | 4,436 (53.0%) | 2,057 (28.5%) |
| Bottled, Tank, or LP Gas | 1,449 (17.3%) | 496 (6.9%) |
| Electricity | 2,269 (27.1%) | 4,493 (62.2%) |
| Fuel Oil or Kerosene | 3 (0.0%) | 0 (0.0%) |
| Coal or Coke | 6 (0.1%) | 0 (0.0%) |
| All other Fuels | 212 (2.5%) | 46 (0.6%) |
| No Fuel Used | 0 (0.0%) | 132 (1.8%) |
| Total | 8,375 (100.0%) | 7,224 (100.0%) |
Household Vehicle Usage in Williams County
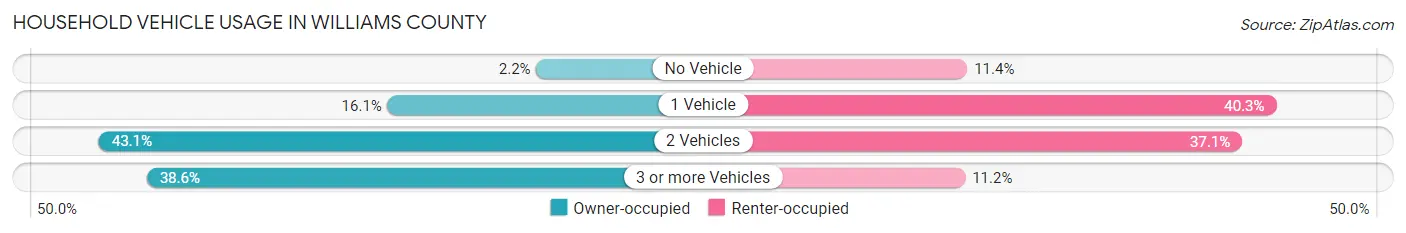
| Vehicles per Household | Owner-occupied | Renter-occupied |
| No Vehicle | 186 (2.2%) | 825 (11.4%) |
| 1 Vehicle | 1,349 (16.1%) | 2,909 (40.3%) |
| 2 Vehicles | 3,607 (43.1%) | 2,679 (37.1%) |
| 3 or more Vehicles | 3,233 (38.6%) | 811 (11.2%) |
| Total | 8,375 (100.0%) | 7,224 (100.0%) |
Real Estate & Mortgages in Williams County
Real Estate and Mortgage Overview in Williams County
| Characteristic | Without Mortgage | With Mortgage |
| Housing Units | 4,149 | 4,226 |
| Median Property Value | $233,300 | $276,800 |
| Median Household Income | $79,911 | $1,747 |
| Monthly Housing Costs | $512 | $373 |
| Real Estate Taxes | $1,545 | $177 |
Property Value by Mortgage Status in Williams County
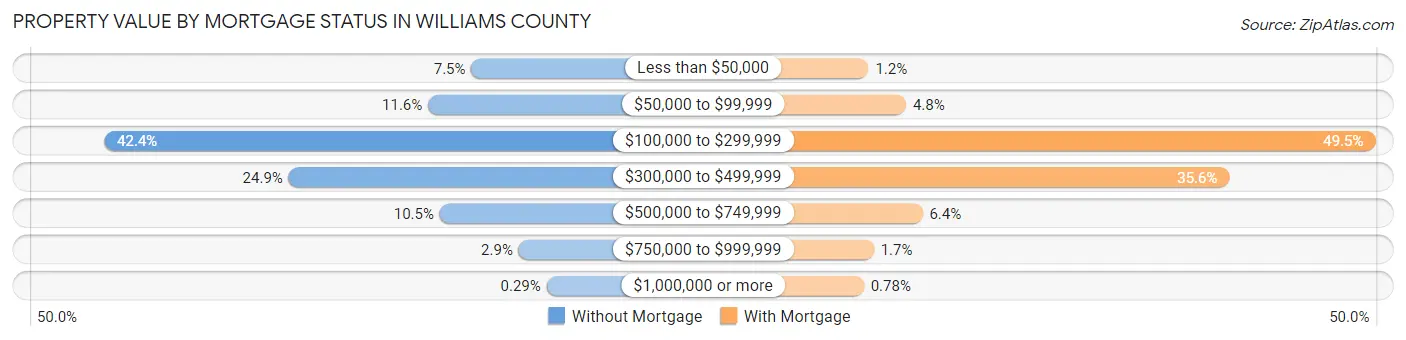
| Property Value | Without Mortgage | With Mortgage |
| Less than $50,000 | 309 (7.4%) | 52 (1.2%) |
| $50,000 to $99,999 | 480 (11.6%) | 203 (4.8%) |
| $100,000 to $299,999 | 1,761 (42.4%) | 2,092 (49.5%) |
| $300,000 to $499,999 | 1,031 (24.8%) | 1,504 (35.6%) |
| $500,000 to $749,999 | 434 (10.5%) | 269 (6.4%) |
| $750,000 to $999,999 | 122 (2.9%) | 73 (1.7%) |
| $1,000,000 or more | 12 (0.3%) | 33 (0.8%) |
| Total | 4,149 (100.0%) | 4,226 (100.0%) |
Household Income by Mortgage Status in Williams County
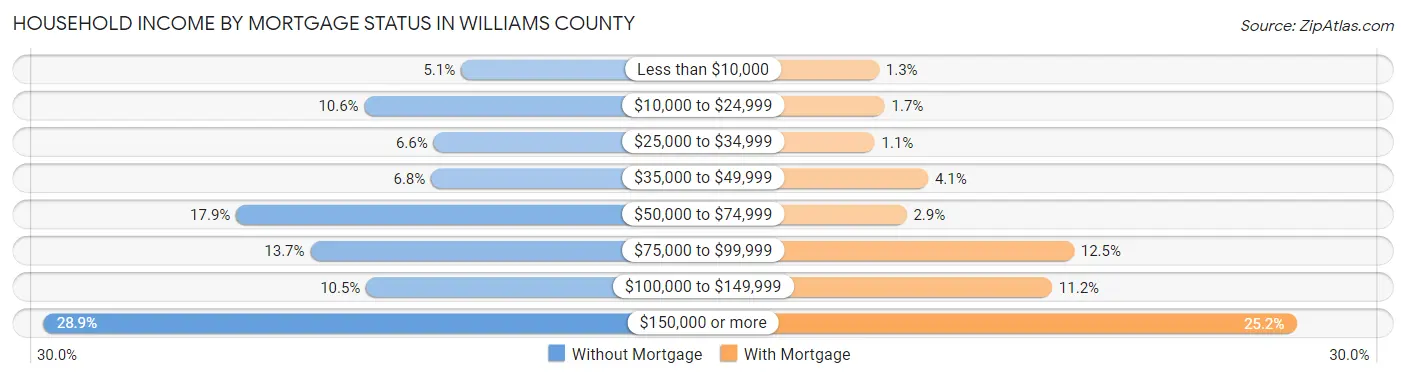
| Household Income | Without Mortgage | With Mortgage |
| Less than $10,000 | 210 (5.1%) | 56 (1.3%) |
| $10,000 to $24,999 | 439 (10.6%) | 70 (1.7%) |
| $25,000 to $34,999 | 275 (6.6%) | 46 (1.1%) |
| $35,000 to $49,999 | 281 (6.8%) | 175 (4.1%) |
| $50,000 to $74,999 | 743 (17.9%) | 123 (2.9%) |
| $75,000 to $99,999 | 567 (13.7%) | 527 (12.5%) |
| $100,000 to $149,999 | 435 (10.5%) | 474 (11.2%) |
| $150,000 or more | 1,199 (28.9%) | 1,064 (25.2%) |
| Total | 4,149 (100.0%) | 4,226 (100.0%) |
Property Value to Household Income Ratio in Williams County
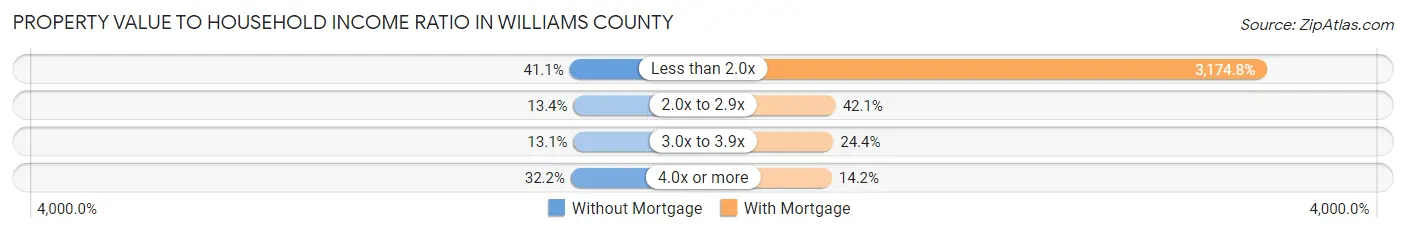
| Value-to-Income Ratio | Without Mortgage | With Mortgage |
| Less than 2.0x | 1,703 (41.0%) | 134,167 (3,174.8%) |
| 2.0x to 2.9x | 557 (13.4%) | 1,780 (42.1%) |
| 3.0x to 3.9x | 545 (13.1%) | 1,033 (24.4%) |
| 4.0x or more | 1,336 (32.2%) | 600 (14.2%) |
| Total | 4,149 (100.0%) | 4,226 (100.0%) |
Real Estate Taxes by Mortgage Status in Williams County
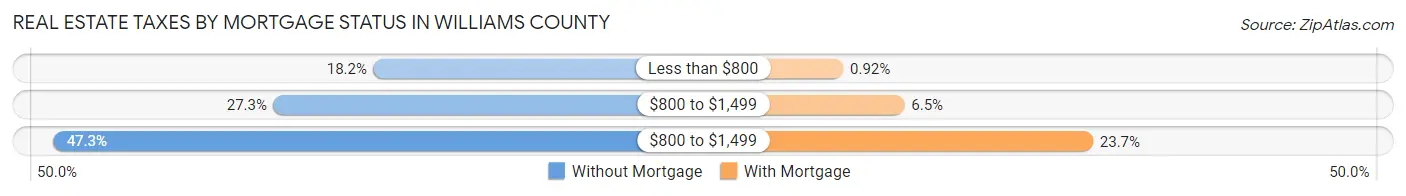
| Property Taxes | Without Mortgage | With Mortgage |
| Less than $800 | 755 (18.2%) | 39 (0.9%) |
| $800 to $1,499 | 1,134 (27.3%) | 275 (6.5%) |
| $800 to $1,499 | 1,964 (47.3%) | 1,003 (23.7%) |
| Total | 4,149 (100.0%) | 4,226 (100.0%) |
Health & Disability in Williams County
Health Insurance Coverage by Age in Williams County
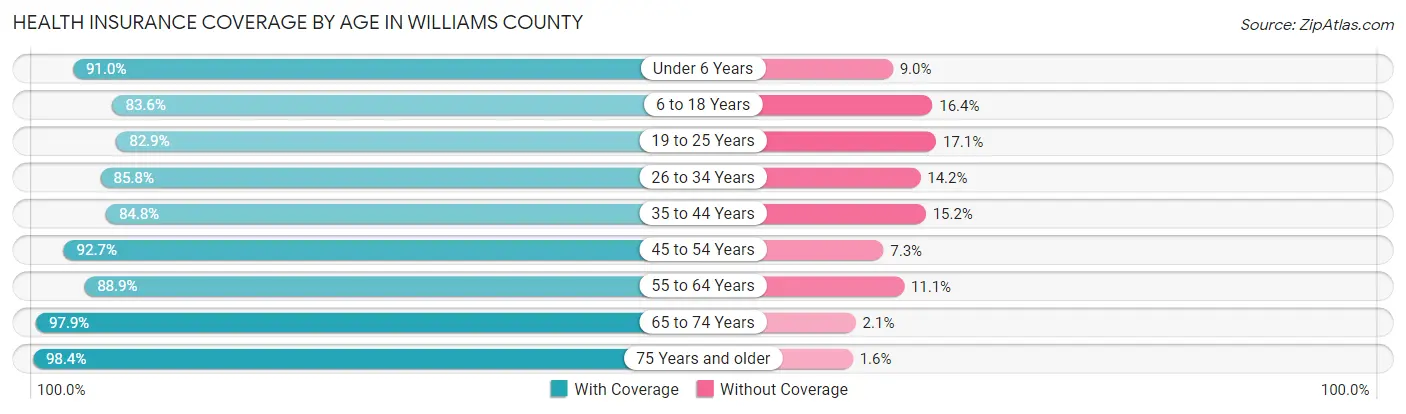
| Age Bracket | With Coverage | Without Coverage |
| Under 6 Years | 3,779 (91.0%) | 375 (9.0%) |
| 6 to 18 Years | 6,559 (83.6%) | 1,288 (16.4%) |
| 19 to 25 Years | 2,722 (82.9%) | 562 (17.1%) |
| 26 to 34 Years | 5,410 (85.8%) | 893 (14.2%) |
| 35 to 44 Years | 5,051 (84.8%) | 904 (15.2%) |
| 45 to 54 Years | 3,593 (92.7%) | 282 (7.3%) |
| 55 to 64 Years | 3,373 (88.9%) | 422 (11.1%) |
| 65 to 74 Years | 2,174 (97.9%) | 47 (2.1%) |
| 75 Years and older | 1,317 (98.4%) | 21 (1.6%) |
| Total | 33,978 (87.6%) | 4,794 (12.4%) |
Health Insurance Coverage by Citizenship Status in Williams County
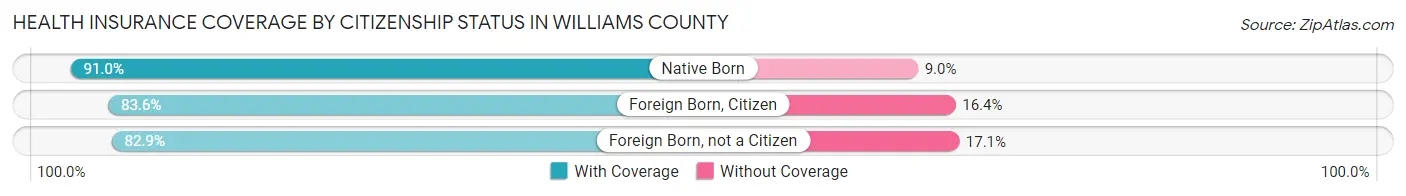
| Citizenship Status | With Coverage | Without Coverage |
| Native Born | 3,779 (91.0%) | 375 (9.0%) |
| Foreign Born, Citizen | 6,559 (83.6%) | 1,288 (16.4%) |
| Foreign Born, not a Citizen | 2,722 (82.9%) | 562 (17.1%) |
Health Insurance Coverage by Household Income in Williams County
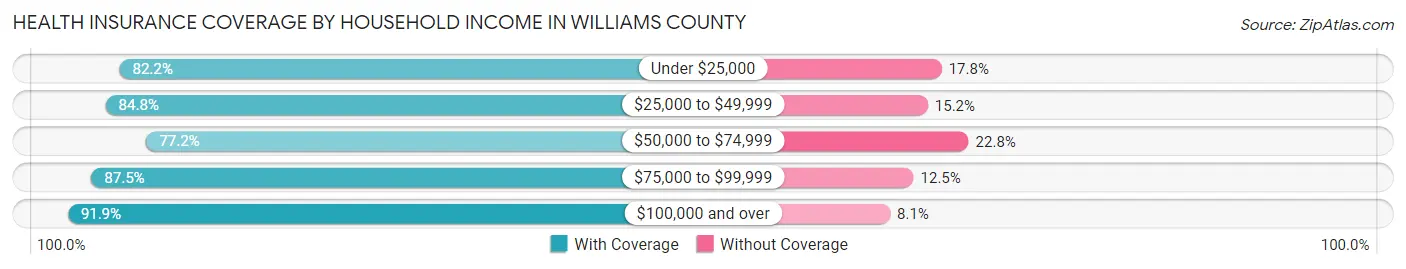
| Household Income | With Coverage | Without Coverage |
| Under $25,000 | 1,608 (82.2%) | 348 (17.8%) |
| $25,000 to $49,999 | 4,707 (84.8%) | 843 (15.2%) |
| $50,000 to $74,999 | 4,223 (77.2%) | 1,249 (22.8%) |
| $75,000 to $99,999 | 5,360 (87.5%) | 767 (12.5%) |
| $100,000 and over | 17,818 (91.9%) | 1,573 (8.1%) |
Public vs Private Health Insurance Coverage by Age in Williams County
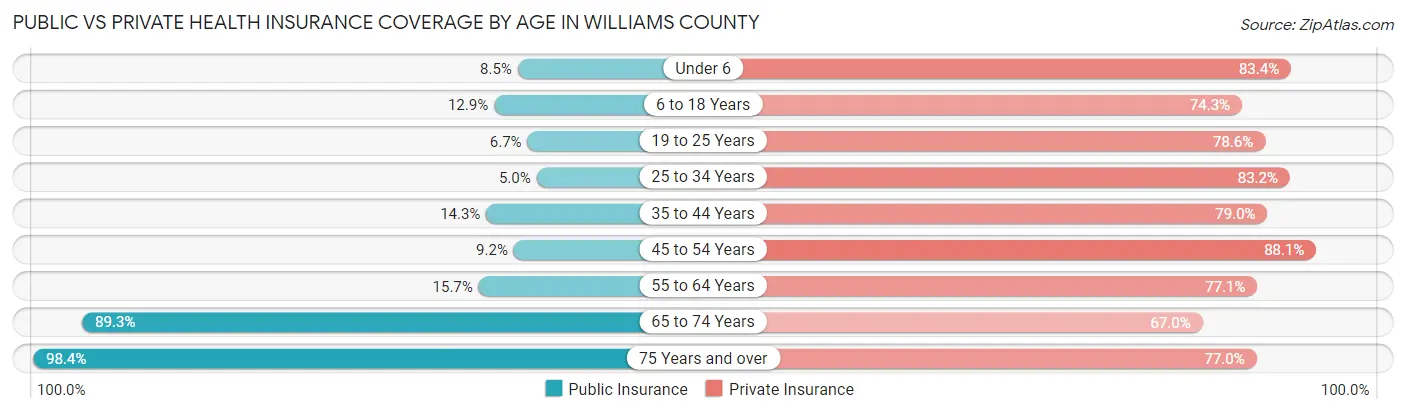
| Age Bracket | Public Insurance | Private Insurance |
| Under 6 | 352 (8.5%) | 3,463 (83.4%) |
| 6 to 18 Years | 1,011 (12.9%) | 5,827 (74.3%) |
| 19 to 25 Years | 219 (6.7%) | 2,580 (78.6%) |
| 25 to 34 Years | 313 (5.0%) | 5,241 (83.2%) |
| 35 to 44 Years | 853 (14.3%) | 4,704 (79.0%) |
| 45 to 54 Years | 357 (9.2%) | 3,412 (88.0%) |
| 55 to 64 Years | 597 (15.7%) | 2,927 (77.1%) |
| 65 to 74 Years | 1,984 (89.3%) | 1,487 (66.9%) |
| 75 Years and over | 1,317 (98.4%) | 1,030 (77.0%) |
| Total | 7,003 (18.1%) | 30,671 (79.1%) |
Disability Status by Sex by Age in Williams County
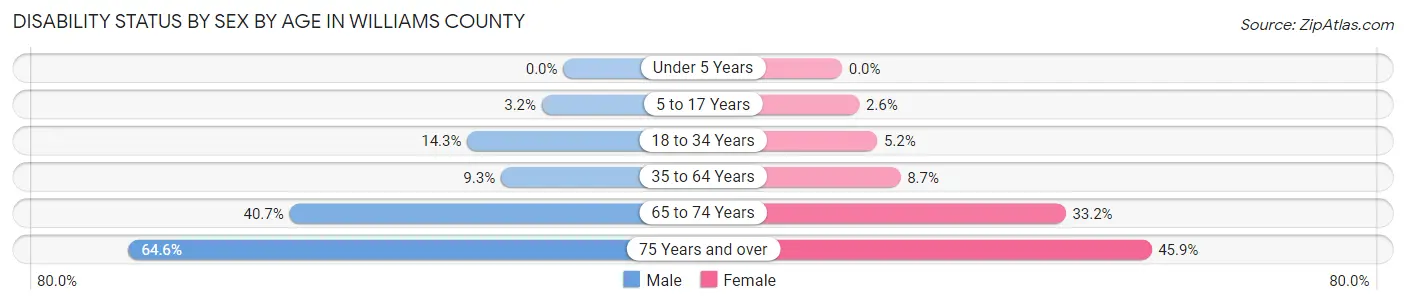
| Age Bracket | Male | Female |
| Under 5 Years | 0 (0.0%) | 0 (0.0%) |
| 5 to 17 Years | 144 (3.2%) | 90 (2.5%) |
| 18 to 34 Years | 799 (14.3%) | 233 (5.2%) |
| 35 to 64 Years | 690 (9.3%) | 536 (8.7%) |
| 65 to 74 Years | 455 (40.7%) | 366 (33.2%) |
| 75 Years and over | 355 (64.5%) | 362 (45.9%) |
Disability Class by Sex by Age in Williams County
Disability Class: Hearing Difficulty
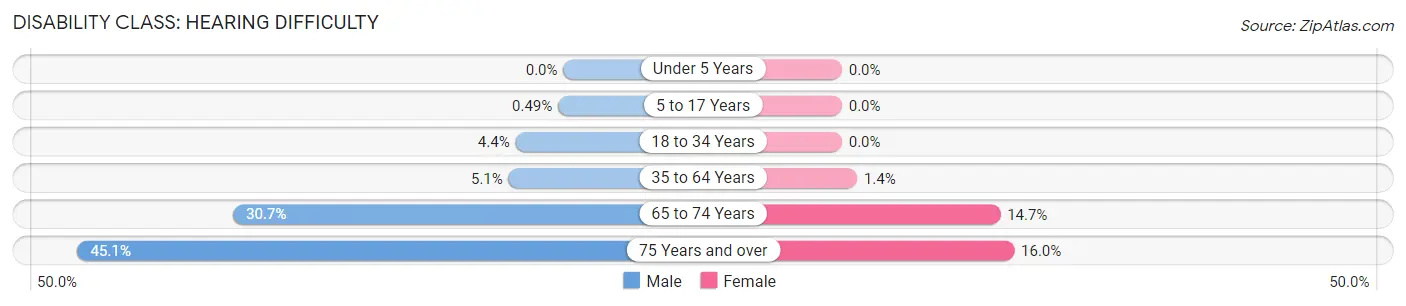
| Age Bracket | Male | Female |
| Under 5 Years | 0 (0.0%) | 0 (0.0%) |
| 5 to 17 Years | 22 (0.5%) | 0 (0.0%) |
| 18 to 34 Years | 249 (4.4%) | 0 (0.0%) |
| 35 to 64 Years | 378 (5.1%) | 87 (1.4%) |
| 65 to 74 Years | 343 (30.6%) | 162 (14.7%) |
| 75 Years and over | 248 (45.1%) | 126 (16.0%) |
Disability Class: Vision Difficulty
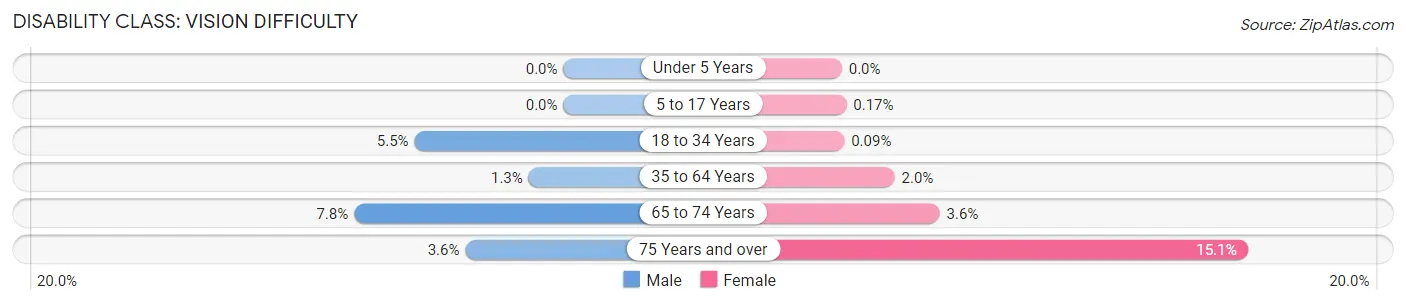
| Age Bracket | Male | Female |
| Under 5 Years | 0 (0.0%) | 0 (0.0%) |
| 5 to 17 Years | 0 (0.0%) | 6 (0.2%) |
| 18 to 34 Years | 310 (5.5%) | 4 (0.1%) |
| 35 to 64 Years | 96 (1.3%) | 121 (2.0%) |
| 65 to 74 Years | 87 (7.8%) | 40 (3.6%) |
| 75 Years and over | 20 (3.6%) | 119 (15.1%) |
Disability Class: Cognitive Difficulty
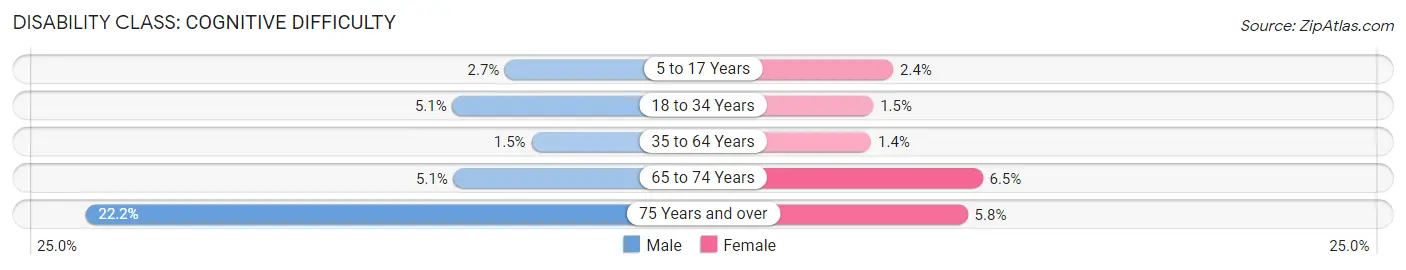
| Age Bracket | Male | Female |
| 5 to 17 Years | 122 (2.7%) | 84 (2.4%) |
| 18 to 34 Years | 288 (5.1%) | 65 (1.5%) |
| 35 to 64 Years | 110 (1.5%) | 84 (1.4%) |
| 65 to 74 Years | 57 (5.1%) | 72 (6.5%) |
| 75 Years and over | 122 (22.2%) | 46 (5.8%) |
Disability Class: Ambulatory Difficulty
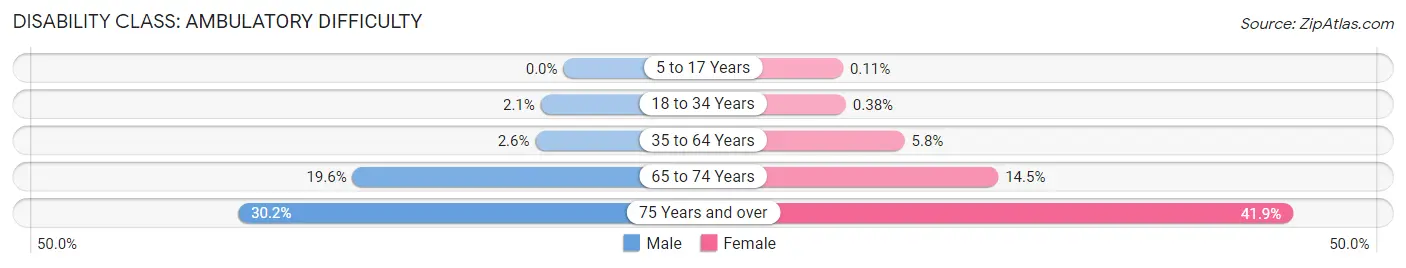
| Age Bracket | Male | Female |
| 5 to 17 Years | 0 (0.0%) | 4 (0.1%) |
| 18 to 34 Years | 118 (2.1%) | 17 (0.4%) |
| 35 to 64 Years | 194 (2.6%) | 360 (5.8%) |
| 65 to 74 Years | 219 (19.6%) | 160 (14.5%) |
| 75 Years and over | 166 (30.2%) | 330 (41.9%) |
Disability Class: Self-Care Difficulty
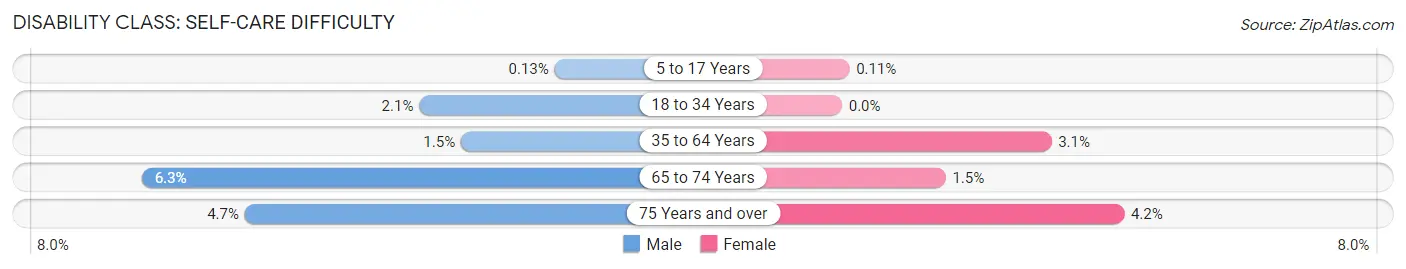
| Age Bracket | Male | Female |
| 5 to 17 Years | 6 (0.1%) | 4 (0.1%) |
| 18 to 34 Years | 120 (2.1%) | 0 (0.0%) |
| 35 to 64 Years | 113 (1.5%) | 192 (3.1%) |
| 65 to 74 Years | 70 (6.3%) | 17 (1.5%) |
| 75 Years and over | 26 (4.7%) | 33 (4.2%) |
Technology Access in Williams County
Computing Device Access in Williams County
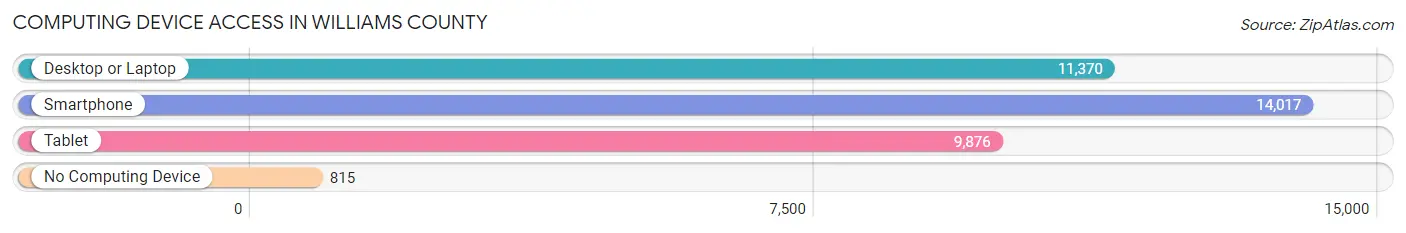
| Device Type | # Households | % Households |
| Desktop or Laptop | 11,370 | 72.9% |
| Smartphone | 14,017 | 89.9% |
| Tablet | 9,876 | 63.3% |
| No Computing Device | 815 | 5.2% |
| Total | 15,599 | 100.0% |
Internet Access in Williams County
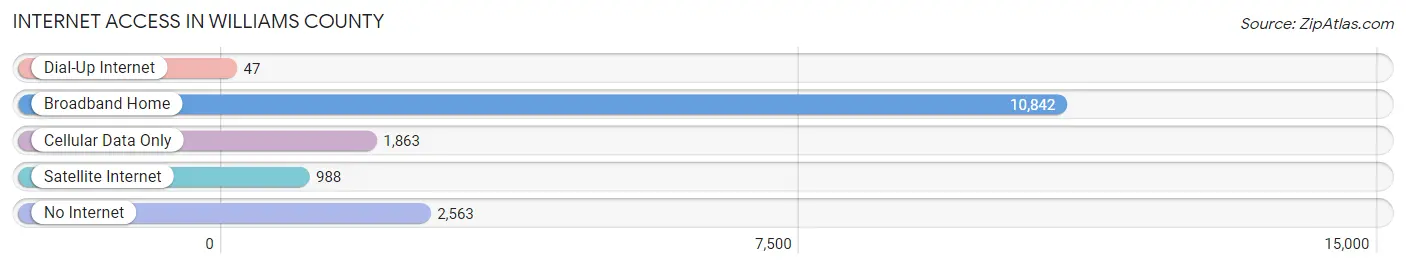
| Internet Type | # Households | % Households |
| Dial-Up Internet | 47 | 0.3% |
| Broadband Home | 10,842 | 69.5% |
| Cellular Data Only | 1,863 | 11.9% |
| Satellite Internet | 988 | 6.3% |
| No Internet | 2,563 | 16.4% |
| Total | 15,599 | 100.0% |
Williams County Summary
Williams County is located in the northwestern corner of North Dakota, and is bordered by Montana to the west and Canada to the north. The county seat is Williston, and the county is named after Erastus Appelman Williams, a former North Dakota state legislator. As of the 2010 census, the population of Williams County was 22,398, making it the sixth most populous county in the state.
History
The area that is now Williams County was first inhabited by the Mandan and Hidatsa Native American tribes. The first Europeans to explore the area were French fur traders, who arrived in the late 1700s. The area was part of the Louisiana Purchase in 1803, and was part of the Dakota Territory until 1889, when North Dakota became a state.
The first permanent settlers in the area were homesteaders, who arrived in the late 1800s. The first town in the county was Williston, which was founded in 1887. The town was named after Daniel Willis James, a railroad official. The county was officially organized in 1891, and the county seat was established in Williston.
The county experienced a population boom in the early 1900s, as homesteaders and immigrants moved to the area to take advantage of the fertile soil and abundant natural resources. The county also experienced a boom in the 1950s, when the discovery of oil in the area led to an influx of workers and businesses.
Geography
Williams County is located in the northwestern corner of North Dakota, and is bordered by Montana to the west and Canada to the north. The county covers an area of 2,717 square miles, and is the fourth largest county in the state. The terrain is mostly flat, with rolling hills in the east and south. The county is drained by the Missouri River and its tributaries.
The county has a semi-arid climate, with cold winters and hot summers. The average annual temperature is 45°F, and the average annual precipitation is 16 inches.
Economy
Williams County has a diverse economy, with agriculture, oil and gas, and tourism being the main industries. Agriculture is the largest industry in the county, and the main crops are wheat, barley, oats, and hay. Oil and gas production is also an important part of the economy, and the county is home to several oil and gas fields. Tourism is also an important part of the economy, and the county is home to several state parks and recreational areas.
Demographics
As of the 2010 census, the population of Williams County was 22,398, making it the sixth most populous county in the state. The population is spread out, with the largest cities being Williston (14,716), Watford City (5,717), and Tioga (1,845). The population is predominantly white (94.3%), with small percentages of Native American (2.3%), African American (1.2%), and Asian (0.7%). The median household income is $60,945, and the median home value is $179,400.
Common Questions
What is the Total Population of Williams County?
Total Population of Williams County is 39,076.
What is the Total Male Population of Williams County?
Total Male Population of Williams County is 21,134.
What is the Total Female Population of Williams County?
Total Female Population of Williams County is 17,942.
What is the Ratio of Males per 100 Females in Williams County?
There are 117.79 Males per 100 Females in Williams County.
What is the Ratio of Females per 100 Males in Williams County?
There are 84.90 Females per 100 Males in Williams County.
What is the Median Population Age in Williams County?
Median Population Age in Williams County is 31.9 Years.
What is the Average Family Size in Williams County
Average Family Size in Williams County is 3.2 People.
What is the Average Household Size in Williams County
Average Household Size in Williams County is 2.5 People.
What is Per Capita Income in Williams County?
Per Capita income in Williams County is $44,076.
What is the Median Family Income in Williams County?
Median Family Income in Williams County is $104,948.
What is the Median Household income in Williams County?
Median Household Income in Williams County is $86,139.
What is Income or Wage Gap in Williams County?
Income or Wage Gap in Williams County is 51.4%.
Women in Williams County earn 48.6 cents for every dollar earned by a man.
What is Inequality or Gini Index in Williams County?
Inequality or Gini Index in Williams County is 0.44.
How Large is the Labor Force in Williams County?
There are 20,842 People in the Labor Forcein in Williams County.
What is the Percentage of People in the Labor Force in Williams County?
74.0% of People are in the Labor Force in Williams County.
What is the Unemployment Rate in Williams County?
Unemployment Rate in Williams County is 2.5%.