Ward County, ND
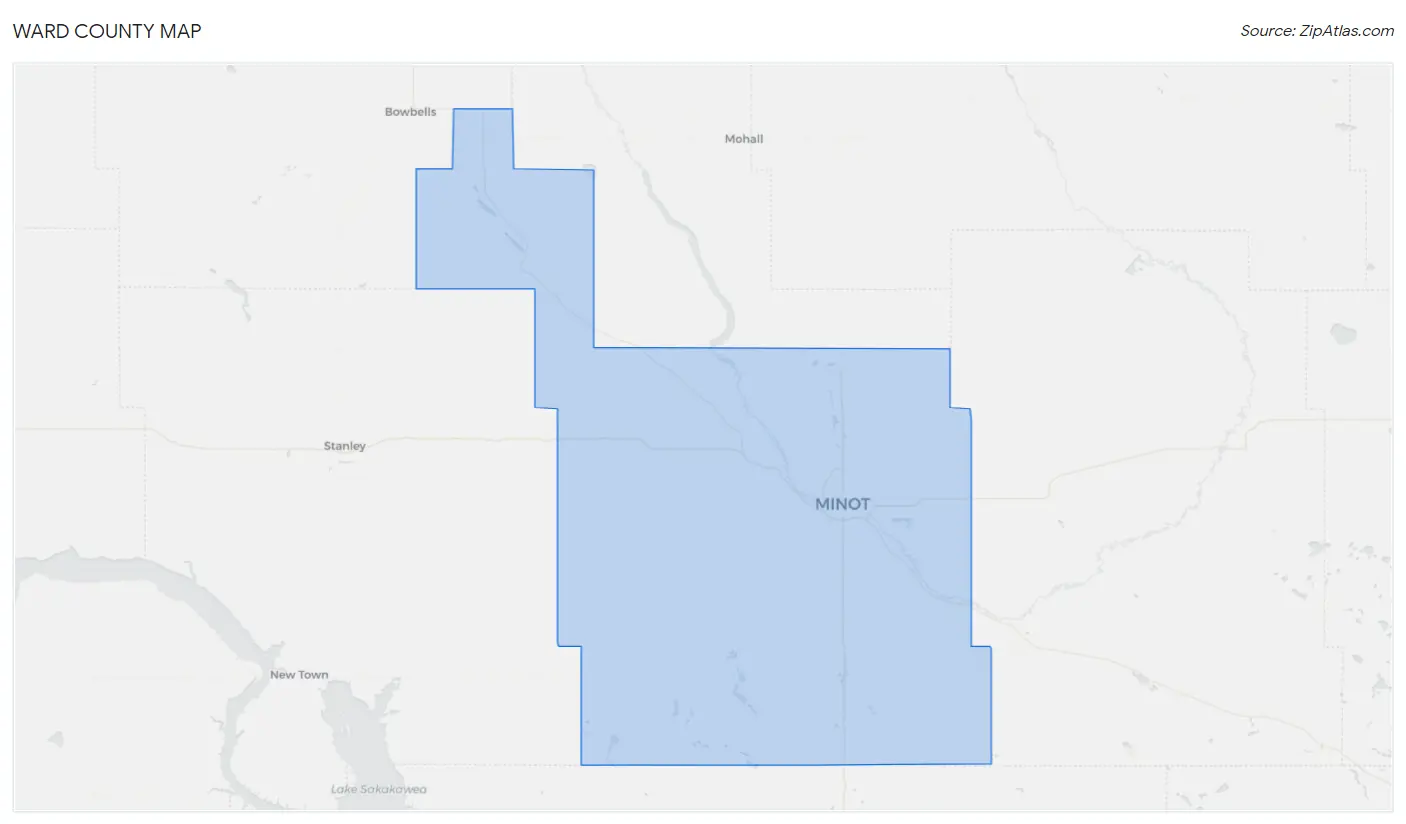
Ward County Map
Ward County Overview
69,532
TOTAL POPULATION
36,443
MALE POPULATION
33,089
FEMALE POPULATION
110.14
MALES / 100 FEMALES
90.80
FEMALES / 100 MALES
33.0
MEDIAN AGE
3.1
AVG FAMILY SIZE
2.4
AVG HOUSEHOLD SIZE
$40,896
PER CAPITA INCOME
$101,212
AVG FAMILY INCOME
$78,143
AVG HOUSEHOLD INCOME
31.8%
WAGE / INCOME GAP [ % ]
68.2¢/ $1
WAGE / INCOME GAP [ $ ]
$9,816
FAMILY INCOME DEFICIT
0.43
INEQUALITY / GINI INDEX
39,600
LABOR FORCE [ PEOPLE ]
72.5%
PERCENT IN LABOR FORCE
3.7%
UNEMPLOYMENT RATE
Ward County Area Codes
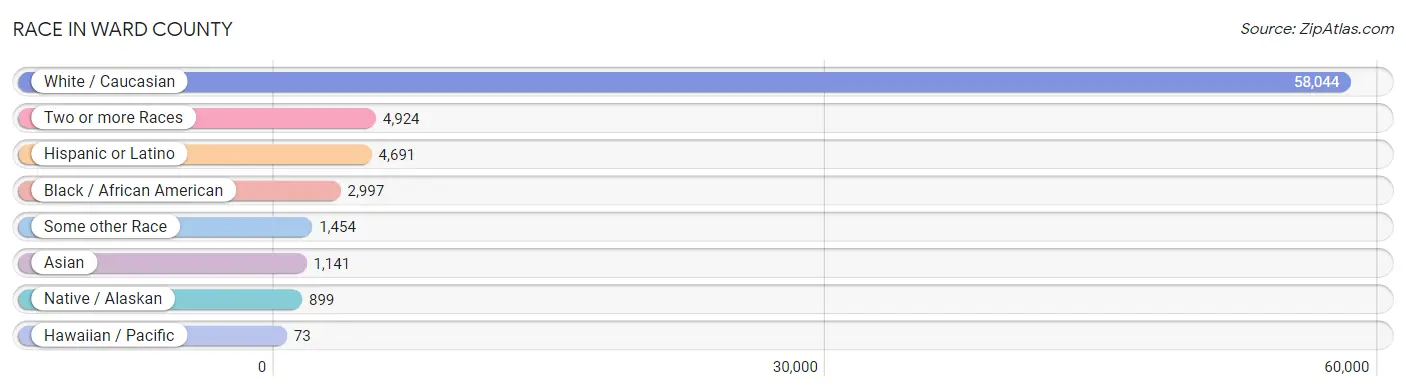
Race in Ward County
The most populous races in Ward County are White / Caucasian (58,044 | 83.5%), Two or more Races (4,924 | 7.1%), and Hispanic or Latino (4,691 | 6.8%).
| Race | # Population | % Population |
| Asian | 1,141 | 1.6% |
| Black / African American | 2,997 | 4.3% |
| Hawaiian / Pacific | 73 | 0.1% |
| Hispanic or Latino | 4,691 | 6.8% |
| Native / Alaskan | 899 | 1.3% |
| White / Caucasian | 58,044 | 83.5% |
| Two or more Races | 4,924 | 7.1% |
| Some other Race | 1,454 | 2.1% |
| Total | 69,532 | 100.0% |
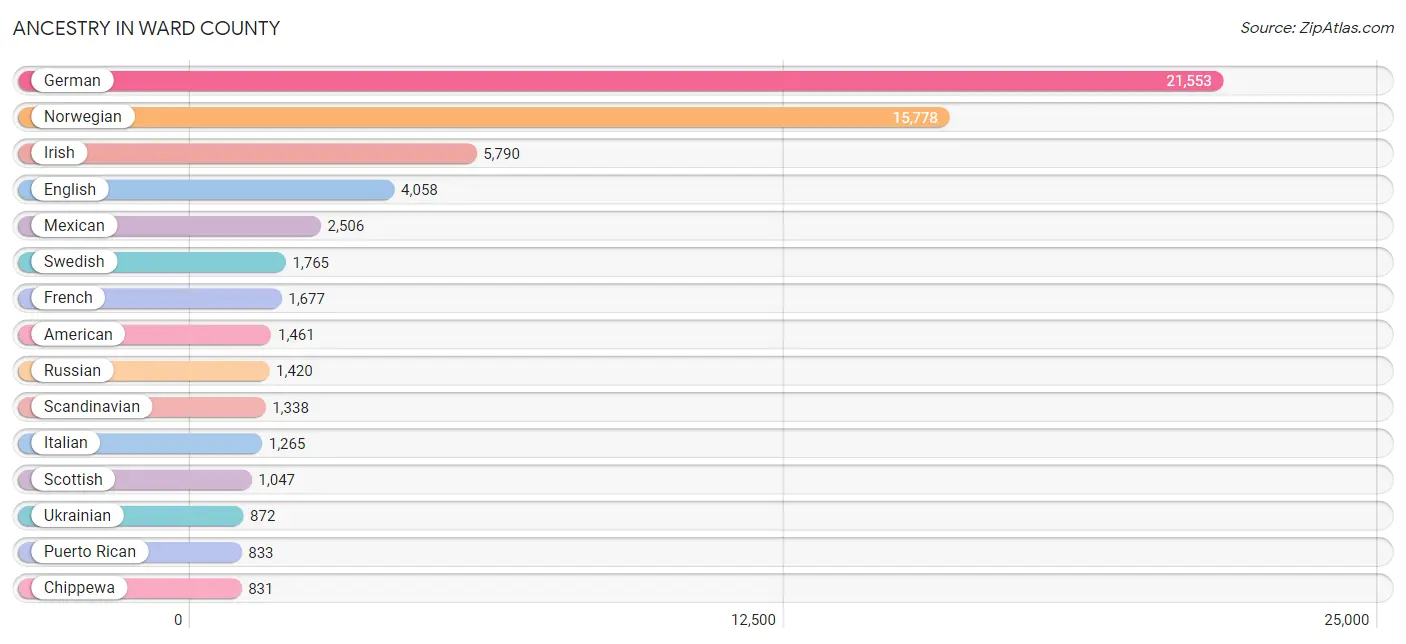
Ancestry in Ward County
The most populous ancestries reported in Ward County are German (21,553 | 31.0%), Norwegian (15,778 | 22.7%), Irish (5,790 | 8.3%), English (4,058 | 5.8%), and Mexican (2,506 | 3.6%), together accounting for 71.5% of all Ward County residents.
| Ancestry | # Population | % Population |
| African | 193 | 0.3% |
| Alaska Native | 4 | 0.0% |
| Alaskan Athabascan | 4 | 0.0% |
| Aleut | 10 | 0.0% |
| American | 1,461 | 2.1% |
| Apache | 21 | 0.0% |
| Arab | 355 | 0.5% |
| Argentinean | 32 | 0.1% |
| Assyrian / Chaldean / Syriac | 14 | 0.0% |
| Australian | 24 | 0.0% |
| Austrian | 182 | 0.3% |
| Belgian | 63 | 0.1% |
| Bhutanese | 372 | 0.5% |
| Blackfeet | 87 | 0.1% |
| British | 364 | 0.5% |
| Bulgarian | 4 | 0.0% |
| Burmese | 107 | 0.2% |
| Canadian | 140 | 0.2% |
| Celtic | 16 | 0.0% |
| Central American | 529 | 0.8% |
| Central American Indian | 129 | 0.2% |
| Cherokee | 79 | 0.1% |
| Chippewa | 831 | 1.2% |
| Colombian | 16 | 0.0% |
| Comanche | 118 | 0.2% |
| Costa Rican | 22 | 0.0% |
| Cree | 28 | 0.0% |
| Creek | 68 | 0.1% |
| Croatian | 3 | 0.0% |
| Cuban | 53 | 0.1% |
| Czech | 299 | 0.4% |
| Czechoslovakian | 18 | 0.0% |
| Danish | 655 | 0.9% |
| Dominican | 81 | 0.1% |
| Dutch | 685 | 1.0% |
| Eastern European | 52 | 0.1% |
| Ecuadorian | 47 | 0.1% |
| Egyptian | 8 | 0.0% |
| English | 4,058 | 5.8% |
| European | 690 | 1.0% |
| Fijian | 2 | 0.0% |
| Filipino | 3 | 0.0% |
| Finnish | 266 | 0.4% |
| French | 1,677 | 2.4% |
| French American Indian | 4 | 0.0% |
| French Canadian | 357 | 0.5% |
| German | 21,553 | 31.0% |
| German Russian | 97 | 0.1% |
| Ghanaian | 78 | 0.1% |
| Greek | 164 | 0.2% |
| Guamanian / Chamorro | 88 | 0.1% |
| Guatemalan | 40 | 0.1% |
| Haitian | 2 | 0.0% |
| Honduran | 9 | 0.0% |
| Hungarian | 90 | 0.1% |
| Icelander | 96 | 0.1% |
| Indian (Asian) | 92 | 0.1% |
| Inupiat | 36 | 0.1% |
| Irish | 5,790 | 8.3% |
| Iroquois | 2 | 0.0% |
| Italian | 1,265 | 1.8% |
| Jamaican | 142 | 0.2% |
| Korean | 529 | 0.8% |
| Laotian | 123 | 0.2% |
| Lebanese | 37 | 0.1% |
| Liberian | 50 | 0.1% |
| Lithuanian | 101 | 0.2% |
| Luxembourger | 15 | 0.0% |
| Mexican | 2,506 | 3.6% |
| Mexican American Indian | 32 | 0.1% |
| Native Hawaiian | 93 | 0.1% |
| Navajo | 23 | 0.0% |
| Nicaraguan | 159 | 0.2% |
| Nigerian | 61 | 0.1% |
| Northern European | 185 | 0.3% |
| Norwegian | 15,778 | 22.7% |
| Pakistani | 92 | 0.1% |
| Panamanian | 171 | 0.3% |
| Pennsylvania German | 7 | 0.0% |
| Polish | 791 | 1.1% |
| Portuguese | 76 | 0.1% |
| Pueblo | 21 | 0.0% |
| Puerto Rican | 833 | 1.2% |
| Romanian | 99 | 0.1% |
| Russian | 1,420 | 2.0% |
| Salvadoran | 128 | 0.2% |
| Samoan | 18 | 0.0% |
| Scandinavian | 1,338 | 1.9% |
| Scotch-Irish | 579 | 0.8% |
| Scottish | 1,047 | 1.5% |
| Senegalese | 67 | 0.1% |
| Sioux | 258 | 0.4% |
| Slovak | 65 | 0.1% |
| Somali | 139 | 0.2% |
| South African | 12 | 0.0% |
| South American | 95 | 0.1% |
| Spaniard | 184 | 0.3% |
| Spanish | 62 | 0.1% |
| Sri Lankan | 31 | 0.0% |
| Subsaharan African | 751 | 1.1% |
| Swedish | 1,765 | 2.5% |
| Swiss | 176 | 0.3% |
| Syrian | 26 | 0.0% |
| Thai | 116 | 0.2% |
| Tlingit-Haida | 8 | 0.0% |
| Tongan | 25 | 0.0% |
| Trinidadian and Tobagonian | 2 | 0.0% |
| Ukrainian | 872 | 1.3% |
| Welsh | 228 | 0.3% |
| Yup'ik | 29 | 0.0% | View All 110 Rows |
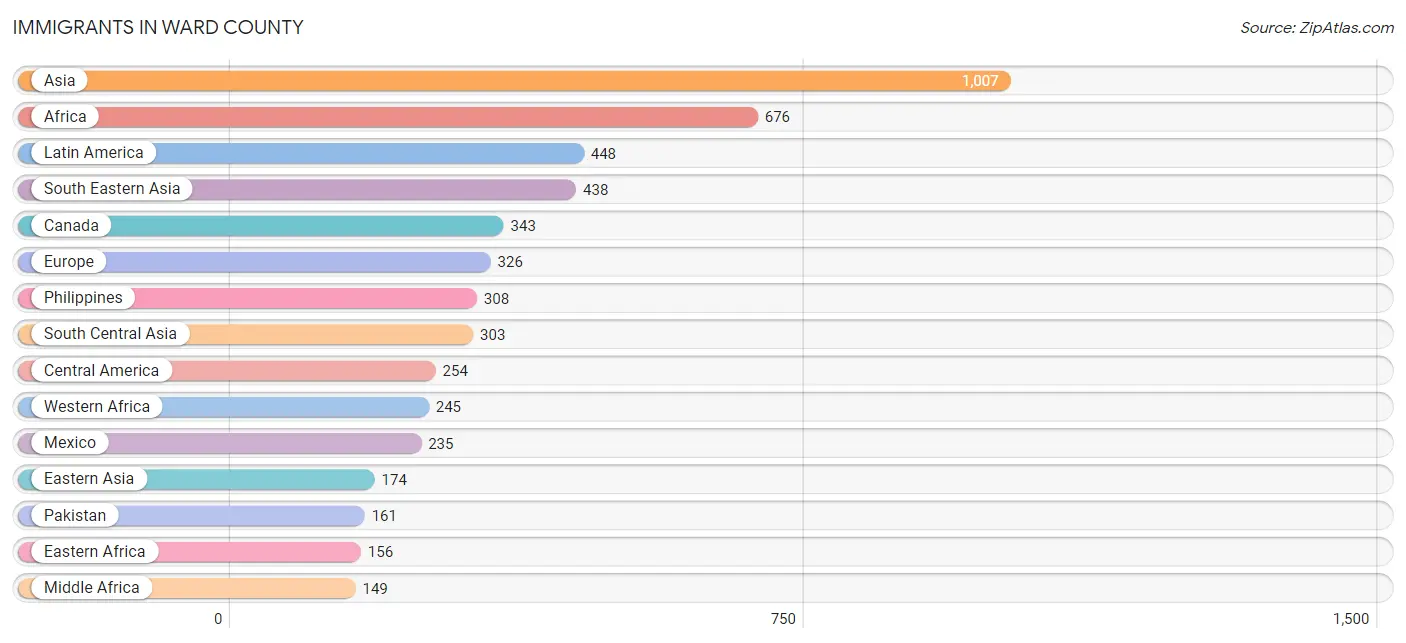
Immigrants in Ward County
The most numerous immigrant groups reported in Ward County came from Asia (1,007 | 1.5%), Africa (676 | 1.0%), Latin America (448 | 0.6%), South Eastern Asia (438 | 0.6%), and Canada (343 | 0.5%), together accounting for 4.2% of all Ward County residents.
| Immigration Origin | # Population | % Population |
| Africa | 676 | 1.0% |
| Asia | 1,007 | 1.5% |
| Australia | 24 | 0.0% |
| Bangladesh | 3 | 0.0% |
| Cameroon | 138 | 0.2% |
| Canada | 343 | 0.5% |
| Caribbean | 97 | 0.1% |
| Central America | 254 | 0.4% |
| Chile | 70 | 0.1% |
| China | 66 | 0.1% |
| Colombia | 16 | 0.0% |
| Congo | 11 | 0.0% |
| Cuba | 50 | 0.1% |
| Czechoslovakia | 1 | 0.0% |
| Dominican Republic | 11 | 0.0% |
| Eastern Africa | 156 | 0.2% |
| Eastern Asia | 174 | 0.3% |
| Eastern Europe | 114 | 0.2% |
| Ecuador | 11 | 0.0% |
| Egypt | 51 | 0.1% |
| England | 89 | 0.1% |
| Europe | 326 | 0.5% |
| Germany | 62 | 0.1% |
| Ghana | 42 | 0.1% |
| Greece | 14 | 0.0% |
| Honduras | 8 | 0.0% |
| Indonesia | 63 | 0.1% |
| Iran | 18 | 0.0% |
| Israel | 3 | 0.0% |
| Jamaica | 36 | 0.1% |
| Japan | 95 | 0.1% |
| Korea | 13 | 0.0% |
| Latin America | 448 | 0.6% |
| Lebanon | 3 | 0.0% |
| Liberia | 85 | 0.1% |
| Lithuania | 59 | 0.1% |
| Mexico | 235 | 0.3% |
| Middle Africa | 149 | 0.2% |
| Nepal | 82 | 0.1% |
| Nigeria | 35 | 0.1% |
| Northern Africa | 51 | 0.1% |
| Northern Europe | 134 | 0.2% |
| Oceania | 42 | 0.1% |
| Pakistan | 161 | 0.2% |
| Panama | 11 | 0.0% |
| Philippines | 308 | 0.4% |
| Poland | 43 | 0.1% |
| Romania | 11 | 0.0% |
| Saudi Arabia | 44 | 0.1% |
| Senegal | 43 | 0.1% |
| Somalia | 141 | 0.2% |
| South Africa | 12 | 0.0% |
| South America | 97 | 0.1% |
| South Central Asia | 303 | 0.4% |
| South Eastern Asia | 438 | 0.6% |
| Southern Europe | 16 | 0.0% |
| Spain | 2 | 0.0% |
| Syria | 42 | 0.1% |
| Taiwan | 3 | 0.0% |
| Thailand | 44 | 0.1% |
| Vietnam | 23 | 0.0% |
| Western Africa | 245 | 0.4% |
| Western Asia | 92 | 0.1% |
| Western Europe | 62 | 0.1% | View All 64 Rows |
Sex and Age in Ward County
Sex and Age in Ward County
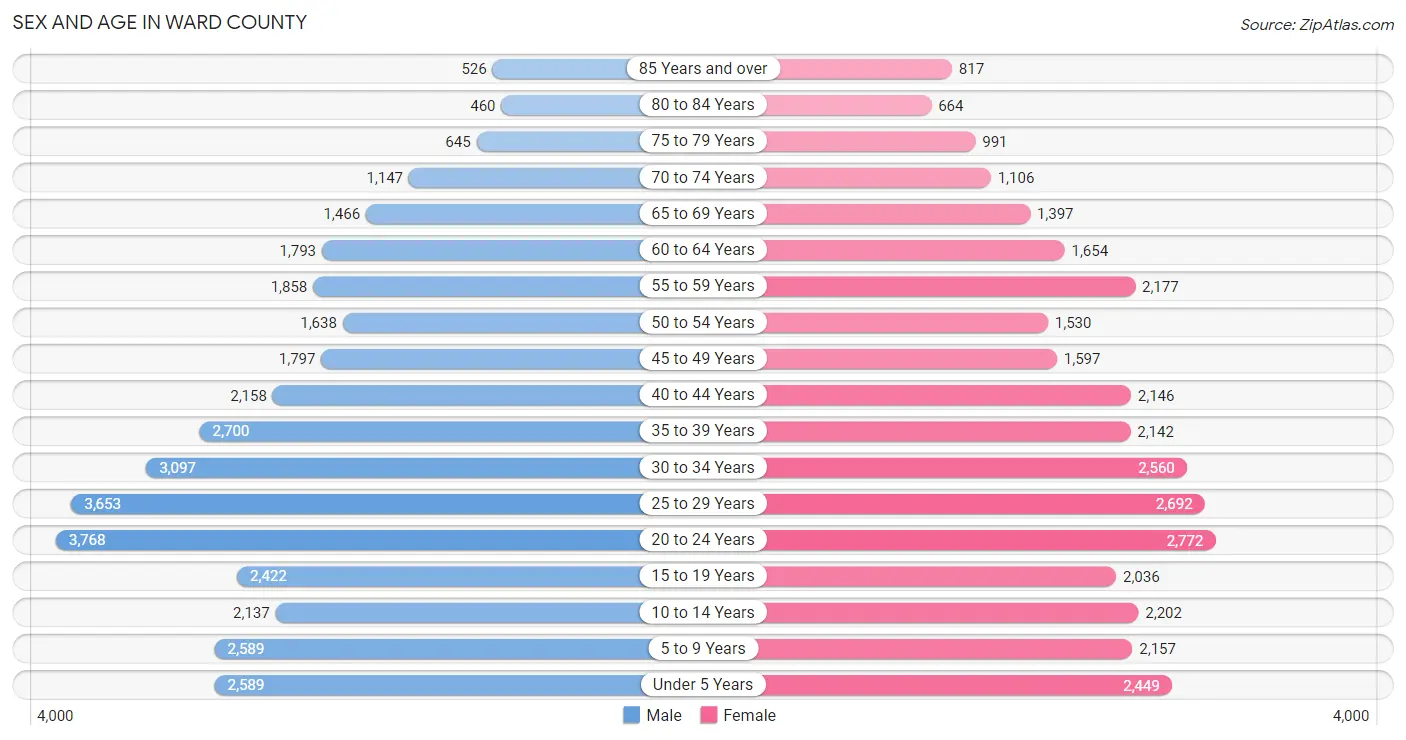
The most populous age groups in Ward County are 20 to 24 Years (3,768 | 10.3%) for men and 20 to 24 Years (2,772 | 8.4%) for women.
| Age Bracket | Male | Female |
| Under 5 Years | 2,589 (7.1%) | 2,449 (7.4%) |
| 5 to 9 Years | 2,589 (7.1%) | 2,157 (6.5%) |
| 10 to 14 Years | 2,137 (5.9%) | 2,202 (6.7%) |
| 15 to 19 Years | 2,422 (6.7%) | 2,036 (6.1%) |
| 20 to 24 Years | 3,768 (10.3%) | 2,772 (8.4%) |
| 25 to 29 Years | 3,653 (10.0%) | 2,692 (8.1%) |
| 30 to 34 Years | 3,097 (8.5%) | 2,560 (7.7%) |
| 35 to 39 Years | 2,700 (7.4%) | 2,142 (6.5%) |
| 40 to 44 Years | 2,158 (5.9%) | 2,146 (6.5%) |
| 45 to 49 Years | 1,797 (4.9%) | 1,597 (4.8%) |
| 50 to 54 Years | 1,638 (4.5%) | 1,530 (4.6%) |
| 55 to 59 Years | 1,858 (5.1%) | 2,177 (6.6%) |
| 60 to 64 Years | 1,793 (4.9%) | 1,654 (5.0%) |
| 65 to 69 Years | 1,466 (4.0%) | 1,397 (4.2%) |
| 70 to 74 Years | 1,147 (3.2%) | 1,106 (3.3%) |
| 75 to 79 Years | 645 (1.8%) | 991 (3.0%) |
| 80 to 84 Years | 460 (1.3%) | 664 (2.0%) |
| 85 Years and over | 526 (1.4%) | 817 (2.5%) |
| Total | 36,443 (100.0%) | 33,089 (100.0%) |
Families and Households in Ward County
Median Family Size in Ward County
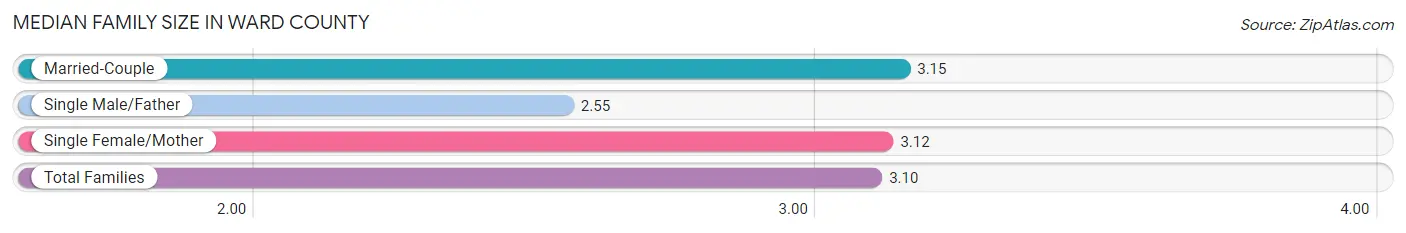
The median family size in Ward County is 3.10 persons per family, with married-couple families (13,623 | 81.4%) accounting for the largest median family size of 3.15 persons per family. On the other hand, single male/father families (1,304 | 7.8%) represent the smallest median family size with 2.55 persons per family.
| Family Type | # Families | Family Size |
| Married-Couple | 13,623 (81.4%) | 3.15 |
| Single Male/Father | 1,304 (7.8%) | 2.55 |
| Single Female/Mother | 1,802 (10.8%) | 3.12 |
| Total Families | 16,729 (100.0%) | 3.10 |
Median Household Size in Ward County
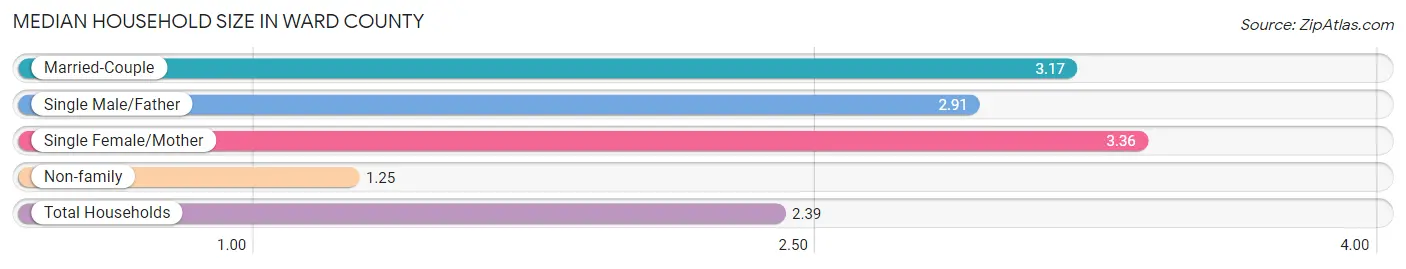
The median household size in Ward County is 2.39 persons per household, with single female/mother households (1,802 | 6.4%) accounting for the largest median household size of 3.36 persons per household. non-family households (11,622 | 41.0%) represent the smallest median household size with 1.25 persons per household.
| Household Type | # Households | Household Size |
| Married-Couple | 13,623 (48.0%) | 3.17 |
| Single Male/Father | 1,304 (4.6%) | 2.91 |
| Single Female/Mother | 1,802 (6.4%) | 3.36 |
| Non-family | 11,622 (41.0%) | 1.25 |
| Total Households | 28,351 (100.0%) | 2.39 |
Household Size by Marriage Status in Ward County
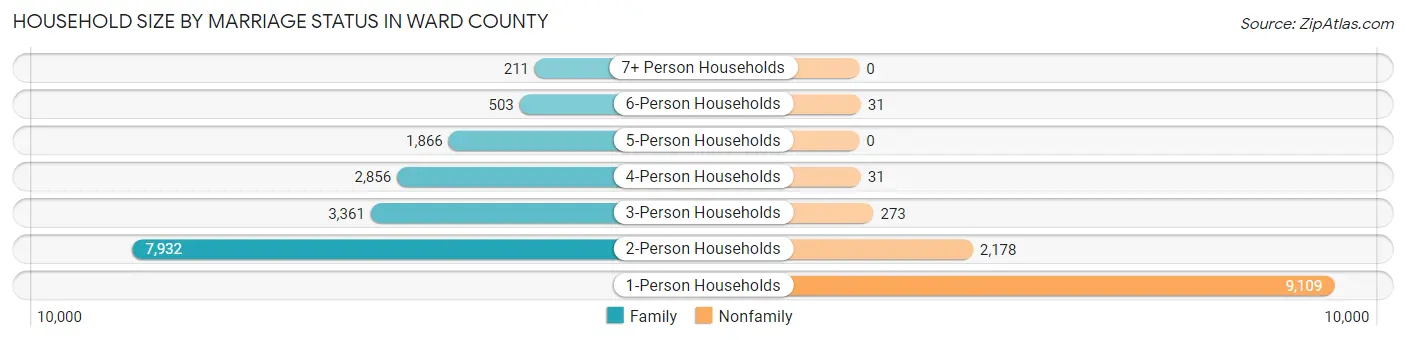
Out of a total of 28,351 households in Ward County, 16,729 (59.0%) are family households, while 11,622 (41.0%) are nonfamily households. The most numerous type of family households are 2-person households, comprising 7,932, and the most common type of nonfamily households are 1-person households, comprising 9,109.
| Household Size | Family Households | Nonfamily Households |
| 1-Person Households | - | 9,109 (32.1%) |
| 2-Person Households | 7,932 (28.0%) | 2,178 (7.7%) |
| 3-Person Households | 3,361 (11.8%) | 273 (1.0%) |
| 4-Person Households | 2,856 (10.1%) | 31 (0.1%) |
| 5-Person Households | 1,866 (6.6%) | 0 (0.0%) |
| 6-Person Households | 503 (1.8%) | 31 (0.1%) |
| 7+ Person Households | 211 (0.7%) | 0 (0.0%) |
| Total | 16,729 (59.0%) | 11,622 (41.0%) |
Female Fertility in Ward County
Fertility by Age in Ward County
Average fertility rate in Ward County is 55.0 births per 1,000 women. Women in the age bracket of 20 to 34 years have the highest fertility rate with 86.0 births per 1,000 women. Women in the age bracket of 20 to 34 years acount for 77.0% of all women with births.

| Age Bracket | Women with Births | Births / 1,000 Women |
| 15 to 19 years | 16 (1.8%) | 8.0 |
| 20 to 34 years | 694 (77.0%) | 86.0 |
| 35 to 50 years | 191 (21.2%) | 31.0 |
| Total | 901 (100.0%) | 55.0 |
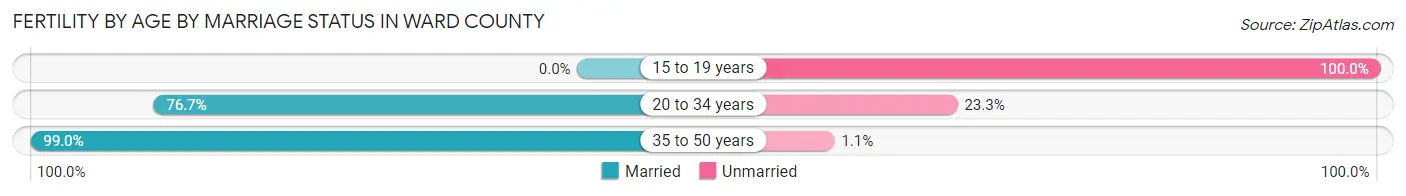
Fertility by Age by Marriage Status in Ward County
80.0% of women with births (901) in Ward County are married. The highest percentage of unmarried women with births falls into 15 to 19 years age bracket with 100.0% of them unmarried at the time of birth, while the lowest percentage of unmarried women with births belong to 35 to 50 years age bracket with 1.0% of them unmarried.
| Age Bracket | Married | Unmarried |
| 15 to 19 years | 0 (0.0%) | 16 (100.0%) |
| 20 to 34 years | 532 (76.7%) | 162 (23.3%) |
| 35 to 50 years | 189 (99.0%) | 2 (1.1%) |
| Total | 721 (80.0%) | 180 (20.0%) |
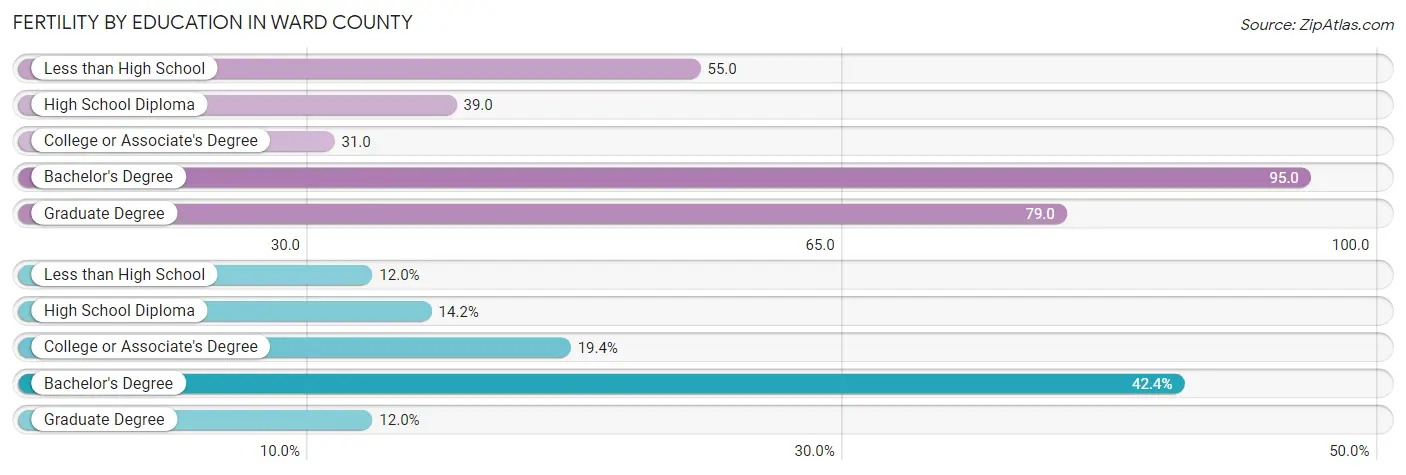
Fertility by Education in Ward County
Average fertility rate in Ward County is 55.0 births per 1,000 women. Women with the education attainment of bachelor's degree have the highest fertility rate of 95.0 births per 1,000 women, while women with the education attainment of college or associate's degree have the lowest fertility at 31.0 births per 1,000 women. Women with the education attainment of bachelor's degree represent 42.4% of all women with births.
| Educational Attainment | Women with Births | Births / 1,000 Women |
| Less than High School | 108 (12.0%) | 55.0 |
| High School Diploma | 128 (14.2%) | 39.0 |
| College or Associate's Degree | 175 (19.4%) | 31.0 |
| Bachelor's Degree | 382 (42.4%) | 95.0 |
| Graduate Degree | 108 (12.0%) | 79.0 |
| Total | 901 (100.0%) | 55.0 |
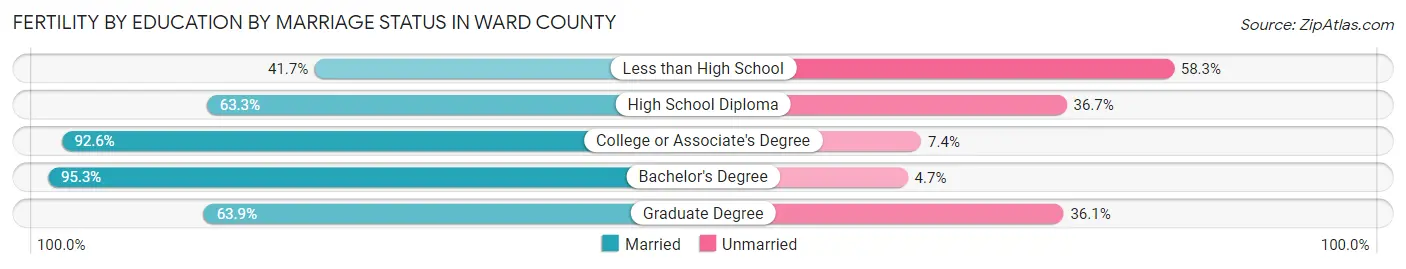
Fertility by Education by Marriage Status in Ward County
20.0% of women with births in Ward County are unmarried. Women with the educational attainment of bachelor's degree are most likely to be married with 95.3% of them married at childbirth, while women with the educational attainment of less than high school are least likely to be married with 58.3% of them unmarried at childbirth.
| Educational Attainment | Married | Unmarried |
| Less than High School | 45 (41.7%) | 63 (58.3%) |
| High School Diploma | 81 (63.3%) | 47 (36.7%) |
| College or Associate's Degree | 162 (92.6%) | 13 (7.4%) |
| Bachelor's Degree | 364 (95.3%) | 18 (4.7%) |
| Graduate Degree | 69 (63.9%) | 39 (36.1%) |
| Total | 721 (80.0%) | 180 (20.0%) |
Income in Ward County
Income Overview in Ward County
Per Capita Income in Ward County is $40,896, while median incomes of families and households are $101,212 and $78,143 respectively.
| Characteristic | Number | Measure |
| Per Capita Income | 69,532 | $40,896 |
| Median Family Income | 16,729 | $101,212 |
| Mean Family Income | 16,729 | $122,677 |
| Median Household Income | 28,351 | $78,143 |
| Mean Household Income | 28,351 | $97,908 |
| Income Deficit | 16,729 | $9,816 |
| Wage / Income Gap (%) | 69,532 | 31.76% |
| Wage / Income Gap ($) | 69,532 | 68.24¢ per $1 |
| Gini / Inequality Index | 69,532 | 0.43 |
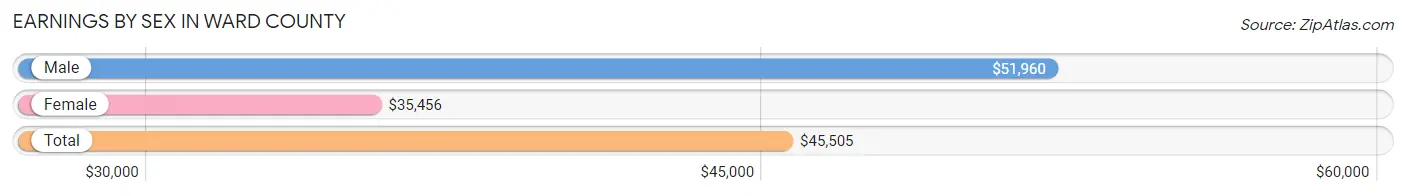
Earnings by Sex in Ward County
Average Earnings in Ward County are $45,505, $51,960 for men and $35,456 for women, a difference of 31.8%.
| Sex | Number | Average Earnings |
| Male | 23,908 (57.0%) | $51,960 |
| Female | 18,042 (43.0%) | $35,456 |
| Total | 41,950 (100.0%) | $45,505 |
Earnings by Sex by Income Bracket in Ward County
The most common earnings brackets in Ward County are $100,000+ for men (3,921 | 16.4%) and $55,000 to $64,999 for women (1,535 | 8.5%).
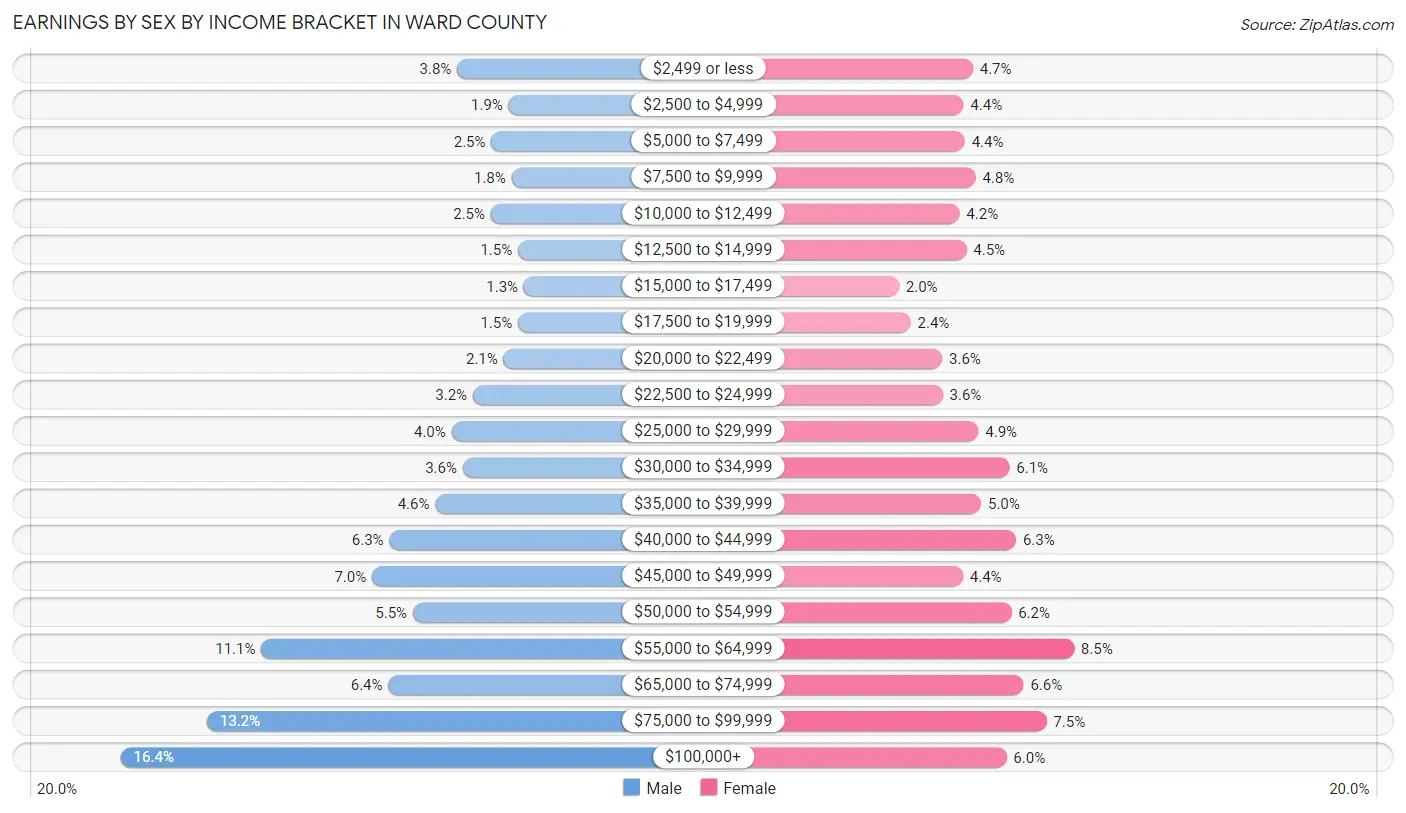
| Income | Male | Female |
| $2,499 or less | 906 (3.8%) | 851 (4.7%) |
| $2,500 to $4,999 | 444 (1.9%) | 788 (4.4%) |
| $5,000 to $7,499 | 600 (2.5%) | 797 (4.4%) |
| $7,500 to $9,999 | 418 (1.8%) | 870 (4.8%) |
| $10,000 to $12,499 | 606 (2.5%) | 761 (4.2%) |
| $12,500 to $14,999 | 360 (1.5%) | 809 (4.5%) |
| $15,000 to $17,499 | 309 (1.3%) | 352 (1.9%) |
| $17,500 to $19,999 | 360 (1.5%) | 432 (2.4%) |
| $20,000 to $22,499 | 489 (2.1%) | 644 (3.6%) |
| $22,500 to $24,999 | 765 (3.2%) | 647 (3.6%) |
| $25,000 to $29,999 | 956 (4.0%) | 889 (4.9%) |
| $30,000 to $34,999 | 855 (3.6%) | 1,098 (6.1%) |
| $35,000 to $39,999 | 1,102 (4.6%) | 907 (5.0%) |
| $40,000 to $44,999 | 1,513 (6.3%) | 1,143 (6.3%) |
| $45,000 to $49,999 | 1,669 (7.0%) | 784 (4.3%) |
| $50,000 to $54,999 | 1,304 (5.4%) | 1,111 (6.2%) |
| $55,000 to $64,999 | 2,660 (11.1%) | 1,535 (8.5%) |
| $65,000 to $74,999 | 1,523 (6.4%) | 1,195 (6.6%) |
| $75,000 to $99,999 | 3,148 (13.2%) | 1,350 (7.5%) |
| $100,000+ | 3,921 (16.4%) | 1,079 (6.0%) |
| Total | 23,908 (100.0%) | 18,042 (100.0%) |
Earnings by Sex by Educational Attainment in Ward County
Average earnings in Ward County are $59,416 for men and $44,232 for women, a difference of 25.6%. Men with an educational attainment of graduate degree enjoy the highest average annual earnings of $84,643, while those with less than high school education earn the least with $34,396. Women with an educational attainment of graduate degree earn the most with the average annual earnings of $72,485, while those with less than high school education have the smallest earnings of $21,194.
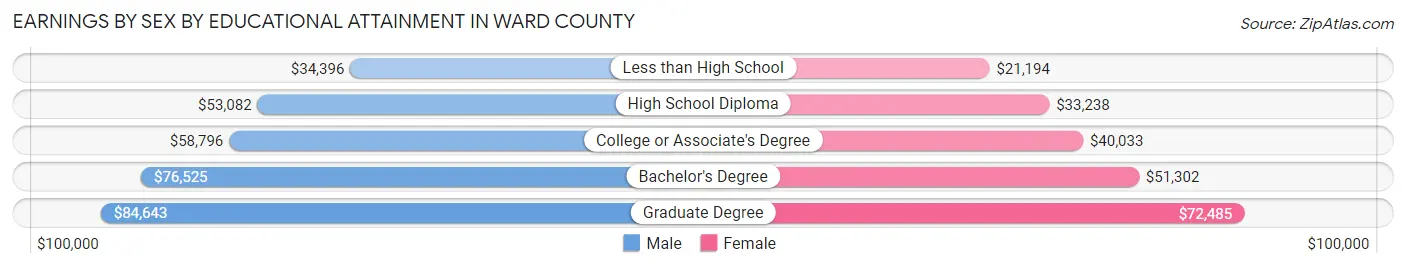
| Educational Attainment | Male Income | Female Income |
| Less than High School | $34,396 | $21,194 |
| High School Diploma | $53,082 | $33,238 |
| College or Associate's Degree | $58,796 | $40,033 |
| Bachelor's Degree | $76,525 | $51,302 |
| Graduate Degree | $84,643 | $72,485 |
| Total | $59,416 | $44,232 |
Family Income in Ward County
Family Income Brackets in Ward County
According to the Ward County family income data, there are 4,232 families falling into the $100,000 to $149,999 income range, which is the most common income bracket and makes up 25.3% of all families. Conversely, the $10,000 to $14,999 income bracket is the least frequent group with only 201 families (1.2%) belonging to this category.
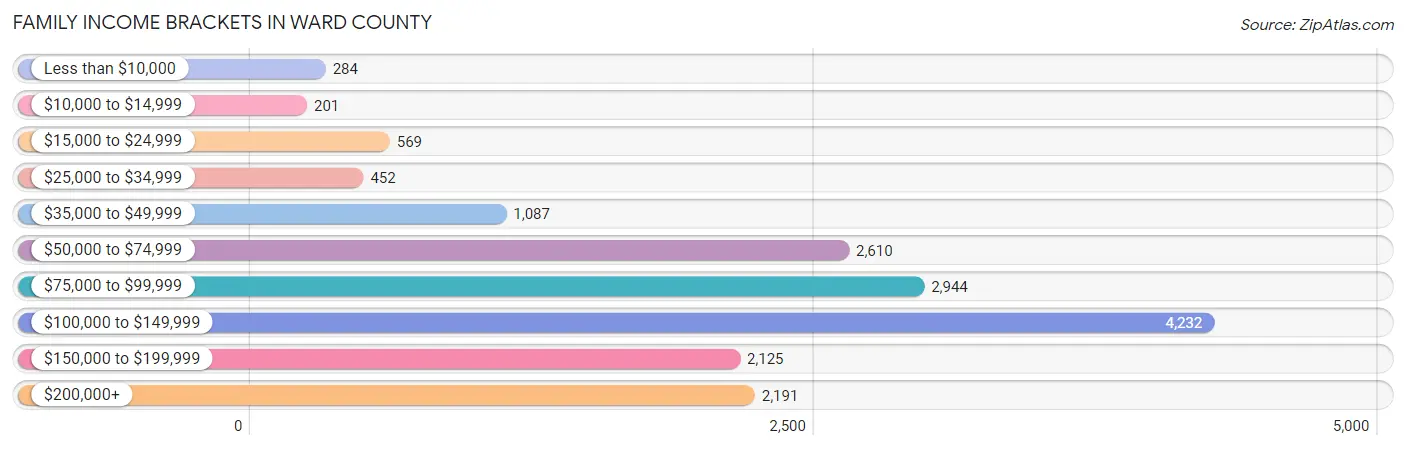
| Income Bracket | # Families | % Families |
| Less than $10,000 | 284 | 1.7% |
| $10,000 to $14,999 | 201 | 1.2% |
| $15,000 to $24,999 | 569 | 3.4% |
| $25,000 to $34,999 | 452 | 2.7% |
| $35,000 to $49,999 | 1,087 | 6.5% |
| $50,000 to $74,999 | 2,610 | 15.6% |
| $75,000 to $99,999 | 2,944 | 17.6% |
| $100,000 to $149,999 | 4,232 | 25.3% |
| $150,000 to $199,999 | 2,125 | 12.7% |
| $200,000+ | 2,191 | 13.1% |
Family Income by Famaliy Size in Ward County
6-person families (492 | 2.9%) account for the highest median family income in Ward County with $166,705 per family, while 2-person families (8,456 | 50.5%) have the highest median income of $42,352 per family member.
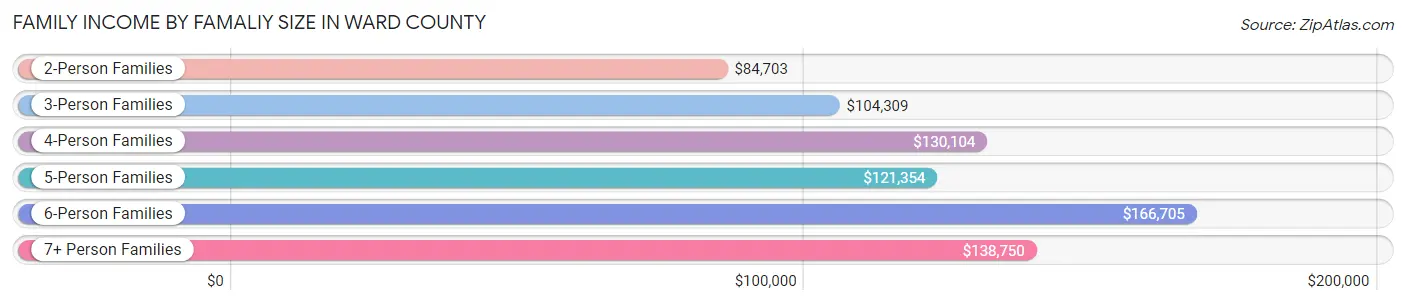
| Income Bracket | # Families | Median Income |
| 2-Person Families | 8,456 (50.5%) | $84,703 |
| 3-Person Families | 3,260 (19.5%) | $104,309 |
| 4-Person Families | 2,634 (15.8%) | $130,104 |
| 5-Person Families | 1,685 (10.1%) | $121,354 |
| 6-Person Families | 492 (2.9%) | $166,705 |
| 7+ Person Families | 202 (1.2%) | $138,750 |
| Total | 16,729 (100.0%) | $101,212 |
Family Income by Number of Earners in Ward County
The median family income in Ward County is $101,212, with families comprising 3+ earners (1,813) having the highest median family income of $163,875, while families with no earners (1,535) have the lowest median family income of $55,558, accounting for 10.8% and 9.2% of families, respectively.
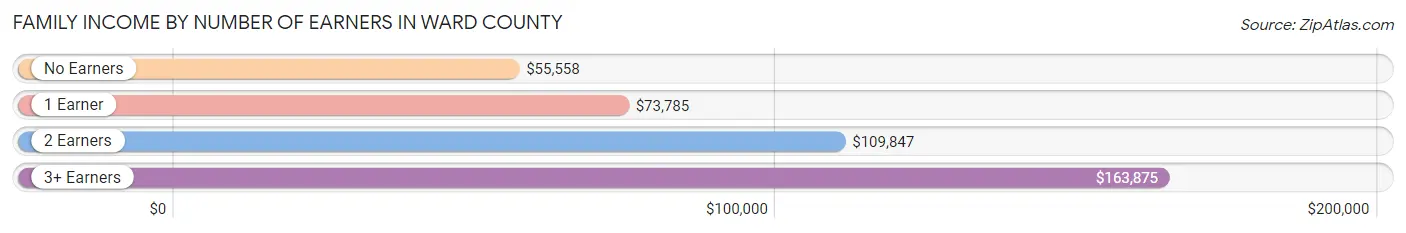
| Number of Earners | # Families | Median Income |
| No Earners | 1,535 (9.2%) | $55,558 |
| 1 Earner | 3,942 (23.6%) | $73,785 |
| 2 Earners | 9,439 (56.4%) | $109,847 |
| 3+ Earners | 1,813 (10.8%) | $163,875 |
| Total | 16,729 (100.0%) | $101,212 |
Household Income in Ward County
Household Income Brackets in Ward County
With 5,472 households falling in the category, the $100,000 to $149,999 income range is the most frequent in Ward County, accounting for 19.3% of all households. In contrast, only 1,162 households (4.1%) fall into the $10,000 to $14,999 income bracket, making it the least populous group.
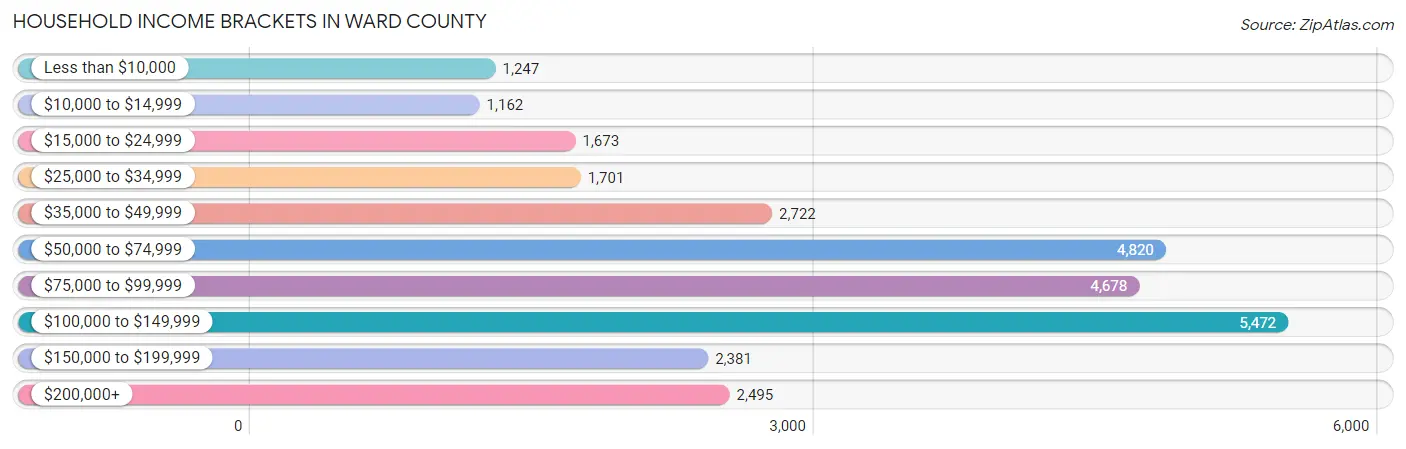
| Income Bracket | # Households | % Households |
| Less than $10,000 | 1,247 | 4.4% |
| $10,000 to $14,999 | 1,162 | 4.1% |
| $15,000 to $24,999 | 1,673 | 5.9% |
| $25,000 to $34,999 | 1,701 | 6.0% |
| $35,000 to $49,999 | 2,722 | 9.6% |
| $50,000 to $74,999 | 4,820 | 17.0% |
| $75,000 to $99,999 | 4,678 | 16.5% |
| $100,000 to $149,999 | 5,472 | 19.3% |
| $150,000 to $199,999 | 2,381 | 8.4% |
| $200,000+ | 2,495 | 8.8% |
Household Income by Householder Age in Ward County
The median household income in Ward County is $78,143, with the highest median household income of $100,122 found in the 45 to 64 years age bracket for the primary householder. A total of 8,470 households (29.9%) fall into this category. Meanwhile, the 15 to 24 years age bracket for the primary householder has the lowest median household income of $49,662, with 2,862 households (10.1%) in this group.
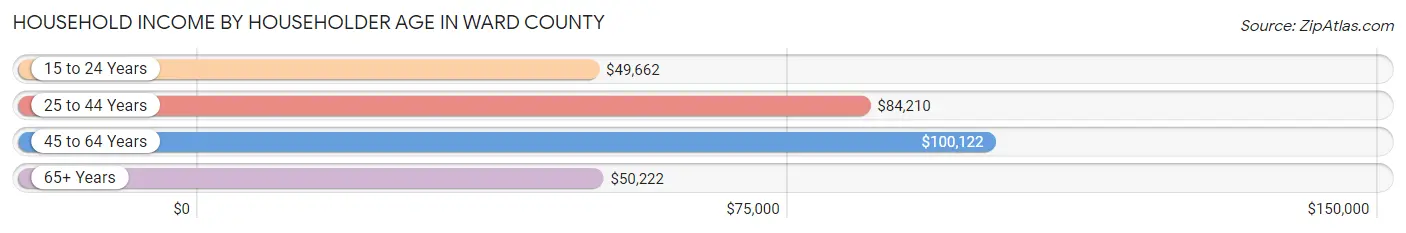
| Income Bracket | # Households | Median Income |
| 15 to 24 Years | 2,862 (10.1%) | $49,662 |
| 25 to 44 Years | 11,165 (39.4%) | $84,210 |
| 45 to 64 Years | 8,470 (29.9%) | $100,122 |
| 65+ Years | 5,854 (20.6%) | $50,222 |
| Total | 28,351 (100.0%) | $78,143 |
Poverty in Ward County
Income Below Poverty by Sex and Age in Ward County
With 6.8% poverty level for males and 11.4% for females among the residents of Ward County, 18 to 24 year old males and 18 to 24 year old females are the most vulnerable to poverty, with 543 males (12.9%) and 865 females (26.2%) in their respective age groups living below the poverty level.
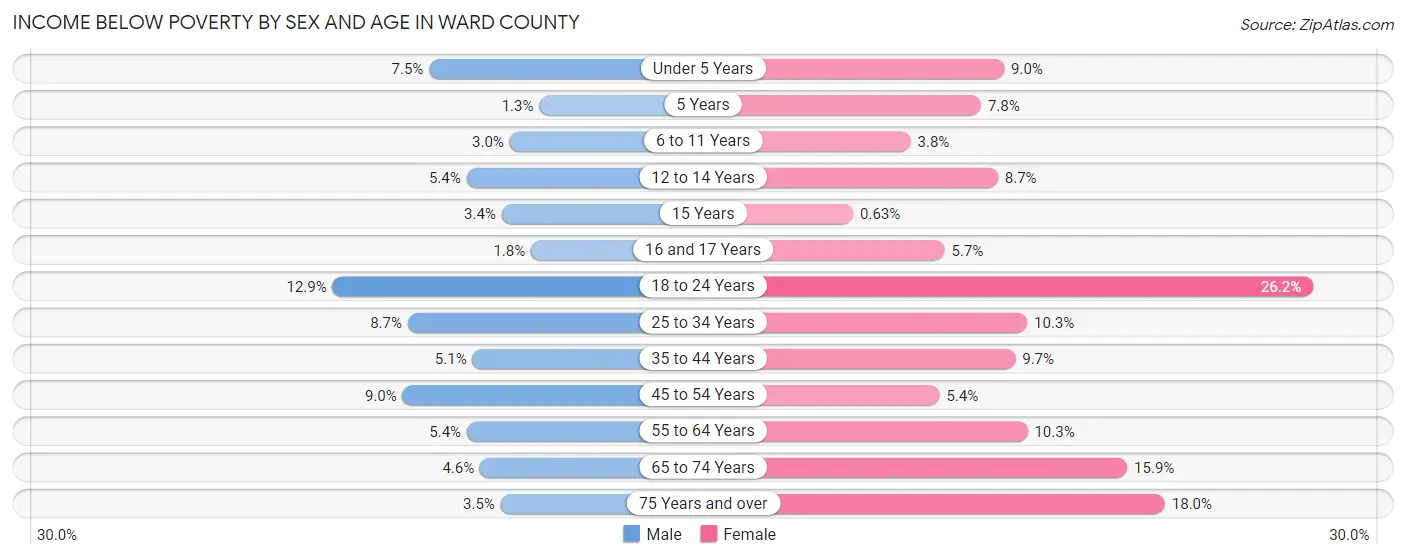
| Age Bracket | Male | Female |
| Under 5 Years | 190 (7.5%) | 221 (9.0%) |
| 5 Years | 6 (1.3%) | 32 (7.7%) |
| 6 to 11 Years | 89 (3.0%) | 99 (3.8%) |
| 12 to 14 Years | 68 (5.4%) | 117 (8.7%) |
| 15 Years | 16 (3.4%) | 2 (0.6%) |
| 16 and 17 Years | 16 (1.8%) | 45 (5.7%) |
| 18 to 24 Years | 543 (12.9%) | 865 (26.2%) |
| 25 to 34 Years | 580 (8.7%) | 536 (10.3%) |
| 35 to 44 Years | 245 (5.1%) | 414 (9.7%) |
| 45 to 54 Years | 307 (8.9%) | 170 (5.4%) |
| 55 to 64 Years | 195 (5.4%) | 394 (10.3%) |
| 65 to 74 Years | 120 (4.6%) | 396 (15.9%) |
| 75 Years and over | 51 (3.5%) | 410 (18.0%) |
| Total | 2,426 (6.8%) | 3,701 (11.4%) |
Income Above Poverty by Sex and Age in Ward County
According to the poverty statistics in Ward County, males aged 5 years and females aged 15 years are the age groups that are most secure financially, with 98.7% of males and 99.4% of females in these age groups living above the poverty line.
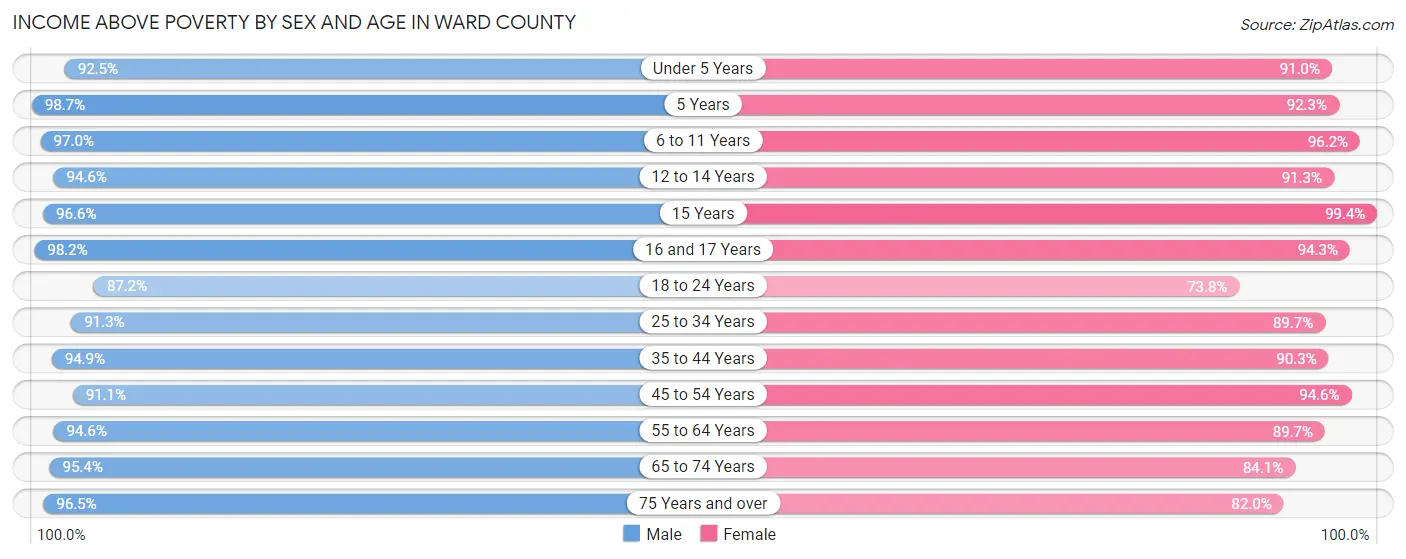
| Age Bracket | Male | Female |
| Under 5 Years | 2,355 (92.5%) | 2,225 (91.0%) |
| 5 Years | 443 (98.7%) | 381 (92.2%) |
| 6 to 11 Years | 2,885 (97.0%) | 2,486 (96.2%) |
| 12 to 14 Years | 1,193 (94.6%) | 1,230 (91.3%) |
| 15 Years | 451 (96.6%) | 313 (99.4%) |
| 16 and 17 Years | 875 (98.2%) | 742 (94.3%) |
| 18 to 24 Years | 3,683 (87.2%) | 2,432 (73.8%) |
| 25 to 34 Years | 6,118 (91.3%) | 4,656 (89.7%) |
| 35 to 44 Years | 4,595 (94.9%) | 3,871 (90.3%) |
| 45 to 54 Years | 3,122 (91.0%) | 2,955 (94.6%) |
| 55 to 64 Years | 3,434 (94.6%) | 3,417 (89.7%) |
| 65 to 74 Years | 2,465 (95.4%) | 2,096 (84.1%) |
| 75 Years and over | 1,412 (96.5%) | 1,869 (82.0%) |
| Total | 33,031 (93.2%) | 28,673 (88.6%) |
Income Below Poverty Among Married-Couple Families in Ward County
The poverty statistics for married-couple families in Ward County show that 2.9% or 392 of the total 13,623 families live below the poverty line. Families with 1 or 2 children have the highest poverty rate of 3.4%, comprising of 146 families. On the other hand, families with 5 or more children have the lowest poverty rate of 0.0%, which includes 0 families.
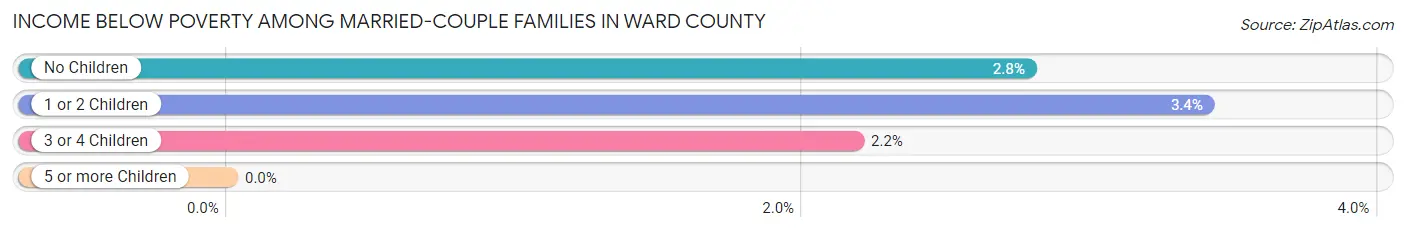
| Children | Above Poverty | Below Poverty |
| No Children | 7,420 (97.2%) | 212 (2.8%) |
| 1 or 2 Children | 4,152 (96.6%) | 146 (3.4%) |
| 3 or 4 Children | 1,523 (97.8%) | 34 (2.2%) |
| 5 or more Children | 136 (100.0%) | 0 (0.0%) |
| Total | 13,231 (97.1%) | 392 (2.9%) |
Income Below Poverty Among Single-Parent Households in Ward County
According to the poverty data in Ward County, 13.7% or 179 single-father households and 14.8% or 267 single-mother households are living below the poverty line. Among single-father households, those with 3 or 4 children have the highest poverty rate, with 7 households (21.2%) experiencing poverty. Likewise, among single-mother households, those with 3 or 4 children have the highest poverty rate, with 146 households (53.1%) falling below the poverty line.
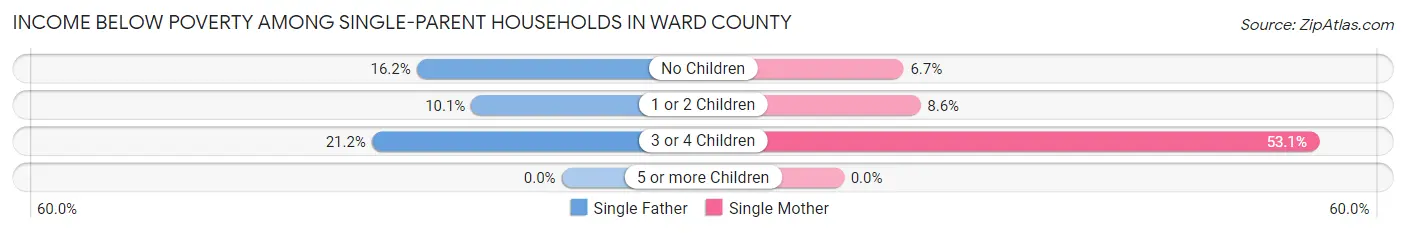
| Children | Single Father | Single Mother |
| No Children | 116 (16.2%) | 35 (6.7%) |
| 1 or 2 Children | 56 (10.1%) | 86 (8.6%) |
| 3 or 4 Children | 7 (21.2%) | 146 (53.1%) |
| 5 or more Children | 0 (0.0%) | 0 (0.0%) |
| Total | 179 (13.7%) | 267 (14.8%) |
Income Below Poverty Among Married-Couple vs Single-Parent Households in Ward County
The poverty data for Ward County shows that 392 of the married-couple family households (2.9%) and 446 of the single-parent households (14.4%) are living below the poverty level. Within the married-couple family households, those with 1 or 2 children have the highest poverty rate, with 146 households (3.4%) falling below the poverty line. Among the single-parent households, those with 3 or 4 children have the highest poverty rate, with 153 household (49.7%) living below poverty.
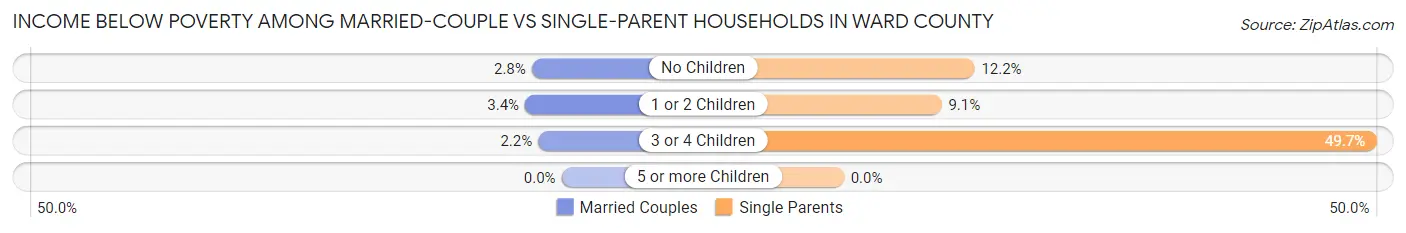
| Children | Married-Couple Families | Single-Parent Households |
| No Children | 212 (2.8%) | 151 (12.2%) |
| 1 or 2 Children | 146 (3.4%) | 142 (9.1%) |
| 3 or 4 Children | 34 (2.2%) | 153 (49.7%) |
| 5 or more Children | 0 (0.0%) | 0 (0.0%) |
| Total | 392 (2.9%) | 446 (14.4%) |
Employment Characteristics in Ward County
Employment by Class of Employer in Ward County
Among the 37,132 employed individuals in Ward County, private company employees (20,346 | 54.8%), federal government employees (5,470 | 14.7%), and not-for-profit organizations (3,559 | 9.6%) make up the most common classes of employment.
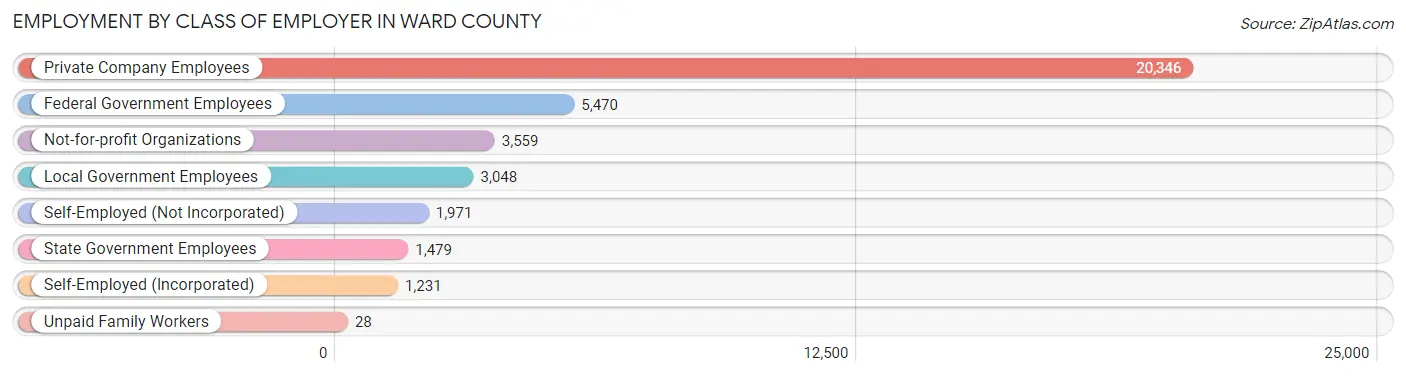
| Employer Class | # Employees | % Employees |
| Private Company Employees | 20,346 | 54.8% |
| Self-Employed (Incorporated) | 1,231 | 3.3% |
| Self-Employed (Not Incorporated) | 1,971 | 5.3% |
| Not-for-profit Organizations | 3,559 | 9.6% |
| Local Government Employees | 3,048 | 8.2% |
| State Government Employees | 1,479 | 4.0% |
| Federal Government Employees | 5,470 | 14.7% |
| Unpaid Family Workers | 28 | 0.1% |
| Total | 37,132 | 100.0% |
Employment Status by Age in Ward County
According to the labor force statistics for Ward County, out of the total population over 16 years of age (54,621), 72.5% or 39,600 individuals are in the labor force, with 3.7% or 1,465 of them unemployed. The age group with the highest labor force participation rate is 35 to 44 years, with 88.5% or 8,094 individuals in the labor force. Within the labor force, the 20 to 24 years age range has the highest percentage of unemployed individuals, with 13.2% or 755 of them being unemployed.
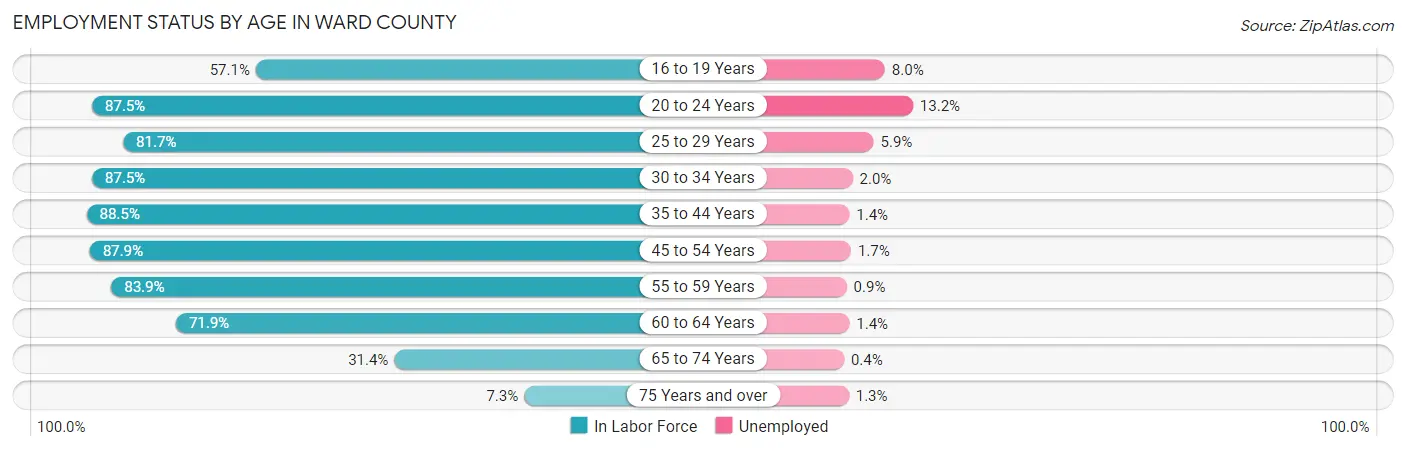
| Age Bracket | In Labor Force | Unemployed |
| 16 to 19 Years | 2,096 (57.1%) | 168 (8.0%) |
| 20 to 24 Years | 5,722 (87.5%) | 755 (13.2%) |
| 25 to 29 Years | 5,184 (81.7%) | 306 (5.9%) |
| 30 to 34 Years | 4,950 (87.5%) | 99 (2.0%) |
| 35 to 44 Years | 8,094 (88.5%) | 113 (1.4%) |
| 45 to 54 Years | 5,768 (87.9%) | 98 (1.7%) |
| 55 to 59 Years | 3,385 (83.9%) | 30 (0.9%) |
| 60 to 64 Years | 2,478 (71.9%) | 35 (1.4%) |
| 65 to 74 Years | 1,606 (31.4%) | 6 (0.4%) |
| 75 Years and over | 300 (7.3%) | 4 (1.3%) |
| Total | 39,600 (72.5%) | 1,465 (3.7%) |
Employment Status by Educational Attainment in Ward County
According to labor force statistics for Ward County, 84.9% of individuals (29,878) out of the total population between 25 and 64 years of age (35,192) are in the labor force, with 2.2% or 657 of them being unemployed. The group with the highest labor force participation rate are those with the educational attainment of bachelor's degree or higher, with 89.9% or 9,890 individuals in the labor force. Within the labor force, individuals with less than high school education have the highest percentage of unemployment, with 9.3% or 123 of them being unemployed.
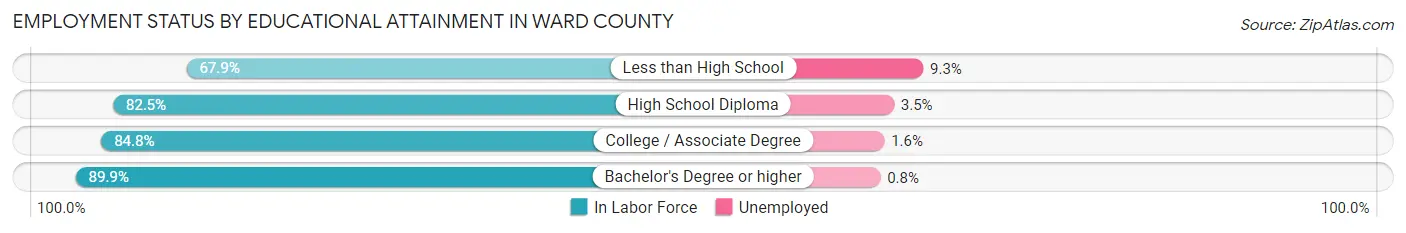
| Educational Attainment | In Labor Force | Unemployed |
| Less than High School | 1,327 (67.9%) | 182 (9.3%) |
| High School Diploma | 7,640 (82.5%) | 324 (3.5%) |
| College / Associate Degree | 11,003 (84.8%) | 208 (1.6%) |
| Bachelor's Degree or higher | 9,890 (89.9%) | 88 (0.8%) |
| Total | 29,878 (84.9%) | 774 (2.2%) |
Employment Occupations by Sex in Ward County
Management, Business, Science and Arts Occupations
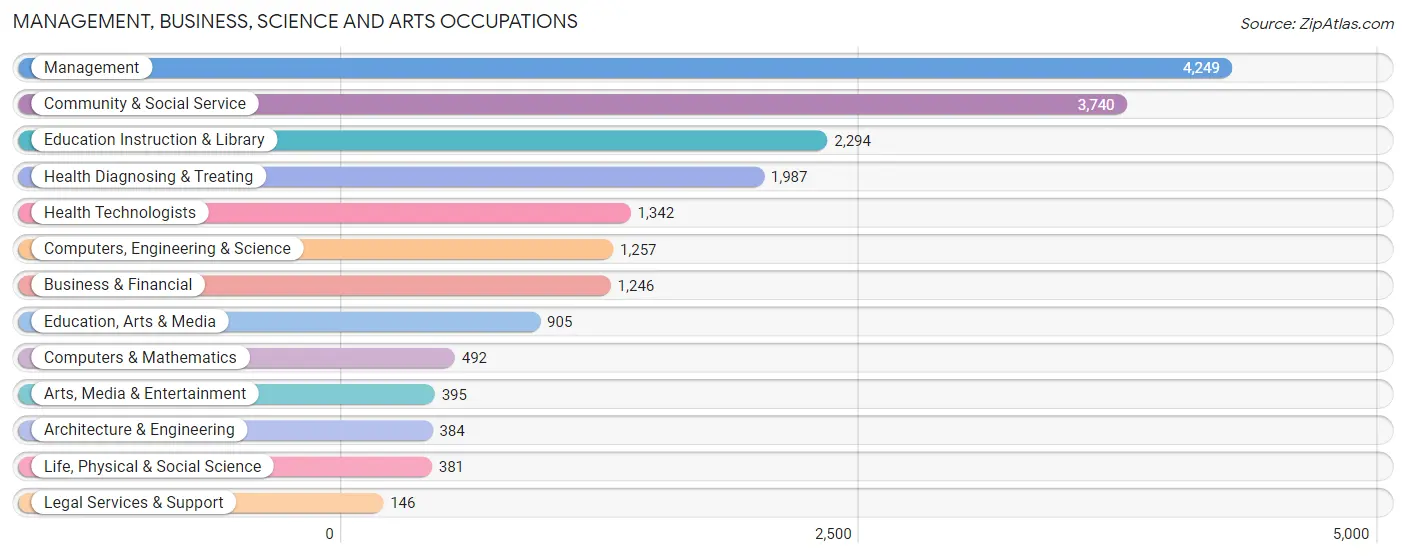
The most common Management, Business, Science and Arts occupations in Ward County are Management (4,249 | 12.4%), Community & Social Service (3,740 | 11.0%), Education Instruction & Library (2,294 | 6.7%), Health Diagnosing & Treating (1,987 | 5.8%), and Health Technologists (1,342 | 3.9%).
Management, Business, Science and Arts Occupations by Sex
Within the Management, Business, Science and Arts occupations in Ward County, the most male-oriented occupations are Architecture & Engineering (83.3%), Life, Physical & Social Science (78.5%), and Management (67.5%), while the most female-oriented occupations are Education Instruction & Library (84.4%), Health Technologists (82.8%), and Health Diagnosing & Treating (80.1%).
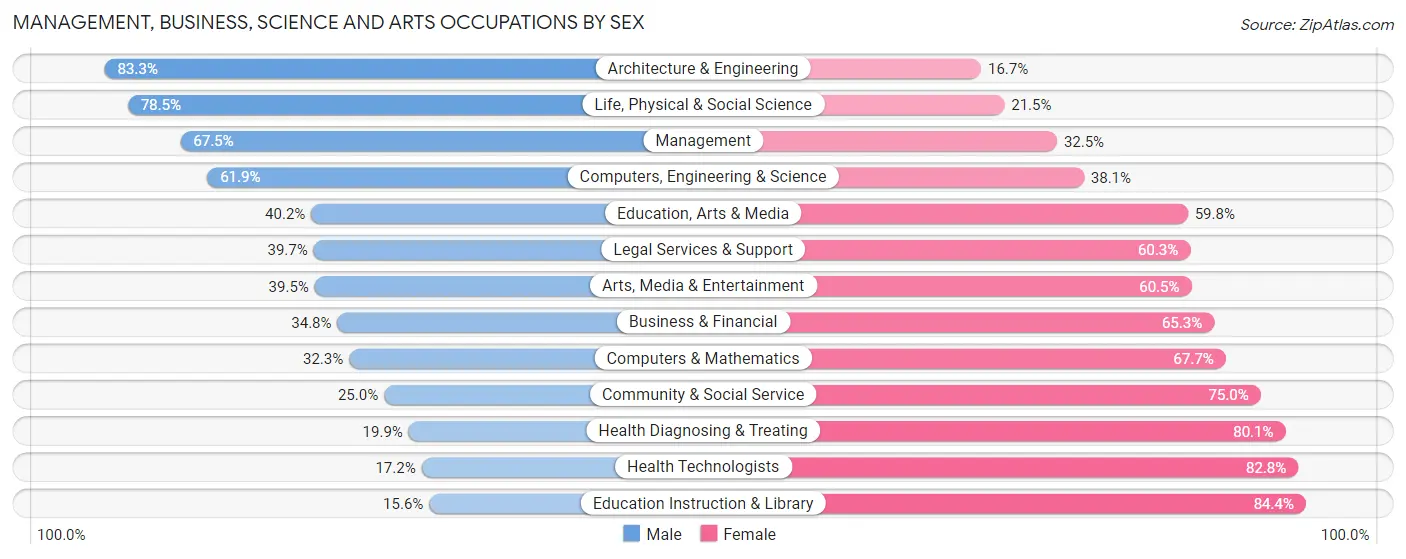
| Occupation | Male | Female |
| Management | 2,868 (67.5%) | 1,381 (32.5%) |
| Business & Financial | 433 (34.7%) | 813 (65.2%) |
| Computers, Engineering & Science | 778 (61.9%) | 479 (38.1%) |
| Computers & Mathematics | 159 (32.3%) | 333 (67.7%) |
| Architecture & Engineering | 320 (83.3%) | 64 (16.7%) |
| Life, Physical & Social Science | 299 (78.5%) | 82 (21.5%) |
| Community & Social Service | 936 (25.0%) | 2,804 (75.0%) |
| Education, Arts & Media | 364 (40.2%) | 541 (59.8%) |
| Legal Services & Support | 58 (39.7%) | 88 (60.3%) |
| Education Instruction & Library | 358 (15.6%) | 1,936 (84.4%) |
| Arts, Media & Entertainment | 156 (39.5%) | 239 (60.5%) |
| Health Diagnosing & Treating | 395 (19.9%) | 1,592 (80.1%) |
| Health Technologists | 231 (17.2%) | 1,111 (82.8%) |
| Total (Category) | 5,410 (43.3%) | 7,069 (56.7%) |
| Total (Overall) | 18,308 (53.6%) | 15,862 (46.4%) |
Services Occupations
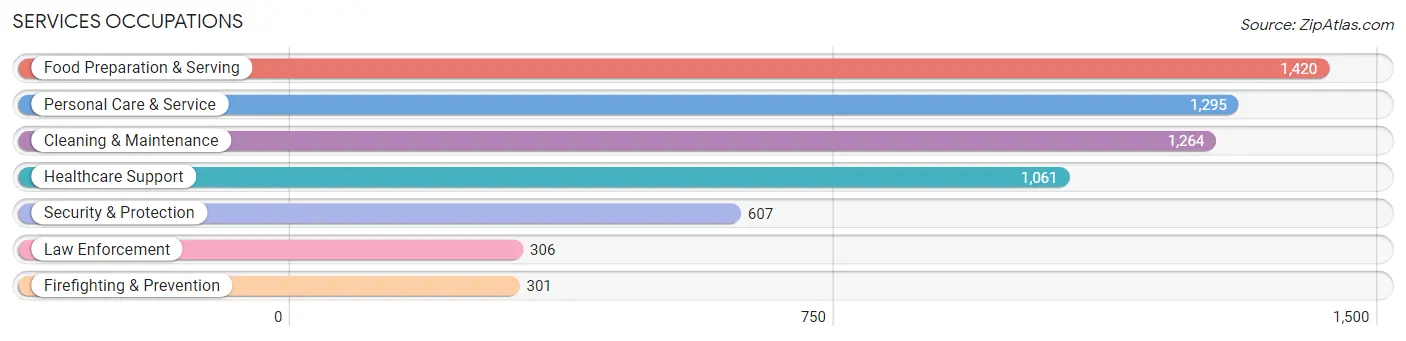
The most common Services occupations in Ward County are Food Preparation & Serving (1,420 | 4.2%), Personal Care & Service (1,295 | 3.8%), Cleaning & Maintenance (1,264 | 3.7%), Healthcare Support (1,061 | 3.1%), and Security & Protection (607 | 1.8%).
Services Occupations by Sex
Within the Services occupations in Ward County, the most male-oriented occupations are Firefighting & Prevention (88.7%), Security & Protection (84.4%), and Law Enforcement (80.1%), while the most female-oriented occupations are Healthcare Support (95.0%), Personal Care & Service (91.3%), and Food Preparation & Serving (59.1%).
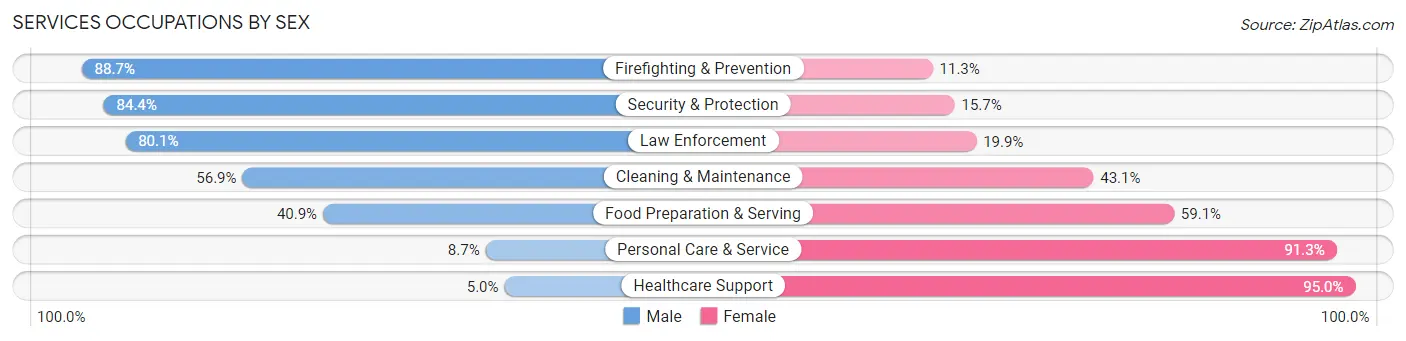
| Occupation | Male | Female |
| Healthcare Support | 53 (5.0%) | 1,008 (95.0%) |
| Security & Protection | 512 (84.4%) | 95 (15.7%) |
| Firefighting & Prevention | 267 (88.7%) | 34 (11.3%) |
| Law Enforcement | 245 (80.1%) | 61 (19.9%) |
| Food Preparation & Serving | 581 (40.9%) | 839 (59.1%) |
| Cleaning & Maintenance | 719 (56.9%) | 545 (43.1%) |
| Personal Care & Service | 113 (8.7%) | 1,182 (91.3%) |
| Total (Category) | 1,978 (35.0%) | 3,669 (65.0%) |
| Total (Overall) | 18,308 (53.6%) | 15,862 (46.4%) |
Sales and Office Occupations
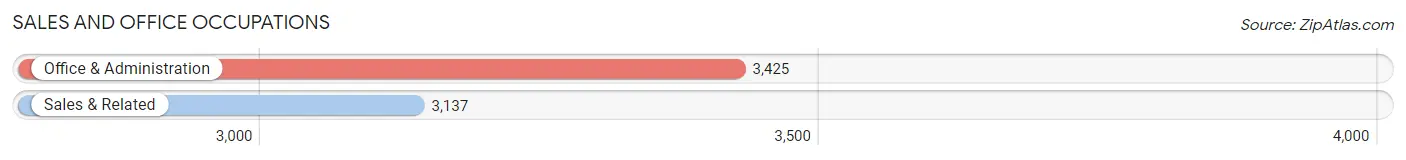
The most common Sales and Office occupations in Ward County are Office & Administration (3,425 | 10.0%), and Sales & Related (3,137 | 9.2%).
Sales and Office Occupations by Sex
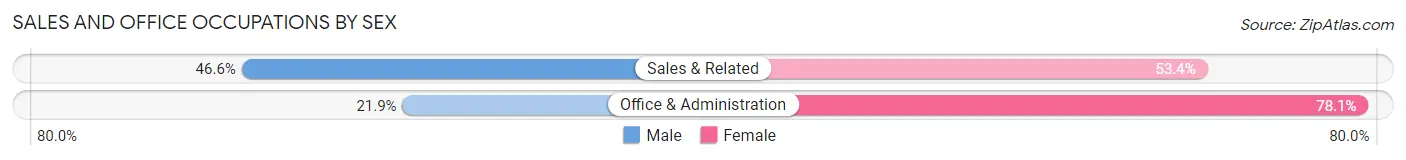
| Occupation | Male | Female |
| Sales & Related | 1,462 (46.6%) | 1,675 (53.4%) |
| Office & Administration | 749 (21.9%) | 2,676 (78.1%) |
| Total (Category) | 2,211 (33.7%) | 4,351 (66.3%) |
| Total (Overall) | 18,308 (53.6%) | 15,862 (46.4%) |
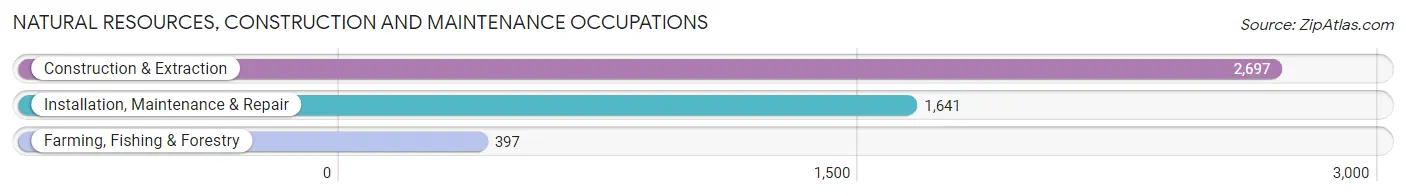
Natural Resources, Construction and Maintenance Occupations
The most common Natural Resources, Construction and Maintenance occupations in Ward County are Construction & Extraction (2,697 | 7.9%), Installation, Maintenance & Repair (1,641 | 4.8%), and Farming, Fishing & Forestry (397 | 1.2%).
Natural Resources, Construction and Maintenance Occupations by Sex
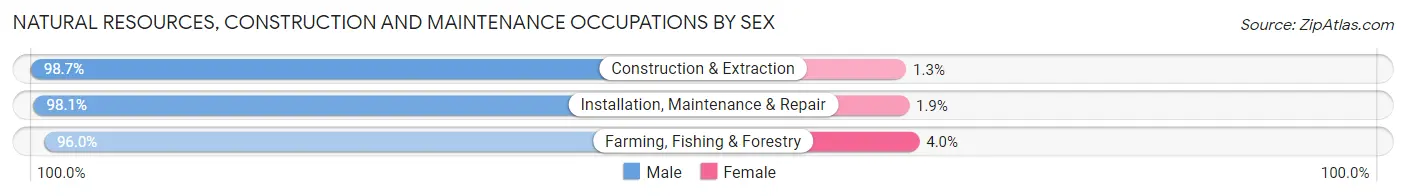
| Occupation | Male | Female |
| Farming, Fishing & Forestry | 381 (96.0%) | 16 (4.0%) |
| Construction & Extraction | 2,662 (98.7%) | 35 (1.3%) |
| Installation, Maintenance & Repair | 1,610 (98.1%) | 31 (1.9%) |
| Total (Category) | 4,653 (98.3%) | 82 (1.7%) |
| Total (Overall) | 18,308 (53.6%) | 15,862 (46.4%) |
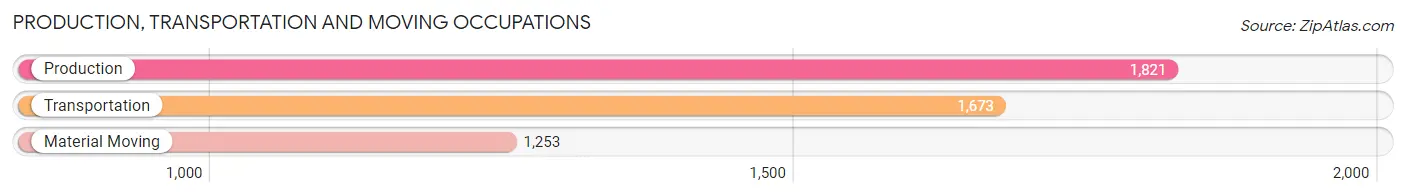
Production, Transportation and Moving Occupations
The most common Production, Transportation and Moving occupations in Ward County are Production (1,821 | 5.3%), Transportation (1,673 | 4.9%), and Material Moving (1,253 | 3.7%).
Production, Transportation and Moving Occupations by Sex
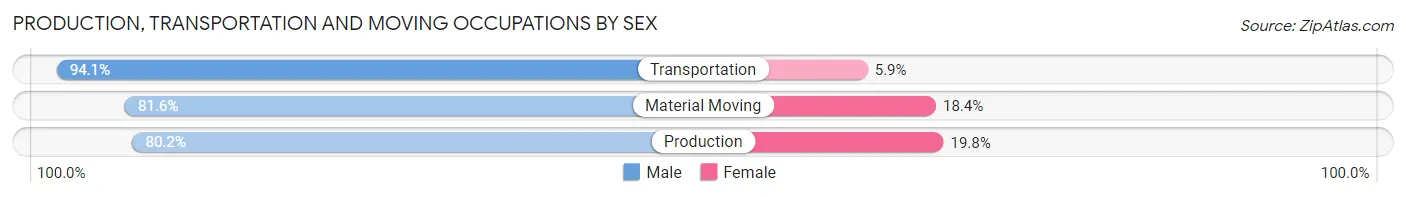
| Occupation | Male | Female |
| Production | 1,460 (80.2%) | 361 (19.8%) |
| Transportation | 1,574 (94.1%) | 99 (5.9%) |
| Material Moving | 1,022 (81.6%) | 231 (18.4%) |
| Total (Category) | 4,056 (85.4%) | 691 (14.6%) |
| Total (Overall) | 18,308 (53.6%) | 15,862 (46.4%) |
Employment Industries by Sex in Ward County
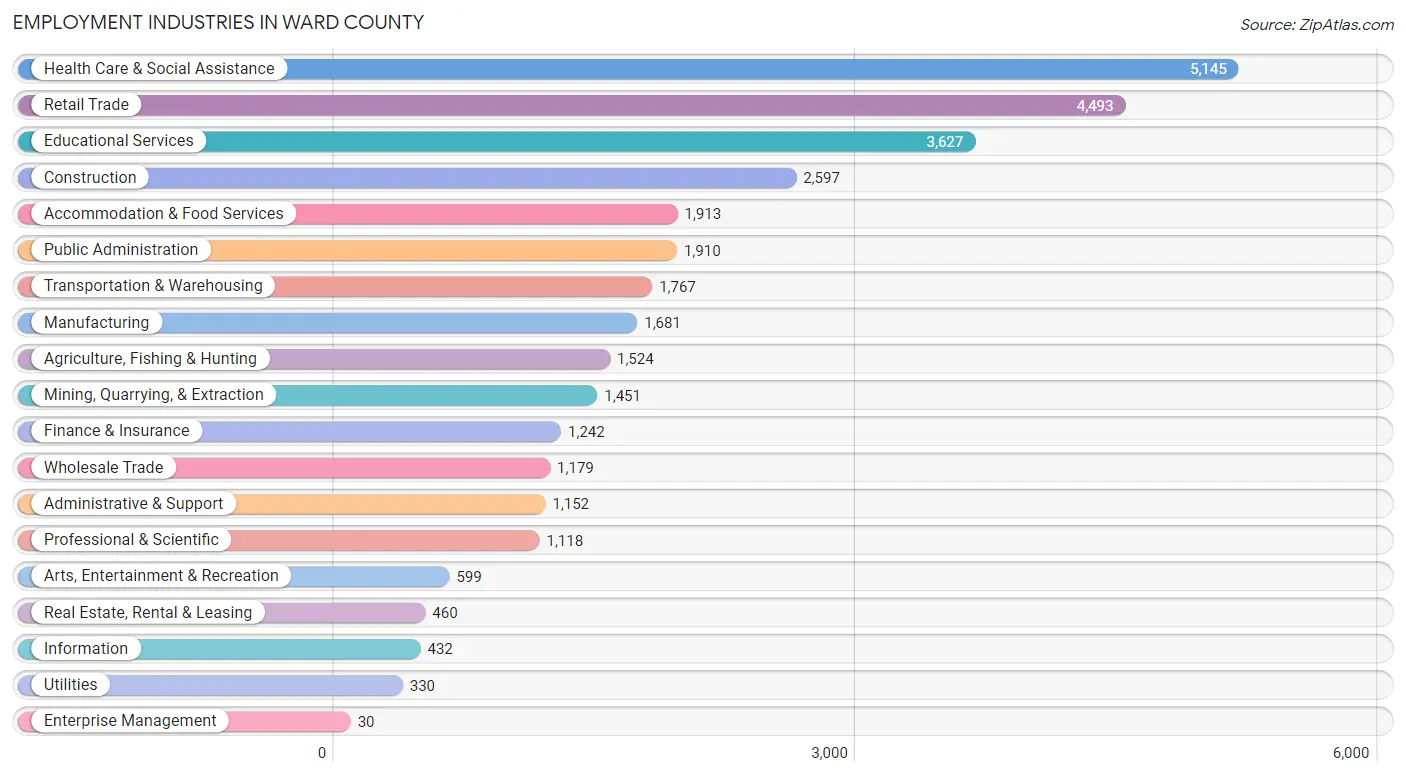
Employment Industries in Ward County
The major employment industries in Ward County include Health Care & Social Assistance (5,145 | 15.1%), Retail Trade (4,493 | 13.2%), Educational Services (3,627 | 10.6%), Construction (2,597 | 7.6%), and Accommodation & Food Services (1,913 | 5.6%).
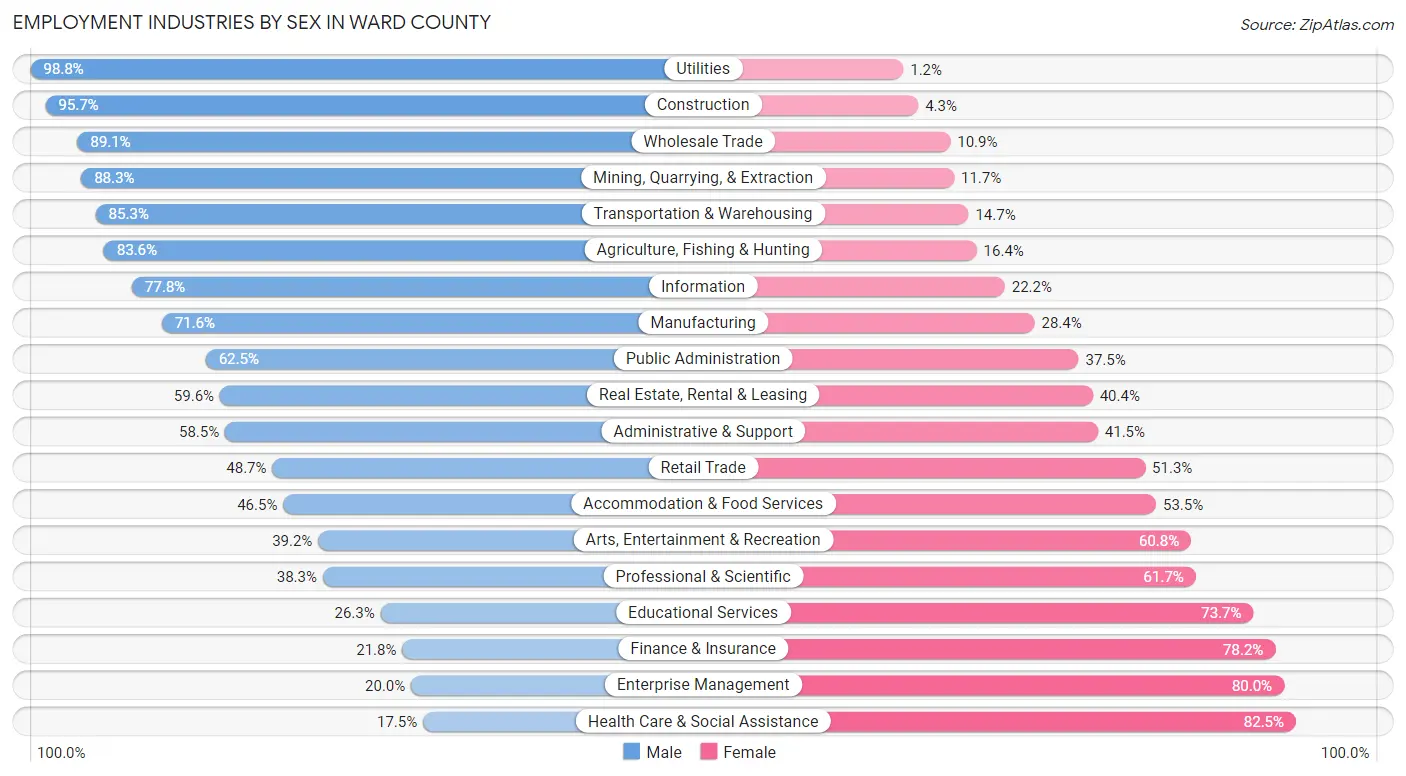
Employment Industries by Sex in Ward County
The Ward County industries that see more men than women are Utilities (98.8%), Construction (95.7%), and Wholesale Trade (89.1%), whereas the industries that tend to have a higher number of women are Health Care & Social Assistance (82.5%), Enterprise Management (80.0%), and Finance & Insurance (78.2%).
| Industry | Male | Female |
| Agriculture, Fishing & Hunting | 1,274 (83.6%) | 250 (16.4%) |
| Mining, Quarrying, & Extraction | 1,281 (88.3%) | 170 (11.7%) |
| Construction | 2,485 (95.7%) | 112 (4.3%) |
| Manufacturing | 1,204 (71.6%) | 477 (28.4%) |
| Wholesale Trade | 1,050 (89.1%) | 129 (10.9%) |
| Retail Trade | 2,189 (48.7%) | 2,304 (51.3%) |
| Transportation & Warehousing | 1,507 (85.3%) | 260 (14.7%) |
| Utilities | 326 (98.8%) | 4 (1.2%) |
| Information | 336 (77.8%) | 96 (22.2%) |
| Finance & Insurance | 271 (21.8%) | 971 (78.2%) |
| Real Estate, Rental & Leasing | 274 (59.6%) | 186 (40.4%) |
| Professional & Scientific | 428 (38.3%) | 690 (61.7%) |
| Enterprise Management | 6 (20.0%) | 24 (80.0%) |
| Administrative & Support | 674 (58.5%) | 478 (41.5%) |
| Educational Services | 955 (26.3%) | 2,672 (73.7%) |
| Health Care & Social Assistance | 902 (17.5%) | 4,243 (82.5%) |
| Arts, Entertainment & Recreation | 235 (39.2%) | 364 (60.8%) |
| Accommodation & Food Services | 889 (46.5%) | 1,024 (53.5%) |
| Public Administration | 1,194 (62.5%) | 716 (37.5%) |
| Total | 18,308 (53.6%) | 15,862 (46.4%) |
Education in Ward County
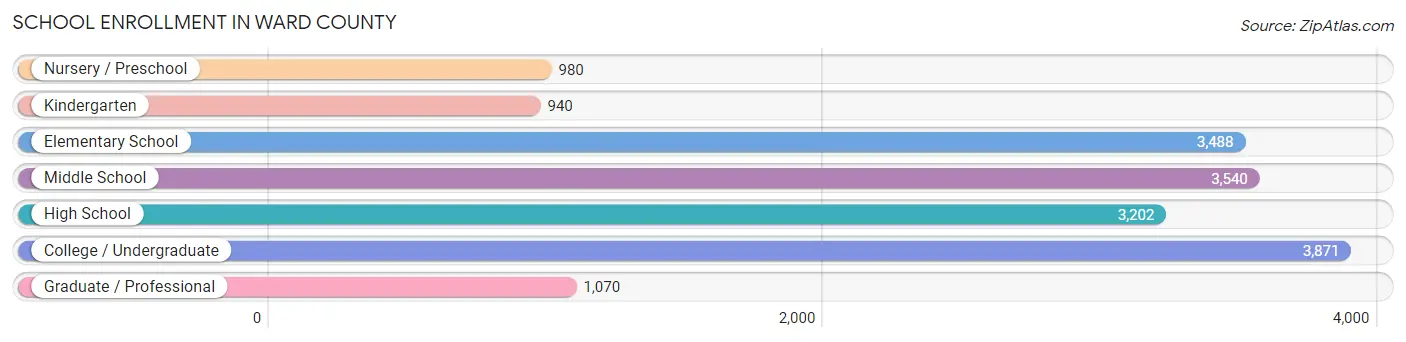
School Enrollment in Ward County
The most common levels of schooling among the 17,091 students in Ward County are college / undergraduate (3,871 | 22.7%), middle school (3,540 | 20.7%), and elementary school (3,488 | 20.4%).
| School Level | # Students | % Students |
| Nursery / Preschool | 980 | 5.7% |
| Kindergarten | 940 | 5.5% |
| Elementary School | 3,488 | 20.4% |
| Middle School | 3,540 | 20.7% |
| High School | 3,202 | 18.7% |
| College / Undergraduate | 3,871 | 22.7% |
| Graduate / Professional | 1,070 | 6.3% |
| Total | 17,091 | 100.0% |
School Enrollment by Age by Funding Source in Ward County
Out of a total of 17,091 students who are enrolled in schools in Ward County, 2,119 (12.4%) attend a private institution, while the remaining 14,972 (87.6%) are enrolled in public schools. The age group of 3 to 4 year olds has the highest likelihood of being enrolled in private schools, with 234 (45.1% in the age bracket) enrolled. Conversely, the age group of 20 to 24 year olds has the lowest likelihood of being enrolled in a private school, with 1,910 (96.9% in the age bracket) attending a public institution.
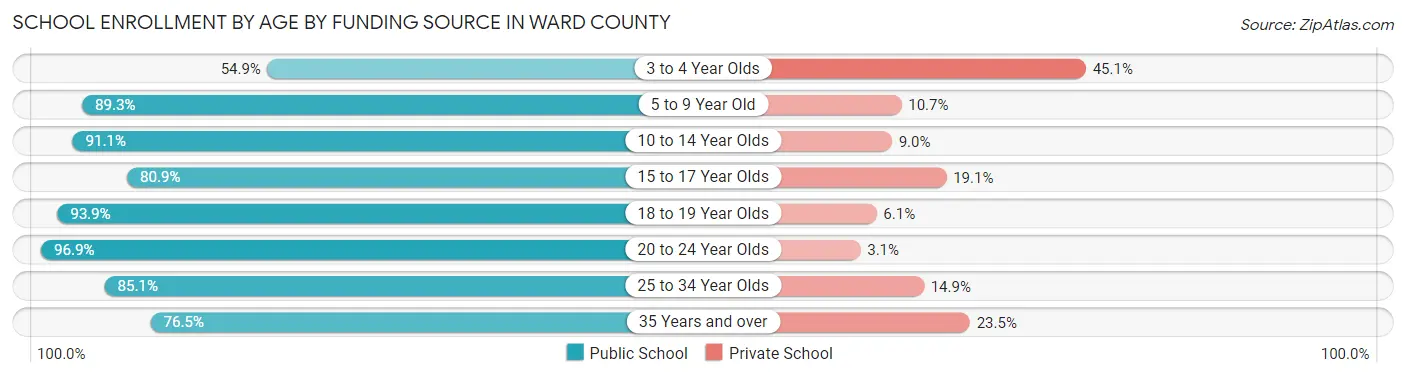
| Age Bracket | Public School | Private School |
| 3 to 4 Year Olds | 285 (54.9%) | 234 (45.1%) |
| 5 to 9 Year Old | 3,925 (89.3%) | 472 (10.7%) |
| 10 to 14 Year Olds | 3,897 (91.0%) | 383 (8.9%) |
| 15 to 17 Year Olds | 1,970 (80.9%) | 465 (19.1%) |
| 18 to 19 Year Olds | 1,154 (93.9%) | 75 (6.1%) |
| 20 to 24 Year Olds | 1,910 (96.9%) | 61 (3.1%) |
| 25 to 34 Year Olds | 1,039 (85.1%) | 182 (14.9%) |
| 35 Years and over | 795 (76.5%) | 244 (23.5%) |
| Total | 14,972 (87.6%) | 2,119 (12.4%) |
Educational Attainment by Field of Study in Ward County
Education (2,947 | 20.7%), business (2,365 | 16.6%), science & technology (1,917 | 13.4%), arts & humanities (1,750 | 12.3%), and bio, nature & agricultural (1,176 | 8.2%) are the most common fields of study among 14,265 individuals in Ward County who have obtained a bachelor's degree or higher.
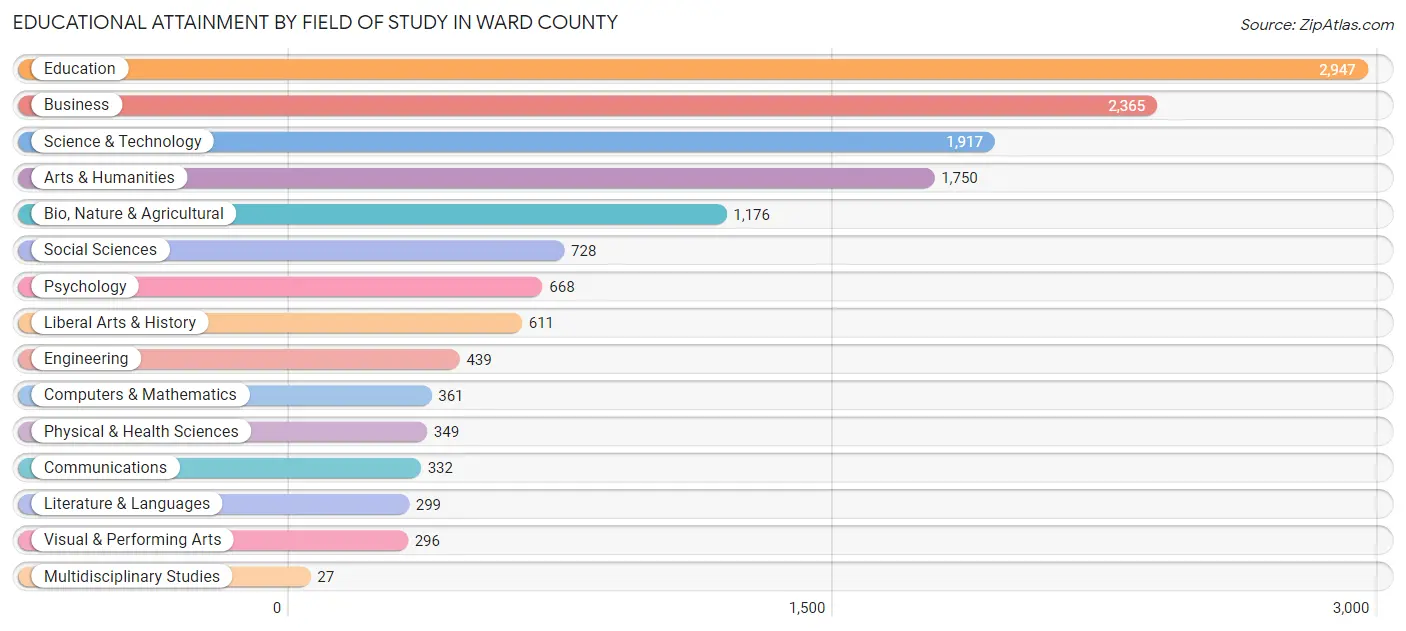
| Field of Study | # Graduates | % Graduates |
| Computers & Mathematics | 361 | 2.5% |
| Bio, Nature & Agricultural | 1,176 | 8.2% |
| Physical & Health Sciences | 349 | 2.5% |
| Psychology | 668 | 4.7% |
| Social Sciences | 728 | 5.1% |
| Engineering | 439 | 3.1% |
| Multidisciplinary Studies | 27 | 0.2% |
| Science & Technology | 1,917 | 13.4% |
| Business | 2,365 | 16.6% |
| Education | 2,947 | 20.7% |
| Literature & Languages | 299 | 2.1% |
| Liberal Arts & History | 611 | 4.3% |
| Visual & Performing Arts | 296 | 2.1% |
| Communications | 332 | 2.3% |
| Arts & Humanities | 1,750 | 12.3% |
| Total | 14,265 | 100.0% |
Transportation & Commute in Ward County
Vehicle Availability by Sex in Ward County
The most prevalent vehicle ownership categories in Ward County are males with 2 vehicles (9,037, accounting for 43.7%) and females with 2 vehicles (6,399, making up 57.6%).
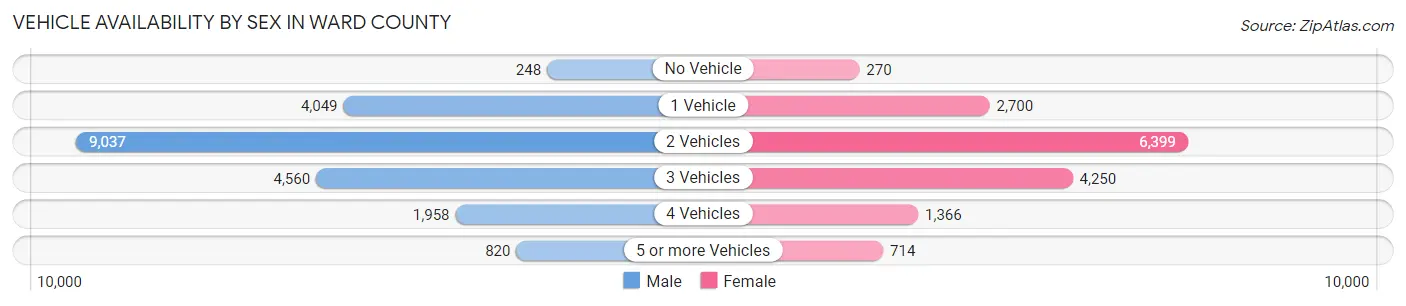
| Vehicles Available | Male | Female |
| No Vehicle | 248 (1.2%) | 270 (1.7%) |
| 1 Vehicle | 4,049 (19.6%) | 2,700 (17.2%) |
| 2 Vehicles | 9,037 (43.7%) | 6,399 (40.8%) |
| 3 Vehicles | 4,560 (22.1%) | 4,250 (27.1%) |
| 4 Vehicles | 1,958 (9.5%) | 1,366 (8.7%) |
| 5 or more Vehicles | 820 (4.0%) | 714 (4.5%) |
| Total | 20,672 (100.0%) | 15,699 (100.0%) |
Commute Time in Ward County
The most frequently occuring commute durations in Ward County are 10 to 14 minutes (9,158 commuters, 25.8%), 5 to 9 minutes (7,499 commuters, 21.1%), and 15 to 19 minutes (5,916 commuters, 16.7%).
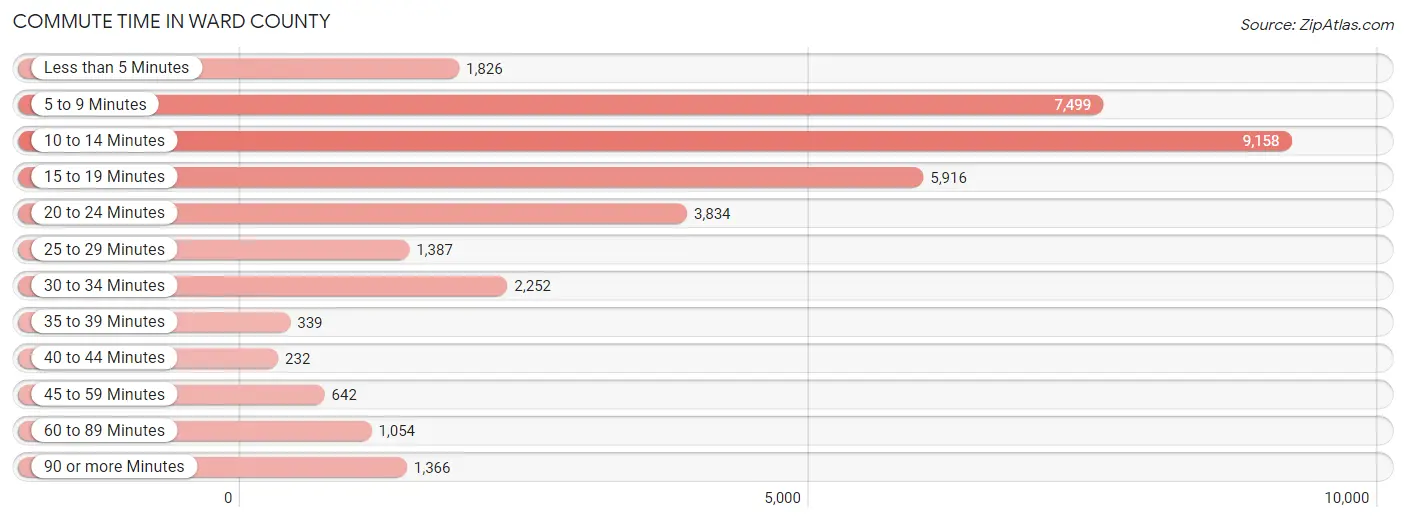
| Commute Time | # Commuters | % Commuters |
| Less than 5 Minutes | 1,826 | 5.1% |
| 5 to 9 Minutes | 7,499 | 21.1% |
| 10 to 14 Minutes | 9,158 | 25.8% |
| 15 to 19 Minutes | 5,916 | 16.7% |
| 20 to 24 Minutes | 3,834 | 10.8% |
| 25 to 29 Minutes | 1,387 | 3.9% |
| 30 to 34 Minutes | 2,252 | 6.3% |
| 35 to 39 Minutes | 339 | 0.9% |
| 40 to 44 Minutes | 232 | 0.6% |
| 45 to 59 Minutes | 642 | 1.8% |
| 60 to 89 Minutes | 1,054 | 3.0% |
| 90 or more Minutes | 1,366 | 3.8% |
Commute Time by Sex in Ward County
The most common commute times in Ward County are 10 to 14 minutes (4,467 commuters, 21.7%) for males and 10 to 14 minutes (4,691 commuters, 31.3%) for females.
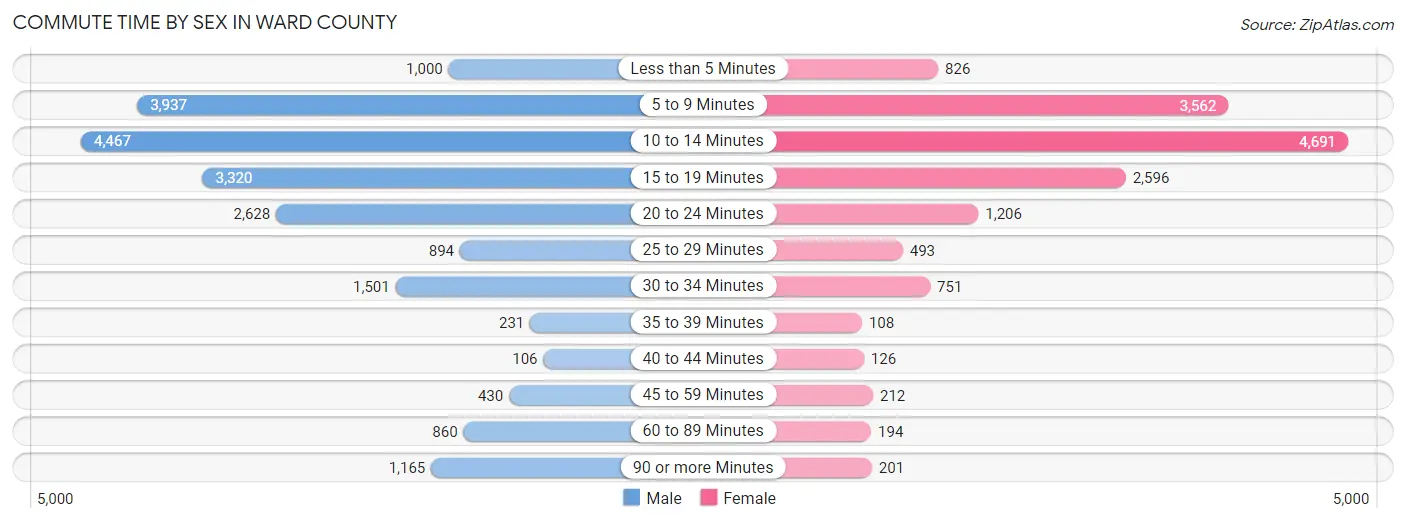
| Commute Time | Male | Female |
| Less than 5 Minutes | 1,000 (4.9%) | 826 (5.5%) |
| 5 to 9 Minutes | 3,937 (19.2%) | 3,562 (23.8%) |
| 10 to 14 Minutes | 4,467 (21.7%) | 4,691 (31.3%) |
| 15 to 19 Minutes | 3,320 (16.2%) | 2,596 (17.3%) |
| 20 to 24 Minutes | 2,628 (12.8%) | 1,206 (8.1%) |
| 25 to 29 Minutes | 894 (4.3%) | 493 (3.3%) |
| 30 to 34 Minutes | 1,501 (7.3%) | 751 (5.0%) |
| 35 to 39 Minutes | 231 (1.1%) | 108 (0.7%) |
| 40 to 44 Minutes | 106 (0.5%) | 126 (0.8%) |
| 45 to 59 Minutes | 430 (2.1%) | 212 (1.4%) |
| 60 to 89 Minutes | 860 (4.2%) | 194 (1.3%) |
| 90 or more Minutes | 1,165 (5.7%) | 201 (1.3%) |
Time of Departure to Work by Sex in Ward County
The most frequent times of departure to work in Ward County are 7:30 AM to 7:59 AM (3,829, 18.6%) for males and 7:30 AM to 7:59 AM (3,893, 26.0%) for females.
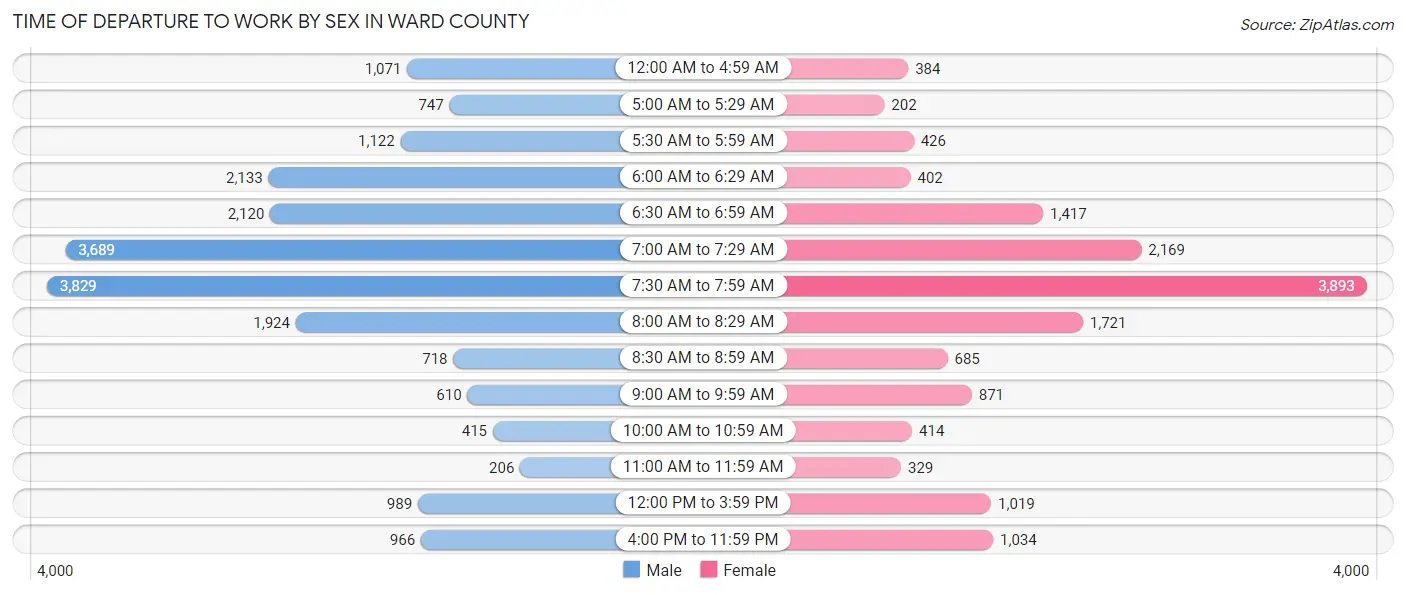
| Time of Departure | Male | Female |
| 12:00 AM to 4:59 AM | 1,071 (5.2%) | 384 (2.6%) |
| 5:00 AM to 5:29 AM | 747 (3.6%) | 202 (1.3%) |
| 5:30 AM to 5:59 AM | 1,122 (5.5%) | 426 (2.9%) |
| 6:00 AM to 6:29 AM | 2,133 (10.4%) | 402 (2.7%) |
| 6:30 AM to 6:59 AM | 2,120 (10.3%) | 1,417 (9.5%) |
| 7:00 AM to 7:29 AM | 3,689 (18.0%) | 2,169 (14.5%) |
| 7:30 AM to 7:59 AM | 3,829 (18.6%) | 3,893 (26.0%) |
| 8:00 AM to 8:29 AM | 1,924 (9.4%) | 1,721 (11.5%) |
| 8:30 AM to 8:59 AM | 718 (3.5%) | 685 (4.6%) |
| 9:00 AM to 9:59 AM | 610 (3.0%) | 871 (5.8%) |
| 10:00 AM to 10:59 AM | 415 (2.0%) | 414 (2.8%) |
| 11:00 AM to 11:59 AM | 206 (1.0%) | 329 (2.2%) |
| 12:00 PM to 3:59 PM | 989 (4.8%) | 1,019 (6.8%) |
| 4:00 PM to 11:59 PM | 966 (4.7%) | 1,034 (6.9%) |
| Total | 20,539 (100.0%) | 14,966 (100.0%) |
Housing Occupancy in Ward County
Occupancy by Ownership in Ward County
Of the total 28,351 dwellings in Ward County, owner-occupied units account for 17,350 (61.2%), while renter-occupied units make up 11,001 (38.8%).
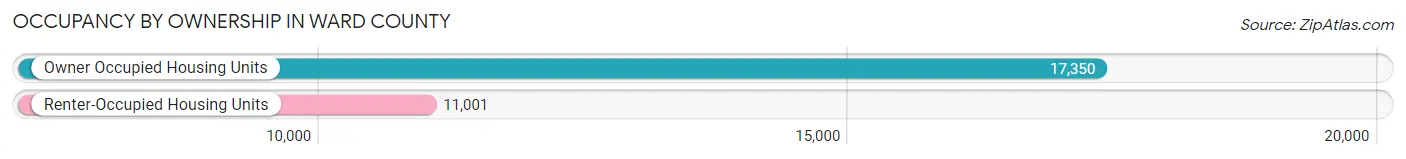
| Occupancy | # Housing Units | % Housing Units |
| Owner Occupied Housing Units | 17,350 | 61.2% |
| Renter-Occupied Housing Units | 11,001 | 38.8% |
| Total Occupied Housing Units | 28,351 | 100.0% |
Occupancy by Household Size in Ward County
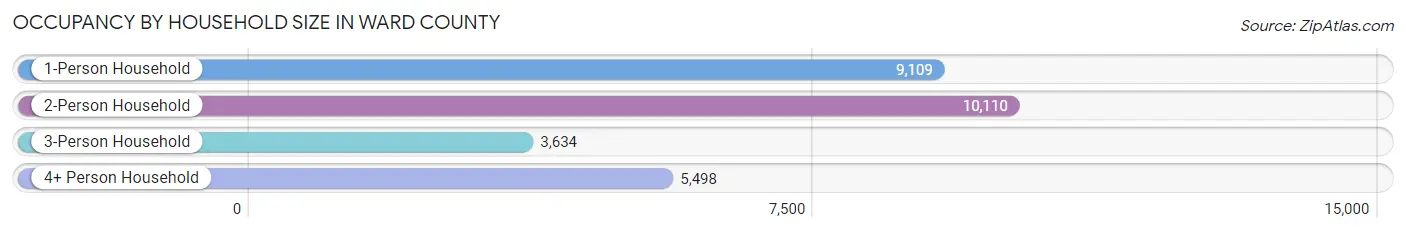
| Household Size | # Housing Units | % Housing Units |
| 1-Person Household | 9,109 | 32.1% |
| 2-Person Household | 10,110 | 35.7% |
| 3-Person Household | 3,634 | 12.8% |
| 4+ Person Household | 5,498 | 19.4% |
| Total Housing Units | 28,351 | 100.0% |
Occupancy by Ownership by Household Size in Ward County
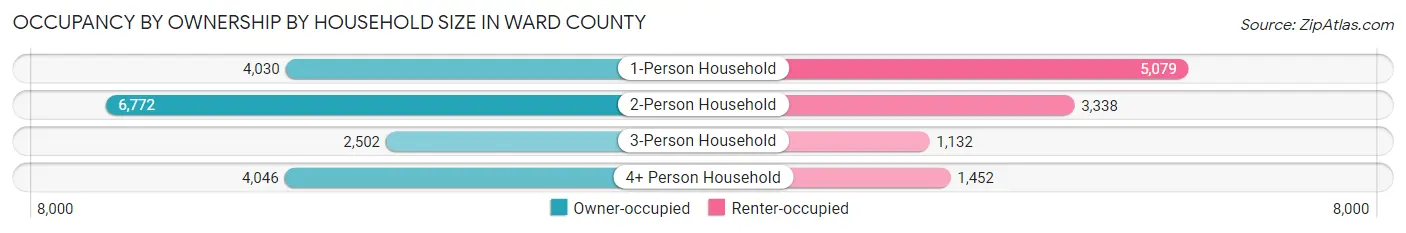
| Household Size | Owner-occupied | Renter-occupied |
| 1-Person Household | 4,030 (44.2%) | 5,079 (55.8%) |
| 2-Person Household | 6,772 (67.0%) | 3,338 (33.0%) |
| 3-Person Household | 2,502 (68.9%) | 1,132 (31.1%) |
| 4+ Person Household | 4,046 (73.6%) | 1,452 (26.4%) |
| Total Housing Units | 17,350 (61.2%) | 11,001 (38.8%) |
Occupancy by Educational Attainment in Ward County
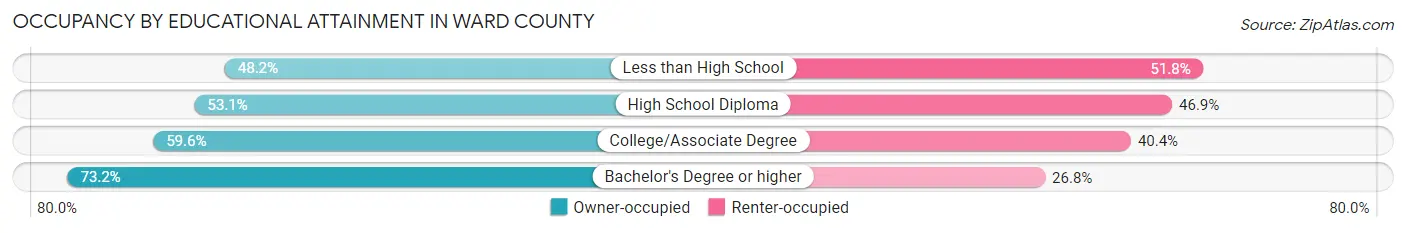
| Household Size | Owner-occupied | Renter-occupied |
| Less than High School | 625 (48.2%) | 671 (51.8%) |
| High School Diploma | 4,063 (53.1%) | 3,595 (46.9%) |
| College/Associate Degree | 6,726 (59.6%) | 4,562 (40.4%) |
| Bachelor's Degree or higher | 5,936 (73.2%) | 2,173 (26.8%) |
Occupancy by Age of Householder in Ward County
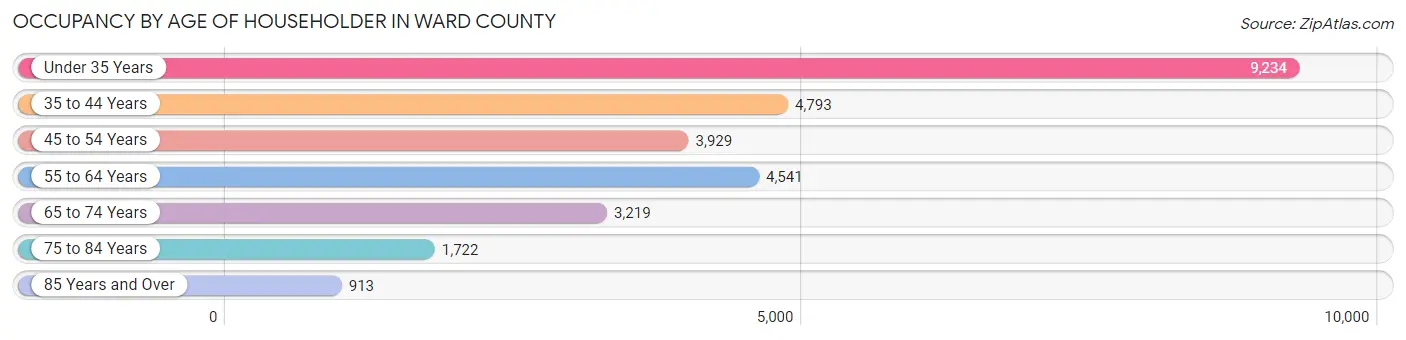
| Age Bracket | # Households | % Households |
| Under 35 Years | 9,234 | 32.6% |
| 35 to 44 Years | 4,793 | 16.9% |
| 45 to 54 Years | 3,929 | 13.9% |
| 55 to 64 Years | 4,541 | 16.0% |
| 65 to 74 Years | 3,219 | 11.4% |
| 75 to 84 Years | 1,722 | 6.1% |
| 85 Years and Over | 913 | 3.2% |
| Total | 28,351 | 100.0% |
Housing Finances in Ward County
Median Income by Occupancy in Ward County
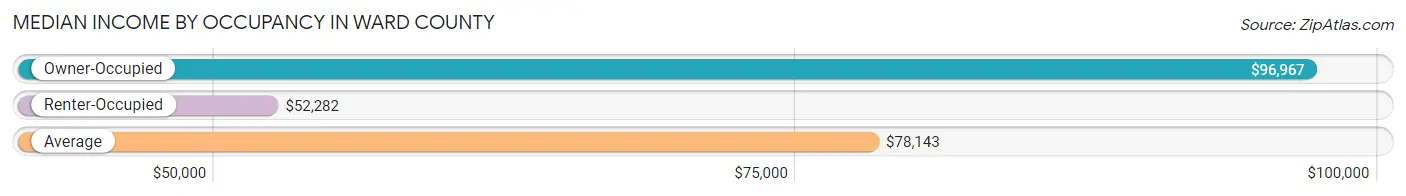
| Occupancy Type | # Households | Median Income |
| Owner-Occupied | 17,350 (61.2%) | $96,967 |
| Renter-Occupied | 11,001 (38.8%) | $52,282 |
| Average | 28,351 (100.0%) | $78,143 |
Occupancy by Householder Income Bracket in Ward County
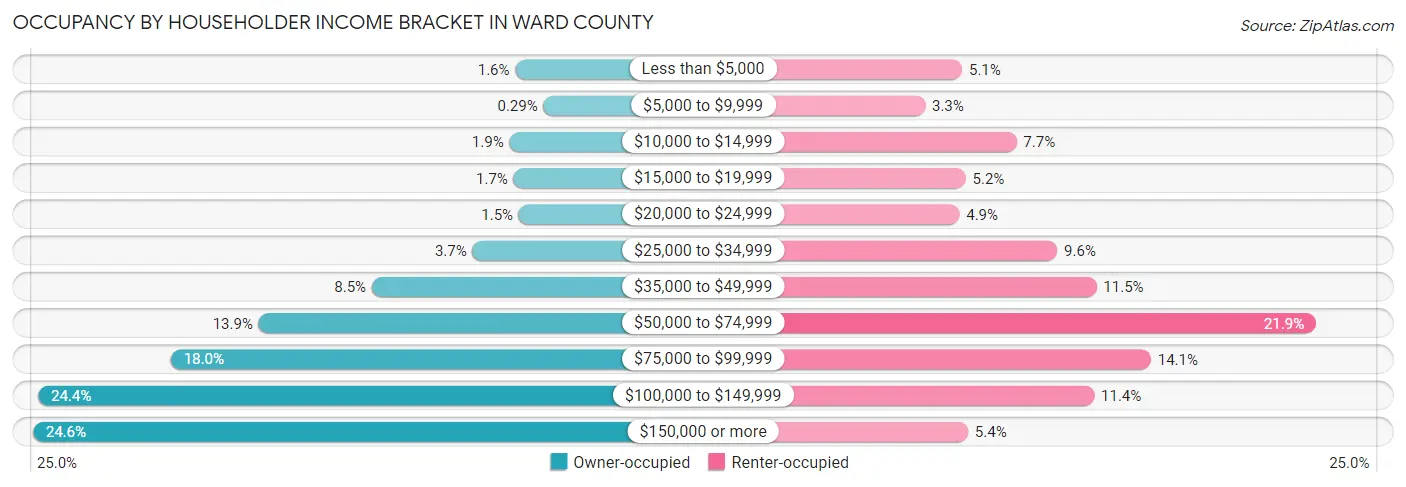
| Income Bracket | Owner-occupied | Renter-occupied |
| Less than $5,000 | 283 (1.6%) | 558 (5.1%) |
| $5,000 to $9,999 | 50 (0.3%) | 364 (3.3%) |
| $10,000 to $14,999 | 332 (1.9%) | 843 (7.7%) |
| $15,000 to $19,999 | 297 (1.7%) | 576 (5.2%) |
| $20,000 to $24,999 | 254 (1.5%) | 543 (4.9%) |
| $25,000 to $34,999 | 637 (3.7%) | 1,056 (9.6%) |
| $35,000 to $49,999 | 1,468 (8.5%) | 1,262 (11.5%) |
| $50,000 to $74,999 | 2,403 (13.9%) | 2,413 (21.9%) |
| $75,000 to $99,999 | 3,130 (18.0%) | 1,547 (14.1%) |
| $100,000 to $149,999 | 4,227 (24.4%) | 1,250 (11.4%) |
| $150,000 or more | 4,269 (24.6%) | 589 (5.3%) |
| Total | 17,350 (100.0%) | 11,001 (100.0%) |
Monthly Housing Cost Tiers in Ward County
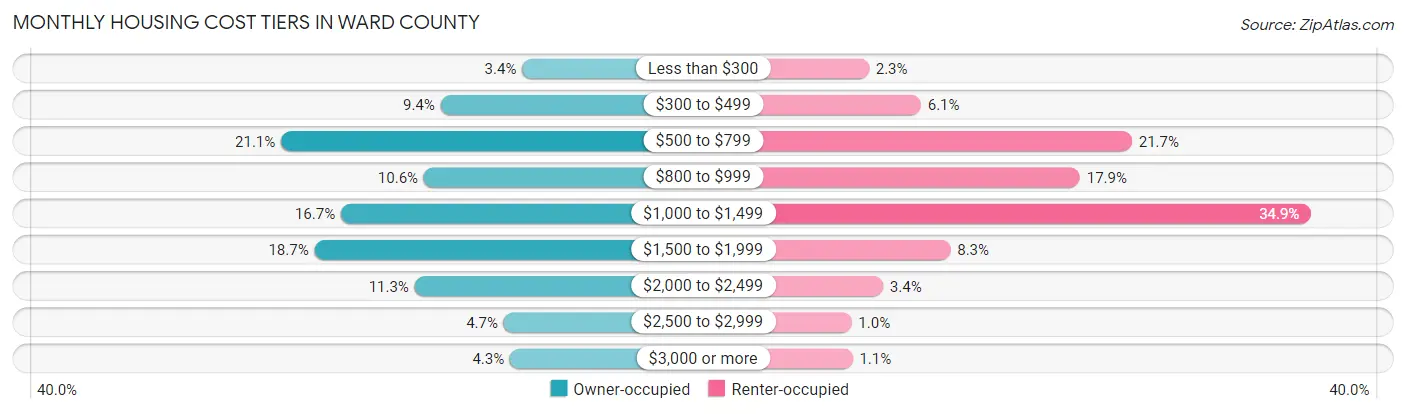
| Monthly Cost | Owner-occupied | Renter-occupied |
| Less than $300 | 581 (3.4%) | 254 (2.3%) |
| $300 to $499 | 1,624 (9.4%) | 676 (6.1%) |
| $500 to $799 | 3,663 (21.1%) | 2,385 (21.7%) |
| $800 to $999 | 1,838 (10.6%) | 1,964 (17.8%) |
| $1,000 to $1,499 | 2,898 (16.7%) | 3,838 (34.9%) |
| $1,500 to $1,999 | 3,236 (18.6%) | 914 (8.3%) |
| $2,000 to $2,499 | 1,955 (11.3%) | 369 (3.4%) |
| $2,500 to $2,999 | 818 (4.7%) | 113 (1.0%) |
| $3,000 or more | 737 (4.3%) | 122 (1.1%) |
| Total | 17,350 (100.0%) | 11,001 (100.0%) |
Physical Housing Characteristics in Ward County
Housing Structures in Ward County
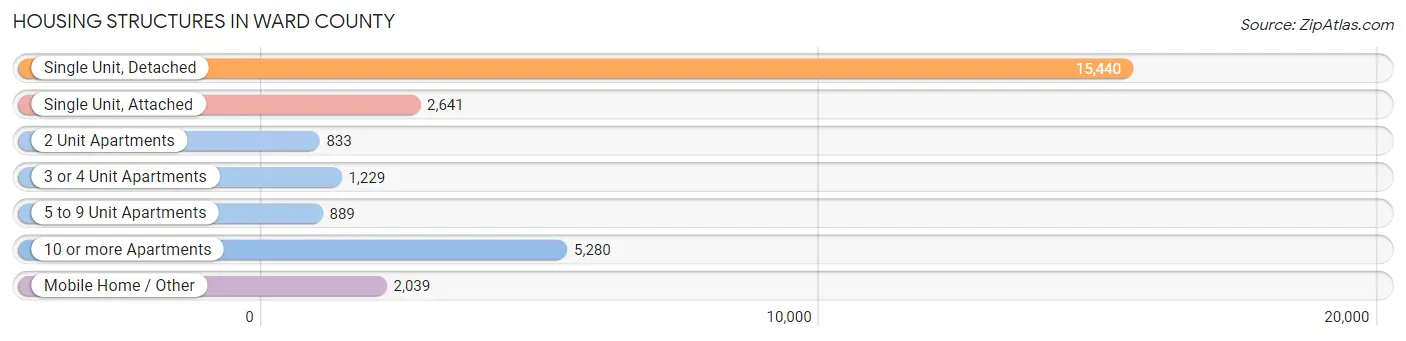
| Structure Type | # Housing Units | % Housing Units |
| Single Unit, Detached | 15,440 | 54.5% |
| Single Unit, Attached | 2,641 | 9.3% |
| 2 Unit Apartments | 833 | 2.9% |
| 3 or 4 Unit Apartments | 1,229 | 4.3% |
| 5 to 9 Unit Apartments | 889 | 3.1% |
| 10 or more Apartments | 5,280 | 18.6% |
| Mobile Home / Other | 2,039 | 7.2% |
| Total | 28,351 | 100.0% |
Housing Structures by Occupancy in Ward County
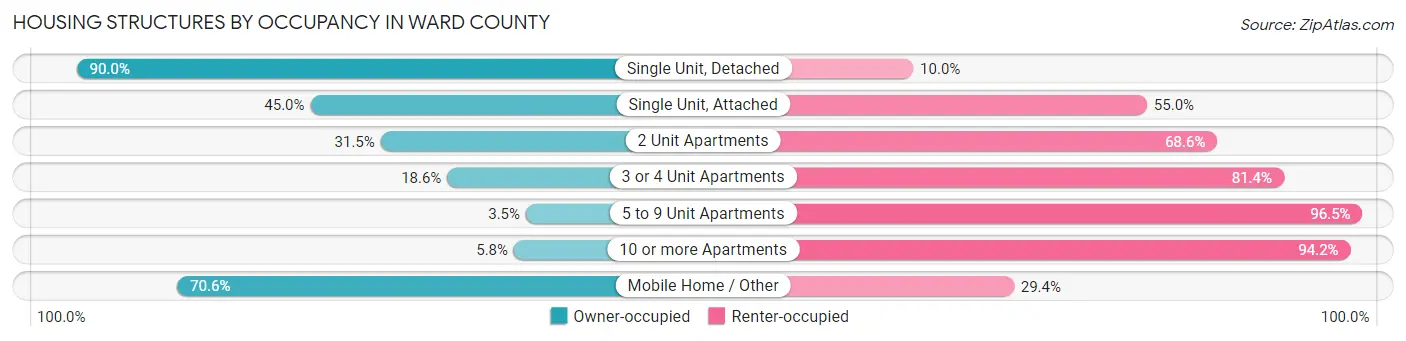
| Structure Type | Owner-occupied | Renter-occupied |
| Single Unit, Detached | 13,894 (90.0%) | 1,546 (10.0%) |
| Single Unit, Attached | 1,188 (45.0%) | 1,453 (55.0%) |
| 2 Unit Apartments | 262 (31.5%) | 571 (68.5%) |
| 3 or 4 Unit Apartments | 229 (18.6%) | 1,000 (81.4%) |
| 5 to 9 Unit Apartments | 31 (3.5%) | 858 (96.5%) |
| 10 or more Apartments | 306 (5.8%) | 4,974 (94.2%) |
| Mobile Home / Other | 1,440 (70.6%) | 599 (29.4%) |
| Total | 17,350 (61.2%) | 11,001 (38.8%) |
Housing Structures by Number of Rooms in Ward County
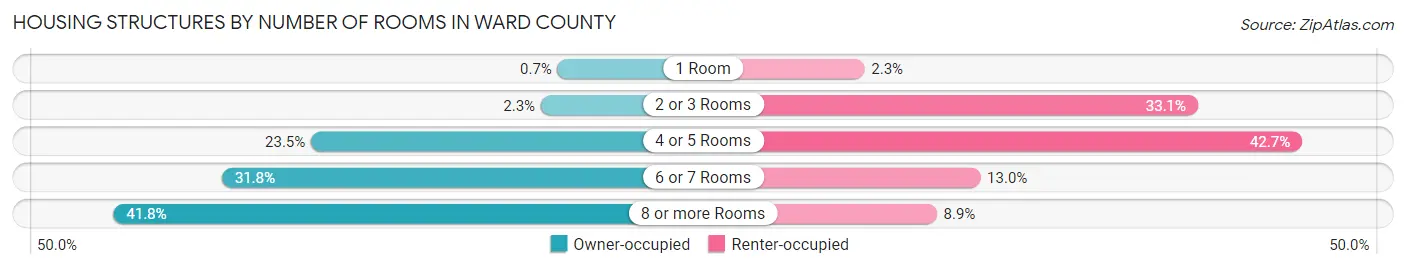
| Number of Rooms | Owner-occupied | Renter-occupied |
| 1 Room | 121 (0.7%) | 249 (2.3%) |
| 2 or 3 Rooms | 390 (2.2%) | 3,641 (33.1%) |
| 4 or 5 Rooms | 4,078 (23.5%) | 4,701 (42.7%) |
| 6 or 7 Rooms | 5,510 (31.8%) | 1,427 (13.0%) |
| 8 or more Rooms | 7,251 (41.8%) | 983 (8.9%) |
| Total | 17,350 (100.0%) | 11,001 (100.0%) |
Housing Structure by Heating Type in Ward County
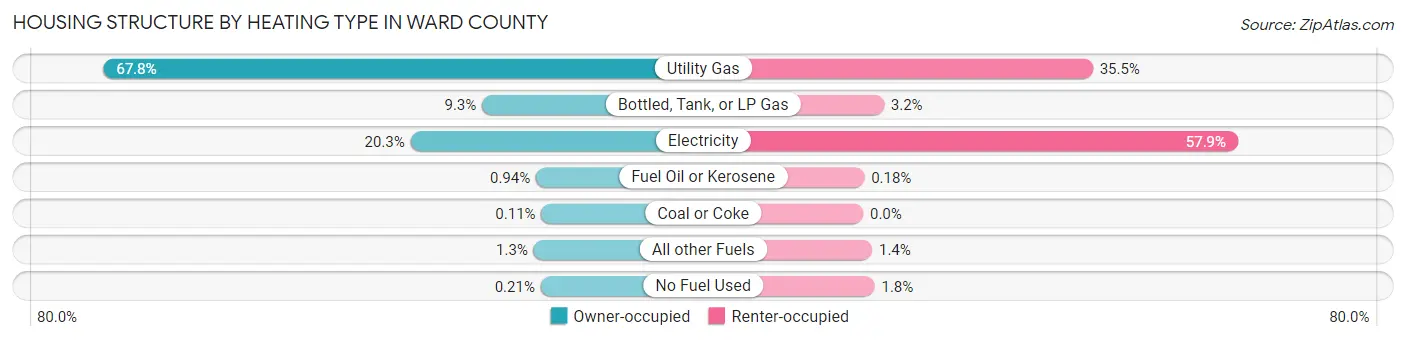
| Heating Type | Owner-occupied | Renter-occupied |
| Utility Gas | 11,769 (67.8%) | 3,905 (35.5%) |
| Bottled, Tank, or LP Gas | 1,609 (9.3%) | 353 (3.2%) |
| Electricity | 3,529 (20.3%) | 6,374 (57.9%) |
| Fuel Oil or Kerosene | 163 (0.9%) | 20 (0.2%) |
| Coal or Coke | 19 (0.1%) | 0 (0.0%) |
| All other Fuels | 224 (1.3%) | 153 (1.4%) |
| No Fuel Used | 37 (0.2%) | 196 (1.8%) |
| Total | 17,350 (100.0%) | 11,001 (100.0%) |
Household Vehicle Usage in Ward County
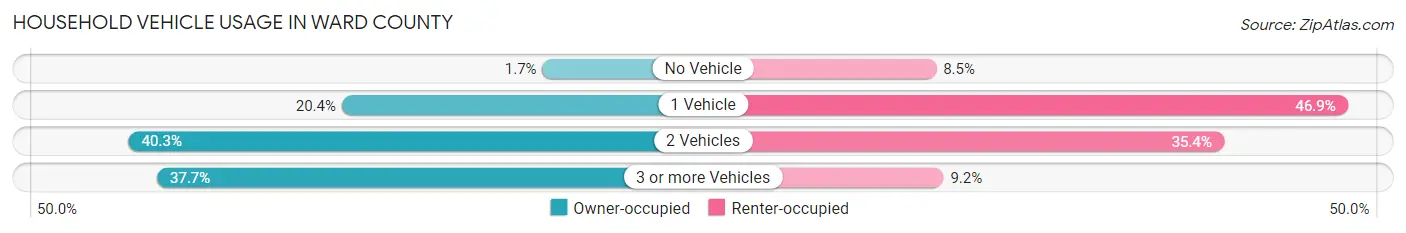
| Vehicles per Household | Owner-occupied | Renter-occupied |
| No Vehicle | 288 (1.7%) | 937 (8.5%) |
| 1 Vehicle | 3,538 (20.4%) | 5,162 (46.9%) |
| 2 Vehicles | 6,992 (40.3%) | 3,890 (35.4%) |
| 3 or more Vehicles | 6,532 (37.7%) | 1,012 (9.2%) |
| Total | 17,350 (100.0%) | 11,001 (100.0%) |
Real Estate & Mortgages in Ward County
Real Estate and Mortgage Overview in Ward County
| Characteristic | Without Mortgage | With Mortgage |
| Housing Units | 7,021 | 10,329 |
| Median Property Value | $225,300 | $260,900 |
| Median Household Income | $78,933 | $2,878 |
| Monthly Housing Costs | $611 | $724 |
| Real Estate Taxes | $2,431 | $224 |
Property Value by Mortgage Status in Ward County
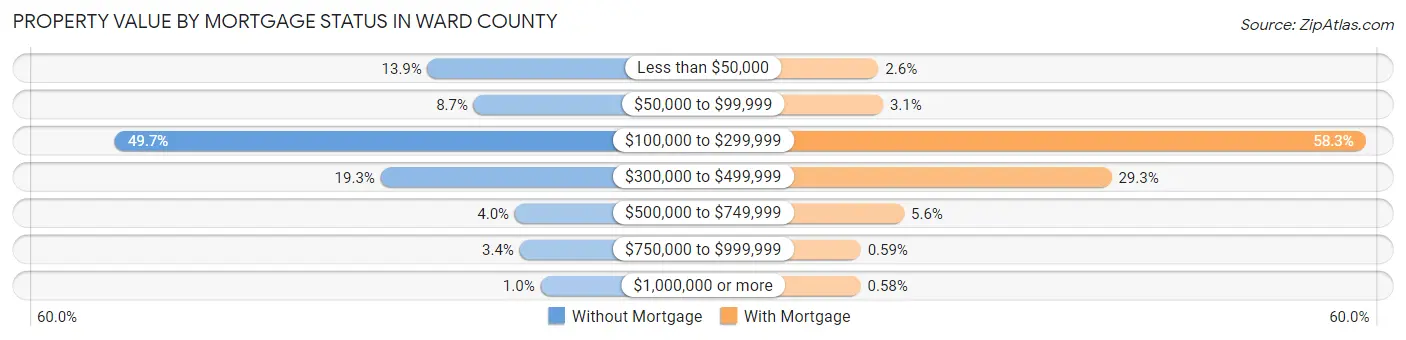
| Property Value | Without Mortgage | With Mortgage |
| Less than $50,000 | 979 (13.9%) | 270 (2.6%) |
| $50,000 to $99,999 | 608 (8.7%) | 323 (3.1%) |
| $100,000 to $299,999 | 3,487 (49.7%) | 6,021 (58.3%) |
| $300,000 to $499,999 | 1,356 (19.3%) | 3,021 (29.2%) |
| $500,000 to $749,999 | 278 (4.0%) | 573 (5.6%) |
| $750,000 to $999,999 | 240 (3.4%) | 61 (0.6%) |
| $1,000,000 or more | 73 (1.0%) | 60 (0.6%) |
| Total | 7,021 (100.0%) | 10,329 (100.0%) |
Household Income by Mortgage Status in Ward County
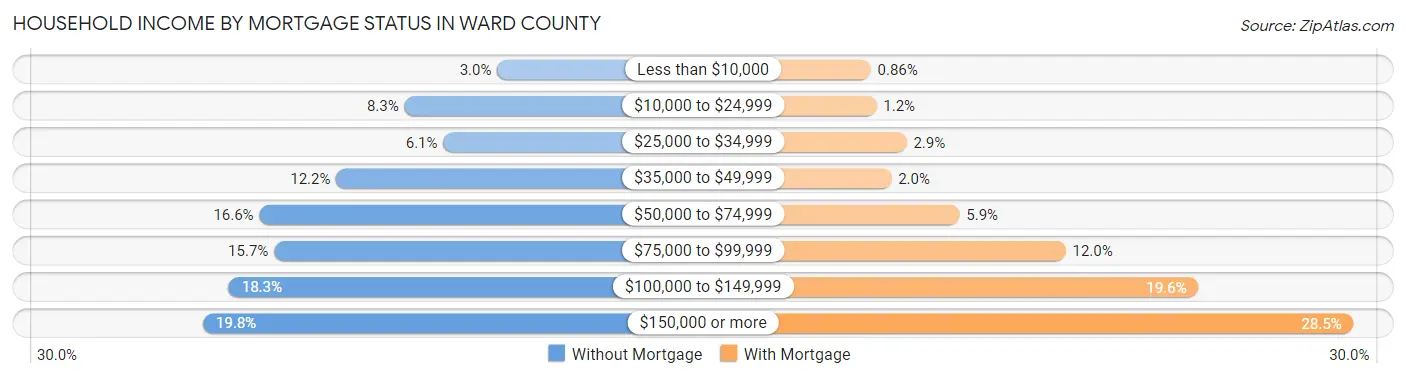
| Household Income | Without Mortgage | With Mortgage |
| Less than $10,000 | 210 (3.0%) | 89 (0.9%) |
| $10,000 to $24,999 | 582 (8.3%) | 123 (1.2%) |
| $25,000 to $34,999 | 426 (6.1%) | 301 (2.9%) |
| $35,000 to $49,999 | 856 (12.2%) | 211 (2.0%) |
| $50,000 to $74,999 | 1,164 (16.6%) | 612 (5.9%) |
| $75,000 to $99,999 | 1,105 (15.7%) | 1,239 (12.0%) |
| $100,000 to $149,999 | 1,287 (18.3%) | 2,025 (19.6%) |
| $150,000 or more | 1,391 (19.8%) | 2,940 (28.5%) |
| Total | 7,021 (100.0%) | 10,329 (100.0%) |
Property Value to Household Income Ratio in Ward County
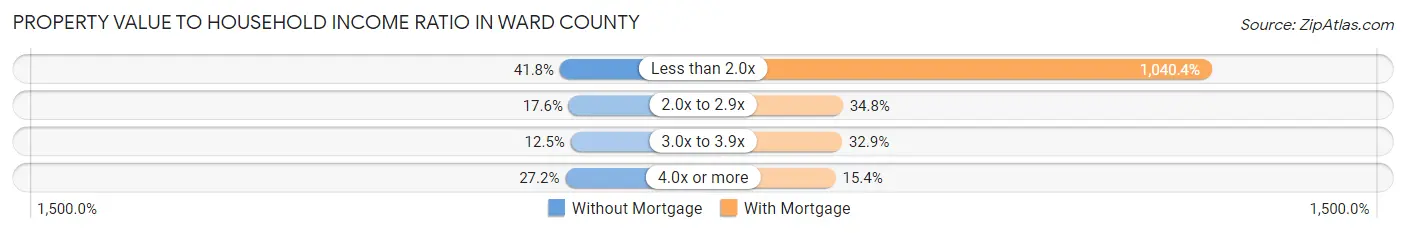
| Value-to-Income Ratio | Without Mortgage | With Mortgage |
| Less than 2.0x | 2,936 (41.8%) | 107,462 (1,040.4%) |
| 2.0x to 2.9x | 1,238 (17.6%) | 3,596 (34.8%) |
| 3.0x to 3.9x | 877 (12.5%) | 3,399 (32.9%) |
| 4.0x or more | 1,908 (27.2%) | 1,592 (15.4%) |
| Total | 7,021 (100.0%) | 10,329 (100.0%) |
Real Estate Taxes by Mortgage Status in Ward County
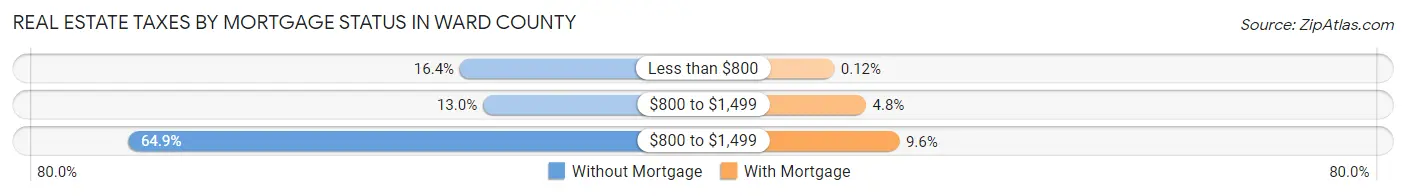
| Property Taxes | Without Mortgage | With Mortgage |
| Less than $800 | 1,151 (16.4%) | 12 (0.1%) |
| $800 to $1,499 | 914 (13.0%) | 492 (4.8%) |
| $800 to $1,499 | 4,556 (64.9%) | 995 (9.6%) |
| Total | 7,021 (100.0%) | 10,329 (100.0%) |
Health & Disability in Ward County
Health Insurance Coverage by Age in Ward County
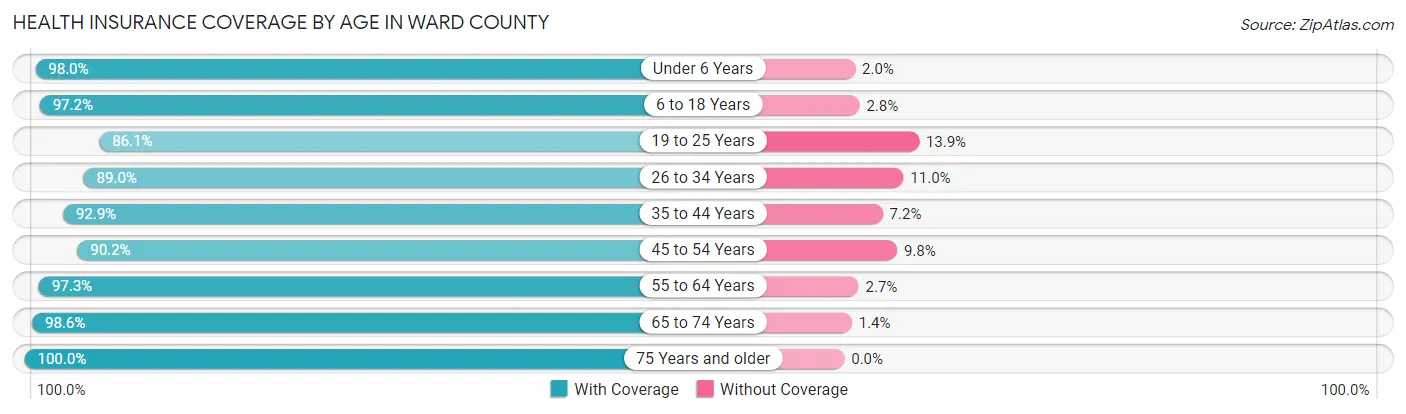
| Age Bracket | With Coverage | Without Coverage |
| Under 6 Years | 5,793 (98.0%) | 119 (2.0%) |
| 6 to 18 Years | 11,197 (97.2%) | 326 (2.8%) |
| 19 to 25 Years | 6,148 (86.1%) | 994 (13.9%) |
| 26 to 34 Years | 7,990 (89.0%) | 990 (11.0%) |
| 35 to 44 Years | 7,963 (92.8%) | 613 (7.1%) |
| 45 to 54 Years | 5,813 (90.2%) | 634 (9.8%) |
| 55 to 64 Years | 7,241 (97.3%) | 199 (2.7%) |
| 65 to 74 Years | 5,006 (98.6%) | 71 (1.4%) |
| 75 Years and older | 3,742 (100.0%) | 0 (0.0%) |
| Total | 60,893 (93.9%) | 3,946 (6.1%) |
Health Insurance Coverage by Citizenship Status in Ward County
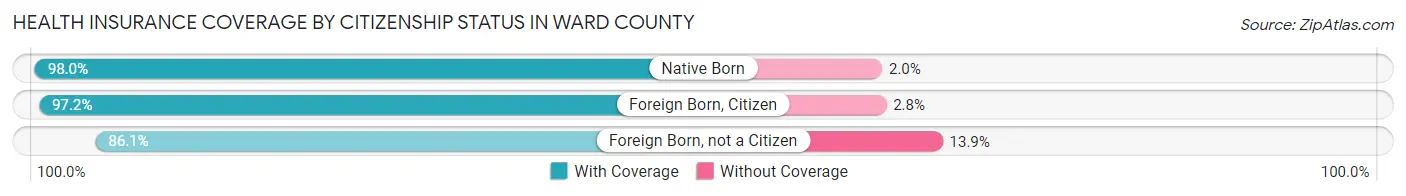
| Citizenship Status | With Coverage | Without Coverage |
| Native Born | 5,793 (98.0%) | 119 (2.0%) |
| Foreign Born, Citizen | 11,197 (97.2%) | 326 (2.8%) |
| Foreign Born, not a Citizen | 6,148 (86.1%) | 994 (13.9%) |
Health Insurance Coverage by Household Income in Ward County
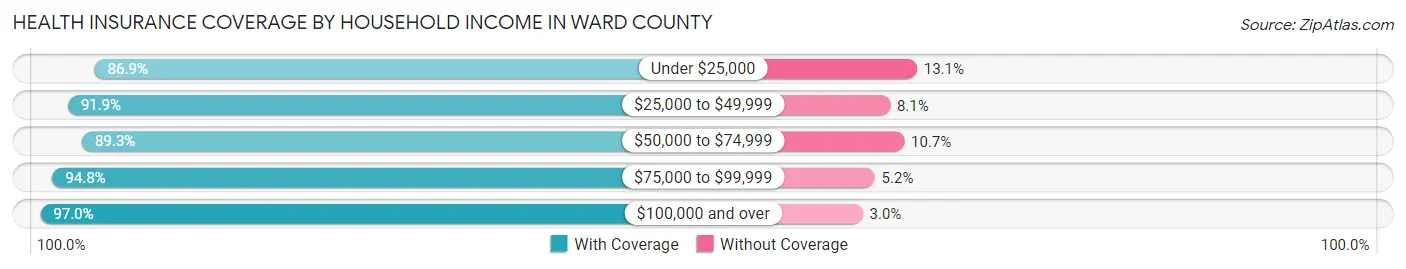
| Household Income | With Coverage | Without Coverage |
| Under $25,000 | 5,072 (86.9%) | 766 (13.1%) |
| $25,000 to $49,999 | 6,072 (91.9%) | 534 (8.1%) |
| $50,000 to $74,999 | 8,367 (89.3%) | 1,007 (10.7%) |
| $75,000 to $99,999 | 9,972 (94.8%) | 549 (5.2%) |
| $100,000 and over | 30,701 (97.0%) | 937 (3.0%) |
Public vs Private Health Insurance Coverage by Age in Ward County
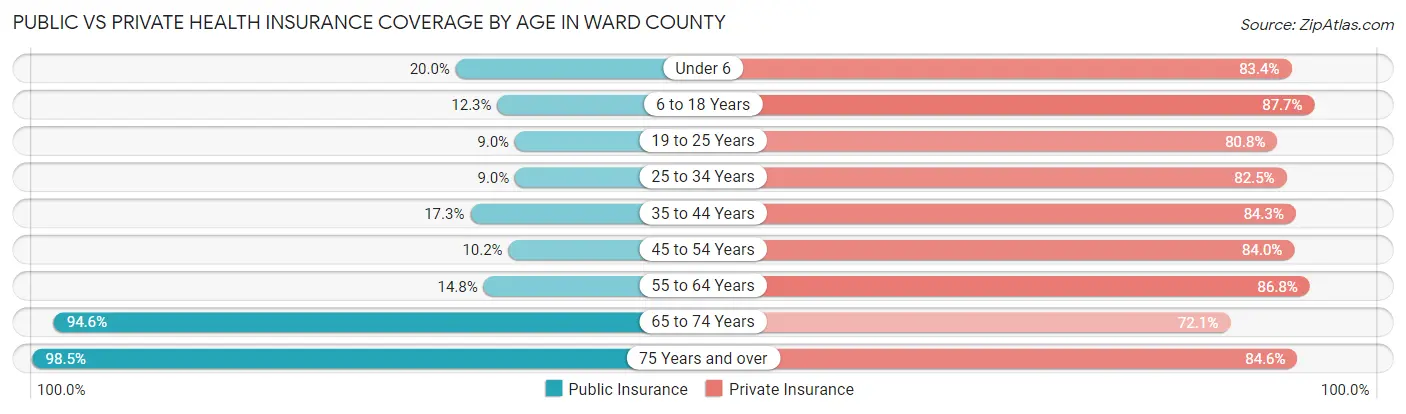
| Age Bracket | Public Insurance | Private Insurance |
| Under 6 | 1,181 (20.0%) | 4,932 (83.4%) |
| 6 to 18 Years | 1,411 (12.2%) | 10,106 (87.7%) |
| 19 to 25 Years | 642 (9.0%) | 5,772 (80.8%) |
| 25 to 34 Years | 804 (8.9%) | 7,410 (82.5%) |
| 35 to 44 Years | 1,482 (17.3%) | 7,225 (84.3%) |
| 45 to 54 Years | 657 (10.2%) | 5,413 (84.0%) |
| 55 to 64 Years | 1,102 (14.8%) | 6,461 (86.8%) |
| 65 to 74 Years | 4,802 (94.6%) | 3,658 (72.1%) |
| 75 Years and over | 3,686 (98.5%) | 3,164 (84.6%) |
| Total | 15,767 (24.3%) | 54,141 (83.5%) |
Disability Status by Sex by Age in Ward County
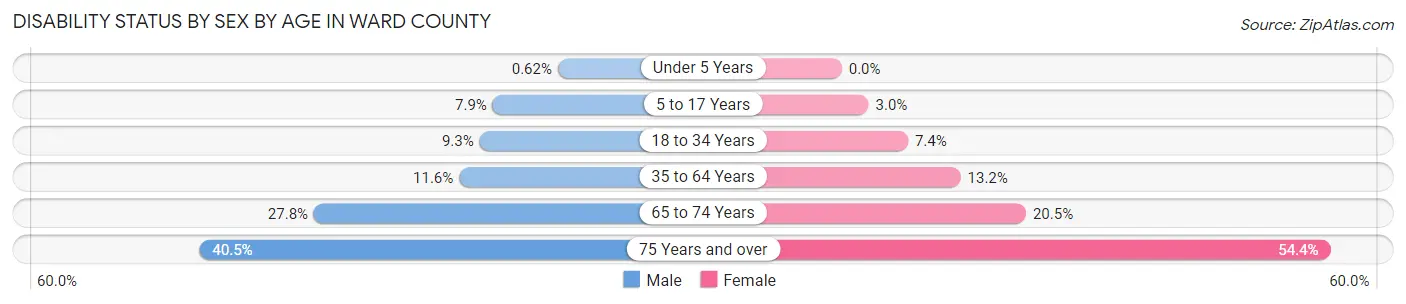
| Age Bracket | Male | Female |
| Under 5 Years | 16 (0.6%) | 0 (0.0%) |
| 5 to 17 Years | 478 (7.9%) | 163 (3.0%) |
| 18 to 34 Years | 797 (9.3%) | 621 (7.4%) |
| 35 to 64 Years | 1,321 (11.6%) | 1,467 (13.2%) |
| 65 to 74 Years | 718 (27.8%) | 511 (20.5%) |
| 75 Years and over | 593 (40.5%) | 1,240 (54.4%) |
Disability Class by Sex by Age in Ward County
Disability Class: Hearing Difficulty
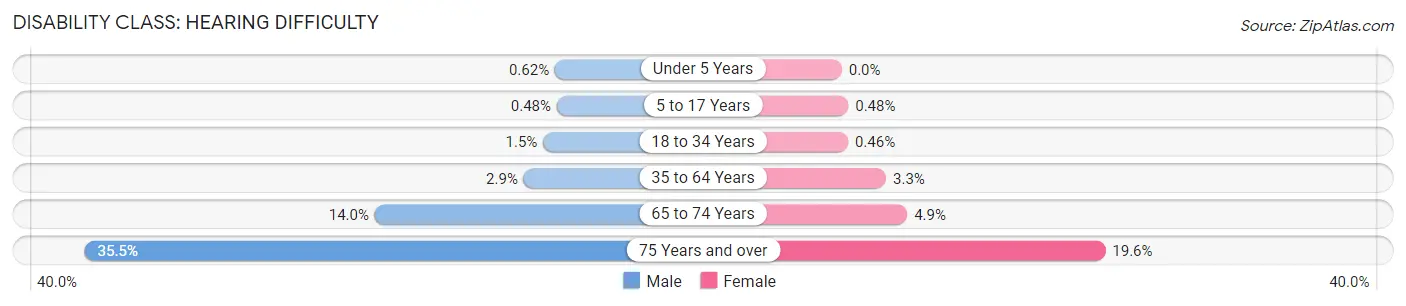
| Age Bracket | Male | Female |
| Under 5 Years | 16 (0.6%) | 0 (0.0%) |
| 5 to 17 Years | 29 (0.5%) | 26 (0.5%) |
| 18 to 34 Years | 128 (1.5%) | 39 (0.5%) |
| 35 to 64 Years | 335 (2.9%) | 365 (3.3%) |
| 65 to 74 Years | 362 (14.0%) | 121 (4.9%) |
| 75 Years and over | 520 (35.5%) | 446 (19.6%) |
Disability Class: Vision Difficulty
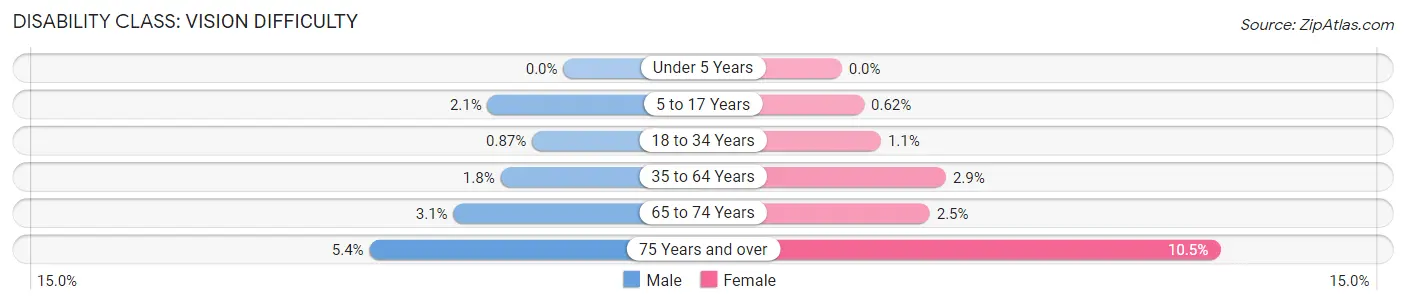
| Age Bracket | Male | Female |
| Under 5 Years | 0 (0.0%) | 0 (0.0%) |
| 5 to 17 Years | 128 (2.1%) | 34 (0.6%) |
| 18 to 34 Years | 74 (0.9%) | 92 (1.1%) |
| 35 to 64 Years | 199 (1.8%) | 321 (2.9%) |
| 65 to 74 Years | 79 (3.1%) | 61 (2.5%) |
| 75 Years and over | 79 (5.4%) | 240 (10.5%) |
Disability Class: Cognitive Difficulty
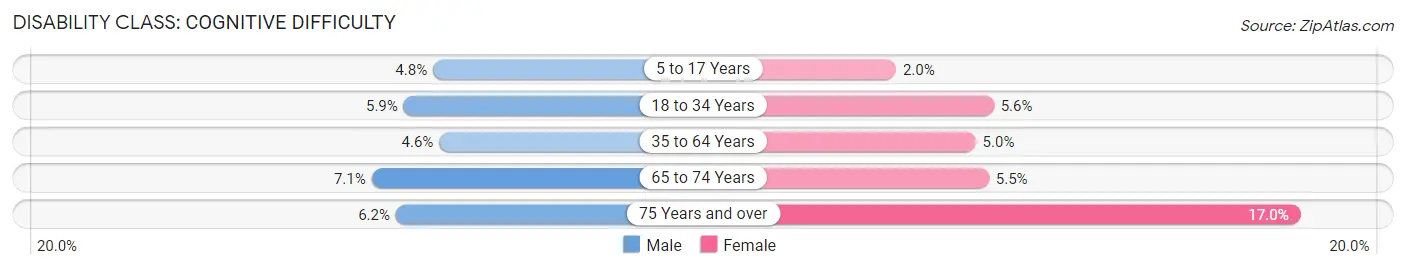
| Age Bracket | Male | Female |
| 5 to 17 Years | 294 (4.8%) | 110 (2.0%) |
| 18 to 34 Years | 507 (5.9%) | 475 (5.6%) |
| 35 to 64 Years | 524 (4.6%) | 551 (5.0%) |
| 65 to 74 Years | 184 (7.1%) | 136 (5.5%) |
| 75 Years and over | 91 (6.2%) | 388 (17.0%) |
Disability Class: Ambulatory Difficulty
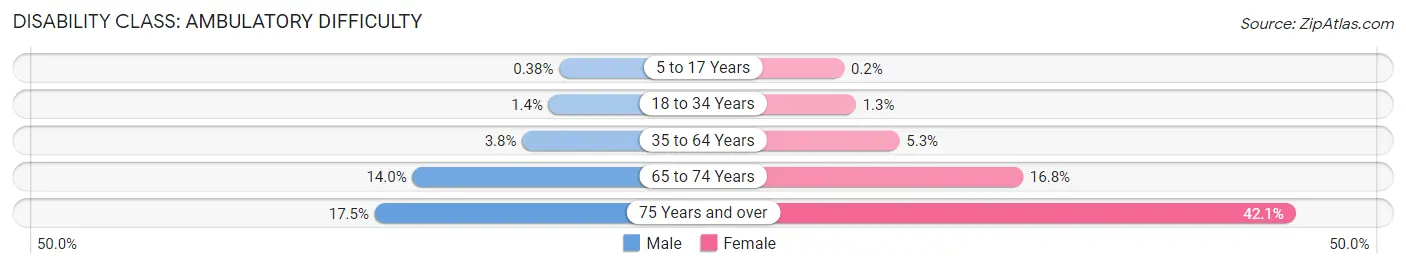
| Age Bracket | Male | Female |
| 5 to 17 Years | 23 (0.4%) | 11 (0.2%) |
| 18 to 34 Years | 115 (1.3%) | 109 (1.3%) |
| 35 to 64 Years | 433 (3.8%) | 592 (5.3%) |
| 65 to 74 Years | 362 (14.0%) | 419 (16.8%) |
| 75 Years and over | 256 (17.5%) | 960 (42.1%) |
Disability Class: Self-Care Difficulty
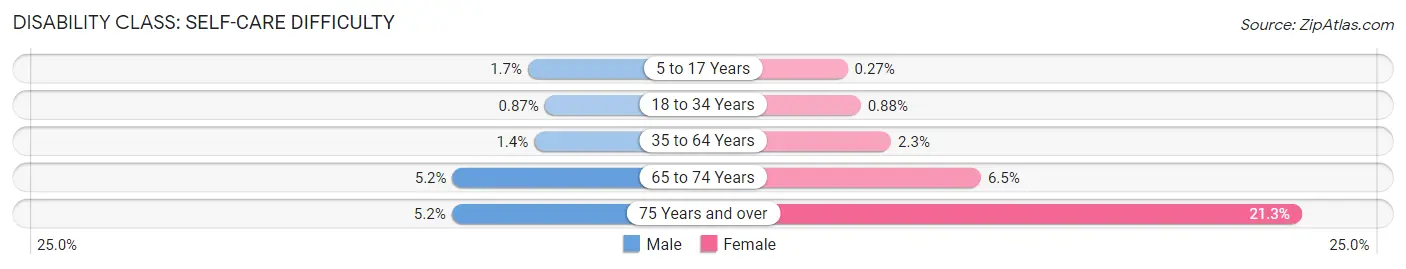
| Age Bracket | Male | Female |
| 5 to 17 Years | 100 (1.7%) | 15 (0.3%) |
| 18 to 34 Years | 74 (0.9%) | 74 (0.9%) |
| 35 to 64 Years | 155 (1.4%) | 254 (2.3%) |
| 65 to 74 Years | 133 (5.1%) | 161 (6.5%) |
| 75 Years and over | 76 (5.2%) | 486 (21.3%) |
Technology Access in Ward County
Computing Device Access in Ward County
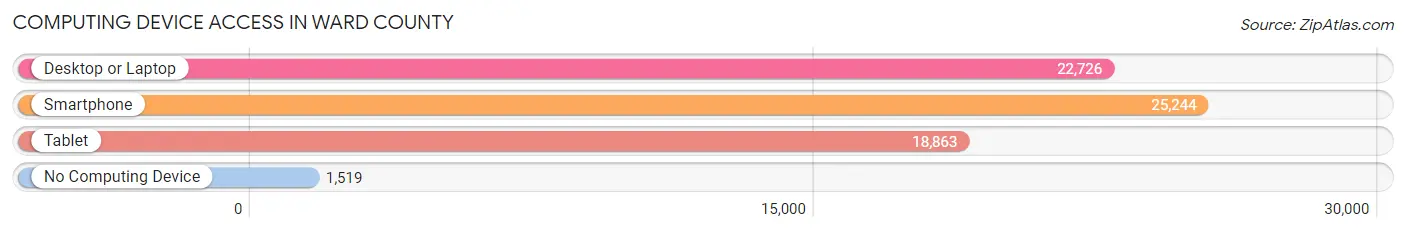
| Device Type | # Households | % Households |
| Desktop or Laptop | 22,726 | 80.2% |
| Smartphone | 25,244 | 89.0% |
| Tablet | 18,863 | 66.5% |
| No Computing Device | 1,519 | 5.4% |
| Total | 28,351 | 100.0% |
Internet Access in Ward County
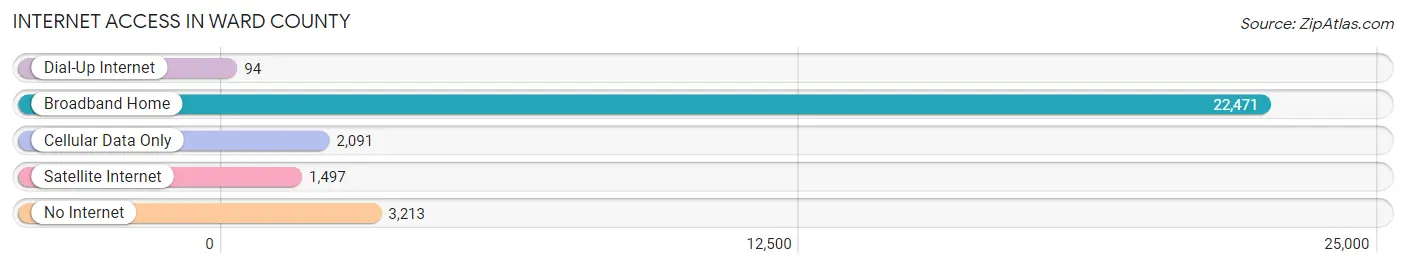
| Internet Type | # Households | % Households |
| Dial-Up Internet | 94 | 0.3% |
| Broadband Home | 22,471 | 79.3% |
| Cellular Data Only | 2,091 | 7.4% |
| Satellite Internet | 1,497 | 5.3% |
| No Internet | 3,213 | 11.3% |
| Total | 28,351 | 100.0% |
Ward County Summary
Ward County is located in the northwestern part of North Dakota, and is bordered by Mountrail County to the north, Burke County to the east, Renville County to the south, and Williams County to the west. The county seat is Minot, which is also the largest city in the county. Ward County was established in 1885 and named after Henry A. Ward, a former North Dakota governor. As of the 2010 census, the population of Ward County was 63,634, making it the third most populous county in North Dakota.
Geography
Ward County covers an area of 1,845 square miles, making it the fourth largest county in North Dakota. The county is located in the northern Great Plains region of the state, and is mostly flat with rolling hills. The Souris River runs through the county, and is the main source of water for the area. The county is also home to several lakes, including Lake Sakakawea, Lake Audubon, and Lake Darling.
The county is divided into two distinct regions: the Missouri Plateau to the west and the Drift Prairie to the east. The Missouri Plateau is characterized by rolling hills and deep ravines, while the Drift Prairie is characterized by flat, open plains. The county is also home to several wildlife refuges, including the Upper Souris National Wildlife Refuge and the Lostwood National Wildlife Refuge.
Climate
Ward County has a semi-arid climate, with cold winters and hot summers. The average annual temperature is 45°F, and the average annual precipitation is 16.5 inches. The county is prone to extreme weather, including blizzards, thunderstorms, and tornadoes.
Demographics
As of the 2010 census, the population of Ward County was 63,634, making it the third most populous county in North Dakota. The population is spread out across the county, with the largest city being Minot, which has a population of 40,888. The racial makeup of the county is 94.3% White, 1.2% Native American, 0.7% Asian, 0.5% Black or African American, 0.1% Pacific Islander, and 2.2% from two or more races. The median household income is $50,945, and the median family income is $60,945.
Economy
Ward County is home to a diverse economy, with the largest industries being agriculture, manufacturing, and energy. Agriculture is the largest industry in the county, with the main crops being wheat, barley, oats, and canola. Manufacturing is also a major industry in the county, with the largest employers being Minot Air Force Base, Minot State University, and Trinity Health. The energy industry is also a major employer in the county, with the largest employers being Basin Electric Power Cooperative and Great Plains Synfuels Plant.
The county is also home to several major employers, including Minot Air Force Base, Minot State University, and Trinity Health. The county is also home to several major retail stores, including Walmart, Target, and Best Buy.
Conclusion
Ward County is located in the northwestern part of North Dakota, and is bordered by Mountrail County to the north, Burke County to the east, Renville County to the south, and Williams County to the west. The county is home to a diverse economy, with the largest industries being agriculture, manufacturing, and energy. As of the 2010 census, the population of Ward County was 63,634, making it the third most populous county in North Dakota. The county is also home to several major employers, including Minot Air Force Base, Minot State University, and Trinity Health.
Common Questions
What is the Total Population of Ward County?
Total Population of Ward County is 69,532.
What is the Total Male Population of Ward County?
Total Male Population of Ward County is 36,443.
What is the Total Female Population of Ward County?
Total Female Population of Ward County is 33,089.
What is the Ratio of Males per 100 Females in Ward County?
There are 110.14 Males per 100 Females in Ward County.
What is the Ratio of Females per 100 Males in Ward County?
There are 90.80 Females per 100 Males in Ward County.
What is the Median Population Age in Ward County?
Median Population Age in Ward County is 33.0 Years.
What is the Average Family Size in Ward County
Average Family Size in Ward County is 3.1 People.
What is the Average Household Size in Ward County
Average Household Size in Ward County is 2.4 People.
What is Per Capita Income in Ward County?
Per Capita income in Ward County is $40,896.
What is the Median Family Income in Ward County?
Median Family Income in Ward County is $101,212.
What is the Median Household income in Ward County?
Median Household Income in Ward County is $78,143.
What is Income or Wage Gap in Ward County?
Income or Wage Gap in Ward County is 31.8%.
Women in Ward County earn 68.2 cents for every dollar earned by a man.
What is Family Income Deficit in Ward County?
Family Income Deficit in Ward County is $9,816.
Families that are below poverty line in Ward County earn $9,816 less on average than the poverty threshold level.
What is Inequality or Gini Index in Ward County?
Inequality or Gini Index in Ward County is 0.43.
How Large is the Labor Force in Ward County?
There are 39,600 People in the Labor Forcein in Ward County.
What is the Percentage of People in the Labor Force in Ward County?
72.5% of People are in the Labor Force in Ward County.
What is the Unemployment Rate in Ward County?
Unemployment Rate in Ward County is 3.7%.