Traill County, ND
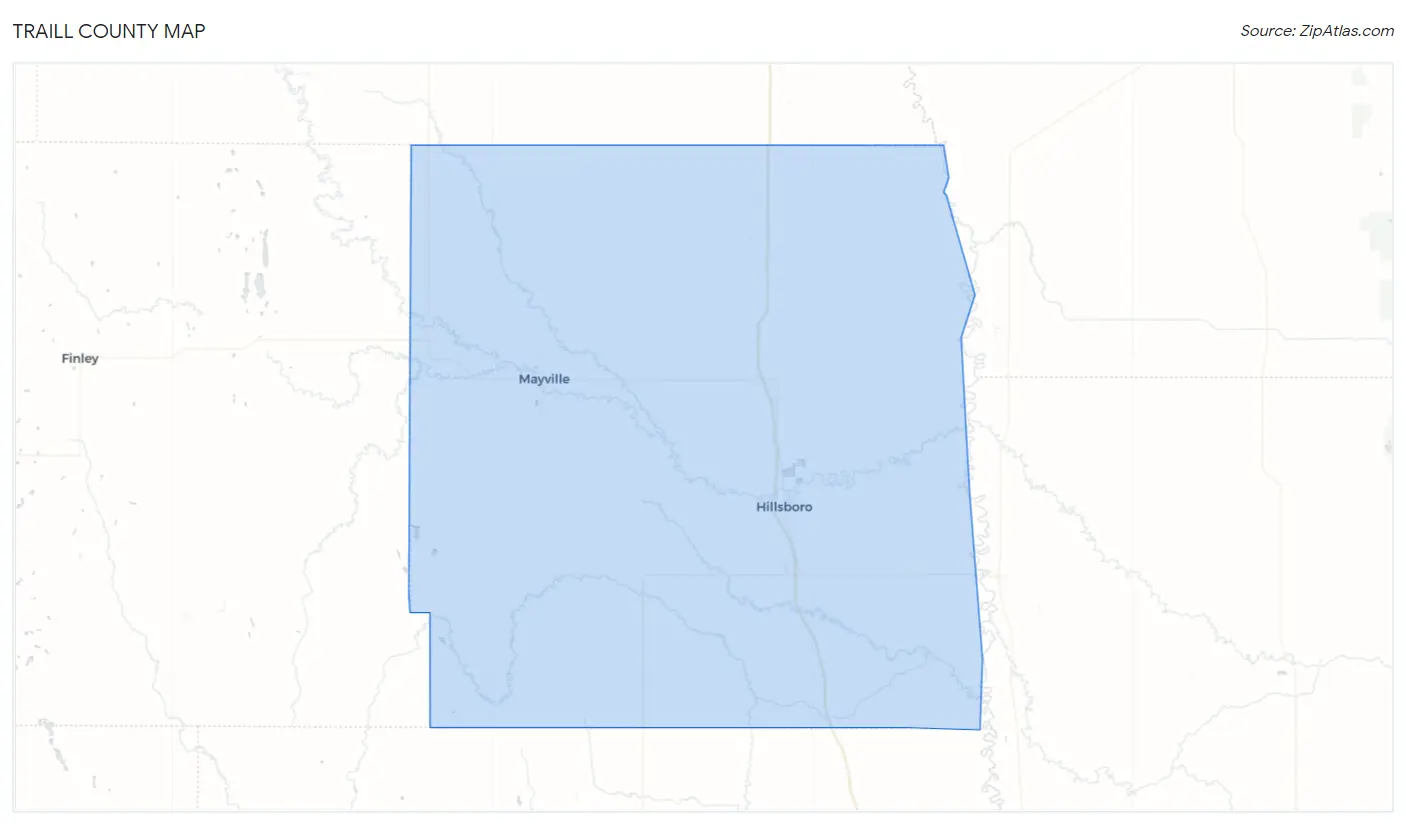
Traill County Map
Traill County Overview
8,004
TOTAL POPULATION
4,108
MALE POPULATION
3,896
FEMALE POPULATION
105.44
MALES / 100 FEMALES
94.84
FEMALES / 100 MALES
40.6
MEDIAN AGE
2.9
AVG FAMILY SIZE
2.3
AVG HOUSEHOLD SIZE
$40,942
PER CAPITA INCOME
$108,958
AVG FAMILY INCOME
$81,157
AVG HOUSEHOLD INCOME
31.8%
WAGE / INCOME GAP [ % ]
68.2¢/ $1
WAGE / INCOME GAP [ $ ]
$10,624
FAMILY INCOME DEFICIT
0.42
INEQUALITY / GINI INDEX
4,242
LABOR FORCE [ PEOPLE ]
65.7%
PERCENT IN LABOR FORCE
2.0%
UNEMPLOYMENT RATE
Traill County Area Codes
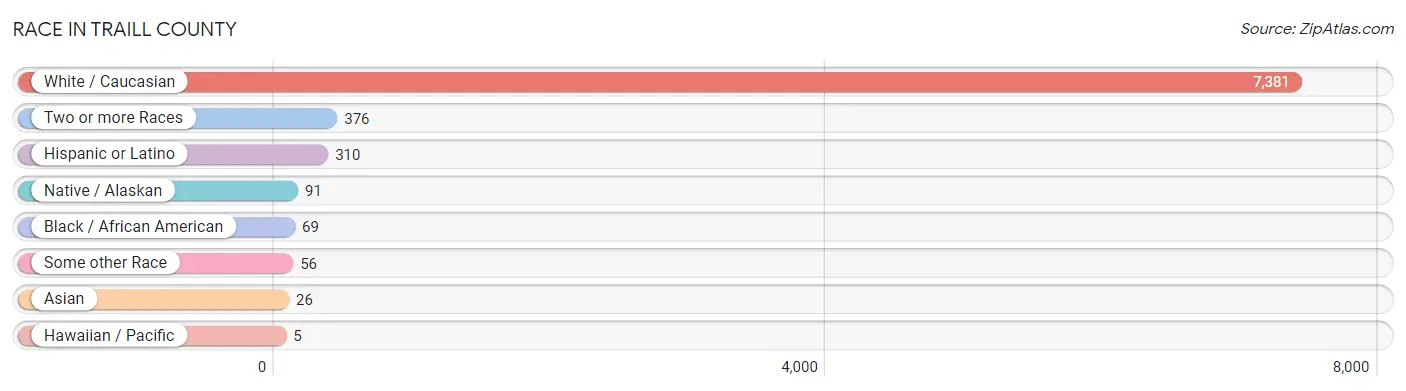
Race in Traill County
The most populous races in Traill County are White / Caucasian (7,381 | 92.2%), Two or more Races (376 | 4.7%), and Hispanic or Latino (310 | 3.9%).
| Race | # Population | % Population |
| Asian | 26 | 0.3% |
| Black / African American | 69 | 0.9% |
| Hawaiian / Pacific | 5 | 0.1% |
| Hispanic or Latino | 310 | 3.9% |
| Native / Alaskan | 91 | 1.1% |
| White / Caucasian | 7,381 | 92.2% |
| Two or more Races | 376 | 4.7% |
| Some other Race | 56 | 0.7% |
| Total | 8,004 | 100.0% |
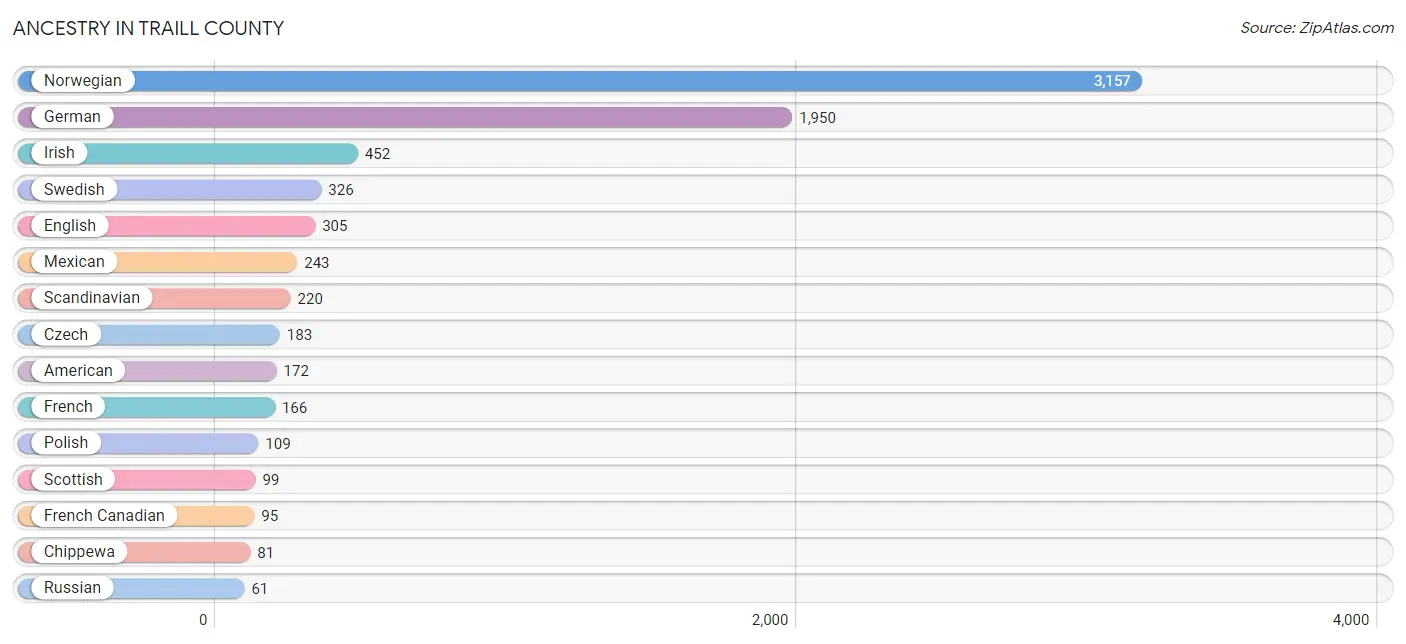
Ancestry in Traill County
The most populous ancestries reported in Traill County are Norwegian (3,157 | 39.4%), German (1,950 | 24.4%), Irish (452 | 5.7%), Swedish (326 | 4.1%), and English (305 | 3.8%), together accounting for 77.3% of all Traill County residents.
| Ancestry | # Population | % Population |
| American | 172 | 2.1% |
| Arab | 6 | 0.1% |
| Australian | 5 | 0.1% |
| Belgian | 14 | 0.2% |
| Bhutanese | 2 | 0.0% |
| British | 11 | 0.1% |
| Burmese | 32 | 0.4% |
| Cherokee | 2 | 0.0% |
| Chippewa | 81 | 1.0% |
| Croatian | 2 | 0.0% |
| Czech | 183 | 2.3% |
| Czechoslovakian | 19 | 0.2% |
| Danish | 51 | 0.6% |
| Dominican | 2 | 0.0% |
| Dutch | 37 | 0.5% |
| Eastern European | 11 | 0.1% |
| English | 305 | 3.8% |
| European | 39 | 0.5% |
| Finnish | 21 | 0.3% |
| French | 166 | 2.1% |
| French Canadian | 95 | 1.2% |
| German | 1,950 | 24.4% |
| German Russian | 25 | 0.3% |
| Haitian | 11 | 0.1% |
| Hungarian | 2 | 0.0% |
| Icelander | 18 | 0.2% |
| Irish | 452 | 5.7% |
| Israeli | 2 | 0.0% |
| Italian | 51 | 0.6% |
| Korean | 7 | 0.1% |
| Laotian | 3 | 0.0% |
| Lebanese | 6 | 0.1% |
| Mexican | 243 | 3.0% |
| Native Hawaiian | 2 | 0.0% |
| Northern European | 33 | 0.4% |
| Norwegian | 3,157 | 39.4% |
| Polish | 109 | 1.4% |
| Portuguese | 1 | 0.0% |
| Puerto Rican | 21 | 0.3% |
| Russian | 61 | 0.8% |
| Scandinavian | 220 | 2.8% |
| Scotch-Irish | 35 | 0.4% |
| Scottish | 99 | 1.2% |
| Sioux | 24 | 0.3% |
| Slovak | 1 | 0.0% |
| Slovene | 7 | 0.1% |
| Spaniard | 11 | 0.1% |
| Spanish | 1 | 0.0% |
| Swedish | 326 | 4.1% |
| Swiss | 28 | 0.4% |
| Thai | 6 | 0.1% |
| Tongan | 3 | 0.0% |
| Ukrainian | 22 | 0.3% |
| Welsh | 18 | 0.2% | View All 54 Rows |
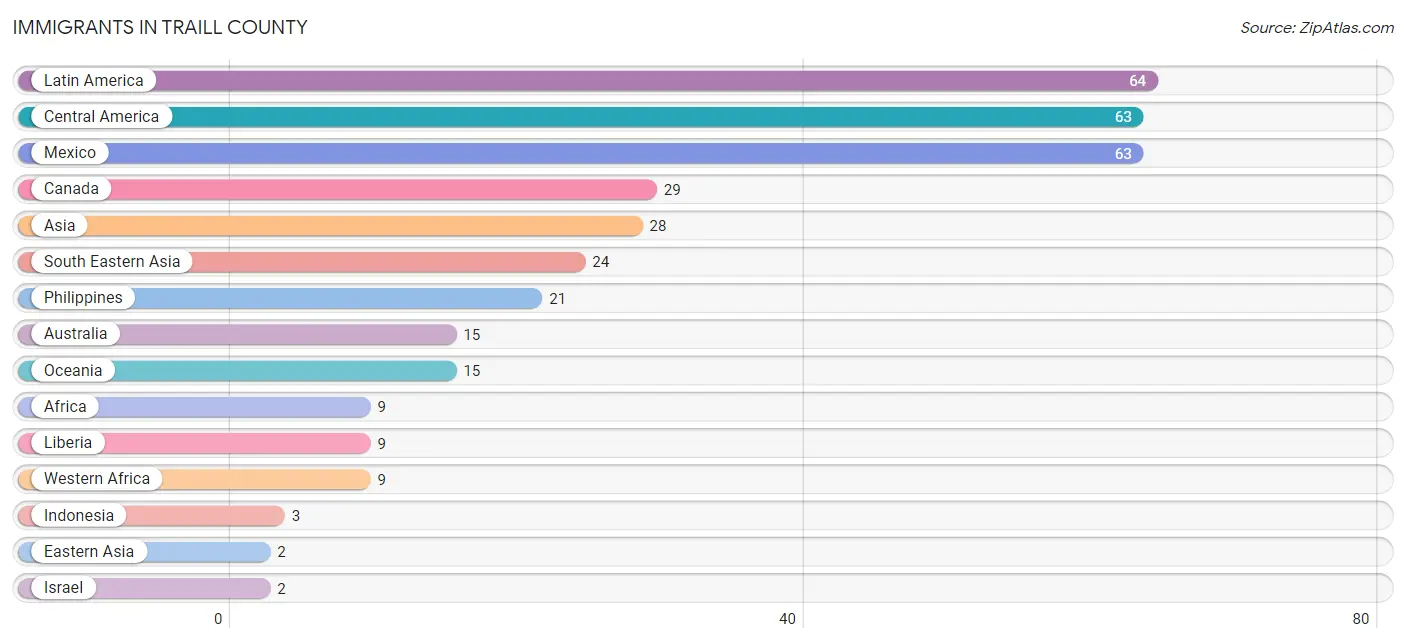
Immigrants in Traill County
The most numerous immigrant groups reported in Traill County came from Latin America (64 | 0.8%), Central America (63 | 0.8%), Mexico (63 | 0.8%), Canada (29 | 0.4%), and Asia (28 | 0.4%), together accounting for 3.1% of all Traill County residents.
| Immigration Origin | # Population | % Population |
| Africa | 9 | 0.1% |
| Asia | 28 | 0.4% |
| Australia | 15 | 0.2% |
| Brazil | 1 | 0.0% |
| Canada | 29 | 0.4% |
| Central America | 63 | 0.8% |
| Eastern Asia | 2 | 0.0% |
| Europe | 1 | 0.0% |
| Germany | 1 | 0.0% |
| Indonesia | 3 | 0.0% |
| Israel | 2 | 0.0% |
| Korea | 2 | 0.0% |
| Latin America | 64 | 0.8% |
| Liberia | 9 | 0.1% |
| Mexico | 63 | 0.8% |
| Oceania | 15 | 0.2% |
| Philippines | 21 | 0.3% |
| South America | 1 | 0.0% |
| South Eastern Asia | 24 | 0.3% |
| Western Africa | 9 | 0.1% |
| Western Asia | 2 | 0.0% |
| Western Europe | 1 | 0.0% | View All 22 Rows |
Sex and Age in Traill County
Sex and Age in Traill County
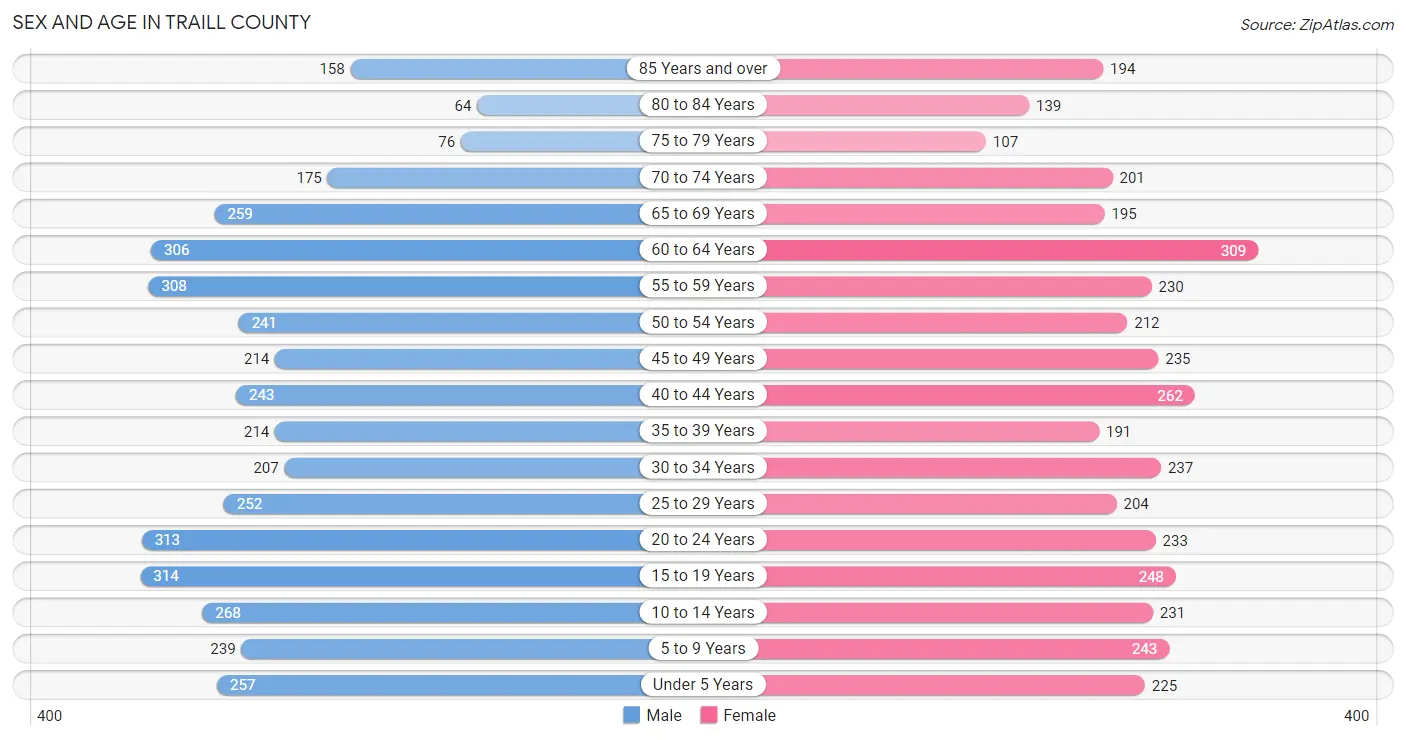
The most populous age groups in Traill County are 15 to 19 Years (314 | 7.6%) for men and 60 to 64 Years (309 | 7.9%) for women.
| Age Bracket | Male | Female |
| Under 5 Years | 257 (6.3%) | 225 (5.8%) |
| 5 to 9 Years | 239 (5.8%) | 243 (6.2%) |
| 10 to 14 Years | 268 (6.5%) | 231 (5.9%) |
| 15 to 19 Years | 314 (7.6%) | 248 (6.4%) |
| 20 to 24 Years | 313 (7.6%) | 233 (6.0%) |
| 25 to 29 Years | 252 (6.1%) | 204 (5.2%) |
| 30 to 34 Years | 207 (5.0%) | 237 (6.1%) |
| 35 to 39 Years | 214 (5.2%) | 191 (4.9%) |
| 40 to 44 Years | 243 (5.9%) | 262 (6.7%) |
| 45 to 49 Years | 214 (5.2%) | 235 (6.0%) |
| 50 to 54 Years | 241 (5.9%) | 212 (5.4%) |
| 55 to 59 Years | 308 (7.5%) | 230 (5.9%) |
| 60 to 64 Years | 306 (7.4%) | 309 (7.9%) |
| 65 to 69 Years | 259 (6.3%) | 195 (5.0%) |
| 70 to 74 Years | 175 (4.3%) | 201 (5.2%) |
| 75 to 79 Years | 76 (1.8%) | 107 (2.8%) |
| 80 to 84 Years | 64 (1.6%) | 139 (3.6%) |
| 85 Years and over | 158 (3.8%) | 194 (5.0%) |
| Total | 4,108 (100.0%) | 3,896 (100.0%) |
Families and Households in Traill County
Median Family Size in Traill County
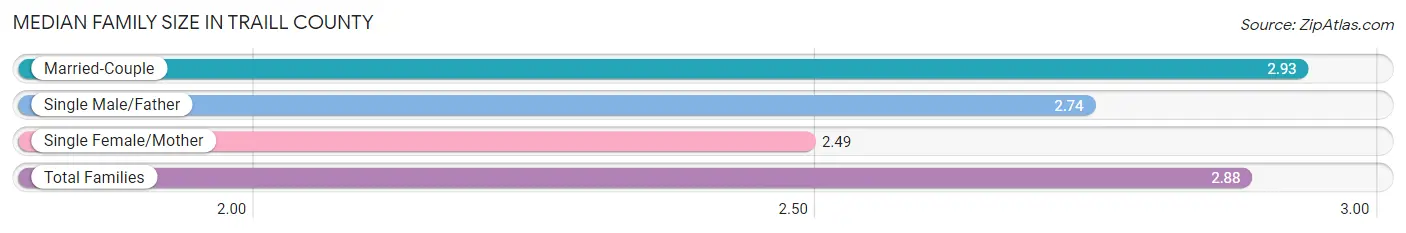
The median family size in Traill County is 2.88 persons per family, with married-couple families (1,787 | 85.1%) accounting for the largest median family size of 2.93 persons per family. On the other hand, single female/mother families (238 | 11.3%) represent the smallest median family size with 2.49 persons per family.
| Family Type | # Families | Family Size |
| Married-Couple | 1,787 (85.1%) | 2.93 |
| Single Male/Father | 76 (3.6%) | 2.74 |
| Single Female/Mother | 238 (11.3%) | 2.49 |
| Total Families | 2,101 (100.0%) | 2.88 |
Median Household Size in Traill County
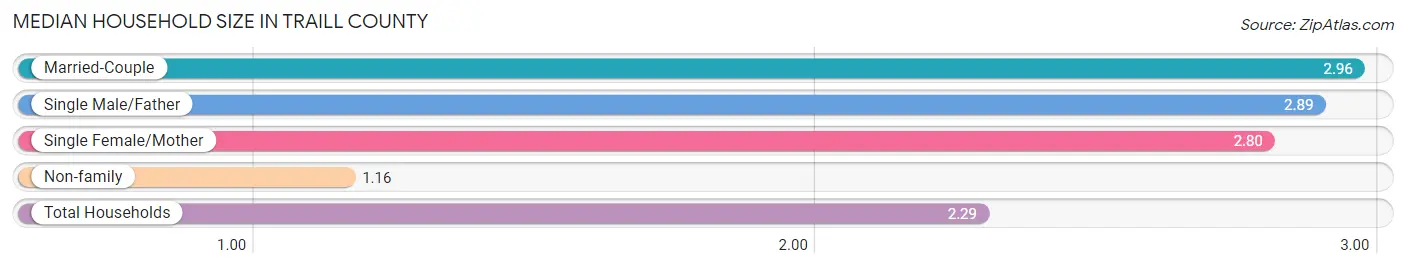
The median household size in Traill County is 2.29 persons per household, with married-couple households (1,787 | 54.4%) accounting for the largest median household size of 2.96 persons per household. non-family households (1,184 | 36.0%) represent the smallest median household size with 1.16 persons per household.
| Household Type | # Households | Household Size |
| Married-Couple | 1,787 (54.4%) | 2.96 |
| Single Male/Father | 76 (2.3%) | 2.89 |
| Single Female/Mother | 238 (7.2%) | 2.80 |
| Non-family | 1,184 (36.0%) | 1.16 |
| Total Households | 3,285 (100.0%) | 2.29 |
Household Size by Marriage Status in Traill County
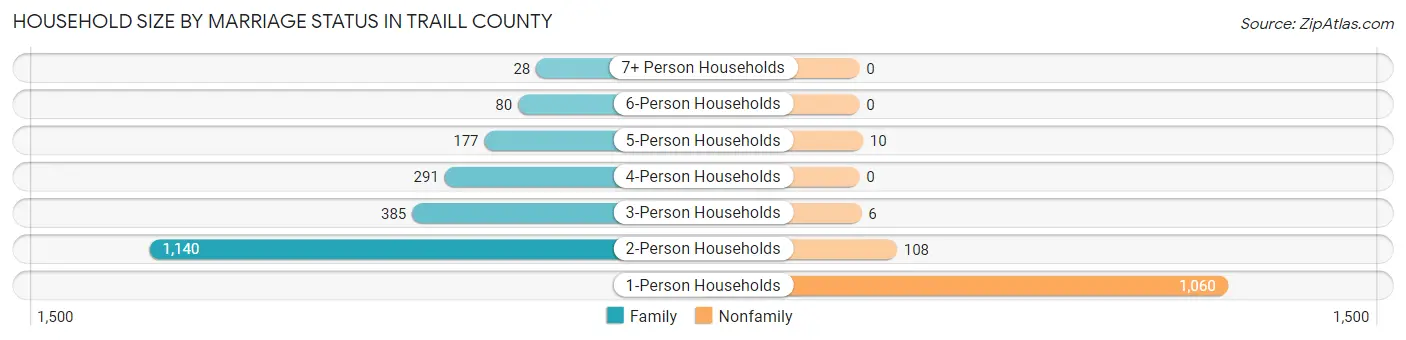
Out of a total of 3,285 households in Traill County, 2,101 (64.0%) are family households, while 1,184 (36.0%) are nonfamily households. The most numerous type of family households are 2-person households, comprising 1,140, and the most common type of nonfamily households are 1-person households, comprising 1,060.
| Household Size | Family Households | Nonfamily Households |
| 1-Person Households | - | 1,060 (32.3%) |
| 2-Person Households | 1,140 (34.7%) | 108 (3.3%) |
| 3-Person Households | 385 (11.7%) | 6 (0.2%) |
| 4-Person Households | 291 (8.9%) | 0 (0.0%) |
| 5-Person Households | 177 (5.4%) | 10 (0.3%) |
| 6-Person Households | 80 (2.4%) | 0 (0.0%) |
| 7+ Person Households | 28 (0.9%) | 0 (0.0%) |
| Total | 2,101 (64.0%) | 1,184 (36.0%) |
Female Fertility in Traill County
Fertility by Age in Traill County
Average fertility rate in Traill County is 60.0 births per 1,000 women. Women in the age bracket of 20 to 34 years have the highest fertility rate with 116.0 births per 1,000 women. Women in the age bracket of 20 to 34 years acount for 77.2% of all women with births.
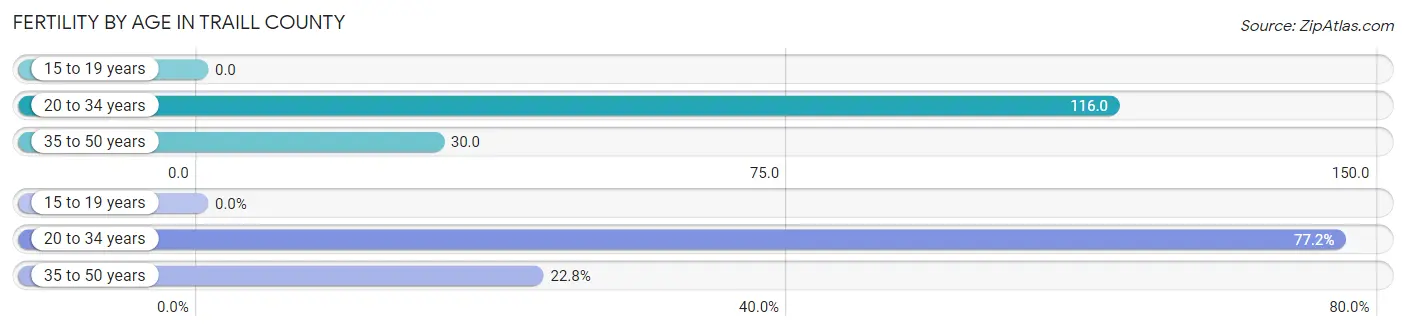
| Age Bracket | Women with Births | Births / 1,000 Women |
| 15 to 19 years | 0 (0.0%) | 0.0 |
| 20 to 34 years | 78 (77.2%) | 116.0 |
| 35 to 50 years | 23 (22.8%) | 30.0 |
| Total | 101 (100.0%) | 60.0 |
Fertility by Age by Marriage Status in Traill County
79.2% of women with births (101) in Traill County are married. The highest percentage of unmarried women with births falls into 20 to 34 years age bracket with 21.8% of them unmarried at the time of birth, while the lowest percentage of unmarried women with births belong to 35 to 50 years age bracket with 17.4% of them unmarried.
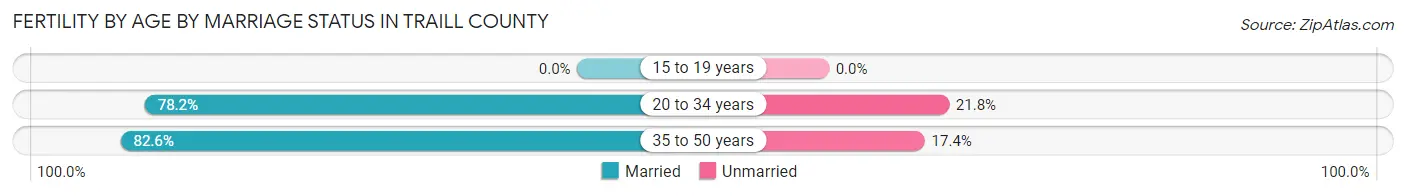
| Age Bracket | Married | Unmarried |
| 15 to 19 years | 0 (0.0%) | 0 (0.0%) |
| 20 to 34 years | 61 (78.2%) | 17 (21.8%) |
| 35 to 50 years | 19 (82.6%) | 4 (17.4%) |
| Total | 80 (79.2%) | 21 (20.8%) |
Fertility by Education in Traill County
Average fertility rate in Traill County is 60.0 births per 1,000 women. Women with the education attainment of graduate degree have the highest fertility rate of 102.0 births per 1,000 women, while women with the education attainment of less than high school have the lowest fertility at 4.0 births per 1,000 women. Women with the education attainment of college or associate's degree represent 38.6% of all women with births.
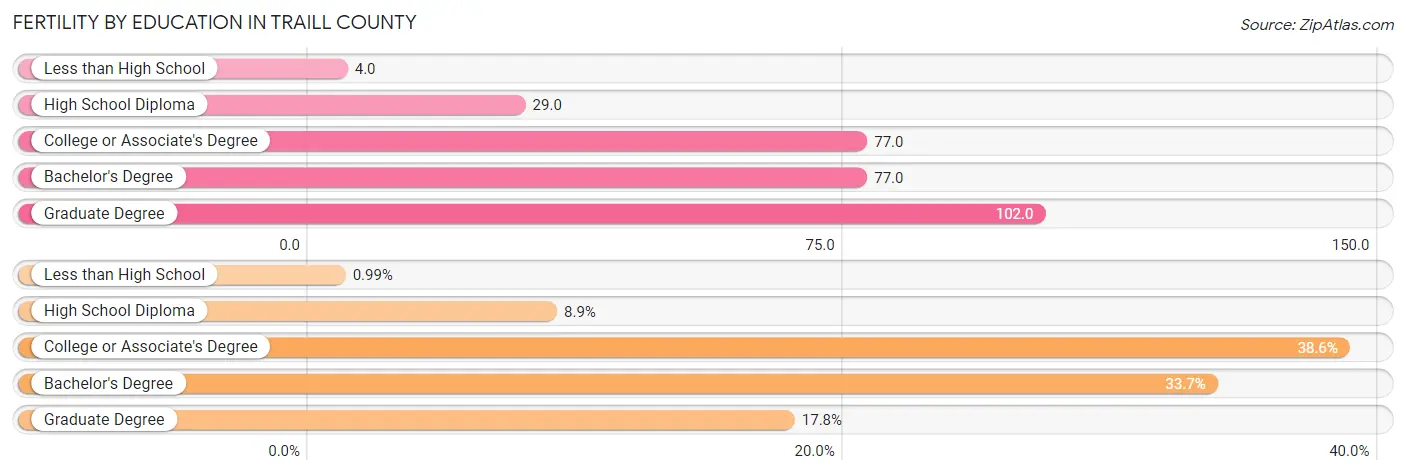
| Educational Attainment | Women with Births | Births / 1,000 Women |
| Less than High School | 1 (1.0%) | 4.0 |
| High School Diploma | 9 (8.9%) | 29.0 |
| College or Associate's Degree | 39 (38.6%) | 77.0 |
| Bachelor's Degree | 34 (33.7%) | 77.0 |
| Graduate Degree | 18 (17.8%) | 102.0 |
| Total | 101 (100.0%) | 60.0 |
Fertility by Education by Marriage Status in Traill County
20.8% of women with births in Traill County are unmarried. Women with the educational attainment of high school diploma are most likely to be married with 100.0% of them married at childbirth, while women with the educational attainment of less than high school are least likely to be married with 100.0% of them unmarried at childbirth.
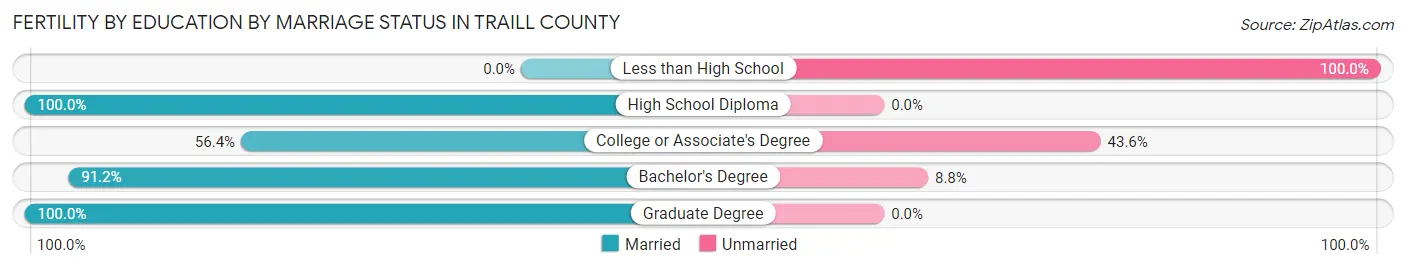
| Educational Attainment | Married | Unmarried |
| Less than High School | 0 (0.0%) | 1 (100.0%) |
| High School Diploma | 9 (100.0%) | 0 (0.0%) |
| College or Associate's Degree | 22 (56.4%) | 17 (43.6%) |
| Bachelor's Degree | 31 (91.2%) | 3 (8.8%) |
| Graduate Degree | 18 (100.0%) | 0 (0.0%) |
| Total | 80 (79.2%) | 21 (20.8%) |
Income in Traill County
Income Overview in Traill County
Per Capita Income in Traill County is $40,942, while median incomes of families and households are $108,958 and $81,157 respectively.
| Characteristic | Number | Measure |
| Per Capita Income | 8,004 | $40,942 |
| Median Family Income | 2,101 | $108,958 |
| Mean Family Income | 2,101 | $124,233 |
| Median Household Income | 3,285 | $81,157 |
| Mean Household Income | 3,285 | $99,090 |
| Income Deficit | 2,101 | $10,624 |
| Wage / Income Gap (%) | 8,004 | 31.81% |
| Wage / Income Gap ($) | 8,004 | 68.19¢ per $1 |
| Gini / Inequality Index | 8,004 | 0.42 |
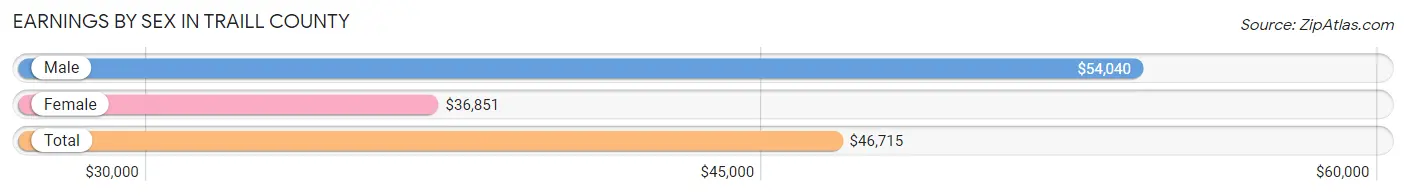
Earnings by Sex in Traill County
Average Earnings in Traill County are $46,715, $54,040 for men and $36,851 for women, a difference of 31.8%.
| Sex | Number | Average Earnings |
| Male | 2,491 (54.3%) | $54,040 |
| Female | 2,099 (45.7%) | $36,851 |
| Total | 4,590 (100.0%) | $46,715 |
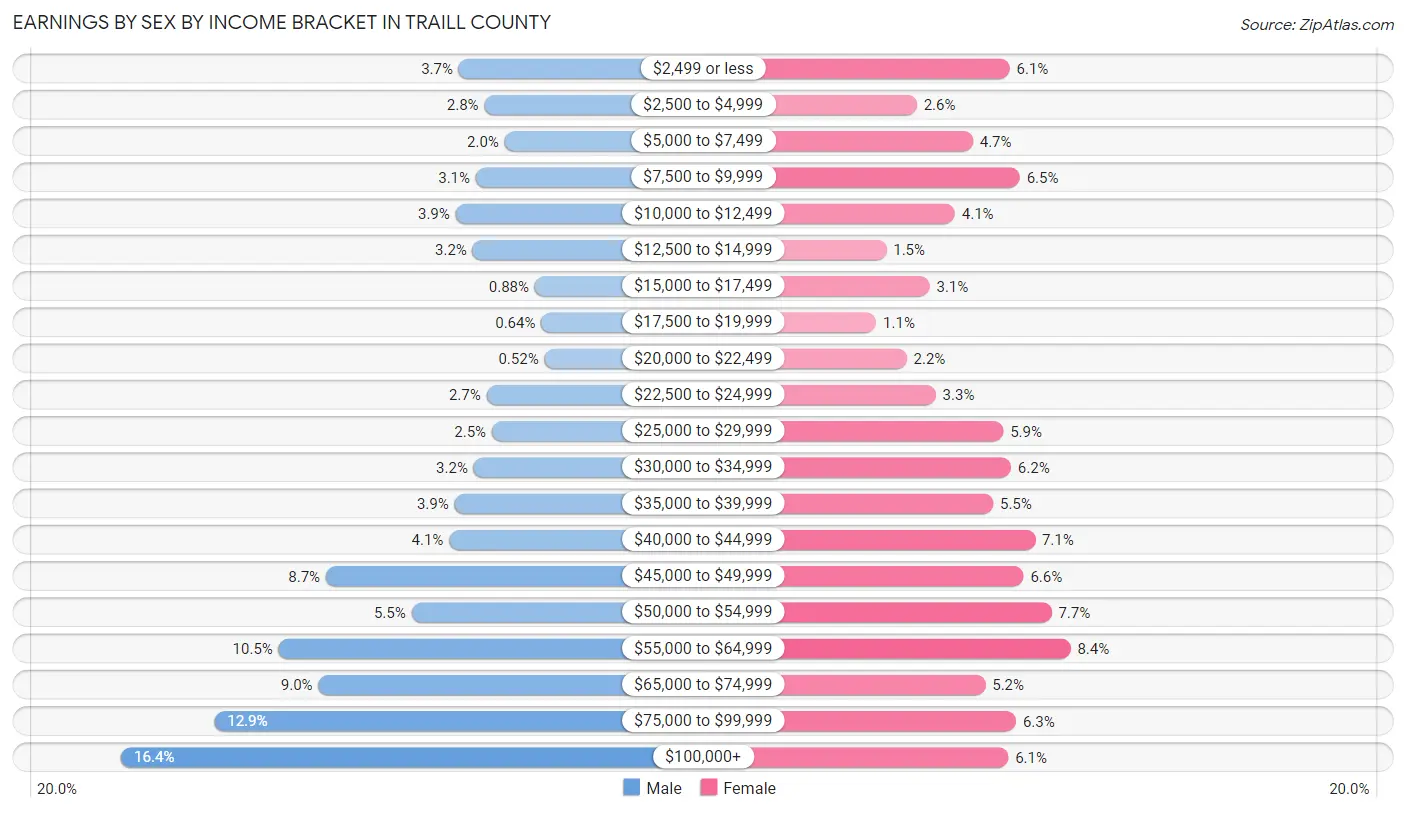
Earnings by Sex by Income Bracket in Traill County
The most common earnings brackets in Traill County are $100,000+ for men (408 | 16.4%) and $55,000 to $64,999 for women (176 | 8.4%).
| Income | Male | Female |
| $2,499 or less | 93 (3.7%) | 128 (6.1%) |
| $2,500 to $4,999 | 69 (2.8%) | 55 (2.6%) |
| $5,000 to $7,499 | 50 (2.0%) | 99 (4.7%) |
| $7,500 to $9,999 | 77 (3.1%) | 136 (6.5%) |
| $10,000 to $12,499 | 96 (3.8%) | 85 (4.1%) |
| $12,500 to $14,999 | 80 (3.2%) | 31 (1.5%) |
| $15,000 to $17,499 | 22 (0.9%) | 65 (3.1%) |
| $17,500 to $19,999 | 16 (0.6%) | 23 (1.1%) |
| $20,000 to $22,499 | 13 (0.5%) | 47 (2.2%) |
| $22,500 to $24,999 | 67 (2.7%) | 70 (3.3%) |
| $25,000 to $29,999 | 62 (2.5%) | 123 (5.9%) |
| $30,000 to $34,999 | 79 (3.2%) | 129 (6.1%) |
| $35,000 to $39,999 | 97 (3.9%) | 115 (5.5%) |
| $40,000 to $44,999 | 102 (4.1%) | 148 (7.0%) |
| $45,000 to $49,999 | 217 (8.7%) | 139 (6.6%) |
| $50,000 to $54,999 | 137 (5.5%) | 161 (7.7%) |
| $55,000 to $64,999 | 261 (10.5%) | 176 (8.4%) |
| $65,000 to $74,999 | 224 (9.0%) | 109 (5.2%) |
| $75,000 to $99,999 | 321 (12.9%) | 133 (6.3%) |
| $100,000+ | 408 (16.4%) | 127 (6.0%) |
| Total | 2,491 (100.0%) | 2,099 (100.0%) |
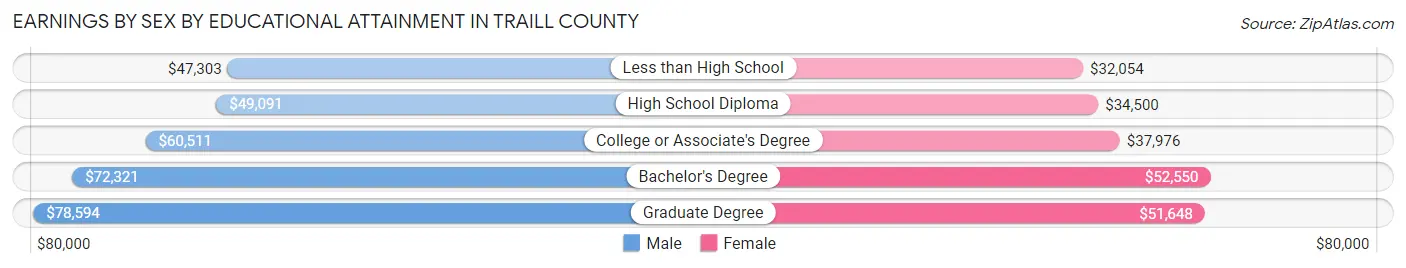
Earnings by Sex by Educational Attainment in Traill County
Average earnings in Traill County are $60,694 for men and $42,931 for women, a difference of 29.3%. Men with an educational attainment of graduate degree enjoy the highest average annual earnings of $78,594, while those with less than high school education earn the least with $47,303. Women with an educational attainment of bachelor's degree earn the most with the average annual earnings of $52,550, while those with less than high school education have the smallest earnings of $32,054.
| Educational Attainment | Male Income | Female Income |
| Less than High School | $47,303 | $32,054 |
| High School Diploma | $49,091 | $34,500 |
| College or Associate's Degree | $60,511 | $37,976 |
| Bachelor's Degree | $72,321 | $52,550 |
| Graduate Degree | $78,594 | $51,648 |
| Total | $60,694 | $42,931 |
Family Income in Traill County
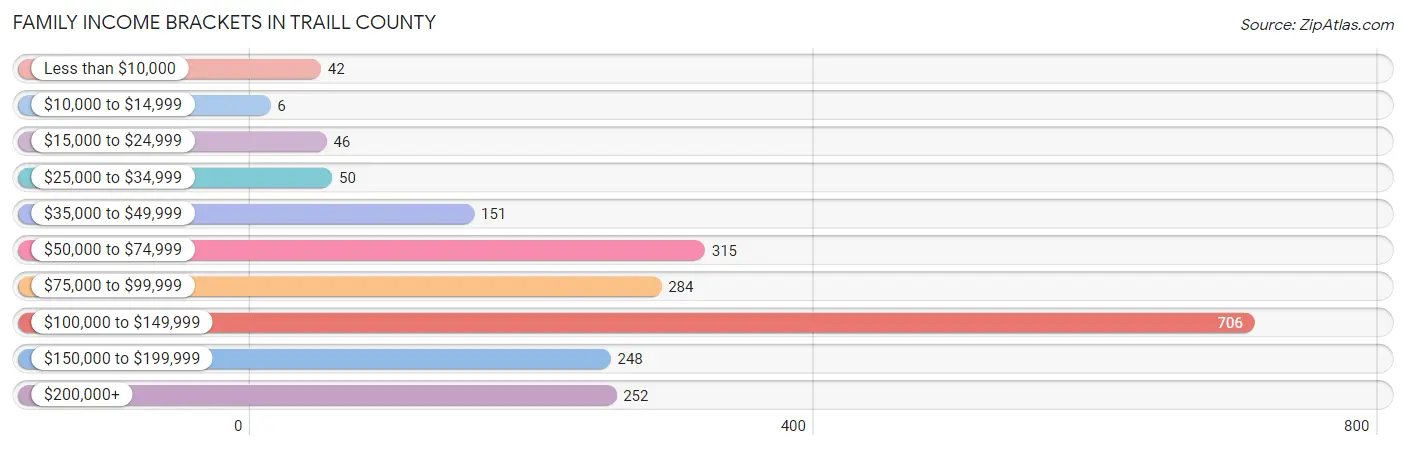
Family Income Brackets in Traill County
According to the Traill County family income data, there are 706 families falling into the $100,000 to $149,999 income range, which is the most common income bracket and makes up 33.6% of all families. Conversely, the $10,000 to $14,999 income bracket is the least frequent group with only 6 families (0.3%) belonging to this category.
| Income Bracket | # Families | % Families |
| Less than $10,000 | 42 | 2.0% |
| $10,000 to $14,999 | 6 | 0.3% |
| $15,000 to $24,999 | 46 | 2.2% |
| $25,000 to $34,999 | 50 | 2.4% |
| $35,000 to $49,999 | 151 | 7.2% |
| $50,000 to $74,999 | 315 | 15.0% |
| $75,000 to $99,999 | 284 | 13.5% |
| $100,000 to $149,999 | 706 | 33.6% |
| $150,000 to $199,999 | 248 | 11.8% |
| $200,000+ | 252 | 12.0% |
Family Income by Famaliy Size in Traill County
5-person families (167 | 8.0%) account for the highest median family income in Traill County with $130,729 per family, while 2-person families (1,220 | 58.1%) have the highest median income of $51,065 per family member.
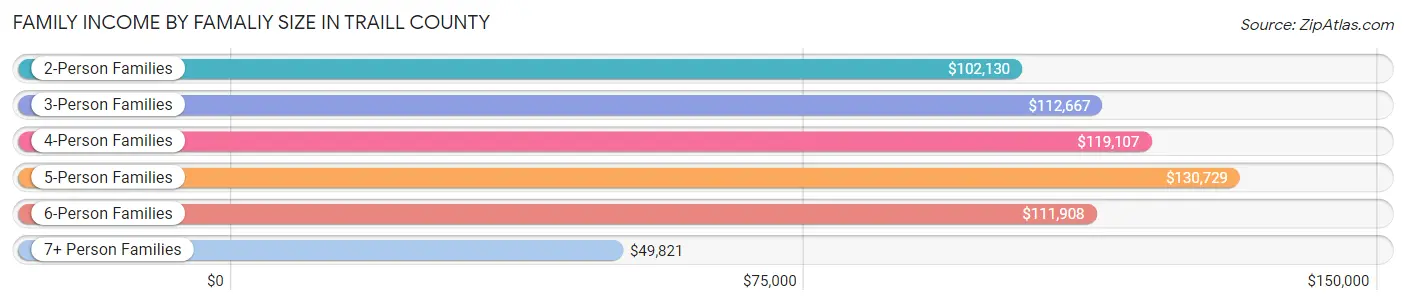
| Income Bracket | # Families | Median Income |
| 2-Person Families | 1,220 (58.1%) | $102,130 |
| 3-Person Families | 340 (16.2%) | $112,667 |
| 4-Person Families | 269 (12.8%) | $119,107 |
| 5-Person Families | 167 (8.0%) | $130,729 |
| 6-Person Families | 77 (3.7%) | $111,908 |
| 7+ Person Families | 28 (1.3%) | $49,821 |
| Total | 2,101 (100.0%) | $108,958 |
Family Income by Number of Earners in Traill County
The median family income in Traill County is $108,958, with families comprising 3+ earners (228) having the highest median family income of $147,000, while families with no earners (209) have the lowest median family income of $55,250, accounting for 10.8% and 10.0% of families, respectively.
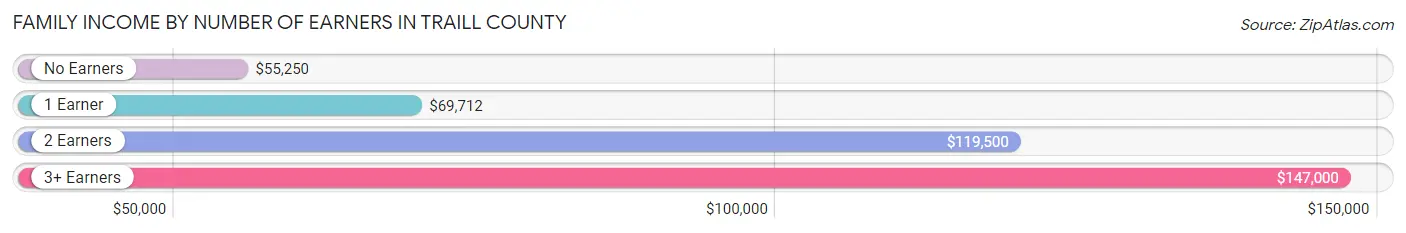
| Number of Earners | # Families | Median Income |
| No Earners | 209 (10.0%) | $55,250 |
| 1 Earner | 552 (26.3%) | $69,712 |
| 2 Earners | 1,112 (52.9%) | $119,500 |
| 3+ Earners | 228 (10.8%) | $147,000 |
| Total | 2,101 (100.0%) | $108,958 |
Household Income in Traill County
Household Income Brackets in Traill County
With 792 households falling in the category, the $100,000 to $149,999 income range is the most frequent in Traill County, accounting for 24.1% of all households. In contrast, only 148 households (4.5%) fall into the less than $10,000 income bracket, making it the least populous group.
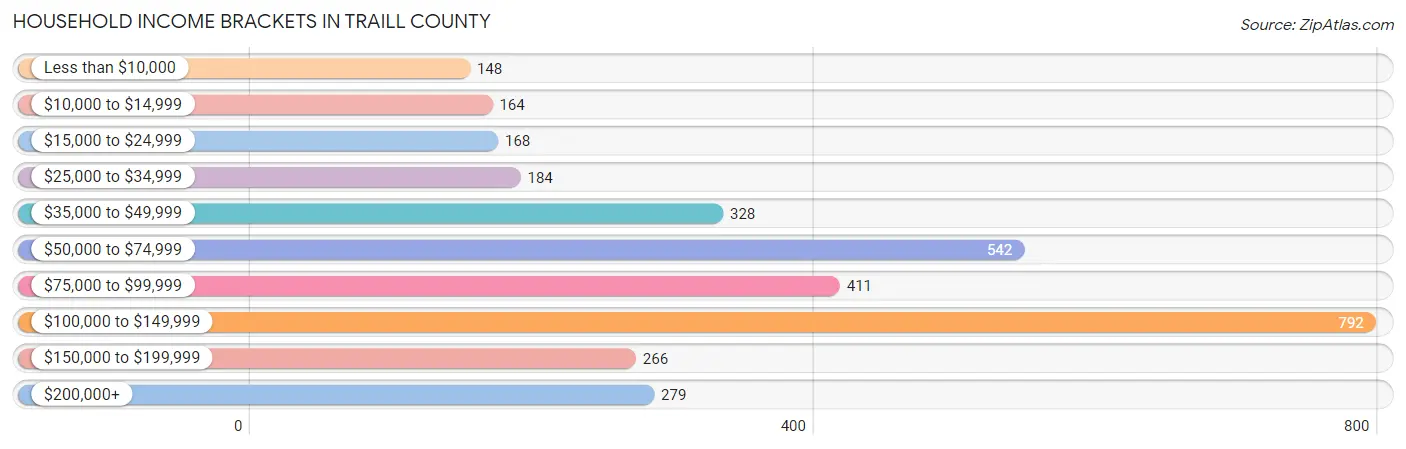
| Income Bracket | # Households | % Households |
| Less than $10,000 | 148 | 4.5% |
| $10,000 to $14,999 | 164 | 5.0% |
| $15,000 to $24,999 | 168 | 5.1% |
| $25,000 to $34,999 | 184 | 5.6% |
| $35,000 to $49,999 | 328 | 10.0% |
| $50,000 to $74,999 | 542 | 16.5% |
| $75,000 to $99,999 | 411 | 12.5% |
| $100,000 to $149,999 | 792 | 24.1% |
| $150,000 to $199,999 | 266 | 8.1% |
| $200,000+ | 279 | 8.5% |
Household Income by Householder Age in Traill County
The median household income in Traill County is $81,157, with the highest median household income of $104,120 found in the 45 to 64 years age bracket for the primary householder. A total of 1,231 households (37.5%) fall into this category. Meanwhile, the 15 to 24 years age bracket for the primary householder has the lowest median household income of $43,438, with 158 households (4.8%) in this group.
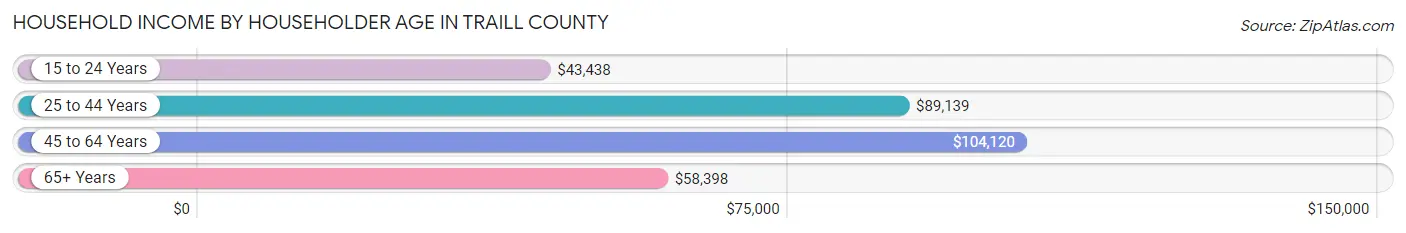
| Income Bracket | # Households | Median Income |
| 15 to 24 Years | 158 (4.8%) | $43,438 |
| 25 to 44 Years | 941 (28.6%) | $89,139 |
| 45 to 64 Years | 1,231 (37.5%) | $104,120 |
| 65+ Years | 955 (29.1%) | $58,398 |
| Total | 3,285 (100.0%) | $81,157 |
Poverty in Traill County
Income Below Poverty by Sex and Age in Traill County
With 6.7% poverty level for males and 6.4% for females among the residents of Traill County, 18 to 24 year old males and 18 to 24 year old females are the most vulnerable to poverty, with 68 males (22.6%) and 42 females (17.6%) in their respective age groups living below the poverty level.
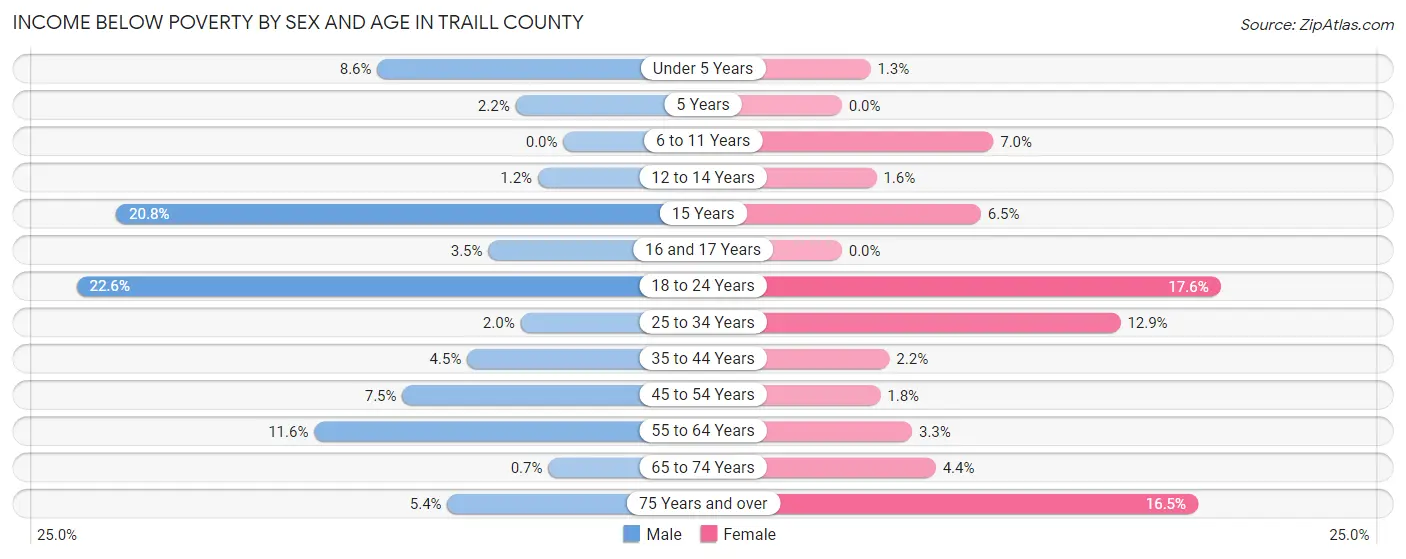
| Age Bracket | Male | Female |
| Under 5 Years | 22 (8.6%) | 3 (1.3%) |
| 5 Years | 1 (2.2%) | 0 (0.0%) |
| 6 to 11 Years | 0 (0.0%) | 22 (7.0%) |
| 12 to 14 Years | 2 (1.2%) | 2 (1.6%) |
| 15 Years | 11 (20.7%) | 2 (6.5%) |
| 16 and 17 Years | 4 (3.5%) | 0 (0.0%) |
| 18 to 24 Years | 68 (22.6%) | 42 (17.6%) |
| 25 to 34 Years | 9 (2.0%) | 57 (12.9%) |
| 35 to 44 Years | 20 (4.5%) | 10 (2.2%) |
| 45 to 54 Years | 34 (7.5%) | 8 (1.8%) |
| 55 to 64 Years | 71 (11.6%) | 17 (3.3%) |
| 65 to 74 Years | 3 (0.7%) | 17 (4.4%) |
| 75 Years and over | 12 (5.4%) | 58 (16.5%) |
| Total | 257 (6.7%) | 238 (6.4%) |
Income Above Poverty by Sex and Age in Traill County
According to the poverty statistics in Traill County, males aged 6 to 11 years and females aged 5 years are the age groups that are most secure financially, with 100.0% of males and 100.0% of females in these age groups living above the poverty line.
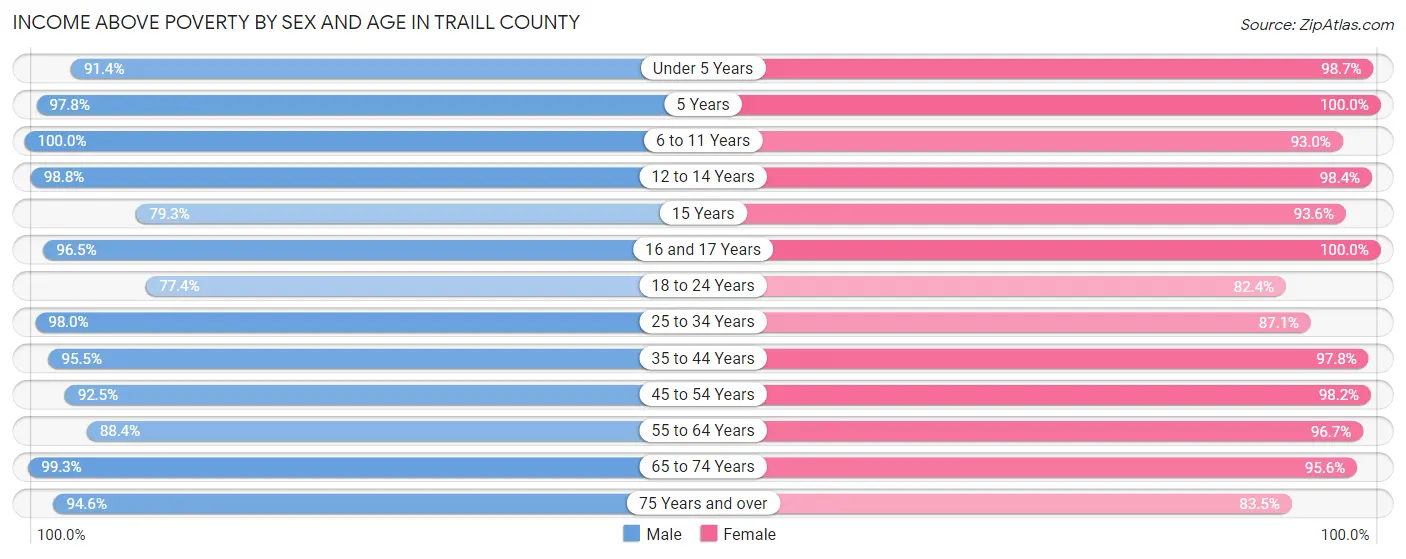
| Age Bracket | Male | Female |
| Under 5 Years | 233 (91.4%) | 222 (98.7%) |
| 5 Years | 44 (97.8%) | 37 (100.0%) |
| 6 to 11 Years | 289 (100.0%) | 291 (93.0%) |
| 12 to 14 Years | 167 (98.8%) | 122 (98.4%) |
| 15 Years | 42 (79.2%) | 29 (93.5%) |
| 16 and 17 Years | 111 (96.5%) | 122 (100.0%) |
| 18 to 24 Years | 233 (77.4%) | 197 (82.4%) |
| 25 to 34 Years | 444 (98.0%) | 384 (87.1%) |
| 35 to 44 Years | 428 (95.5%) | 443 (97.8%) |
| 45 to 54 Years | 421 (92.5%) | 439 (98.2%) |
| 55 to 64 Years | 543 (88.4%) | 504 (96.7%) |
| 65 to 74 Years | 427 (99.3%) | 373 (95.6%) |
| 75 Years and over | 211 (94.6%) | 293 (83.5%) |
| Total | 3,593 (93.3%) | 3,456 (93.6%) |
Income Below Poverty Among Married-Couple Families in Traill County
The poverty statistics for married-couple families in Traill County show that 0.5% or 9 of the total 1,787 families live below the poverty line. Families with 3 or 4 children have the highest poverty rate of 3.6%, comprising of 6 families. On the other hand, families with 1 or 2 children have the lowest poverty rate of 0.0%, which includes 0 families.
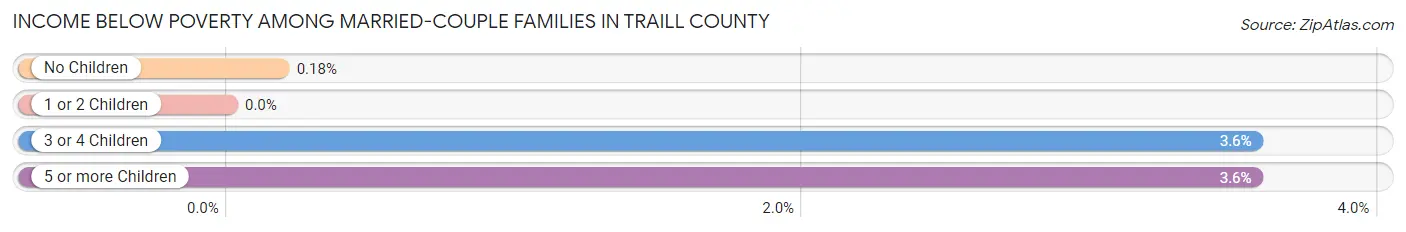
| Children | Above Poverty | Below Poverty |
| No Children | 1,128 (99.8%) | 2 (0.2%) |
| 1 or 2 Children | 461 (100.0%) | 0 (0.0%) |
| 3 or 4 Children | 162 (96.4%) | 6 (3.6%) |
| 5 or more Children | 27 (96.4%) | 1 (3.6%) |
| Total | 1,778 (99.5%) | 9 (0.5%) |
Income Below Poverty Among Single-Parent Households in Traill County
According to the poverty data in Traill County, 26.3% or 20 single-father households and 13.9% or 33 single-mother households are living below the poverty line. Among single-father households, those with 3 or 4 children have the highest poverty rate, with 3 households (60.0%) experiencing poverty. Likewise, among single-mother households, those with no children have the highest poverty rate, with 8 households (15.7%) falling below the poverty line.
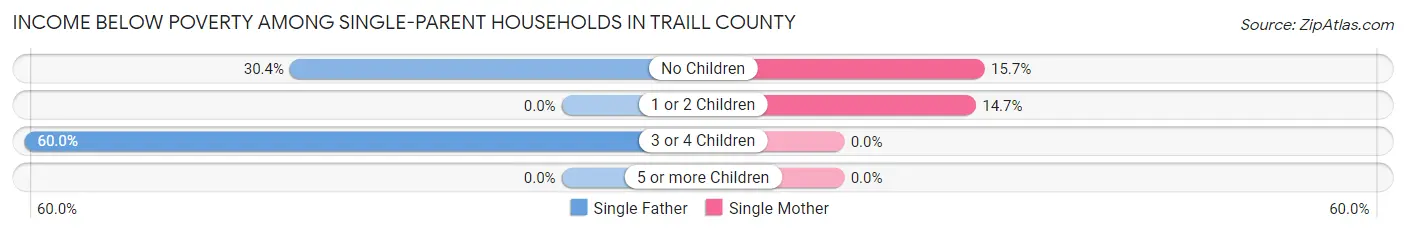
| Children | Single Father | Single Mother |
| No Children | 17 (30.4%) | 8 (15.7%) |
| 1 or 2 Children | 0 (0.0%) | 25 (14.7%) |
| 3 or 4 Children | 3 (60.0%) | 0 (0.0%) |
| 5 or more Children | 0 (0.0%) | 0 (0.0%) |
| Total | 20 (26.3%) | 33 (13.9%) |
Income Below Poverty Among Married-Couple vs Single-Parent Households in Traill County
The poverty data for Traill County shows that 9 of the married-couple family households (0.5%) and 53 of the single-parent households (16.9%) are living below the poverty level. Within the married-couple family households, those with 3 or 4 children have the highest poverty rate, with 6 households (3.6%) falling below the poverty line. Among the single-parent households, those with no children have the highest poverty rate, with 25 household (23.4%) living below poverty.
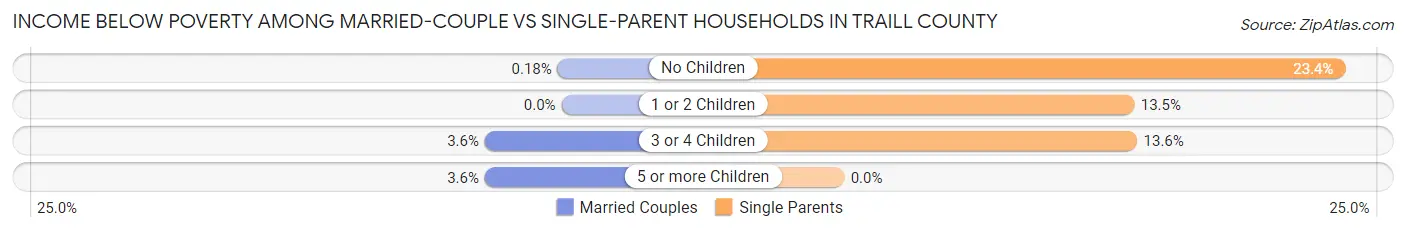
| Children | Married-Couple Families | Single-Parent Households |
| No Children | 2 (0.2%) | 25 (23.4%) |
| 1 or 2 Children | 0 (0.0%) | 25 (13.5%) |
| 3 or 4 Children | 6 (3.6%) | 3 (13.6%) |
| 5 or more Children | 1 (3.6%) | 0 (0.0%) |
| Total | 9 (0.5%) | 53 (16.9%) |
Employment Characteristics in Traill County
Employment by Class of Employer in Traill County
Among the 4,077 employed individuals in Traill County, private company employees (2,298 | 56.4%), not-for-profit organizations (406 | 10.0%), and self-employed (not incorporated) (397 | 9.7%) make up the most common classes of employment.
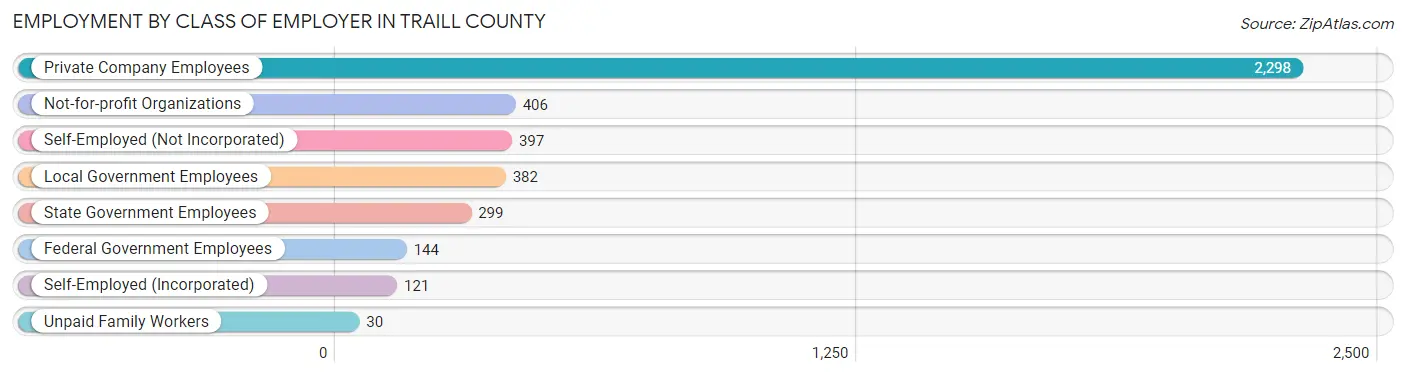
| Employer Class | # Employees | % Employees |
| Private Company Employees | 2,298 | 56.4% |
| Self-Employed (Incorporated) | 121 | 3.0% |
| Self-Employed (Not Incorporated) | 397 | 9.7% |
| Not-for-profit Organizations | 406 | 10.0% |
| Local Government Employees | 382 | 9.4% |
| State Government Employees | 299 | 7.3% |
| Federal Government Employees | 144 | 3.5% |
| Unpaid Family Workers | 30 | 0.7% |
| Total | 4,077 | 100.0% |
Employment Status by Age in Traill County
According to the labor force statistics for Traill County, out of the total population over 16 years of age (6,457), 65.7% or 4,242 individuals are in the labor force, with 2.0% or 85 of them unemployed. The age group with the highest labor force participation rate is 25 to 29 years, with 87.9% or 401 individuals in the labor force. Within the labor force, the 16 to 19 years age range has the highest percentage of unemployed individuals, with 13.8% or 32 of them being unemployed.
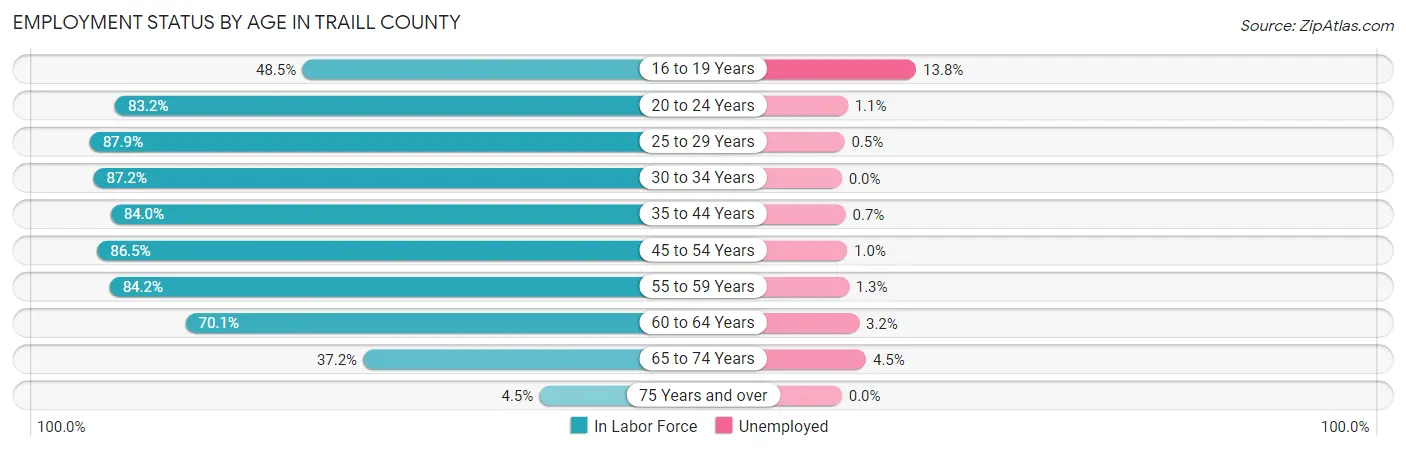
| Age Bracket | In Labor Force | Unemployed |
| 16 to 19 Years | 232 (48.5%) | 32 (13.8%) |
| 20 to 24 Years | 454 (83.2%) | 5 (1.1%) |
| 25 to 29 Years | 401 (87.9%) | 2 (0.5%) |
| 30 to 34 Years | 387 (87.2%) | 0 (0.0%) |
| 35 to 44 Years | 764 (84.0%) | 5 (0.7%) |
| 45 to 54 Years | 780 (86.5%) | 8 (1.0%) |
| 55 to 59 Years | 453 (84.2%) | 6 (1.3%) |
| 60 to 64 Years | 431 (70.1%) | 14 (3.2%) |
| 65 to 74 Years | 309 (37.2%) | 14 (4.5%) |
| 75 Years and over | 33 (4.5%) | 0 (0.0%) |
| Total | 4,242 (65.7%) | 85 (2.0%) |
Employment Status by Educational Attainment in Traill County
According to labor force statistics for Traill County, 83.2% of individuals (3,216) out of the total population between 25 and 64 years of age (3,865) are in the labor force, with 1.1% or 35 of them being unemployed. The group with the highest labor force participation rate are those with the educational attainment of high school diploma, with 85.6% or 736 individuals in the labor force. Within the labor force, individuals with college / associate degree education have the highest percentage of unemployment, with 1.4% or 18 of them being unemployed.
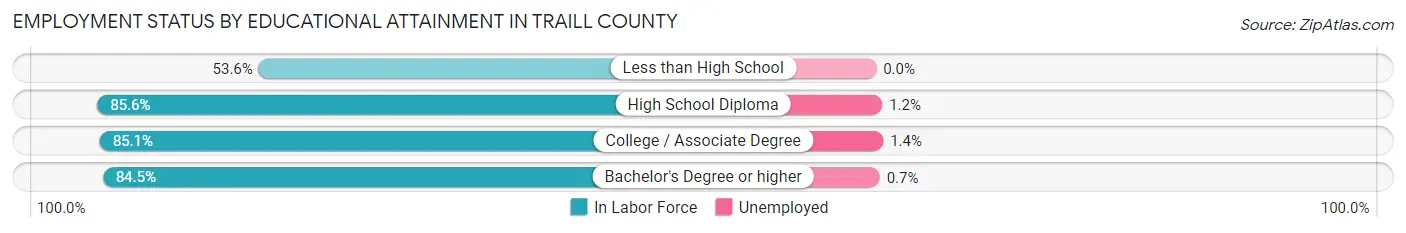
| Educational Attainment | In Labor Force | Unemployed |
| Less than High School | 118 (53.6%) | 0 (0.0%) |
| High School Diploma | 736 (85.6%) | 10 (1.2%) |
| College / Associate Degree | 1,294 (85.1%) | 21 (1.4%) |
| Bachelor's Degree or higher | 1,069 (84.5%) | 9 (0.7%) |
| Total | 3,216 (83.2%) | 43 (1.1%) |
Employment Occupations by Sex in Traill County
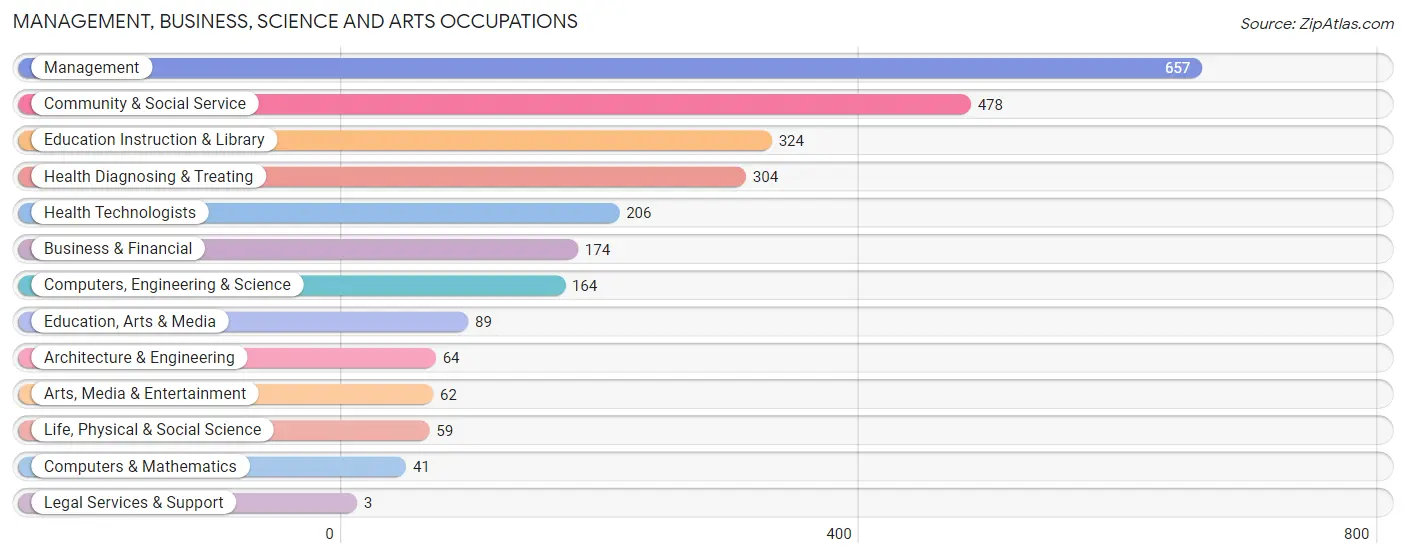
Management, Business, Science and Arts Occupations
The most common Management, Business, Science and Arts occupations in Traill County are Management (657 | 15.9%), Community & Social Service (478 | 11.6%), Education Instruction & Library (324 | 7.8%), Health Diagnosing & Treating (304 | 7.3%), and Health Technologists (206 | 5.0%).
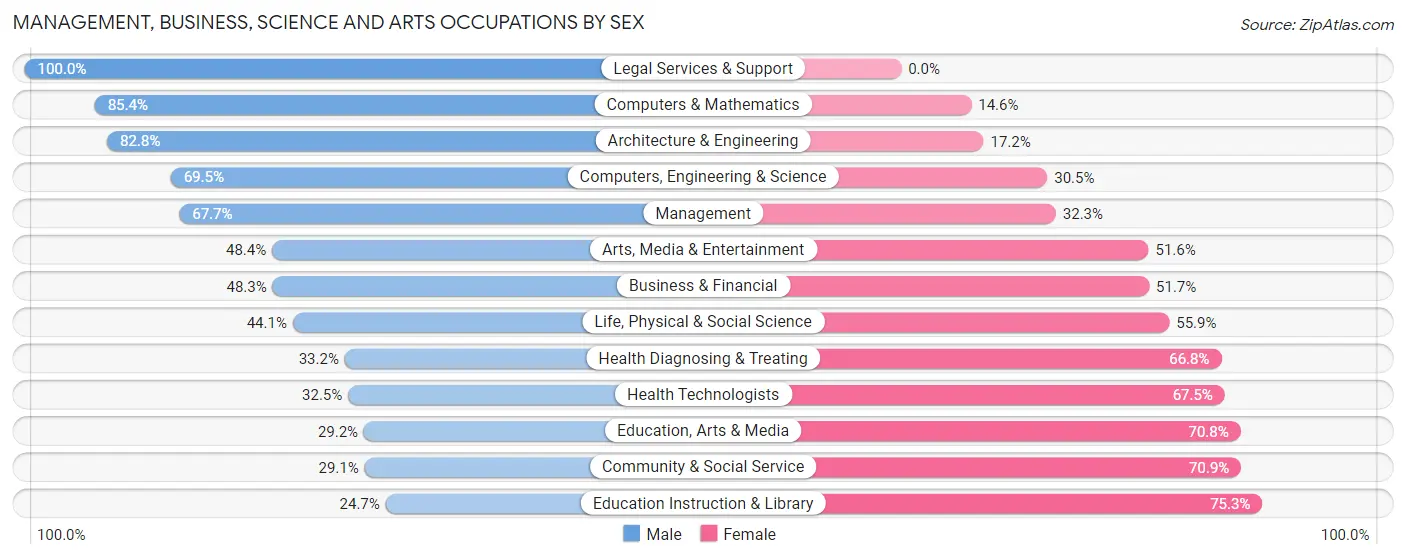
Management, Business, Science and Arts Occupations by Sex
Within the Management, Business, Science and Arts occupations in Traill County, the most male-oriented occupations are Legal Services & Support (100.0%), Computers & Mathematics (85.4%), and Architecture & Engineering (82.8%), while the most female-oriented occupations are Education Instruction & Library (75.3%), Community & Social Service (70.9%), and Education, Arts & Media (70.8%).
| Occupation | Male | Female |
| Management | 445 (67.7%) | 212 (32.3%) |
| Business & Financial | 84 (48.3%) | 90 (51.7%) |
| Computers, Engineering & Science | 114 (69.5%) | 50 (30.5%) |
| Computers & Mathematics | 35 (85.4%) | 6 (14.6%) |
| Architecture & Engineering | 53 (82.8%) | 11 (17.2%) |
| Life, Physical & Social Science | 26 (44.1%) | 33 (55.9%) |
| Community & Social Service | 139 (29.1%) | 339 (70.9%) |
| Education, Arts & Media | 26 (29.2%) | 63 (70.8%) |
| Legal Services & Support | 3 (100.0%) | 0 (0.0%) |
| Education Instruction & Library | 80 (24.7%) | 244 (75.3%) |
| Arts, Media & Entertainment | 30 (48.4%) | 32 (51.6%) |
| Health Diagnosing & Treating | 101 (33.2%) | 203 (66.8%) |
| Health Technologists | 67 (32.5%) | 139 (67.5%) |
| Total (Category) | 883 (49.7%) | 894 (50.3%) |
| Total (Overall) | 2,220 (53.7%) | 1,915 (46.3%) |
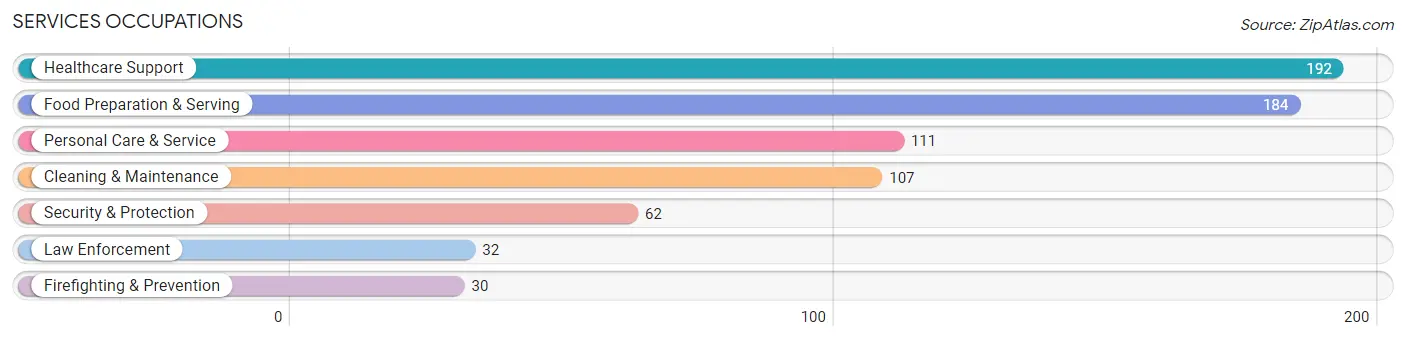
Services Occupations
The most common Services occupations in Traill County are Healthcare Support (192 | 4.6%), Food Preparation & Serving (184 | 4.4%), Personal Care & Service (111 | 2.7%), Cleaning & Maintenance (107 | 2.6%), and Security & Protection (62 | 1.5%).
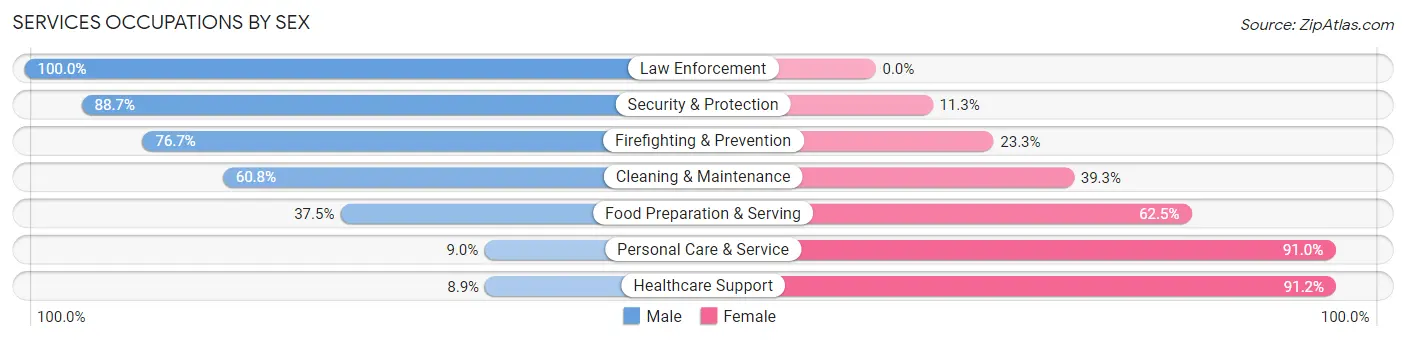
Services Occupations by Sex
Within the Services occupations in Traill County, the most male-oriented occupations are Law Enforcement (100.0%), Security & Protection (88.7%), and Firefighting & Prevention (76.7%), while the most female-oriented occupations are Healthcare Support (91.1%), Personal Care & Service (91.0%), and Food Preparation & Serving (62.5%).
| Occupation | Male | Female |
| Healthcare Support | 17 (8.8%) | 175 (91.1%) |
| Security & Protection | 55 (88.7%) | 7 (11.3%) |
| Firefighting & Prevention | 23 (76.7%) | 7 (23.3%) |
| Law Enforcement | 32 (100.0%) | 0 (0.0%) |
| Food Preparation & Serving | 69 (37.5%) | 115 (62.5%) |
| Cleaning & Maintenance | 65 (60.8%) | 42 (39.3%) |
| Personal Care & Service | 10 (9.0%) | 101 (91.0%) |
| Total (Category) | 216 (32.9%) | 440 (67.1%) |
| Total (Overall) | 2,220 (53.7%) | 1,915 (46.3%) |
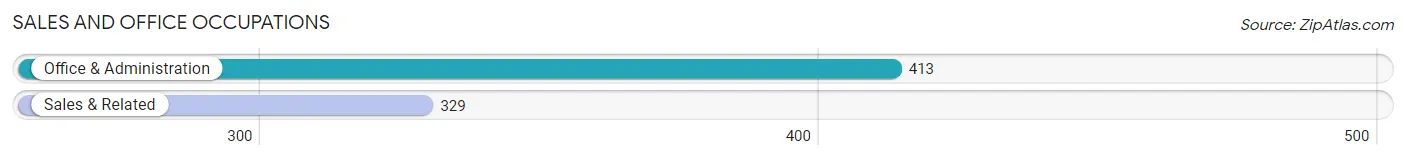
Sales and Office Occupations
The most common Sales and Office occupations in Traill County are Office & Administration (413 | 10.0%), and Sales & Related (329 | 8.0%).
Sales and Office Occupations by Sex
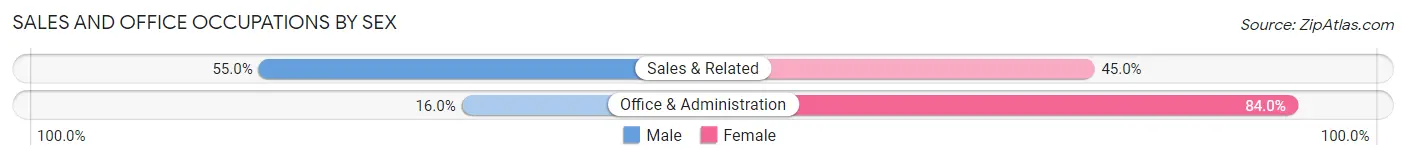
| Occupation | Male | Female |
| Sales & Related | 181 (55.0%) | 148 (45.0%) |
| Office & Administration | 66 (16.0%) | 347 (84.0%) |
| Total (Category) | 247 (33.3%) | 495 (66.7%) |
| Total (Overall) | 2,220 (53.7%) | 1,915 (46.3%) |
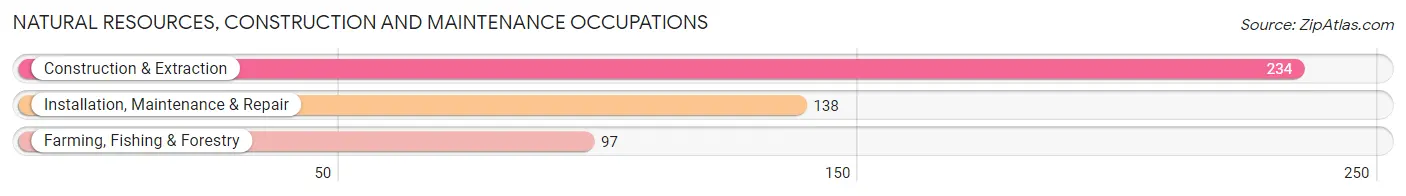
Natural Resources, Construction and Maintenance Occupations
The most common Natural Resources, Construction and Maintenance occupations in Traill County are Construction & Extraction (234 | 5.7%), Installation, Maintenance & Repair (138 | 3.3%), and Farming, Fishing & Forestry (97 | 2.4%).
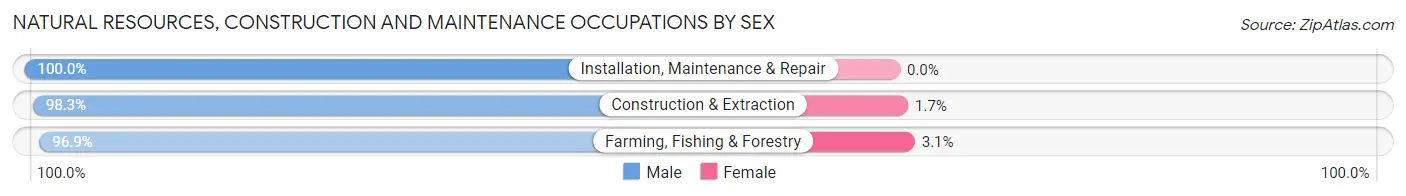
Natural Resources, Construction and Maintenance Occupations by Sex
| Occupation | Male | Female |
| Farming, Fishing & Forestry | 94 (96.9%) | 3 (3.1%) |
| Construction & Extraction | 230 (98.3%) | 4 (1.7%) |
| Installation, Maintenance & Repair | 138 (100.0%) | 0 (0.0%) |
| Total (Category) | 462 (98.5%) | 7 (1.5%) |
| Total (Overall) | 2,220 (53.7%) | 1,915 (46.3%) |
Production, Transportation and Moving Occupations
The most common Production, Transportation and Moving occupations in Traill County are Production (226 | 5.5%), Transportation (161 | 3.9%), and Material Moving (104 | 2.5%).
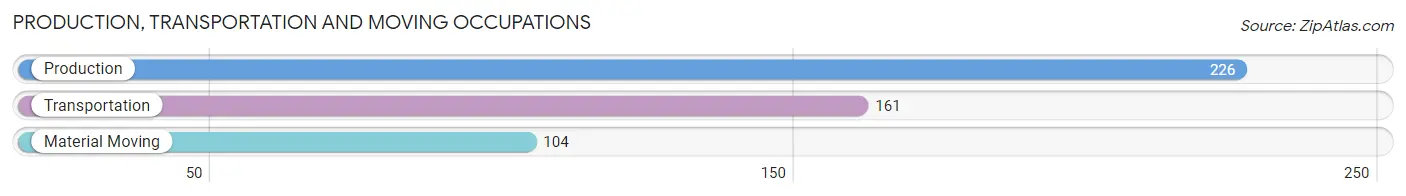
Production, Transportation and Moving Occupations by Sex
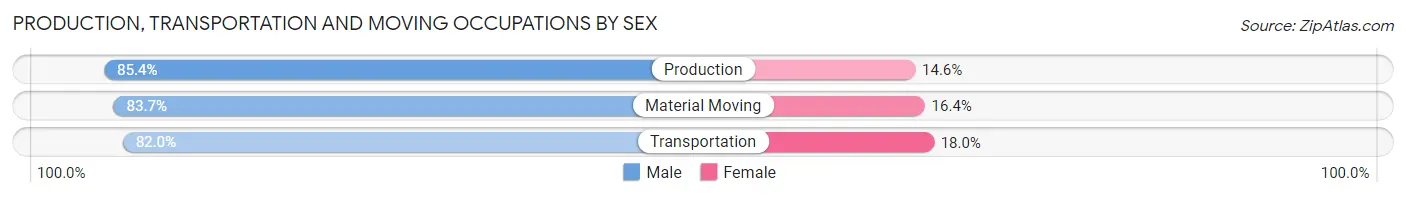
| Occupation | Male | Female |
| Production | 193 (85.4%) | 33 (14.6%) |
| Transportation | 132 (82.0%) | 29 (18.0%) |
| Material Moving | 87 (83.7%) | 17 (16.4%) |
| Total (Category) | 412 (83.9%) | 79 (16.1%) |
| Total (Overall) | 2,220 (53.7%) | 1,915 (46.3%) |
Employment Industries by Sex in Traill County
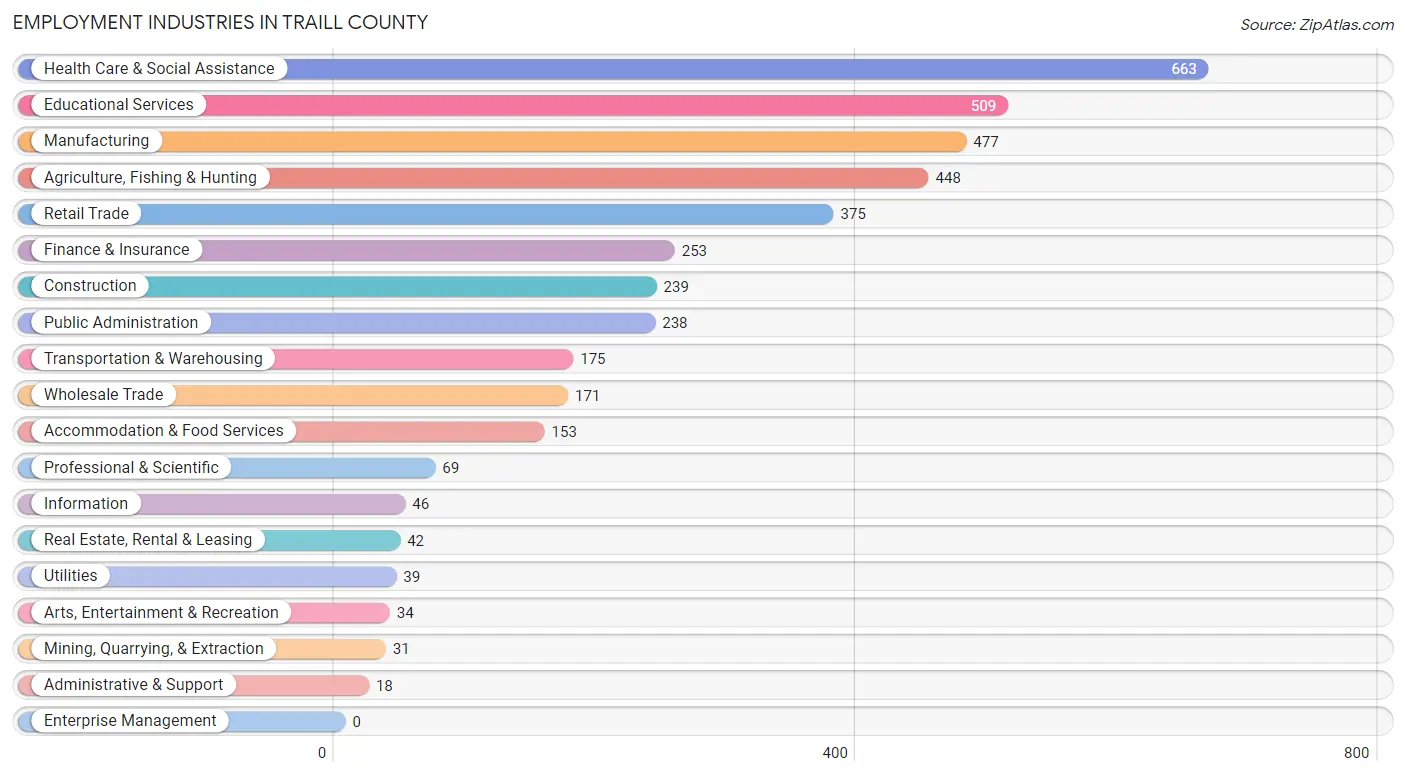
Employment Industries in Traill County
The major employment industries in Traill County include Health Care & Social Assistance (663 | 16.0%), Educational Services (509 | 12.3%), Manufacturing (477 | 11.5%), Agriculture, Fishing & Hunting (448 | 10.8%), and Retail Trade (375 | 9.1%).
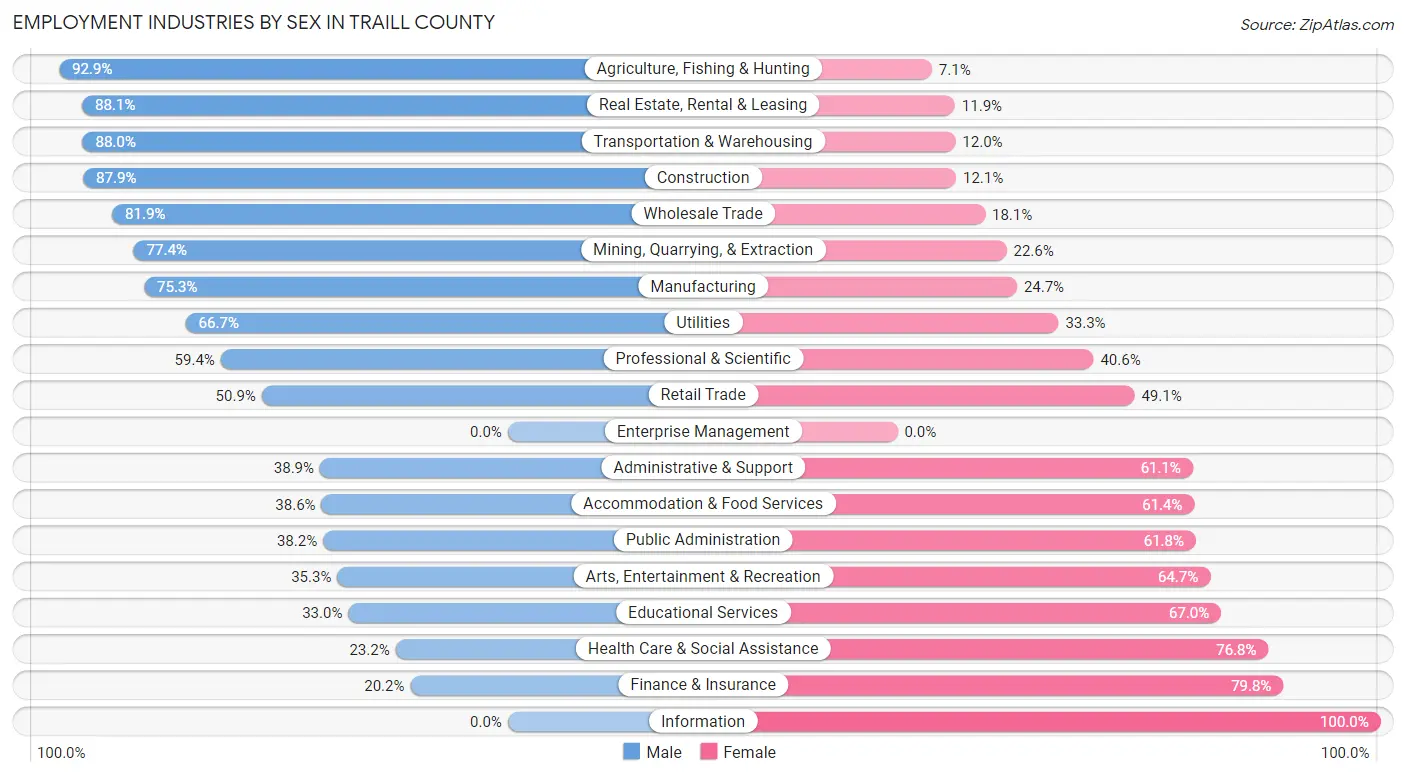
Employment Industries by Sex in Traill County
The Traill County industries that see more men than women are Agriculture, Fishing & Hunting (92.9%), Real Estate, Rental & Leasing (88.1%), and Transportation & Warehousing (88.0%), whereas the industries that tend to have a higher number of women are Information (100.0%), Finance & Insurance (79.8%), and Health Care & Social Assistance (76.8%).
| Industry | Male | Female |
| Agriculture, Fishing & Hunting | 416 (92.9%) | 32 (7.1%) |
| Mining, Quarrying, & Extraction | 24 (77.4%) | 7 (22.6%) |
| Construction | 210 (87.9%) | 29 (12.1%) |
| Manufacturing | 359 (75.3%) | 118 (24.7%) |
| Wholesale Trade | 140 (81.9%) | 31 (18.1%) |
| Retail Trade | 191 (50.9%) | 184 (49.1%) |
| Transportation & Warehousing | 154 (88.0%) | 21 (12.0%) |
| Utilities | 26 (66.7%) | 13 (33.3%) |
| Information | 0 (0.0%) | 46 (100.0%) |
| Finance & Insurance | 51 (20.2%) | 202 (79.8%) |
| Real Estate, Rental & Leasing | 37 (88.1%) | 5 (11.9%) |
| Professional & Scientific | 41 (59.4%) | 28 (40.6%) |
| Enterprise Management | 0 (0.0%) | 0 (0.0%) |
| Administrative & Support | 7 (38.9%) | 11 (61.1%) |
| Educational Services | 168 (33.0%) | 341 (67.0%) |
| Health Care & Social Assistance | 154 (23.2%) | 509 (76.8%) |
| Arts, Entertainment & Recreation | 12 (35.3%) | 22 (64.7%) |
| Accommodation & Food Services | 59 (38.6%) | 94 (61.4%) |
| Public Administration | 91 (38.2%) | 147 (61.8%) |
| Total | 2,220 (53.7%) | 1,915 (46.3%) |
Education in Traill County
School Enrollment in Traill County
The most common levels of schooling among the 1,924 students in Traill County are college / undergraduate (471 | 24.5%), middle school (422 | 21.9%), and elementary school (369 | 19.2%).
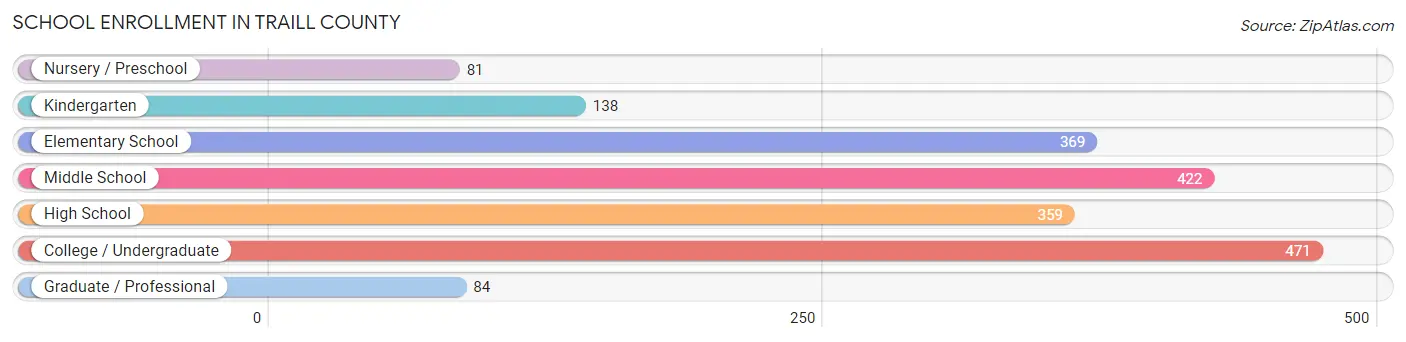
| School Level | # Students | % Students |
| Nursery / Preschool | 81 | 4.2% |
| Kindergarten | 138 | 7.2% |
| Elementary School | 369 | 19.2% |
| Middle School | 422 | 21.9% |
| High School | 359 | 18.7% |
| College / Undergraduate | 471 | 24.5% |
| Graduate / Professional | 84 | 4.4% |
| Total | 1,924 | 100.0% |
School Enrollment by Age by Funding Source in Traill County
Out of a total of 1,924 students who are enrolled in schools in Traill County, 96 (5.0%) attend a private institution, while the remaining 1,828 (95.0%) are enrolled in public schools. The age group of 3 to 4 year olds has the highest likelihood of being enrolled in private schools, with 15 (22.4% in the age bracket) enrolled. Conversely, the age group of 15 to 17 year olds has the lowest likelihood of being enrolled in a private school, with 321 (100.0% in the age bracket) attending a public institution.
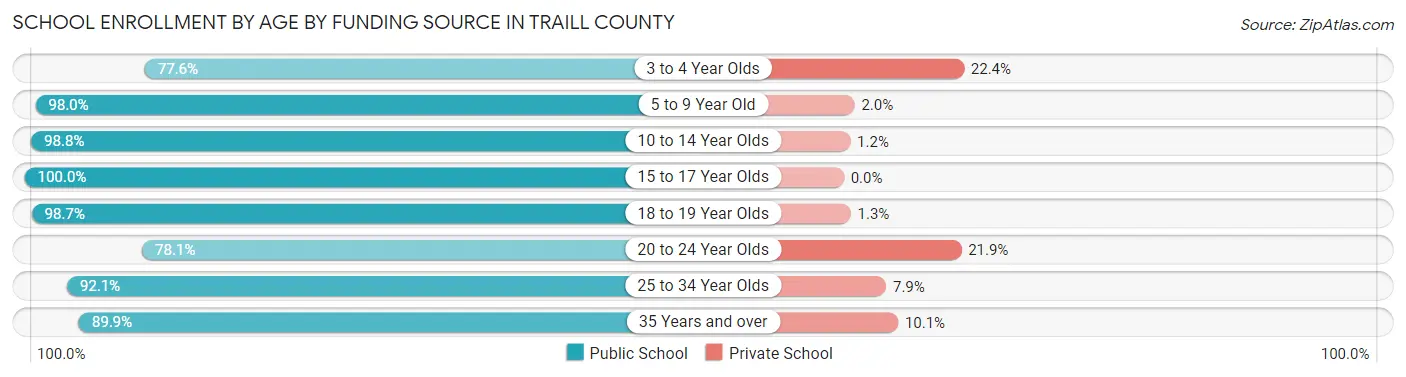
| Age Bracket | Public School | Private School |
| 3 to 4 Year Olds | 52 (77.6%) | 15 (22.4%) |
| 5 to 9 Year Old | 439 (98.0%) | 9 (2.0%) |
| 10 to 14 Year Olds | 489 (98.8%) | 6 (1.2%) |
| 15 to 17 Year Olds | 321 (100.0%) | 0 (0.0%) |
| 18 to 19 Year Olds | 230 (98.7%) | 3 (1.3%) |
| 20 to 24 Year Olds | 182 (78.1%) | 51 (21.9%) |
| 25 to 34 Year Olds | 35 (92.1%) | 3 (7.9%) |
| 35 Years and over | 80 (89.9%) | 9 (10.1%) |
| Total | 1,828 (95.0%) | 96 (5.0%) |
Educational Attainment by Field of Study in Traill County
Education (516 | 28.6%), business (329 | 18.2%), science & technology (281 | 15.6%), bio, nature & agricultural (240 | 13.3%), and arts & humanities (80 | 4.4%) are the most common fields of study among 1,805 individuals in Traill County who have obtained a bachelor's degree or higher.
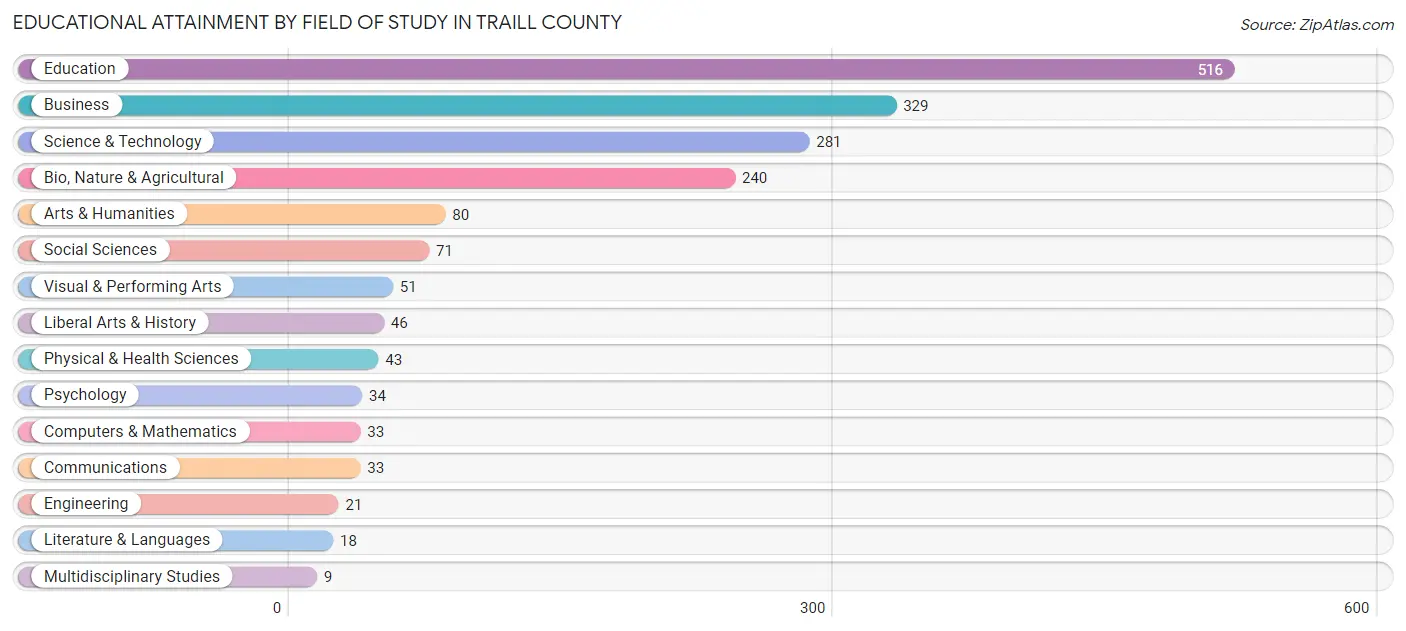
| Field of Study | # Graduates | % Graduates |
| Computers & Mathematics | 33 | 1.8% |
| Bio, Nature & Agricultural | 240 | 13.3% |
| Physical & Health Sciences | 43 | 2.4% |
| Psychology | 34 | 1.9% |
| Social Sciences | 71 | 3.9% |
| Engineering | 21 | 1.2% |
| Multidisciplinary Studies | 9 | 0.5% |
| Science & Technology | 281 | 15.6% |
| Business | 329 | 18.2% |
| Education | 516 | 28.6% |
| Literature & Languages | 18 | 1.0% |
| Liberal Arts & History | 46 | 2.5% |
| Visual & Performing Arts | 51 | 2.8% |
| Communications | 33 | 1.8% |
| Arts & Humanities | 80 | 4.4% |
| Total | 1,805 | 100.0% |
Transportation & Commute in Traill County
Vehicle Availability by Sex in Traill County
The most prevalent vehicle ownership categories in Traill County are males with 2 vehicles (890, accounting for 42.1%) and females with 2 vehicles (753, making up 48.4%).
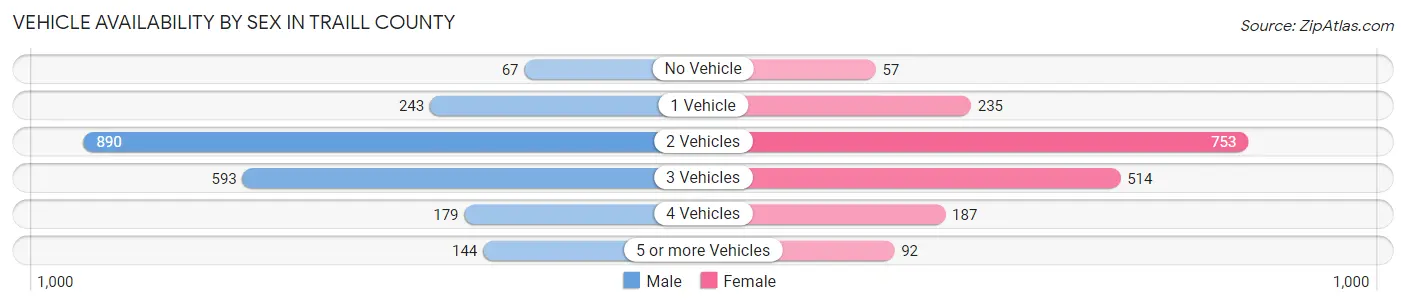
| Vehicles Available | Male | Female |
| No Vehicle | 67 (3.2%) | 57 (3.1%) |
| 1 Vehicle | 243 (11.5%) | 235 (12.8%) |
| 2 Vehicles | 890 (42.1%) | 753 (41.0%) |
| 3 Vehicles | 593 (28.0%) | 514 (28.0%) |
| 4 Vehicles | 179 (8.5%) | 187 (10.2%) |
| 5 or more Vehicles | 144 (6.8%) | 92 (5.0%) |
| Total | 2,116 (100.0%) | 1,838 (100.0%) |
Commute Time in Traill County
The most frequently occuring commute durations in Traill County are 5 to 9 minutes (888 commuters, 22.9%), less than 5 minutes (710 commuters, 18.3%), and 20 to 24 minutes (440 commuters, 11.3%).
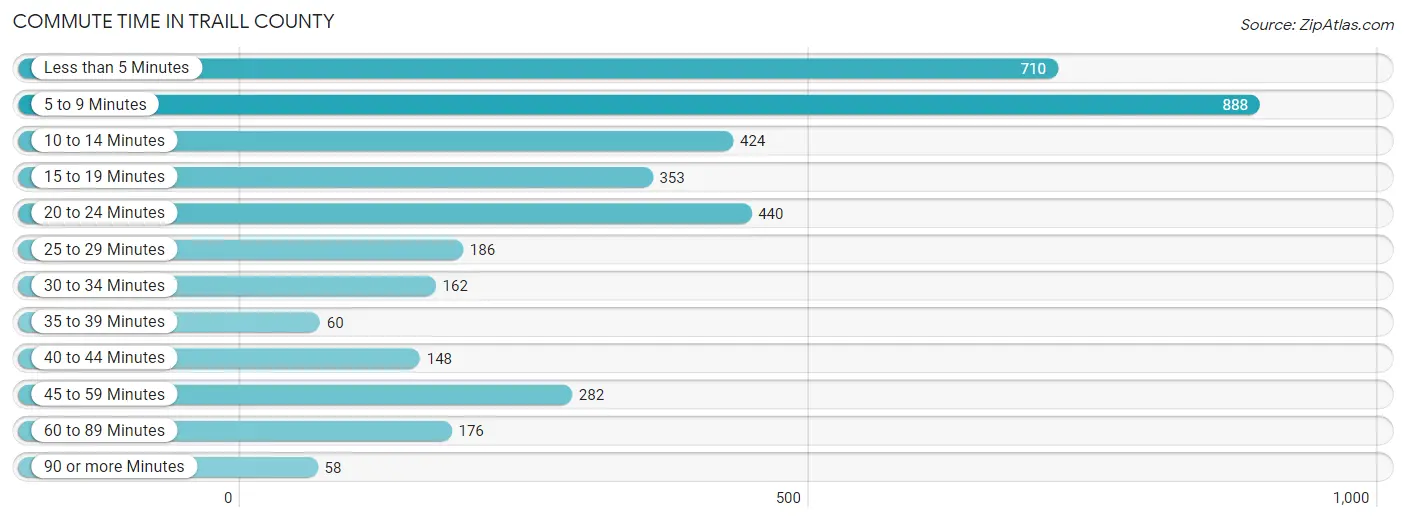
| Commute Time | # Commuters | % Commuters |
| Less than 5 Minutes | 710 | 18.3% |
| 5 to 9 Minutes | 888 | 22.9% |
| 10 to 14 Minutes | 424 | 10.9% |
| 15 to 19 Minutes | 353 | 9.1% |
| 20 to 24 Minutes | 440 | 11.3% |
| 25 to 29 Minutes | 186 | 4.8% |
| 30 to 34 Minutes | 162 | 4.2% |
| 35 to 39 Minutes | 60 | 1.5% |
| 40 to 44 Minutes | 148 | 3.8% |
| 45 to 59 Minutes | 282 | 7.2% |
| 60 to 89 Minutes | 176 | 4.5% |
| 90 or more Minutes | 58 | 1.5% |
Commute Time by Sex in Traill County
The most common commute times in Traill County are 5 to 9 minutes (496 commuters, 23.4%) for males and less than 5 minutes (399 commuters, 22.5%) for females.
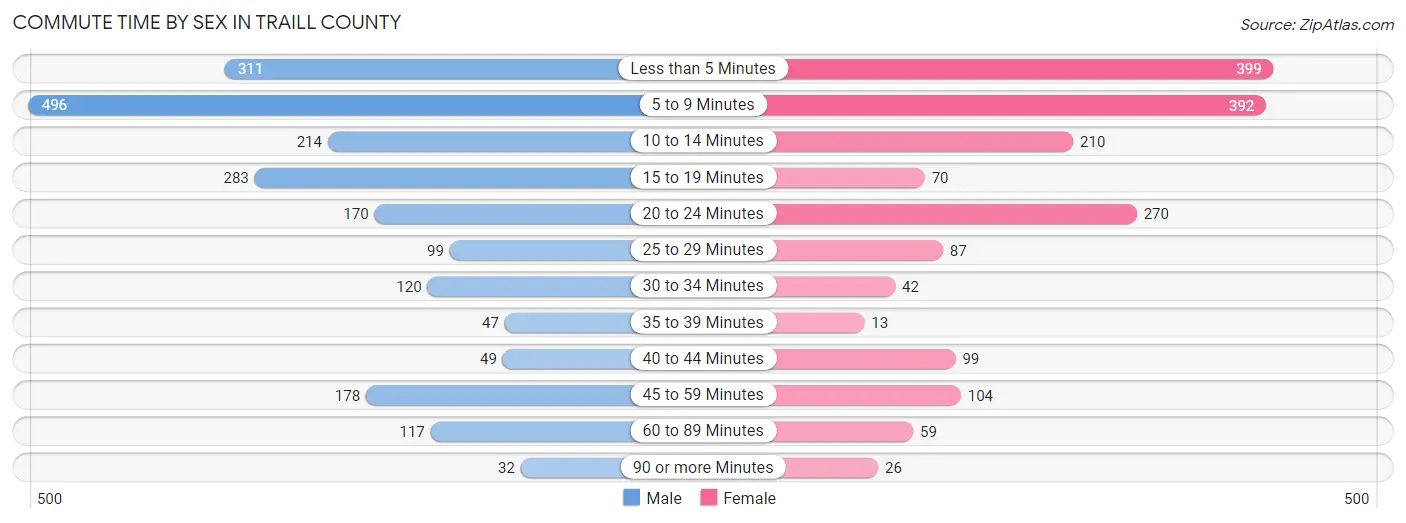
| Commute Time | Male | Female |
| Less than 5 Minutes | 311 (14.7%) | 399 (22.5%) |
| 5 to 9 Minutes | 496 (23.4%) | 392 (22.1%) |
| 10 to 14 Minutes | 214 (10.1%) | 210 (11.9%) |
| 15 to 19 Minutes | 283 (13.4%) | 70 (4.0%) |
| 20 to 24 Minutes | 170 (8.0%) | 270 (15.2%) |
| 25 to 29 Minutes | 99 (4.7%) | 87 (4.9%) |
| 30 to 34 Minutes | 120 (5.7%) | 42 (2.4%) |
| 35 to 39 Minutes | 47 (2.2%) | 13 (0.7%) |
| 40 to 44 Minutes | 49 (2.3%) | 99 (5.6%) |
| 45 to 59 Minutes | 178 (8.4%) | 104 (5.9%) |
| 60 to 89 Minutes | 117 (5.5%) | 59 (3.3%) |
| 90 or more Minutes | 32 (1.5%) | 26 (1.5%) |
Time of Departure to Work by Sex in Traill County
The most frequent times of departure to work in Traill County are 6:30 AM to 6:59 AM (347, 16.4%) for males and 7:30 AM to 7:59 AM (618, 34.9%) for females.
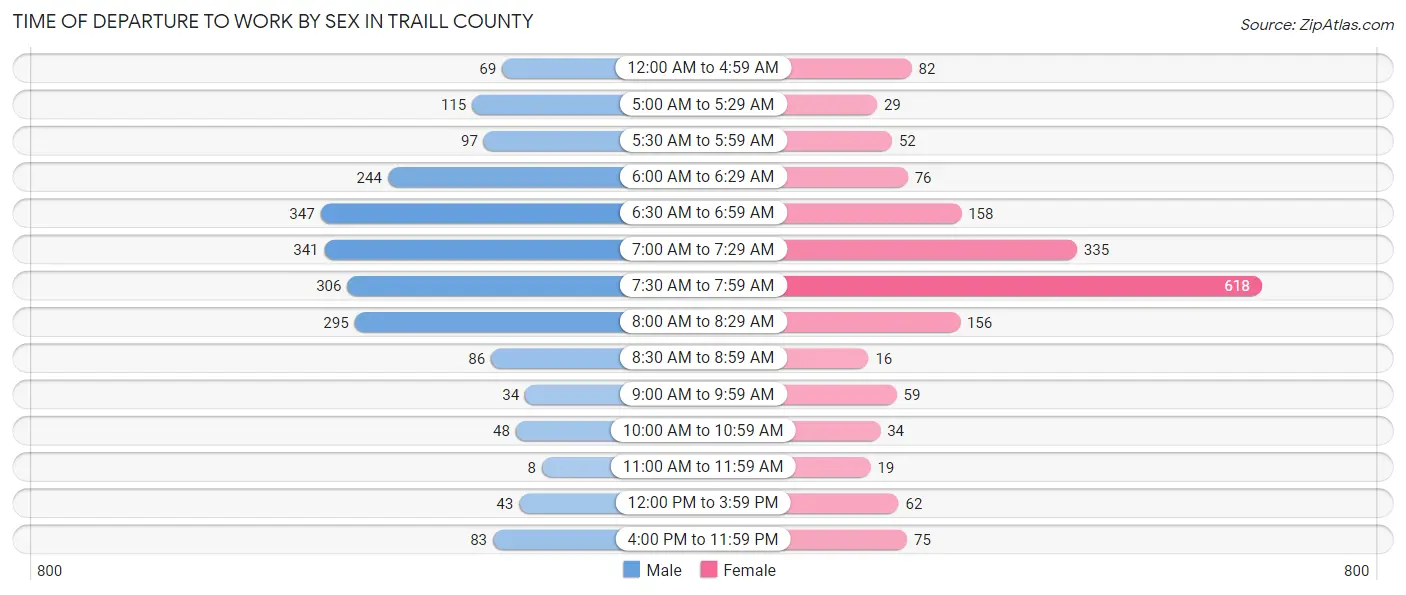
| Time of Departure | Male | Female |
| 12:00 AM to 4:59 AM | 69 (3.3%) | 82 (4.6%) |
| 5:00 AM to 5:29 AM | 115 (5.4%) | 29 (1.6%) |
| 5:30 AM to 5:59 AM | 97 (4.6%) | 52 (2.9%) |
| 6:00 AM to 6:29 AM | 244 (11.5%) | 76 (4.3%) |
| 6:30 AM to 6:59 AM | 347 (16.4%) | 158 (8.9%) |
| 7:00 AM to 7:29 AM | 341 (16.1%) | 335 (18.9%) |
| 7:30 AM to 7:59 AM | 306 (14.5%) | 618 (34.9%) |
| 8:00 AM to 8:29 AM | 295 (13.9%) | 156 (8.8%) |
| 8:30 AM to 8:59 AM | 86 (4.1%) | 16 (0.9%) |
| 9:00 AM to 9:59 AM | 34 (1.6%) | 59 (3.3%) |
| 10:00 AM to 10:59 AM | 48 (2.3%) | 34 (1.9%) |
| 11:00 AM to 11:59 AM | 8 (0.4%) | 19 (1.1%) |
| 12:00 PM to 3:59 PM | 43 (2.0%) | 62 (3.5%) |
| 4:00 PM to 11:59 PM | 83 (3.9%) | 75 (4.2%) |
| Total | 2,116 (100.0%) | 1,771 (100.0%) |
Housing Occupancy in Traill County
Occupancy by Ownership in Traill County
Of the total 3,285 dwellings in Traill County, owner-occupied units account for 2,399 (73.0%), while renter-occupied units make up 886 (27.0%).
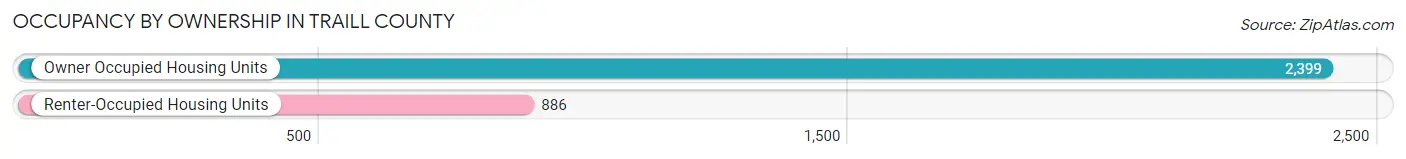
| Occupancy | # Housing Units | % Housing Units |
| Owner Occupied Housing Units | 2,399 | 73.0% |
| Renter-Occupied Housing Units | 886 | 27.0% |
| Total Occupied Housing Units | 3,285 | 100.0% |
Occupancy by Household Size in Traill County
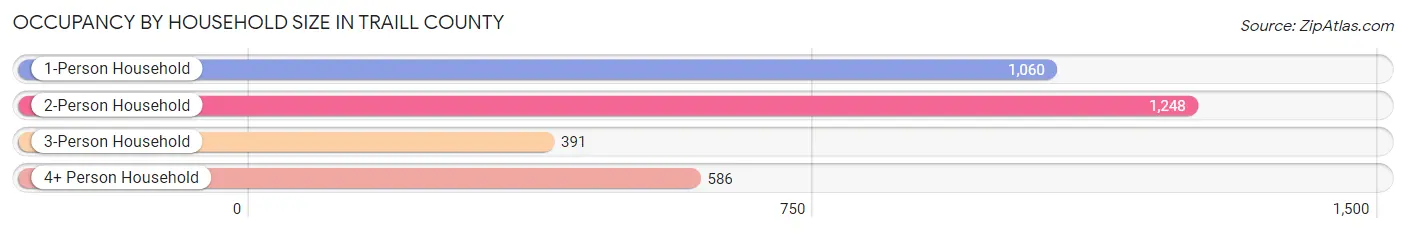
| Household Size | # Housing Units | % Housing Units |
| 1-Person Household | 1,060 | 32.3% |
| 2-Person Household | 1,248 | 38.0% |
| 3-Person Household | 391 | 11.9% |
| 4+ Person Household | 586 | 17.8% |
| Total Housing Units | 3,285 | 100.0% |
Occupancy by Ownership by Household Size in Traill County
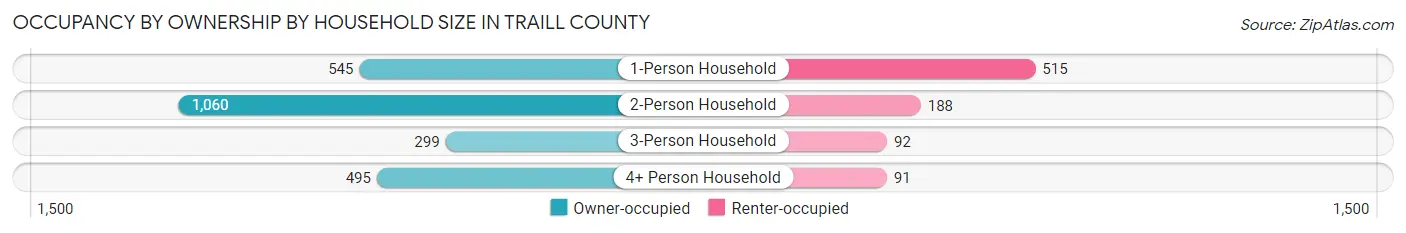
| Household Size | Owner-occupied | Renter-occupied |
| 1-Person Household | 545 (51.4%) | 515 (48.6%) |
| 2-Person Household | 1,060 (84.9%) | 188 (15.1%) |
| 3-Person Household | 299 (76.5%) | 92 (23.5%) |
| 4+ Person Household | 495 (84.5%) | 91 (15.5%) |
| Total Housing Units | 2,399 (73.0%) | 886 (27.0%) |
Occupancy by Educational Attainment in Traill County
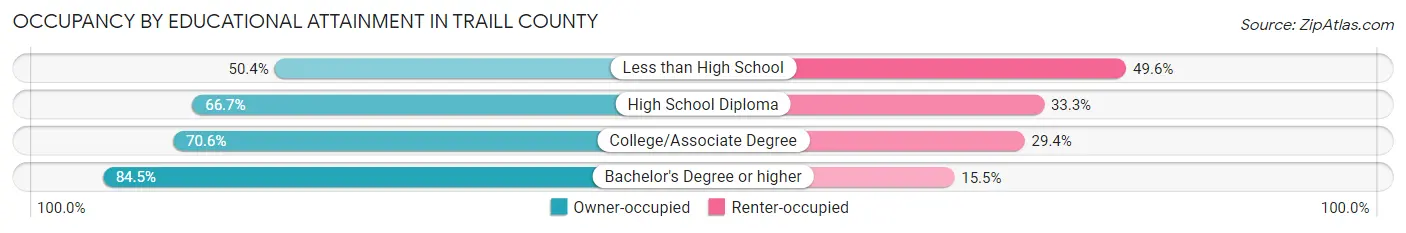
| Household Size | Owner-occupied | Renter-occupied |
| Less than High School | 57 (50.4%) | 56 (49.6%) |
| High School Diploma | 578 (66.7%) | 288 (33.3%) |
| College/Associate Degree | 935 (70.6%) | 390 (29.4%) |
| Bachelor's Degree or higher | 829 (84.5%) | 152 (15.5%) |
Occupancy by Age of Householder in Traill County
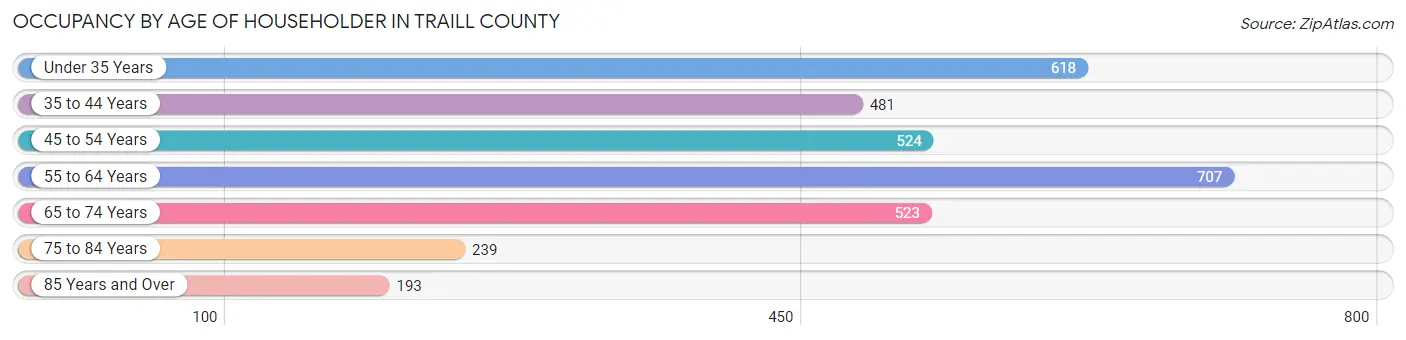
| Age Bracket | # Households | % Households |
| Under 35 Years | 618 | 18.8% |
| 35 to 44 Years | 481 | 14.6% |
| 45 to 54 Years | 524 | 16.0% |
| 55 to 64 Years | 707 | 21.5% |
| 65 to 74 Years | 523 | 15.9% |
| 75 to 84 Years | 239 | 7.3% |
| 85 Years and Over | 193 | 5.9% |
| Total | 3,285 | 100.0% |
Housing Finances in Traill County
Median Income by Occupancy in Traill County
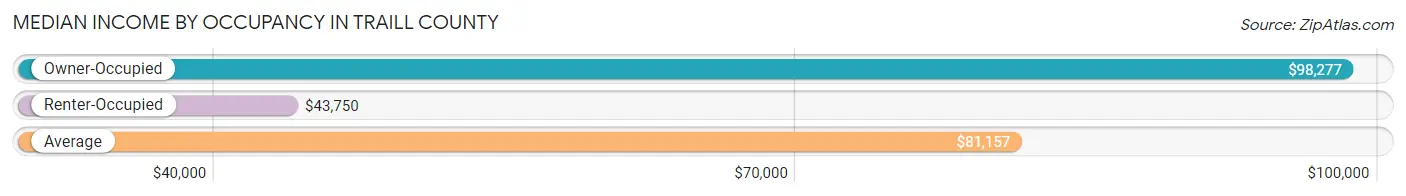
| Occupancy Type | # Households | Median Income |
| Owner-Occupied | 2,399 (73.0%) | $98,277 |
| Renter-Occupied | 886 (27.0%) | $43,750 |
| Average | 3,285 (100.0%) | $81,157 |
Occupancy by Householder Income Bracket in Traill County
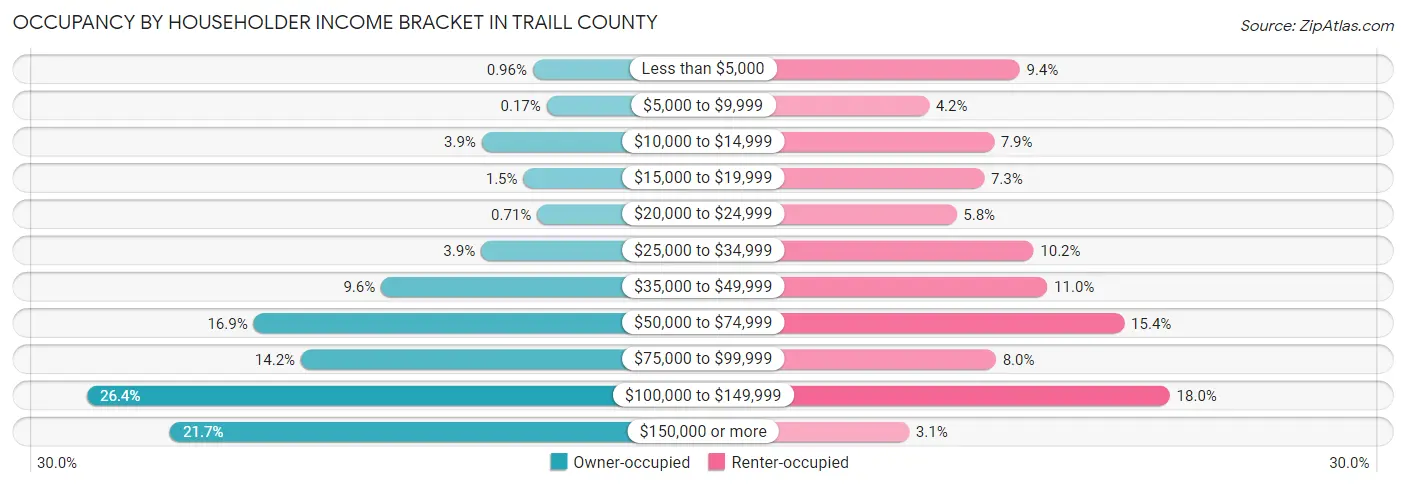
| Income Bracket | Owner-occupied | Renter-occupied |
| Less than $5,000 | 23 (1.0%) | 83 (9.4%) |
| $5,000 to $9,999 | 4 (0.2%) | 37 (4.2%) |
| $10,000 to $14,999 | 93 (3.9%) | 70 (7.9%) |
| $15,000 to $19,999 | 36 (1.5%) | 65 (7.3%) |
| $20,000 to $24,999 | 17 (0.7%) | 51 (5.8%) |
| $25,000 to $34,999 | 94 (3.9%) | 90 (10.2%) |
| $35,000 to $49,999 | 231 (9.6%) | 97 (11.0%) |
| $50,000 to $74,999 | 406 (16.9%) | 136 (15.3%) |
| $75,000 to $99,999 | 341 (14.2%) | 71 (8.0%) |
| $100,000 to $149,999 | 634 (26.4%) | 159 (17.9%) |
| $150,000 or more | 520 (21.7%) | 27 (3.0%) |
| Total | 2,399 (100.0%) | 886 (100.0%) |
Monthly Housing Cost Tiers in Traill County
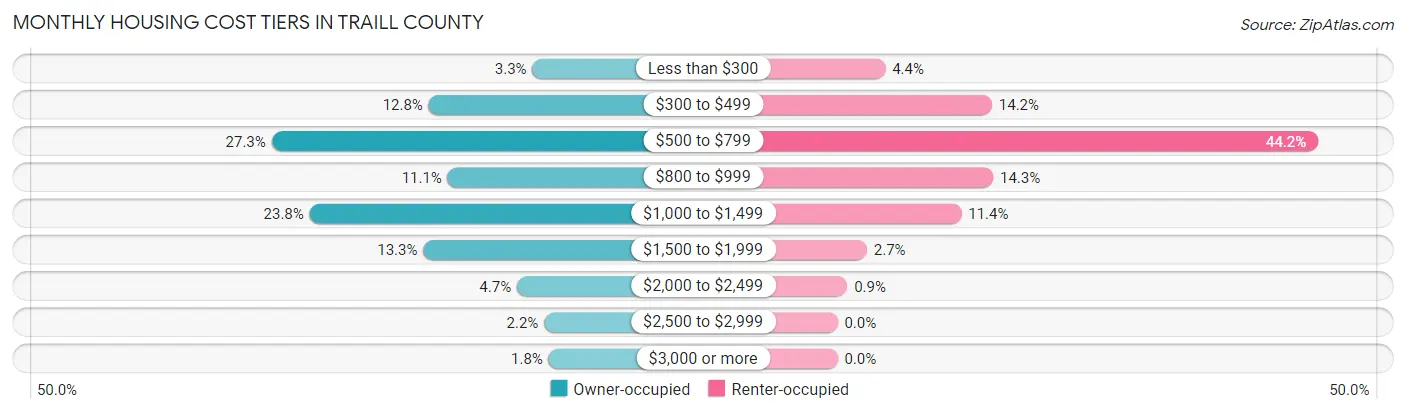
| Monthly Cost | Owner-occupied | Renter-occupied |
| Less than $300 | 78 (3.3%) | 39 (4.4%) |
| $300 to $499 | 307 (12.8%) | 126 (14.2%) |
| $500 to $799 | 654 (27.3%) | 392 (44.2%) |
| $800 to $999 | 265 (11.1%) | 127 (14.3%) |
| $1,000 to $1,499 | 570 (23.8%) | 101 (11.4%) |
| $1,500 to $1,999 | 319 (13.3%) | 24 (2.7%) |
| $2,000 to $2,499 | 112 (4.7%) | 8 (0.9%) |
| $2,500 to $2,999 | 52 (2.2%) | 0 (0.0%) |
| $3,000 or more | 42 (1.8%) | 0 (0.0%) |
| Total | 2,399 (100.0%) | 886 (100.0%) |
Physical Housing Characteristics in Traill County
Housing Structures in Traill County
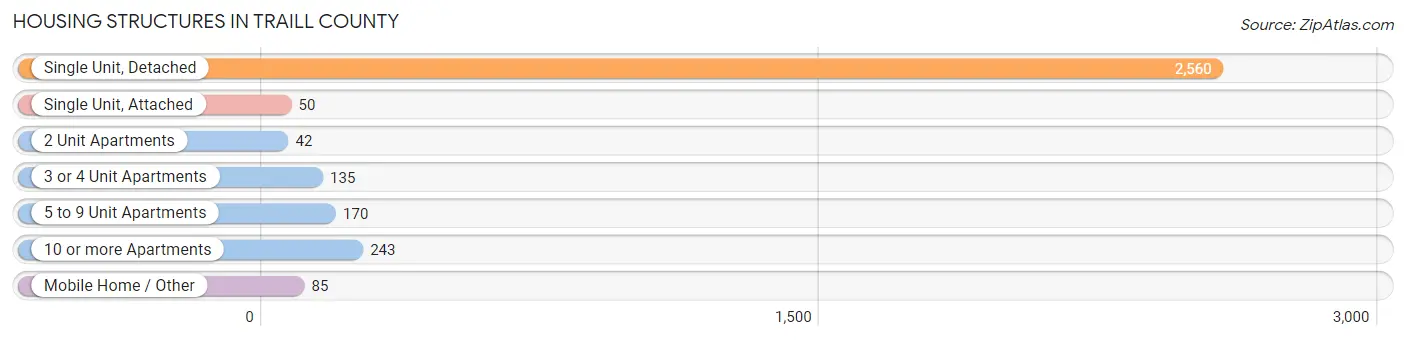
| Structure Type | # Housing Units | % Housing Units |
| Single Unit, Detached | 2,560 | 77.9% |
| Single Unit, Attached | 50 | 1.5% |
| 2 Unit Apartments | 42 | 1.3% |
| 3 or 4 Unit Apartments | 135 | 4.1% |
| 5 to 9 Unit Apartments | 170 | 5.2% |
| 10 or more Apartments | 243 | 7.4% |
| Mobile Home / Other | 85 | 2.6% |
| Total | 3,285 | 100.0% |
Housing Structures by Occupancy in Traill County
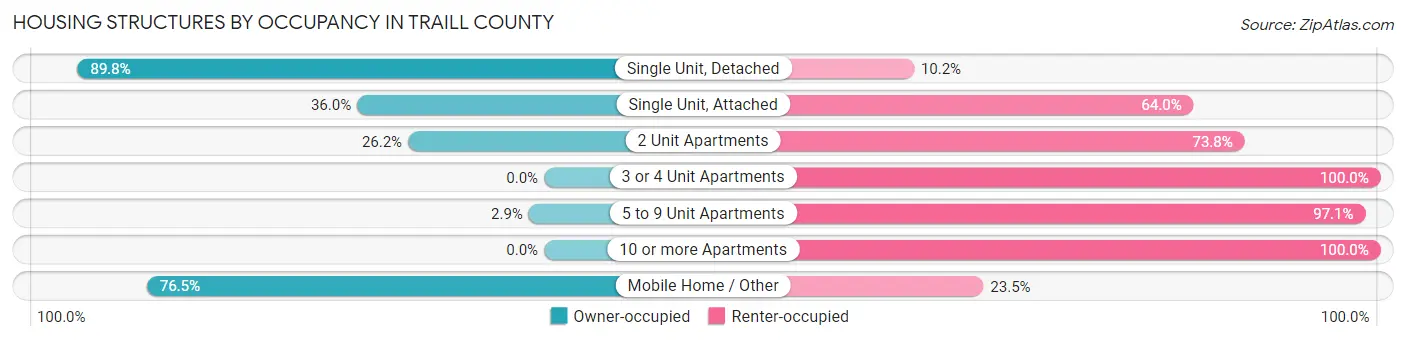
| Structure Type | Owner-occupied | Renter-occupied |
| Single Unit, Detached | 2,300 (89.8%) | 260 (10.2%) |
| Single Unit, Attached | 18 (36.0%) | 32 (64.0%) |
| 2 Unit Apartments | 11 (26.2%) | 31 (73.8%) |
| 3 or 4 Unit Apartments | 0 (0.0%) | 135 (100.0%) |
| 5 to 9 Unit Apartments | 5 (2.9%) | 165 (97.1%) |
| 10 or more Apartments | 0 (0.0%) | 243 (100.0%) |
| Mobile Home / Other | 65 (76.5%) | 20 (23.5%) |
| Total | 2,399 (73.0%) | 886 (27.0%) |
Housing Structures by Number of Rooms in Traill County
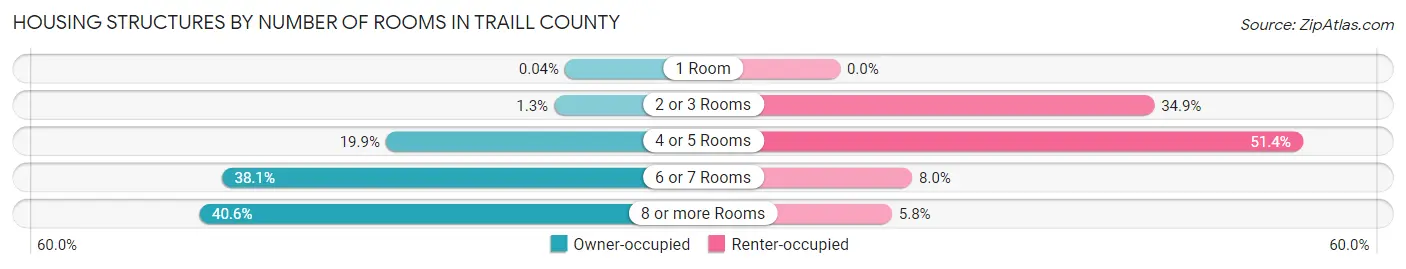
| Number of Rooms | Owner-occupied | Renter-occupied |
| 1 Room | 1 (0.0%) | 0 (0.0%) |
| 2 or 3 Rooms | 30 (1.3%) | 309 (34.9%) |
| 4 or 5 Rooms | 478 (19.9%) | 455 (51.3%) |
| 6 or 7 Rooms | 915 (38.1%) | 71 (8.0%) |
| 8 or more Rooms | 975 (40.6%) | 51 (5.8%) |
| Total | 2,399 (100.0%) | 886 (100.0%) |
Housing Structure by Heating Type in Traill County
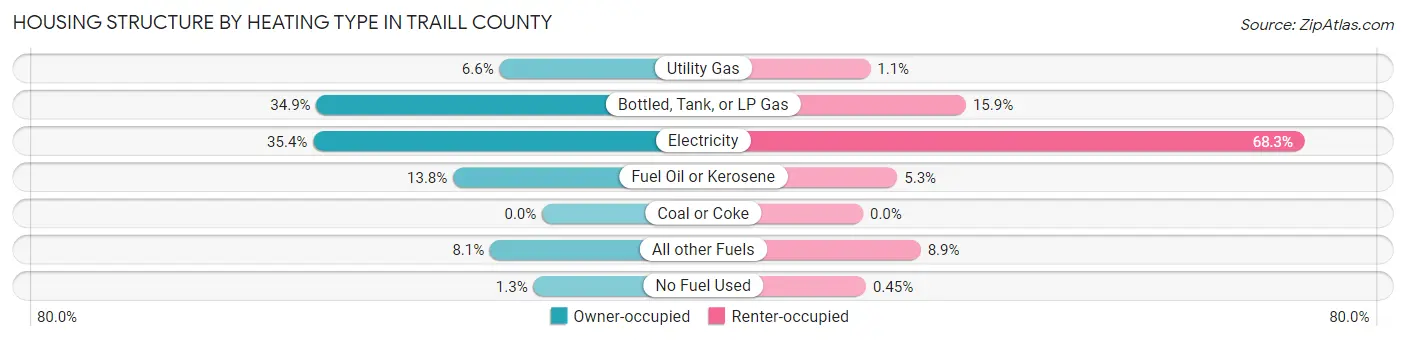
| Heating Type | Owner-occupied | Renter-occupied |
| Utility Gas | 158 (6.6%) | 10 (1.1%) |
| Bottled, Tank, or LP Gas | 837 (34.9%) | 141 (15.9%) |
| Electricity | 849 (35.4%) | 605 (68.3%) |
| Fuel Oil or Kerosene | 330 (13.8%) | 47 (5.3%) |
| Coal or Coke | 0 (0.0%) | 0 (0.0%) |
| All other Fuels | 193 (8.1%) | 79 (8.9%) |
| No Fuel Used | 32 (1.3%) | 4 (0.4%) |
| Total | 2,399 (100.0%) | 886 (100.0%) |
Household Vehicle Usage in Traill County
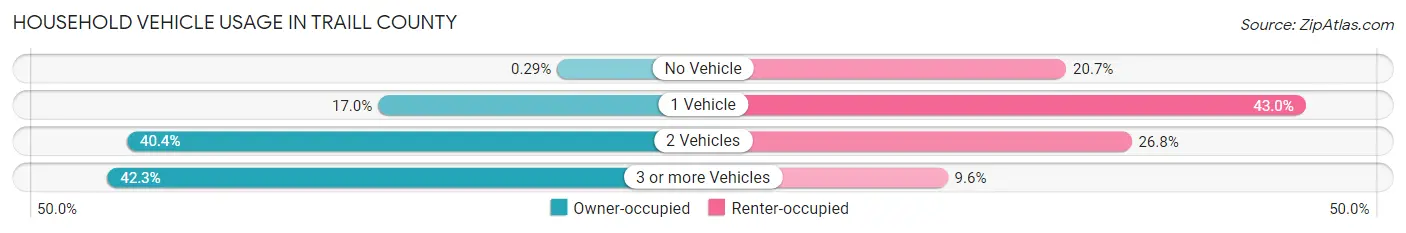
| Vehicles per Household | Owner-occupied | Renter-occupied |
| No Vehicle | 7 (0.3%) | 183 (20.6%) |
| 1 Vehicle | 408 (17.0%) | 381 (43.0%) |
| 2 Vehicles | 970 (40.4%) | 237 (26.8%) |
| 3 or more Vehicles | 1,014 (42.3%) | 85 (9.6%) |
| Total | 2,399 (100.0%) | 886 (100.0%) |
Real Estate & Mortgages in Traill County
Real Estate and Mortgage Overview in Traill County
| Characteristic | Without Mortgage | With Mortgage |
| Housing Units | 1,232 | 1,167 |
| Median Property Value | $173,200 | $172,400 |
| Median Household Income | $86,833 | $234 |
| Monthly Housing Costs | $594 | $42 |
| Real Estate Taxes | $1,740 | $16 |
Property Value by Mortgage Status in Traill County
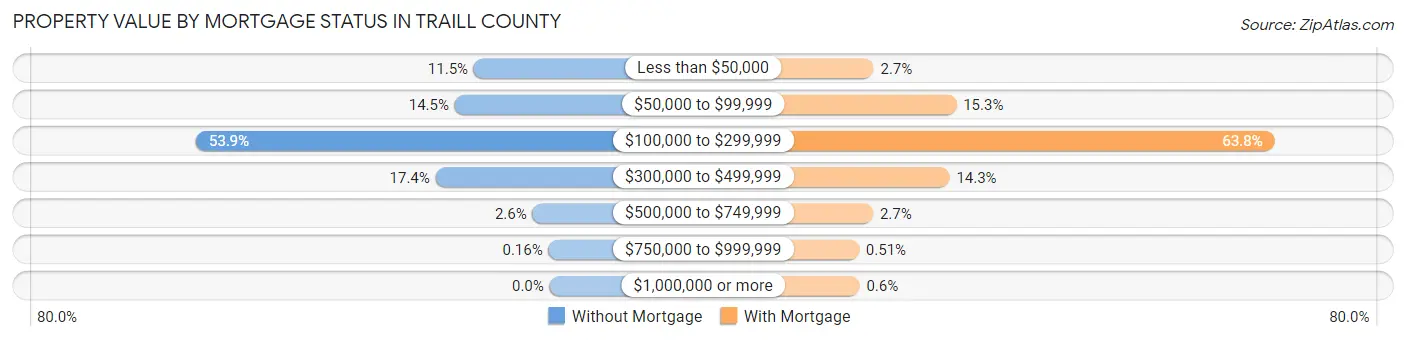
| Property Value | Without Mortgage | With Mortgage |
| Less than $50,000 | 142 (11.5%) | 32 (2.7%) |
| $50,000 to $99,999 | 178 (14.4%) | 179 (15.3%) |
| $100,000 to $299,999 | 664 (53.9%) | 745 (63.8%) |
| $300,000 to $499,999 | 214 (17.4%) | 167 (14.3%) |
| $500,000 to $749,999 | 32 (2.6%) | 31 (2.7%) |
| $750,000 to $999,999 | 2 (0.2%) | 6 (0.5%) |
| $1,000,000 or more | 0 (0.0%) | 7 (0.6%) |
| Total | 1,232 (100.0%) | 1,167 (100.0%) |
Household Income by Mortgage Status in Traill County
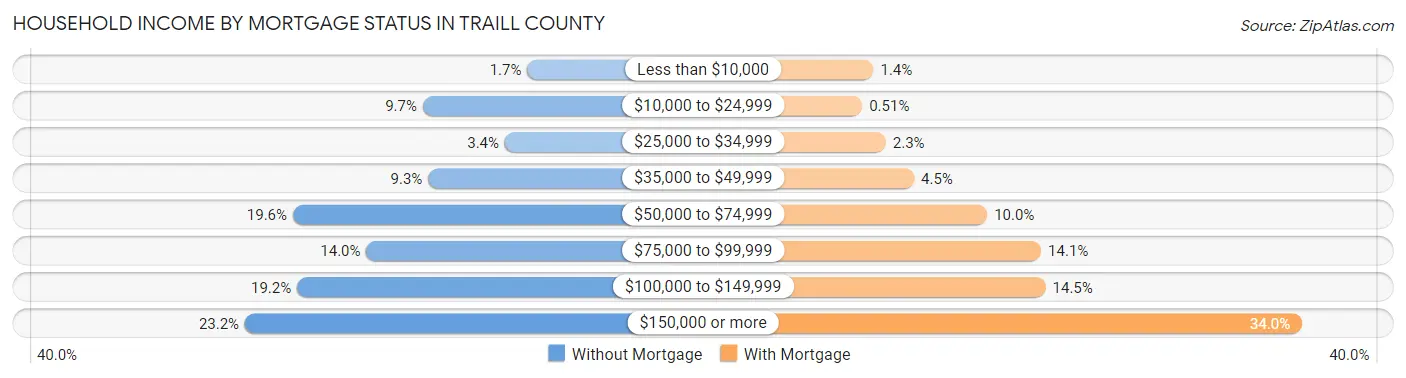
| Household Income | Without Mortgage | With Mortgage |
| Less than $10,000 | 21 (1.7%) | 16 (1.4%) |
| $10,000 to $24,999 | 119 (9.7%) | 6 (0.5%) |
| $25,000 to $34,999 | 42 (3.4%) | 27 (2.3%) |
| $35,000 to $49,999 | 114 (9.2%) | 52 (4.5%) |
| $50,000 to $74,999 | 241 (19.6%) | 117 (10.0%) |
| $75,000 to $99,999 | 172 (14.0%) | 165 (14.1%) |
| $100,000 to $149,999 | 237 (19.2%) | 169 (14.5%) |
| $150,000 or more | 286 (23.2%) | 397 (34.0%) |
| Total | 1,232 (100.0%) | 1,167 (100.0%) |
Property Value to Household Income Ratio in Traill County
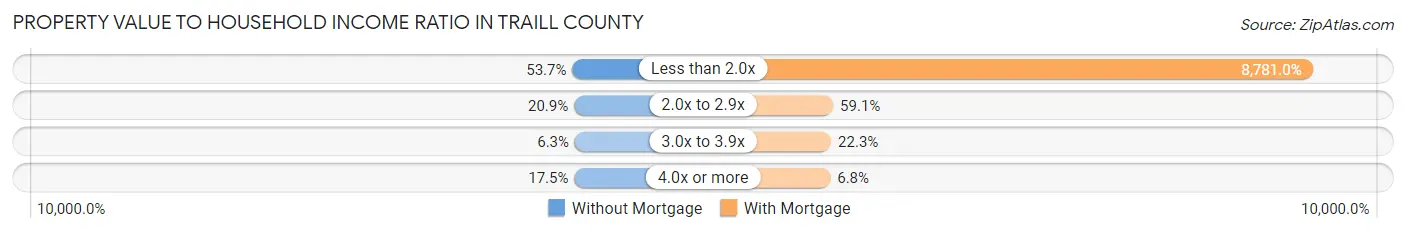
| Value-to-Income Ratio | Without Mortgage | With Mortgage |
| Less than 2.0x | 661 (53.6%) | 102,474 (8,781.0%) |
| 2.0x to 2.9x | 258 (20.9%) | 690 (59.1%) |
| 3.0x to 3.9x | 78 (6.3%) | 260 (22.3%) |
| 4.0x or more | 216 (17.5%) | 79 (6.8%) |
| Total | 1,232 (100.0%) | 1,167 (100.0%) |
Real Estate Taxes by Mortgage Status in Traill County
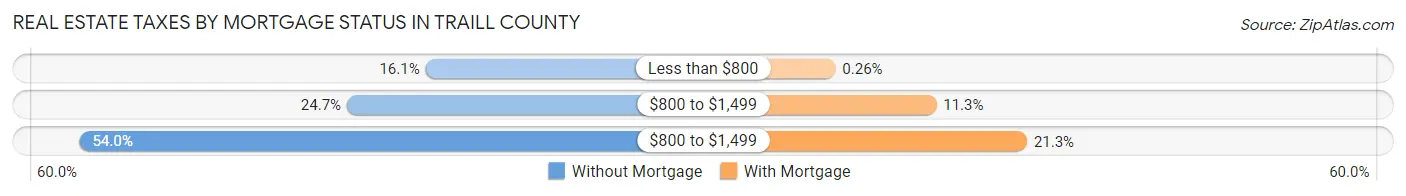
| Property Taxes | Without Mortgage | With Mortgage |
| Less than $800 | 198 (16.1%) | 3 (0.3%) |
| $800 to $1,499 | 304 (24.7%) | 132 (11.3%) |
| $800 to $1,499 | 665 (54.0%) | 248 (21.2%) |
| Total | 1,232 (100.0%) | 1,167 (100.0%) |
Health & Disability in Traill County
Health Insurance Coverage by Age in Traill County
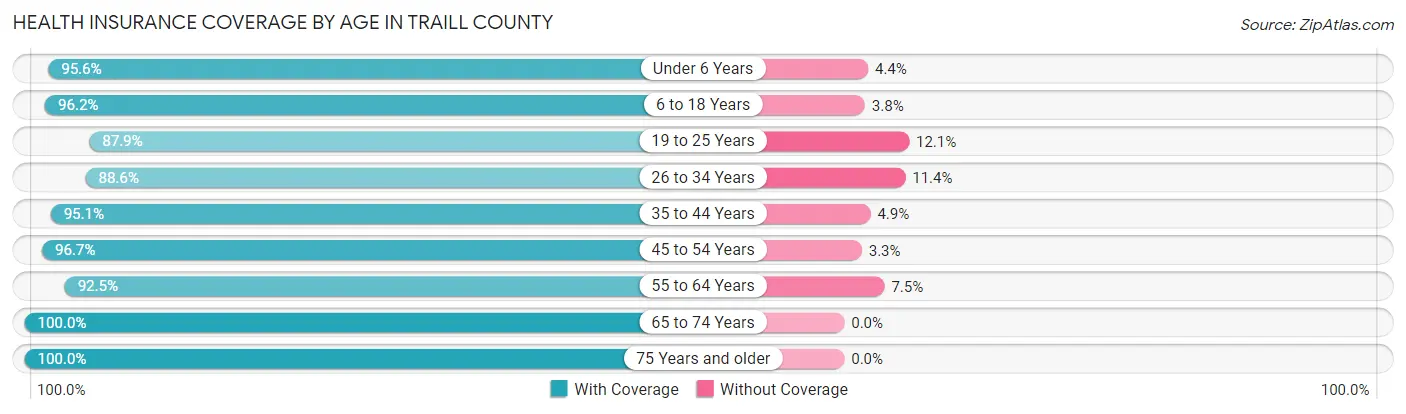
| Age Bracket | With Coverage | Without Coverage |
| Under 6 Years | 539 (95.6%) | 25 (4.4%) |
| 6 to 18 Years | 1,276 (96.2%) | 51 (3.8%) |
| 19 to 25 Years | 648 (87.9%) | 89 (12.1%) |
| 26 to 34 Years | 725 (88.6%) | 93 (11.4%) |
| 35 to 44 Years | 857 (95.1%) | 44 (4.9%) |
| 45 to 54 Years | 861 (96.7%) | 29 (3.3%) |
| 55 to 64 Years | 1,050 (92.5%) | 85 (7.5%) |
| 65 to 74 Years | 820 (100.0%) | 0 (0.0%) |
| 75 Years and older | 574 (100.0%) | 0 (0.0%) |
| Total | 7,350 (94.6%) | 416 (5.4%) |
Health Insurance Coverage by Citizenship Status in Traill County
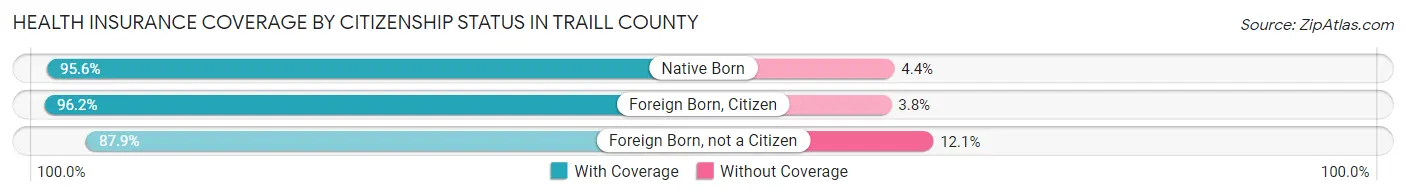
| Citizenship Status | With Coverage | Without Coverage |
| Native Born | 539 (95.6%) | 25 (4.4%) |
| Foreign Born, Citizen | 1,276 (96.2%) | 51 (3.8%) |
| Foreign Born, not a Citizen | 648 (87.9%) | 89 (12.1%) |
Health Insurance Coverage by Household Income in Traill County
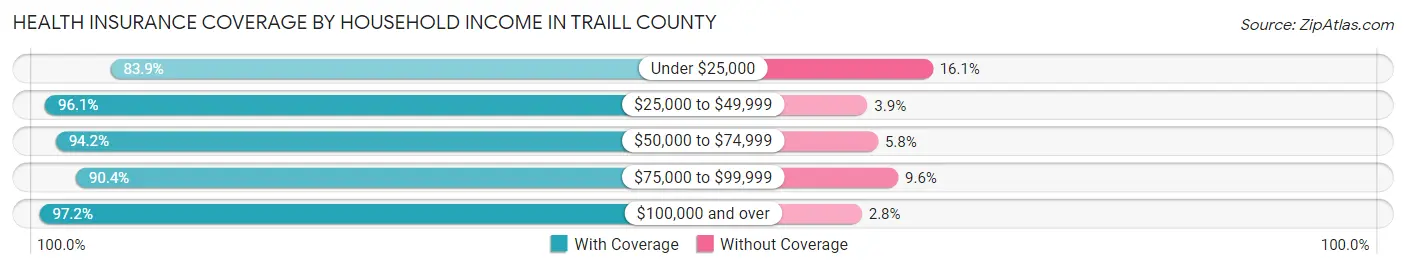
| Household Income | With Coverage | Without Coverage |
| Under $25,000 | 511 (83.9%) | 98 (16.1%) |
| $25,000 to $49,999 | 897 (96.1%) | 36 (3.9%) |
| $50,000 to $74,999 | 1,080 (94.2%) | 67 (5.8%) |
| $75,000 to $99,999 | 921 (90.4%) | 98 (9.6%) |
| $100,000 and over | 3,701 (97.2%) | 107 (2.8%) |
Public vs Private Health Insurance Coverage by Age in Traill County
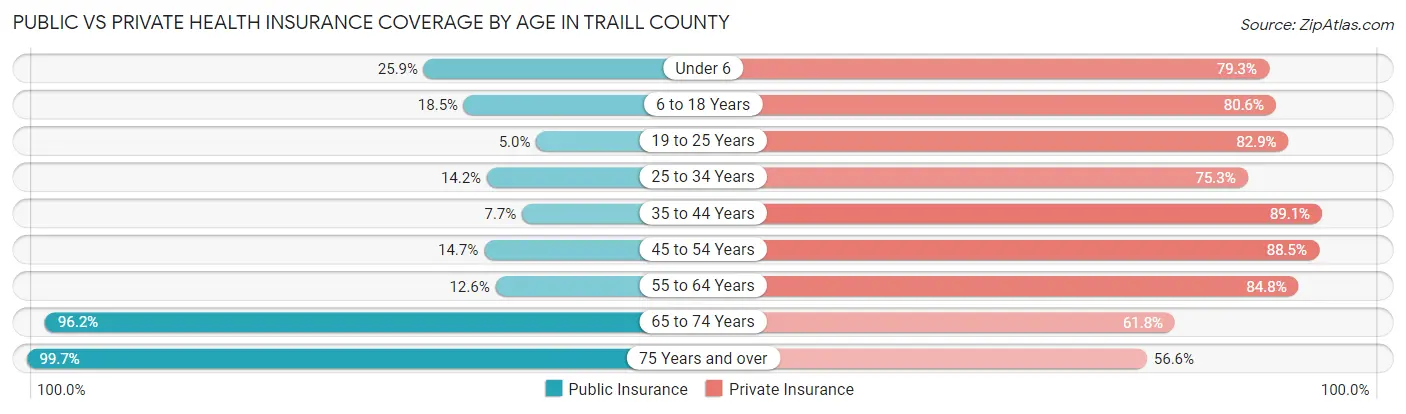
| Age Bracket | Public Insurance | Private Insurance |
| Under 6 | 146 (25.9%) | 447 (79.3%) |
| 6 to 18 Years | 245 (18.5%) | 1,069 (80.6%) |
| 19 to 25 Years | 37 (5.0%) | 611 (82.9%) |
| 25 to 34 Years | 116 (14.2%) | 616 (75.3%) |
| 35 to 44 Years | 69 (7.7%) | 803 (89.1%) |
| 45 to 54 Years | 131 (14.7%) | 788 (88.5%) |
| 55 to 64 Years | 143 (12.6%) | 962 (84.8%) |
| 65 to 74 Years | 789 (96.2%) | 507 (61.8%) |
| 75 Years and over | 572 (99.7%) | 325 (56.6%) |
| Total | 2,248 (28.9%) | 6,128 (78.9%) |
Disability Status by Sex by Age in Traill County
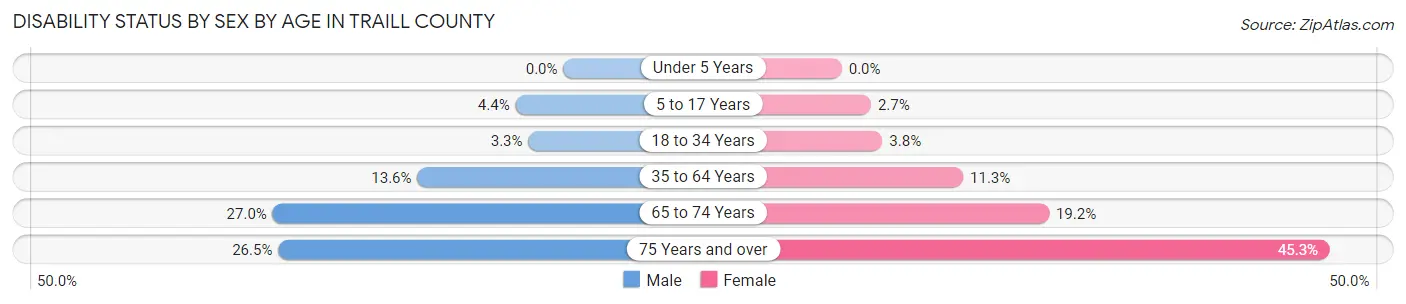
| Age Bracket | Male | Female |
| Under 5 Years | 0 (0.0%) | 0 (0.0%) |
| 5 to 17 Years | 30 (4.4%) | 17 (2.7%) |
| 18 to 34 Years | 29 (3.3%) | 29 (3.8%) |
| 35 to 64 Years | 204 (13.6%) | 160 (11.3%) |
| 65 to 74 Years | 116 (27.0%) | 75 (19.2%) |
| 75 Years and over | 59 (26.5%) | 159 (45.3%) |
Disability Class by Sex by Age in Traill County
Disability Class: Hearing Difficulty
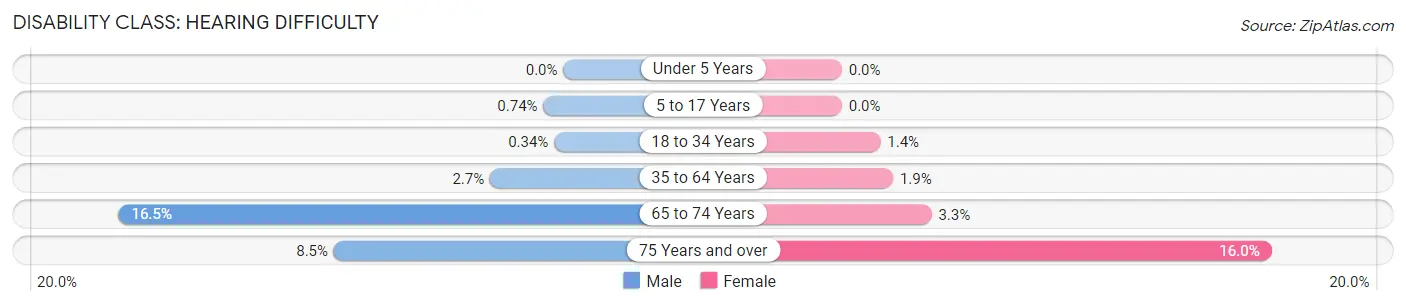
| Age Bracket | Male | Female |
| Under 5 Years | 0 (0.0%) | 0 (0.0%) |
| 5 to 17 Years | 5 (0.7%) | 0 (0.0%) |
| 18 to 34 Years | 3 (0.3%) | 11 (1.4%) |
| 35 to 64 Years | 41 (2.7%) | 27 (1.9%) |
| 65 to 74 Years | 71 (16.5%) | 13 (3.3%) |
| 75 Years and over | 19 (8.5%) | 56 (16.0%) |
Disability Class: Vision Difficulty
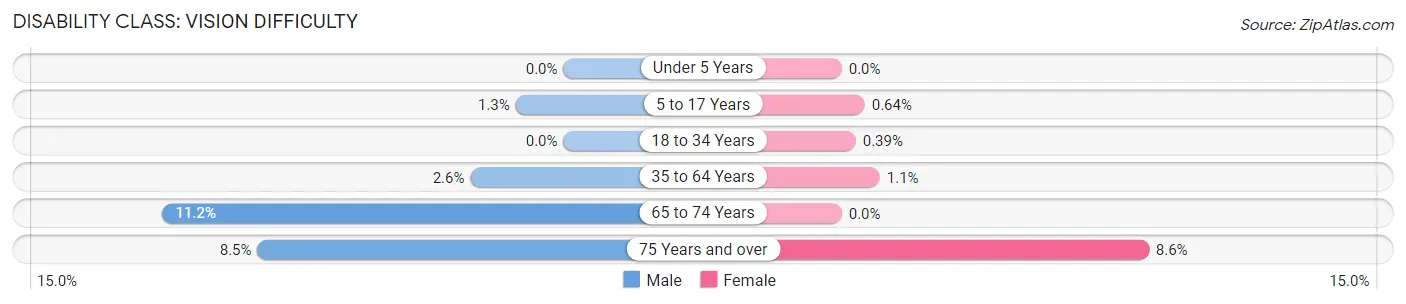
| Age Bracket | Male | Female |
| Under 5 Years | 0 (0.0%) | 0 (0.0%) |
| 5 to 17 Years | 9 (1.3%) | 4 (0.6%) |
| 18 to 34 Years | 0 (0.0%) | 3 (0.4%) |
| 35 to 64 Years | 39 (2.6%) | 15 (1.1%) |
| 65 to 74 Years | 48 (11.2%) | 0 (0.0%) |
| 75 Years and over | 19 (8.5%) | 30 (8.6%) |
Disability Class: Cognitive Difficulty
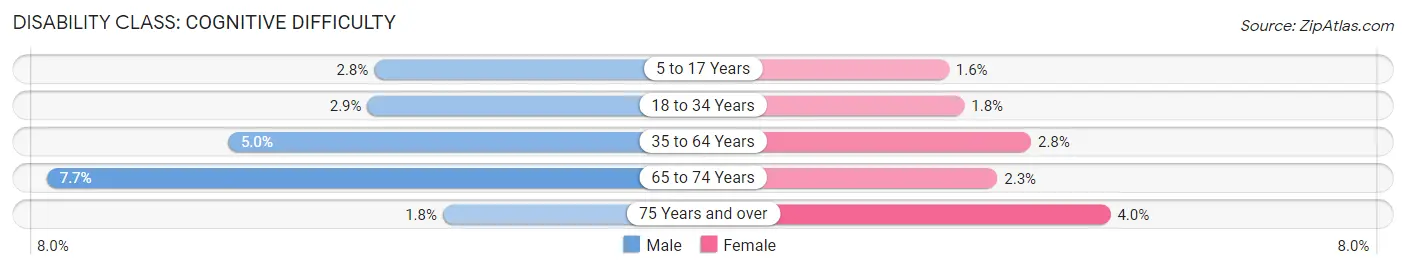
| Age Bracket | Male | Female |
| 5 to 17 Years | 19 (2.8%) | 10 (1.6%) |
| 18 to 34 Years | 26 (2.9%) | 14 (1.8%) |
| 35 to 64 Years | 75 (5.0%) | 40 (2.8%) |
| 65 to 74 Years | 33 (7.7%) | 9 (2.3%) |
| 75 Years and over | 4 (1.8%) | 14 (4.0%) |
Disability Class: Ambulatory Difficulty
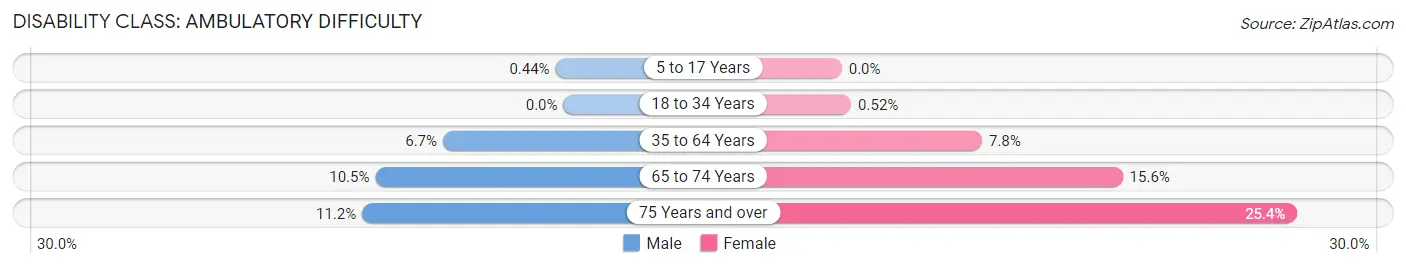
| Age Bracket | Male | Female |
| 5 to 17 Years | 3 (0.4%) | 0 (0.0%) |
| 18 to 34 Years | 0 (0.0%) | 4 (0.5%) |
| 35 to 64 Years | 101 (6.7%) | 111 (7.8%) |
| 65 to 74 Years | 45 (10.5%) | 61 (15.6%) |
| 75 Years and over | 25 (11.2%) | 89 (25.4%) |
Disability Class: Self-Care Difficulty
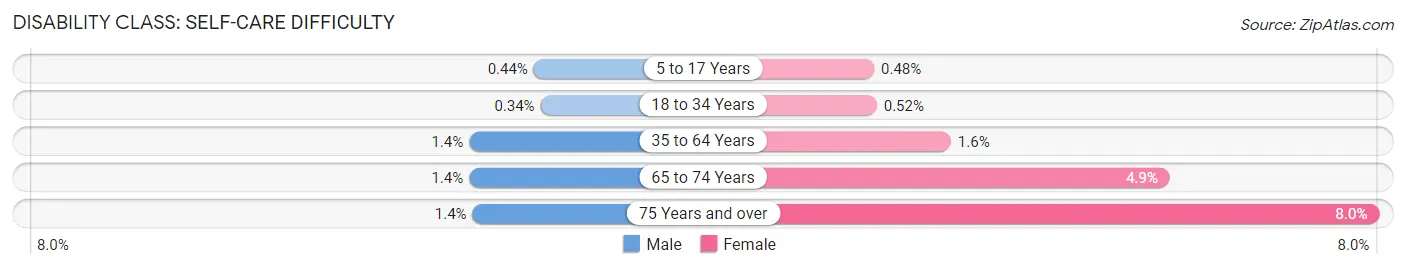
| Age Bracket | Male | Female |
| 5 to 17 Years | 3 (0.4%) | 3 (0.5%) |
| 18 to 34 Years | 3 (0.3%) | 4 (0.5%) |
| 35 to 64 Years | 21 (1.4%) | 23 (1.6%) |
| 65 to 74 Years | 6 (1.4%) | 19 (4.9%) |
| 75 Years and over | 3 (1.3%) | 28 (8.0%) |
Technology Access in Traill County
Computing Device Access in Traill County
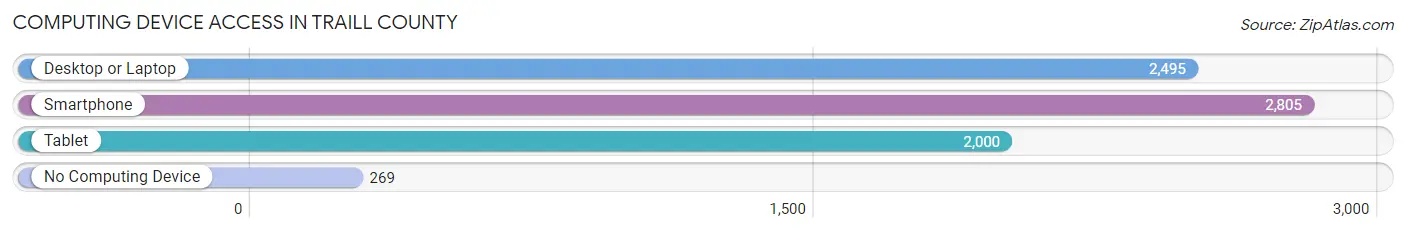
| Device Type | # Households | % Households |
| Desktop or Laptop | 2,495 | 75.9% |
| Smartphone | 2,805 | 85.4% |
| Tablet | 2,000 | 60.9% |
| No Computing Device | 269 | 8.2% |
| Total | 3,285 | 100.0% |
Internet Access in Traill County
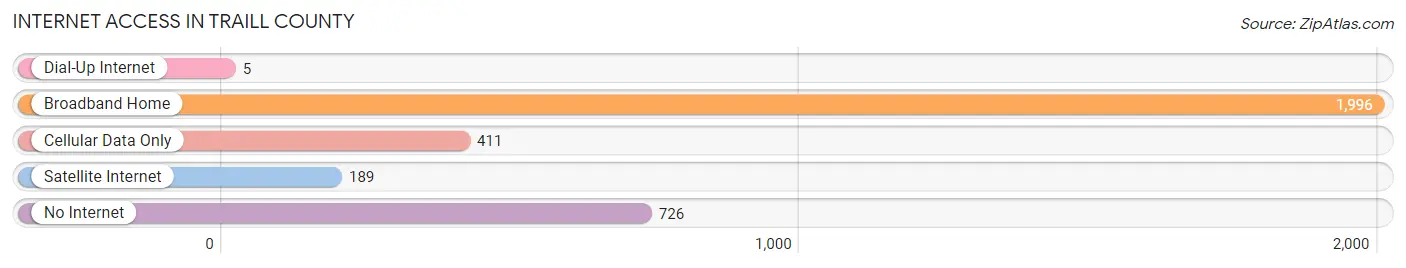
| Internet Type | # Households | % Households |
| Dial-Up Internet | 5 | 0.2% |
| Broadband Home | 1,996 | 60.8% |
| Cellular Data Only | 411 | 12.5% |
| Satellite Internet | 189 | 5.8% |
| No Internet | 726 | 22.1% |
| Total | 3,285 | 100.0% |
Traill County Summary
Traill County is located in the eastern part of North Dakota, in the Red River Valley. It is bordered by Grand Forks County to the north, Steele County to the east, Griggs County to the south, and Cass County to the west. The county seat is Hillsboro, and the largest city is Mayville. The county was named after Walter John Strickland Traill, a Canadian-born fur trader and explorer.
History
The area that is now Traill County was first inhabited by the Dakota Sioux and other Native American tribes. The first European settlers arrived in the area in the late 1800s, and the county was officially organized in 1875. The county was named after Walter John Strickland Traill, a Canadian-born fur trader and explorer.
The county was initially an agricultural area, with settlers growing wheat, oats, barley, and other grains. In the early 1900s, the county began to diversify its economy, with the development of the railroad and the establishment of several small businesses.
Geography
Traill County is located in the eastern part of North Dakota, in the Red River Valley. It is bordered by Grand Forks County to the north, Steele County to the east, Griggs County to the south, and Cass County to the west. The county has a total area of 1,072 square miles, of which 1,062 square miles is land and 10 square miles is water.
The county is mostly flat, with some rolling hills in the western part of the county. The Red River of the North runs through the county, and there are several small lakes and streams. The county is also home to several wildlife refuges, including the Sheyenne National Grassland and the Sheyenne River National Wildlife Refuge.
Economy
The economy of Traill County is largely based on agriculture. The county is home to several large farms, which produce wheat, oats, barley, and other grains. The county also has several small businesses, including manufacturing, retail, and service industries.
The county is also home to several educational institutions, including Mayville State University and the University of North Dakota. The county is also home to several medical facilities, including the Hillsboro Medical Center and the Mayville Medical Center.
Demographics
As of the 2010 census, the population of Traill County was 8,121. The population is mostly white (96.2%), with small percentages of Native American (1.2%), African American (0.7%), Asian (0.3%), and other races (1.6%). The median household income is $50,945, and the median home value is $133,400.
The county is home to several small towns, including Hillsboro, Mayville, and Buxton. The county seat is Hillsboro, and the largest city is Mayville. The county is served by several school districts, including the Hillsboro Public School District, the Mayville Public School District, and the Buxton Public School District.
Common Questions
What is the Total Population of Traill County?
Total Population of Traill County is 8,004.
What is the Total Male Population of Traill County?
Total Male Population of Traill County is 4,108.
What is the Total Female Population of Traill County?
Total Female Population of Traill County is 3,896.
What is the Ratio of Males per 100 Females in Traill County?
There are 105.44 Males per 100 Females in Traill County.
What is the Ratio of Females per 100 Males in Traill County?
There are 94.84 Females per 100 Males in Traill County.
What is the Median Population Age in Traill County?
Median Population Age in Traill County is 40.6 Years.
What is the Average Family Size in Traill County
Average Family Size in Traill County is 2.9 People.
What is the Average Household Size in Traill County
Average Household Size in Traill County is 2.3 People.
What is Per Capita Income in Traill County?
Per Capita income in Traill County is $40,942.
What is the Median Family Income in Traill County?
Median Family Income in Traill County is $108,958.
What is the Median Household income in Traill County?
Median Household Income in Traill County is $81,157.
What is Income or Wage Gap in Traill County?
Income or Wage Gap in Traill County is 31.8%.
Women in Traill County earn 68.2 cents for every dollar earned by a man.
What is Family Income Deficit in Traill County?
Family Income Deficit in Traill County is $10,624.
Families that are below poverty line in Traill County earn $10,624 less on average than the poverty threshold level.
What is Inequality or Gini Index in Traill County?
Inequality or Gini Index in Traill County is 0.42.
How Large is the Labor Force in Traill County?
There are 4,242 People in the Labor Forcein in Traill County.
What is the Percentage of People in the Labor Force in Traill County?
65.7% of People are in the Labor Force in Traill County.
What is the Unemployment Rate in Traill County?
Unemployment Rate in Traill County is 2.0%.