Stark County, ND
Stark County Map
Stark County Overview
32,989
TOTAL POPULATION
17,290
MALE POPULATION
15,699
FEMALE POPULATION
110.13
MALES / 100 FEMALES
90.80
FEMALES / 100 MALES
34.3
MEDIAN AGE
3.1
AVG FAMILY SIZE
2.4
AVG HOUSEHOLD SIZE
$40,025
PER CAPITA INCOME
$101,972
AVG FAMILY INCOME
$78,734
AVG HOUSEHOLD INCOME
44.7%
WAGE / INCOME GAP [ % ]
55.3¢/ $1
WAGE / INCOME GAP [ $ ]
$14,744
FAMILY INCOME DEFICIT
0.43
INEQUALITY / GINI INDEX
17,262
LABOR FORCE [ PEOPLE ]
69.0%
PERCENT IN LABOR FORCE
2.9%
UNEMPLOYMENT RATE
Stark County Area Codes
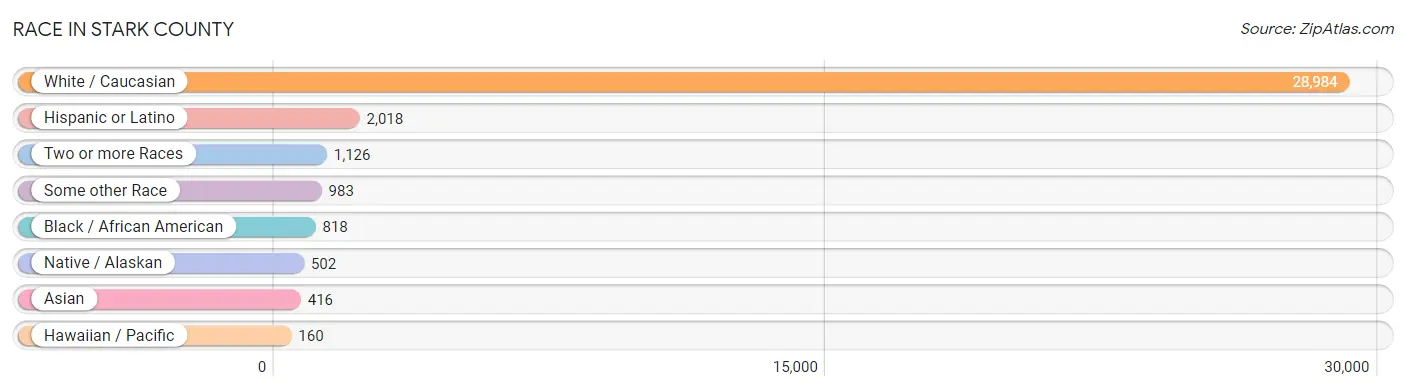
Race in Stark County
The most populous races in Stark County are White / Caucasian (28,984 | 87.9%), Hispanic or Latino (2,018 | 6.1%), and Two or more Races (1,126 | 3.4%).
| Race | # Population | % Population |
| Asian | 416 | 1.3% |
| Black / African American | 818 | 2.5% |
| Hawaiian / Pacific | 160 | 0.5% |
| Hispanic or Latino | 2,018 | 6.1% |
| Native / Alaskan | 502 | 1.5% |
| White / Caucasian | 28,984 | 87.9% |
| Two or more Races | 1,126 | 3.4% |
| Some other Race | 983 | 3.0% |
| Total | 32,989 | 100.0% |
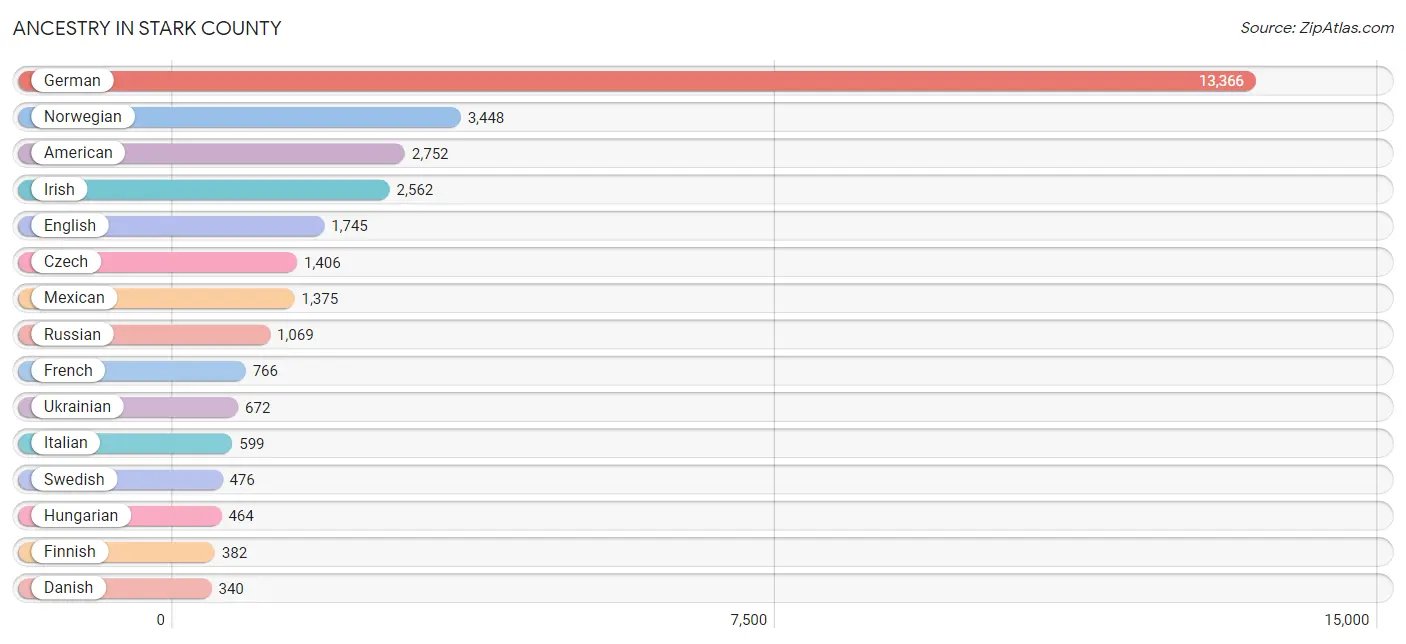
Ancestry in Stark County
The most populous ancestries reported in Stark County are German (13,366 | 40.5%), Norwegian (3,448 | 10.4%), American (2,752 | 8.3%), Irish (2,562 | 7.8%), and English (1,745 | 5.3%), together accounting for 72.4% of all Stark County residents.
| Ancestry | # Population | % Population |
| Alaska Native | 2 | 0.0% |
| American | 2,752 | 8.3% |
| Arab | 46 | 0.1% |
| Austrian | 10 | 0.0% |
| Basque | 29 | 0.1% |
| Bhutanese | 17 | 0.1% |
| British | 53 | 0.2% |
| Burmese | 65 | 0.2% |
| Canadian | 7 | 0.0% |
| Cape Verdean | 18 | 0.1% |
| Central American | 59 | 0.2% |
| Cherokee | 112 | 0.3% |
| Chippewa | 25 | 0.1% |
| Colombian | 3 | 0.0% |
| Croatian | 27 | 0.1% |
| Crow | 38 | 0.1% |
| Czech | 1,406 | 4.3% |
| Czechoslovakian | 152 | 0.5% |
| Danish | 340 | 1.0% |
| Dutch | 138 | 0.4% |
| Eastern European | 22 | 0.1% |
| English | 1,745 | 5.3% |
| European | 308 | 0.9% |
| Filipino | 2 | 0.0% |
| Finnish | 382 | 1.2% |
| French | 766 | 2.3% |
| French American Indian | 25 | 0.1% |
| French Canadian | 216 | 0.6% |
| German | 13,366 | 40.5% |
| German Russian | 199 | 0.6% |
| Ghanaian | 7 | 0.0% |
| Greek | 4 | 0.0% |
| Haitian | 17 | 0.1% |
| Hungarian | 464 | 1.4% |
| Icelander | 107 | 0.3% |
| Indian (Asian) | 92 | 0.3% |
| Irish | 2,562 | 7.8% |
| Italian | 599 | 1.8% |
| Jamaican | 16 | 0.1% |
| Korean | 272 | 0.8% |
| Lebanese | 7 | 0.0% |
| Lithuanian | 4 | 0.0% |
| Mexican | 1,375 | 4.2% |
| Moroccan | 6 | 0.0% |
| Navajo | 63 | 0.2% |
| Northern European | 38 | 0.1% |
| Norwegian | 3,448 | 10.4% |
| Pakistani | 22 | 0.1% |
| Panamanian | 54 | 0.2% |
| Pennsylvania German | 43 | 0.1% |
| Polish | 334 | 1.0% |
| Portuguese | 18 | 0.1% |
| Puerto Rican | 103 | 0.3% |
| Romanian | 12 | 0.0% |
| Russian | 1,069 | 3.2% |
| Salvadoran | 5 | 0.0% |
| Samoan | 60 | 0.2% |
| Scandinavian | 113 | 0.3% |
| Scotch-Irish | 208 | 0.6% |
| Scottish | 282 | 0.9% |
| Seminole | 2 | 0.0% |
| Serbian | 26 | 0.1% |
| Shoshone | 70 | 0.2% |
| Sioux | 156 | 0.5% |
| Slovak | 11 | 0.0% |
| South African | 11 | 0.0% |
| South American | 15 | 0.1% |
| Spaniard | 302 | 0.9% |
| Spanish | 29 | 0.1% |
| Sri Lankan | 104 | 0.3% |
| Subsaharan African | 82 | 0.3% |
| Swedish | 476 | 1.4% |
| Swiss | 144 | 0.4% |
| Thai | 81 | 0.3% |
| Ukrainian | 672 | 2.0% |
| Welsh | 164 | 0.5% |
| Yugoslavian | 2 | 0.0% |
| Zimbabwean | 43 | 0.1% | View All 78 Rows |
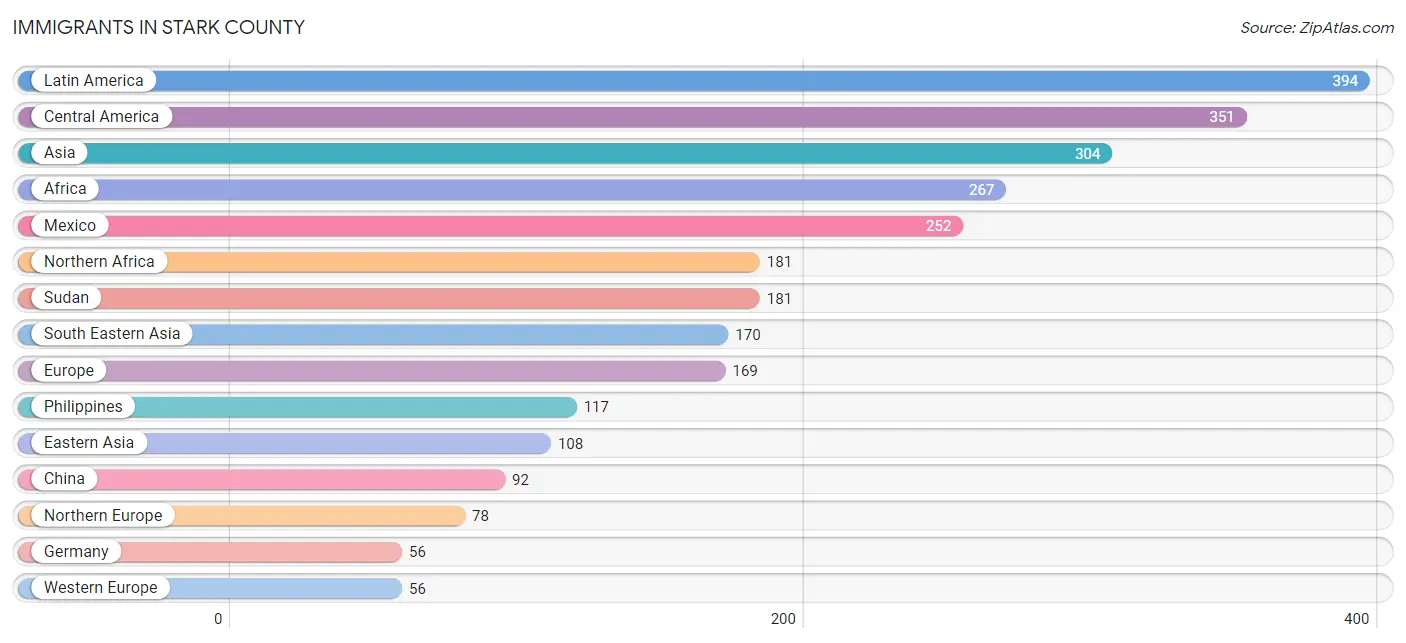
Immigrants in Stark County
The most numerous immigrant groups reported in Stark County came from Latin America (394 | 1.2%), Central America (351 | 1.1%), Asia (304 | 0.9%), Africa (267 | 0.8%), and Mexico (252 | 0.8%), together accounting for 4.7% of all Stark County residents.
| Immigration Origin | # Population | % Population |
| Africa | 267 | 0.8% |
| Asia | 304 | 0.9% |
| Bangladesh | 12 | 0.0% |
| Belize | 45 | 0.1% |
| Brazil | 2 | 0.0% |
| Cameroon | 3 | 0.0% |
| Canada | 44 | 0.1% |
| Caribbean | 33 | 0.1% |
| Central America | 351 | 1.1% |
| China | 92 | 0.3% |
| Denmark | 52 | 0.2% |
| Eastern Africa | 43 | 0.1% |
| Eastern Asia | 108 | 0.3% |
| Eastern Europe | 35 | 0.1% |
| England | 26 | 0.1% |
| Europe | 169 | 0.5% |
| Germany | 56 | 0.2% |
| Ghana | 23 | 0.1% |
| Guatemala | 28 | 0.1% |
| Haiti | 17 | 0.1% |
| India | 14 | 0.0% |
| Jamaica | 16 | 0.1% |
| Korea | 16 | 0.1% |
| Latin America | 394 | 1.2% |
| Mexico | 252 | 0.8% |
| Middle Africa | 3 | 0.0% |
| Nigeria | 17 | 0.1% |
| Northern Africa | 181 | 0.5% |
| Northern Europe | 78 | 0.2% |
| Panama | 26 | 0.1% |
| Philippines | 117 | 0.4% |
| Serbia | 26 | 0.1% |
| South America | 10 | 0.0% |
| South Central Asia | 26 | 0.1% |
| South Eastern Asia | 170 | 0.5% |
| Sudan | 181 | 0.5% |
| Thailand | 19 | 0.1% |
| Ukraine | 9 | 0.0% |
| Vietnam | 34 | 0.1% |
| Western Africa | 40 | 0.1% |
| Western Europe | 56 | 0.2% |
| Zimbabwe | 43 | 0.1% | View All 42 Rows |
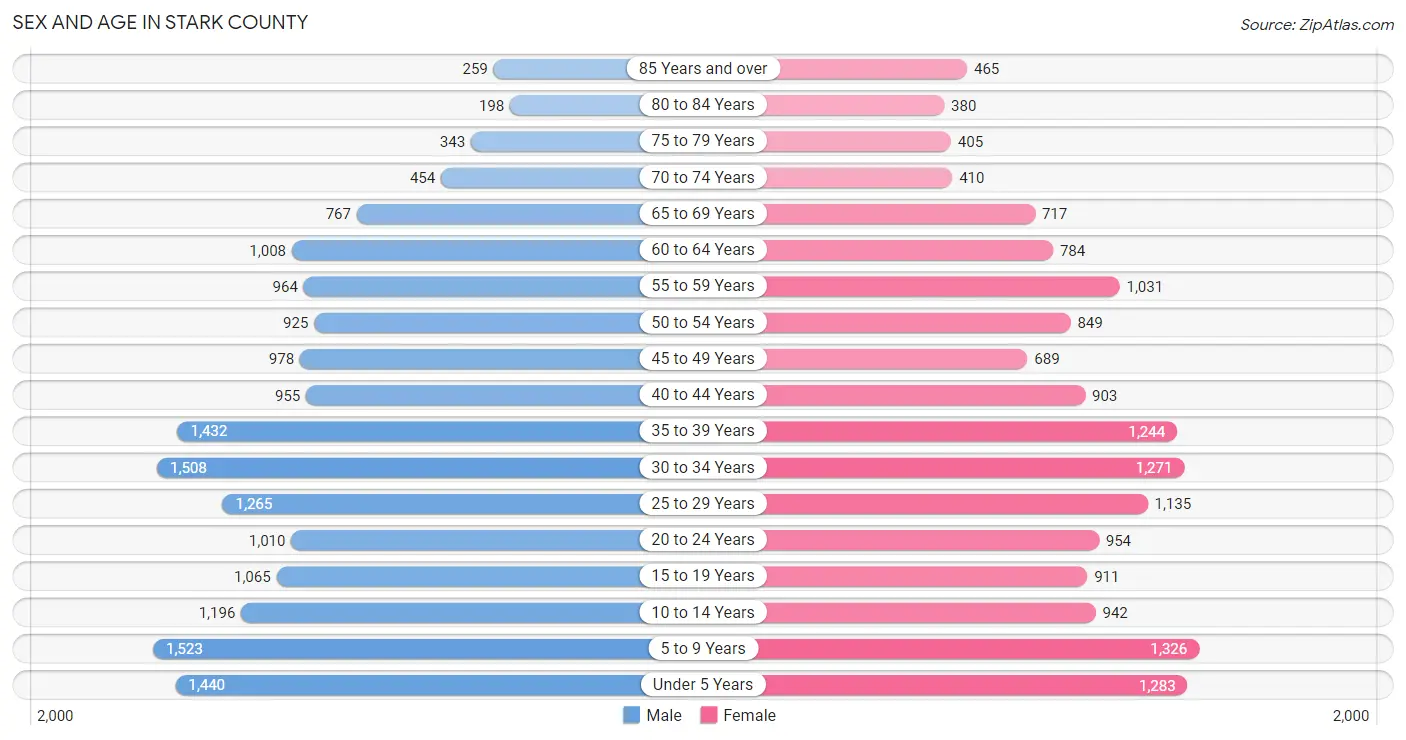
Sex and Age in Stark County
Sex and Age in Stark County
The most populous age groups in Stark County are 5 to 9 Years (1,523 | 8.8%) for men and 5 to 9 Years (1,326 | 8.5%) for women.
| Age Bracket | Male | Female |
| Under 5 Years | 1,440 (8.3%) | 1,283 (8.2%) |
| 5 to 9 Years | 1,523 (8.8%) | 1,326 (8.5%) |
| 10 to 14 Years | 1,196 (6.9%) | 942 (6.0%) |
| 15 to 19 Years | 1,065 (6.2%) | 911 (5.8%) |
| 20 to 24 Years | 1,010 (5.8%) | 954 (6.1%) |
| 25 to 29 Years | 1,265 (7.3%) | 1,135 (7.2%) |
| 30 to 34 Years | 1,508 (8.7%) | 1,271 (8.1%) |
| 35 to 39 Years | 1,432 (8.3%) | 1,244 (7.9%) |
| 40 to 44 Years | 955 (5.5%) | 903 (5.8%) |
| 45 to 49 Years | 978 (5.7%) | 689 (4.4%) |
| 50 to 54 Years | 925 (5.3%) | 849 (5.4%) |
| 55 to 59 Years | 964 (5.6%) | 1,031 (6.6%) |
| 60 to 64 Years | 1,008 (5.8%) | 784 (5.0%) |
| 65 to 69 Years | 767 (4.4%) | 717 (4.6%) |
| 70 to 74 Years | 454 (2.6%) | 410 (2.6%) |
| 75 to 79 Years | 343 (2.0%) | 405 (2.6%) |
| 80 to 84 Years | 198 (1.1%) | 380 (2.4%) |
| 85 Years and over | 259 (1.5%) | 465 (3.0%) |
| Total | 17,290 (100.0%) | 15,699 (100.0%) |
Families and Households in Stark County
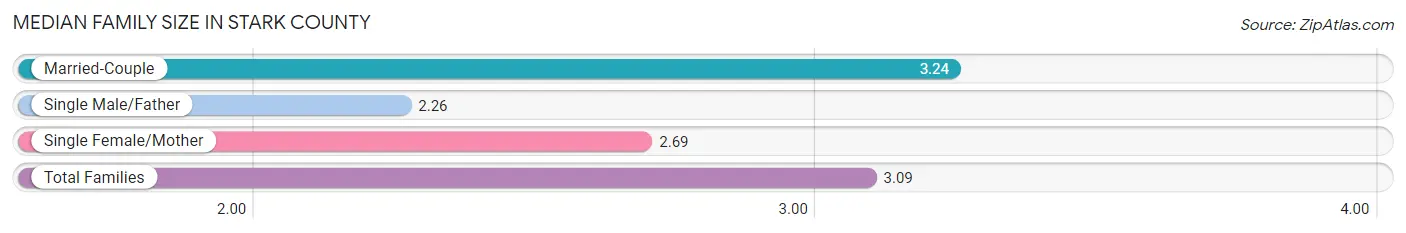
Median Family Size in Stark County
The median family size in Stark County is 3.09 persons per family, with married-couple families (6,510 | 79.3%) accounting for the largest median family size of 3.24 persons per family. On the other hand, single male/father families (792 | 9.7%) represent the smallest median family size with 2.26 persons per family.
| Family Type | # Families | Family Size |
| Married-Couple | 6,510 (79.3%) | 3.24 |
| Single Male/Father | 792 (9.7%) | 2.26 |
| Single Female/Mother | 906 (11.0%) | 2.69 |
| Total Families | 8,208 (100.0%) | 3.09 |
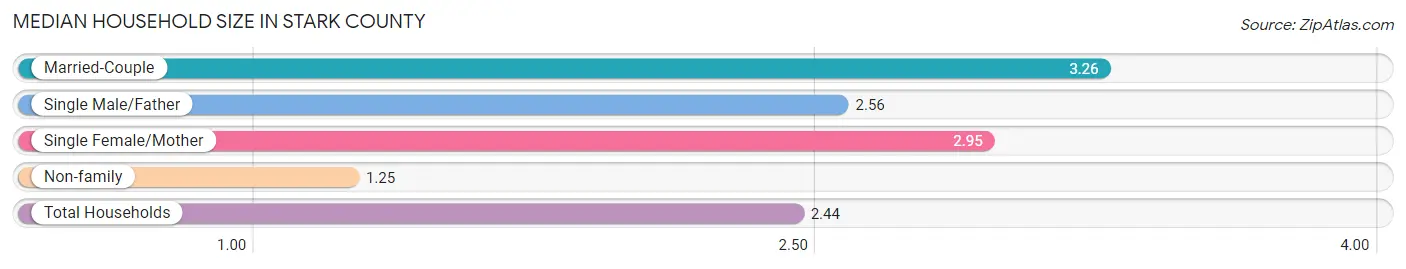
Median Household Size in Stark County
The median household size in Stark County is 2.44 persons per household, with married-couple households (6,510 | 49.3%) accounting for the largest median household size of 3.26 persons per household. non-family households (4,992 | 37.8%) represent the smallest median household size with 1.25 persons per household.
| Household Type | # Households | Household Size |
| Married-Couple | 6,510 (49.3%) | 3.26 |
| Single Male/Father | 792 (6.0%) | 2.56 |
| Single Female/Mother | 906 (6.9%) | 2.95 |
| Non-family | 4,992 (37.8%) | 1.25 |
| Total Households | 13,200 (100.0%) | 2.44 |
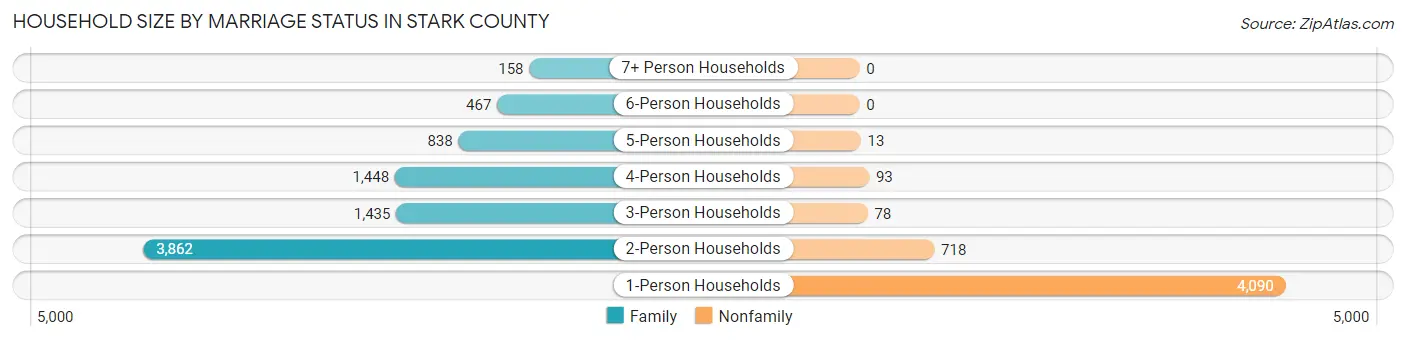
Household Size by Marriage Status in Stark County
Out of a total of 13,200 households in Stark County, 8,208 (62.2%) are family households, while 4,992 (37.8%) are nonfamily households. The most numerous type of family households are 2-person households, comprising 3,862, and the most common type of nonfamily households are 1-person households, comprising 4,090.
| Household Size | Family Households | Nonfamily Households |
| 1-Person Households | - | 4,090 (31.0%) |
| 2-Person Households | 3,862 (29.3%) | 718 (5.4%) |
| 3-Person Households | 1,435 (10.9%) | 78 (0.6%) |
| 4-Person Households | 1,448 (11.0%) | 93 (0.7%) |
| 5-Person Households | 838 (6.4%) | 13 (0.1%) |
| 6-Person Households | 467 (3.5%) | 0 (0.0%) |
| 7+ Person Households | 158 (1.2%) | 0 (0.0%) |
| Total | 8,208 (62.2%) | 4,992 (37.8%) |
Female Fertility in Stark County
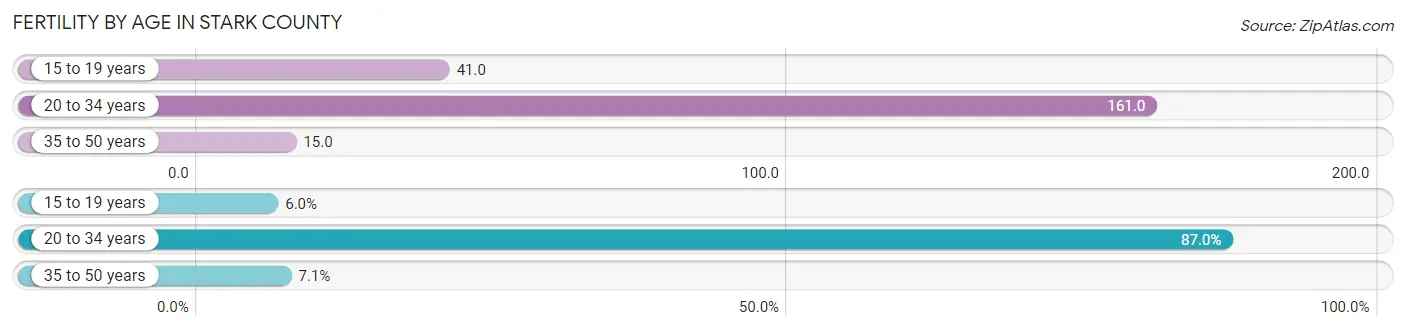
Fertility by Age in Stark County
Average fertility rate in Stark County is 86.0 births per 1,000 women. Women in the age bracket of 20 to 34 years have the highest fertility rate with 161.0 births per 1,000 women. Women in the age bracket of 20 to 34 years acount for 87.0% of all women with births.
| Age Bracket | Women with Births | Births / 1,000 Women |
| 15 to 19 years | 37 (6.0%) | 41.0 |
| 20 to 34 years | 540 (87.0%) | 161.0 |
| 35 to 50 years | 44 (7.1%) | 15.0 |
| Total | 621 (100.0%) | 86.0 |
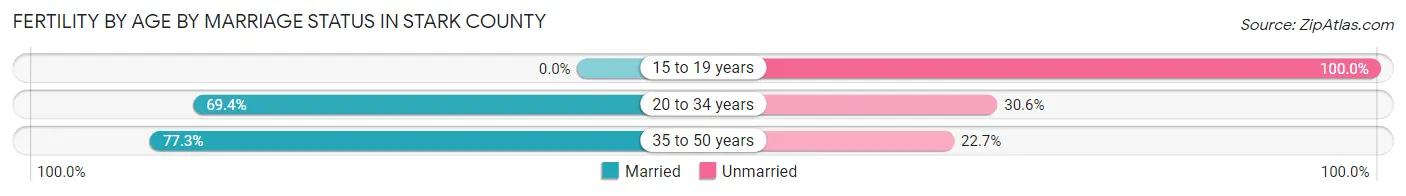
Fertility by Age by Marriage Status in Stark County
65.9% of women with births (621) in Stark County are married. The highest percentage of unmarried women with births falls into 15 to 19 years age bracket with 100.0% of them unmarried at the time of birth, while the lowest percentage of unmarried women with births belong to 35 to 50 years age bracket with 22.7% of them unmarried.
| Age Bracket | Married | Unmarried |
| 15 to 19 years | 0 (0.0%) | 37 (100.0%) |
| 20 to 34 years | 375 (69.4%) | 165 (30.6%) |
| 35 to 50 years | 34 (77.3%) | 10 (22.7%) |
| Total | 409 (65.9%) | 212 (34.1%) |
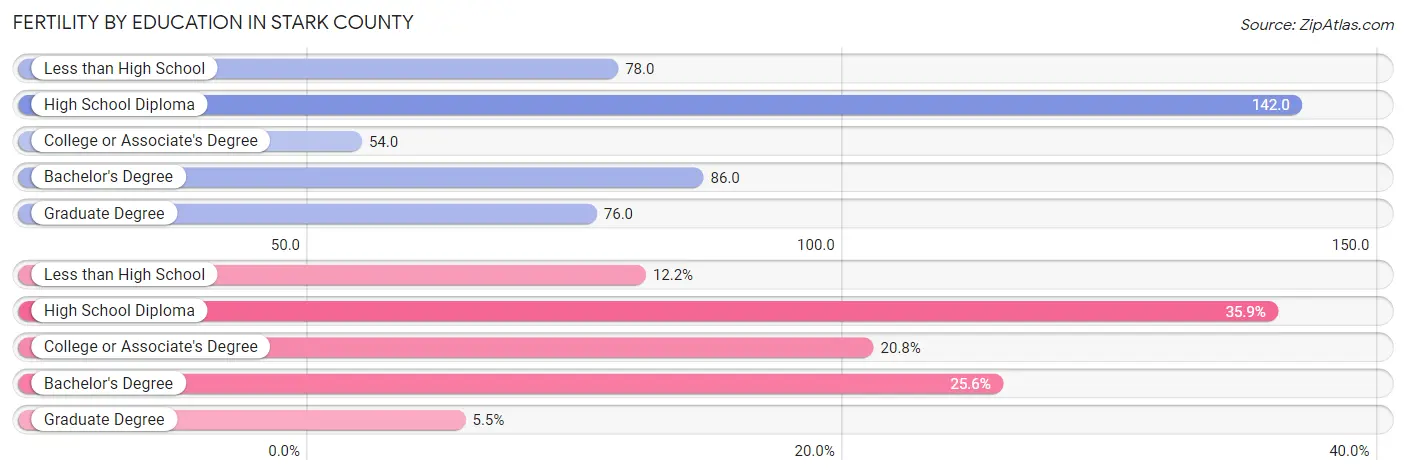
Fertility by Education in Stark County
Average fertility rate in Stark County is 86.0 births per 1,000 women. Women with the education attainment of high school diploma have the highest fertility rate of 142.0 births per 1,000 women, while women with the education attainment of college or associate's degree have the lowest fertility at 54.0 births per 1,000 women. Women with the education attainment of high school diploma represent 35.9% of all women with births.
| Educational Attainment | Women with Births | Births / 1,000 Women |
| Less than High School | 76 (12.2%) | 78.0 |
| High School Diploma | 223 (35.9%) | 142.0 |
| College or Associate's Degree | 129 (20.8%) | 54.0 |
| Bachelor's Degree | 159 (25.6%) | 86.0 |
| Graduate Degree | 34 (5.5%) | 76.0 |
| Total | 621 (100.0%) | 86.0 |
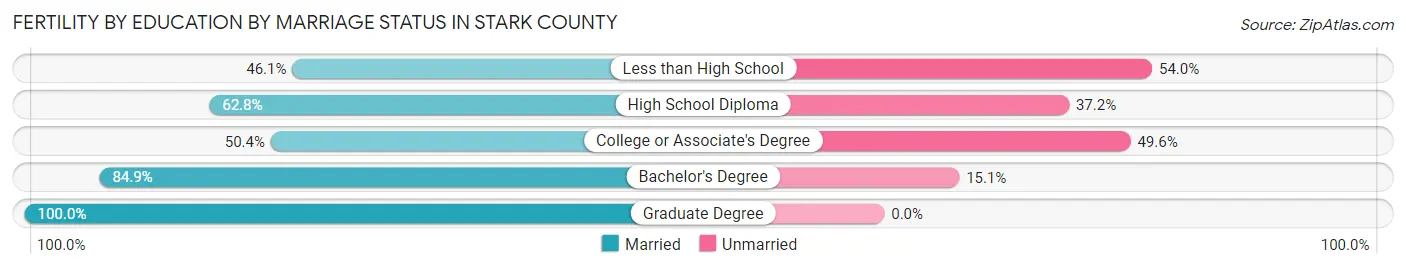
Fertility by Education by Marriage Status in Stark County
34.1% of women with births in Stark County are unmarried. Women with the educational attainment of graduate degree are most likely to be married with 100.0% of them married at childbirth, while women with the educational attainment of less than high school are least likely to be married with 53.9% of them unmarried at childbirth.
| Educational Attainment | Married | Unmarried |
| Less than High School | 35 (46.1%) | 41 (53.9%) |
| High School Diploma | 140 (62.8%) | 83 (37.2%) |
| College or Associate's Degree | 65 (50.4%) | 64 (49.6%) |
| Bachelor's Degree | 135 (84.9%) | 24 (15.1%) |
| Graduate Degree | 34 (100.0%) | 0 (0.0%) |
| Total | 409 (65.9%) | 212 (34.1%) |
Income in Stark County
Income Overview in Stark County
Per Capita Income in Stark County is $40,025, while median incomes of families and households are $101,972 and $78,734 respectively.
| Characteristic | Number | Measure |
| Per Capita Income | 32,989 | $40,025 |
| Median Family Income | 8,208 | $101,972 |
| Mean Family Income | 8,208 | $121,939 |
| Median Household Income | 13,200 | $78,734 |
| Mean Household Income | 13,200 | $98,095 |
| Income Deficit | 8,208 | $14,744 |
| Wage / Income Gap (%) | 32,989 | 44.66% |
| Wage / Income Gap ($) | 32,989 | 55.34¢ per $1 |
| Gini / Inequality Index | 32,989 | 0.43 |
Earnings by Sex in Stark County
Average Earnings in Stark County are $47,789, $61,167 for men and $33,850 for women, a difference of 44.7%.
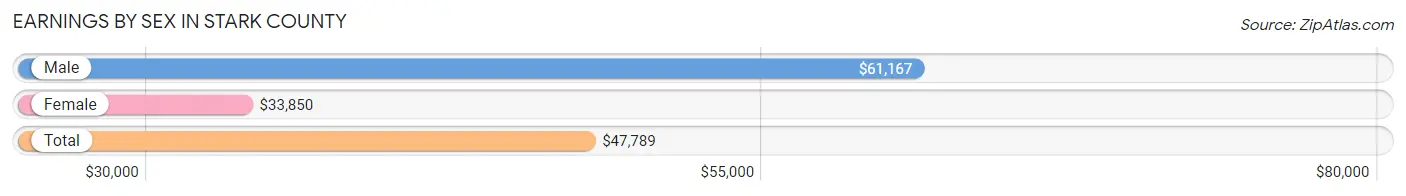
| Sex | Number | Average Earnings |
| Male | 10,658 (57.2%) | $61,167 |
| Female | 7,985 (42.8%) | $33,850 |
| Total | 18,643 (100.0%) | $47,789 |
Earnings by Sex by Income Bracket in Stark County
The most common earnings brackets in Stark County are $100,000+ for men (2,202 | 20.7%) and $75,000 to $99,999 for women (739 | 9.2%).
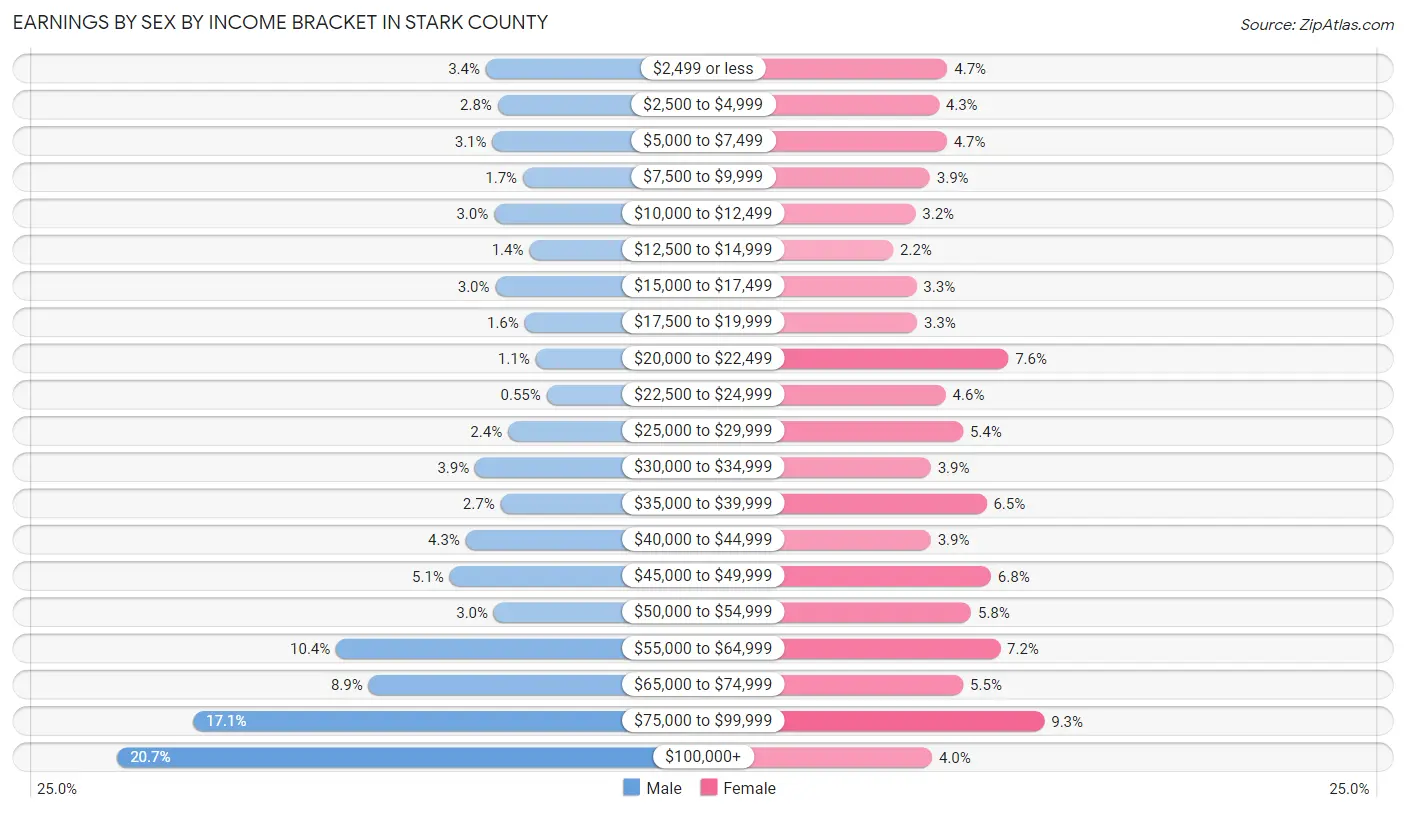
| Income | Male | Female |
| $2,499 or less | 362 (3.4%) | 376 (4.7%) |
| $2,500 to $4,999 | 303 (2.8%) | 344 (4.3%) |
| $5,000 to $7,499 | 329 (3.1%) | 374 (4.7%) |
| $7,500 to $9,999 | 177 (1.7%) | 311 (3.9%) |
| $10,000 to $12,499 | 321 (3.0%) | 256 (3.2%) |
| $12,500 to $14,999 | 145 (1.4%) | 173 (2.2%) |
| $15,000 to $17,499 | 314 (2.9%) | 260 (3.3%) |
| $17,500 to $19,999 | 168 (1.6%) | 263 (3.3%) |
| $20,000 to $22,499 | 114 (1.1%) | 604 (7.6%) |
| $22,500 to $24,999 | 59 (0.5%) | 370 (4.6%) |
| $25,000 to $29,999 | 251 (2.4%) | 434 (5.4%) |
| $30,000 to $34,999 | 416 (3.9%) | 314 (3.9%) |
| $35,000 to $39,999 | 289 (2.7%) | 522 (6.5%) |
| $40,000 to $44,999 | 463 (4.3%) | 314 (3.9%) |
| $45,000 to $49,999 | 543 (5.1%) | 539 (6.8%) |
| $50,000 to $54,999 | 322 (3.0%) | 465 (5.8%) |
| $55,000 to $64,999 | 1,109 (10.4%) | 573 (7.2%) |
| $65,000 to $74,999 | 947 (8.9%) | 435 (5.4%) |
| $75,000 to $99,999 | 1,824 (17.1%) | 739 (9.2%) |
| $100,000+ | 2,202 (20.7%) | 319 (4.0%) |
| Total | 10,658 (100.0%) | 7,985 (100.0%) |
Earnings by Sex by Educational Attainment in Stark County
Average earnings in Stark County are $68,065 for men and $39,167 for women, a difference of 42.5%. Men with an educational attainment of bachelor's degree enjoy the highest average annual earnings of $85,360, while those with less than high school education earn the least with $55,000. Women with an educational attainment of graduate degree earn the most with the average annual earnings of $70,221, while those with high school diploma education have the smallest earnings of $35,138.
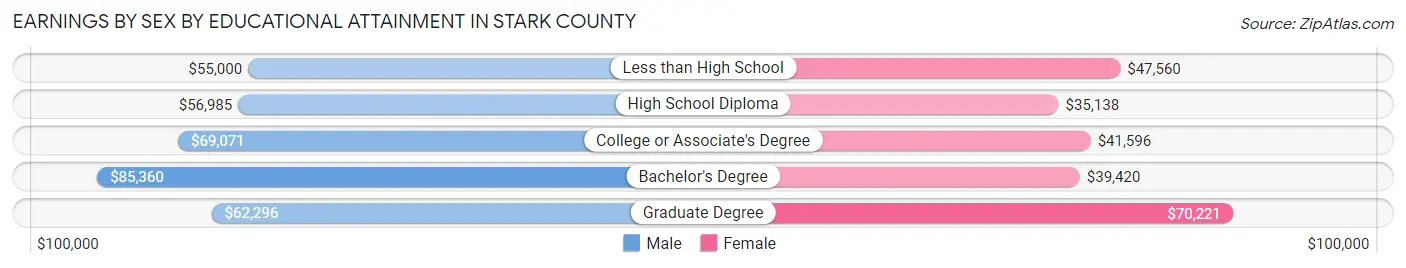
| Educational Attainment | Male Income | Female Income |
| Less than High School | $55,000 | $47,560 |
| High School Diploma | $56,985 | $35,138 |
| College or Associate's Degree | $69,071 | $41,596 |
| Bachelor's Degree | $85,360 | $39,420 |
| Graduate Degree | $62,296 | $70,221 |
| Total | $68,065 | $39,167 |
Family Income in Stark County
Family Income Brackets in Stark County
According to the Stark County family income data, there are 2,224 families falling into the $100,000 to $149,999 income range, which is the most common income bracket and makes up 27.1% of all families. Conversely, the $10,000 to $14,999 income bracket is the least frequent group with only 82 families (1.0%) belonging to this category.
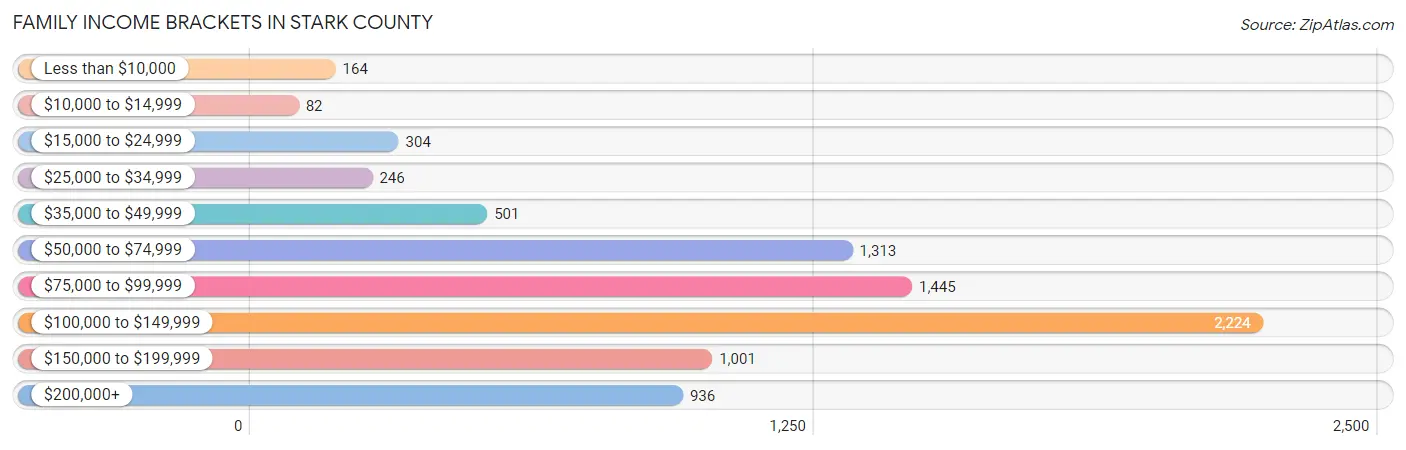
| Income Bracket | # Families | % Families |
| Less than $10,000 | 164 | 2.0% |
| $10,000 to $14,999 | 82 | 1.0% |
| $15,000 to $24,999 | 304 | 3.7% |
| $25,000 to $34,999 | 246 | 3.0% |
| $35,000 to $49,999 | 501 | 6.1% |
| $50,000 to $74,999 | 1,313 | 16.0% |
| $75,000 to $99,999 | 1,445 | 17.6% |
| $100,000 to $149,999 | 2,224 | 27.1% |
| $150,000 to $199,999 | 1,001 | 12.2% |
| $200,000+ | 936 | 11.4% |
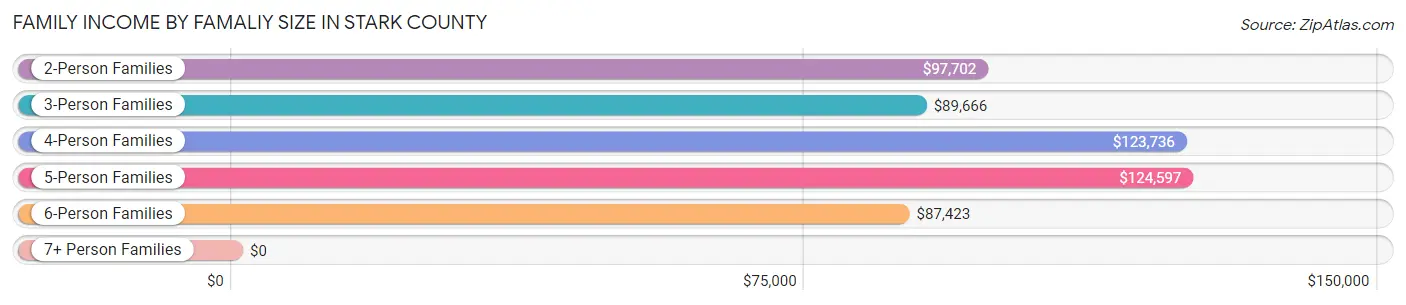
Family Income by Famaliy Size in Stark County
5-person families (868 | 10.6%) account for the highest median family income in Stark County with $124,597 per family, while 2-person families (4,200 | 51.2%) have the highest median income of $48,851 per family member.
| Income Bracket | # Families | Median Income |
| 2-Person Families | 4,200 (51.2%) | $97,702 |
| 3-Person Families | 1,389 (16.9%) | $89,666 |
| 4-Person Families | 1,156 (14.1%) | $123,736 |
| 5-Person Families | 868 (10.6%) | $124,597 |
| 6-Person Families | 437 (5.3%) | $87,423 |
| 7+ Person Families | 158 (1.9%) | $0 |
| Total | 8,208 (100.0%) | $101,972 |
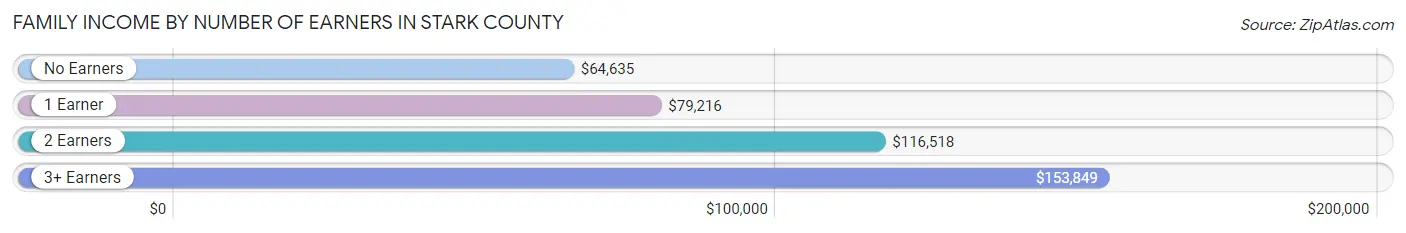
Family Income by Number of Earners in Stark County
The median family income in Stark County is $101,972, with families comprising 3+ earners (655) having the highest median family income of $153,849, while families with no earners (757) have the lowest median family income of $64,635, accounting for 8.0% and 9.2% of families, respectively.
| Number of Earners | # Families | Median Income |
| No Earners | 757 (9.2%) | $64,635 |
| 1 Earner | 2,490 (30.3%) | $79,216 |
| 2 Earners | 4,306 (52.5%) | $116,518 |
| 3+ Earners | 655 (8.0%) | $153,849 |
| Total | 8,208 (100.0%) | $101,972 |
Household Income in Stark County
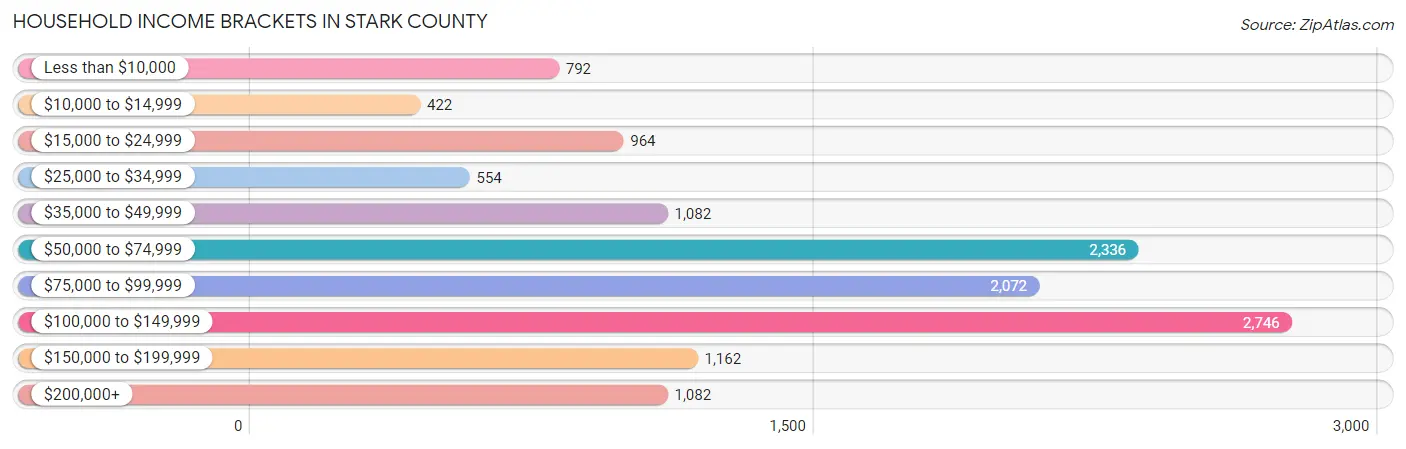
Household Income Brackets in Stark County
With 2,746 households falling in the category, the $100,000 to $149,999 income range is the most frequent in Stark County, accounting for 20.8% of all households. In contrast, only 422 households (3.2%) fall into the $10,000 to $14,999 income bracket, making it the least populous group.
| Income Bracket | # Households | % Households |
| Less than $10,000 | 792 | 6.0% |
| $10,000 to $14,999 | 422 | 3.2% |
| $15,000 to $24,999 | 964 | 7.3% |
| $25,000 to $34,999 | 554 | 4.2% |
| $35,000 to $49,999 | 1,082 | 8.2% |
| $50,000 to $74,999 | 2,336 | 17.7% |
| $75,000 to $99,999 | 2,072 | 15.7% |
| $100,000 to $149,999 | 2,746 | 20.8% |
| $150,000 to $199,999 | 1,162 | 8.8% |
| $200,000+ | 1,082 | 8.2% |
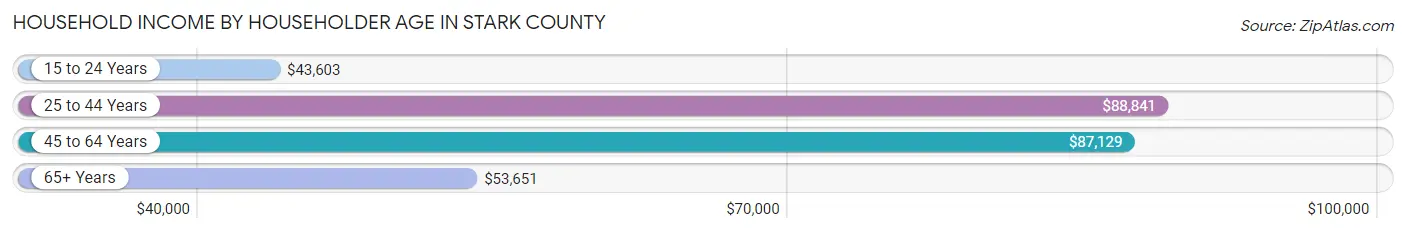
Household Income by Householder Age in Stark County
The median household income in Stark County is $78,734, with the highest median household income of $88,841 found in the 25 to 44 years age bracket for the primary householder. A total of 5,359 households (40.6%) fall into this category. Meanwhile, the 15 to 24 years age bracket for the primary householder has the lowest median household income of $43,603, with 687 households (5.2%) in this group.
| Income Bracket | # Households | Median Income |
| 15 to 24 Years | 687 (5.2%) | $43,603 |
| 25 to 44 Years | 5,359 (40.6%) | $88,841 |
| 45 to 64 Years | 4,311 (32.7%) | $87,129 |
| 65+ Years | 2,843 (21.5%) | $53,651 |
| Total | 13,200 (100.0%) | $78,734 |
Poverty in Stark County
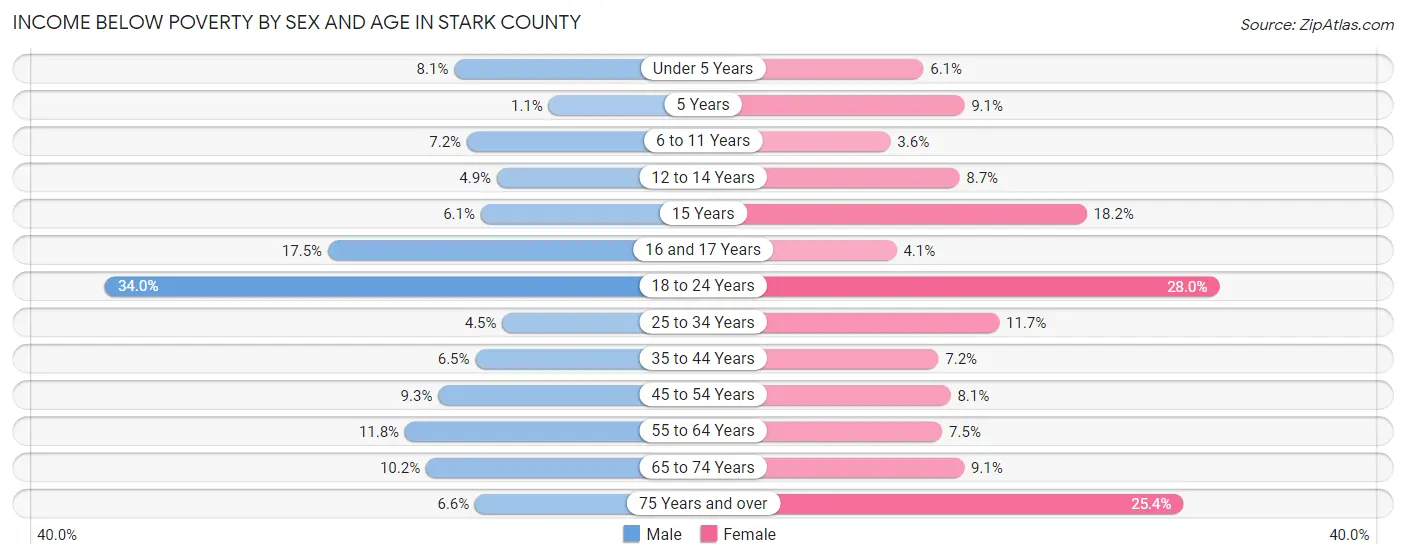
Income Below Poverty by Sex and Age in Stark County
With 9.7% poverty level for males and 10.6% for females among the residents of Stark County, 18 to 24 year old males and 18 to 24 year old females are the most vulnerable to poverty, with 406 males (34.0%) and 322 females (28.0%) in their respective age groups living below the poverty level.
| Age Bracket | Male | Female |
| Under 5 Years | 111 (8.1%) | 77 (6.0%) |
| 5 Years | 3 (1.1%) | 33 (9.1%) |
| 6 to 11 Years | 110 (7.2%) | 51 (3.6%) |
| 12 to 14 Years | 38 (4.9%) | 37 (8.7%) |
| 15 Years | 10 (6.1%) | 18 (18.2%) |
| 16 and 17 Years | 93 (17.5%) | 20 (4.1%) |
| 18 to 24 Years | 406 (34.0%) | 322 (28.0%) |
| 25 to 34 Years | 125 (4.5%) | 281 (11.7%) |
| 35 to 44 Years | 155 (6.5%) | 154 (7.2%) |
| 45 to 54 Years | 176 (9.3%) | 124 (8.1%) |
| 55 to 64 Years | 232 (11.8%) | 135 (7.4%) |
| 65 to 74 Years | 124 (10.2%) | 102 (9.1%) |
| 75 Years and over | 47 (6.6%) | 271 (25.4%) |
| Total | 1,630 (9.7%) | 1,625 (10.6%) |
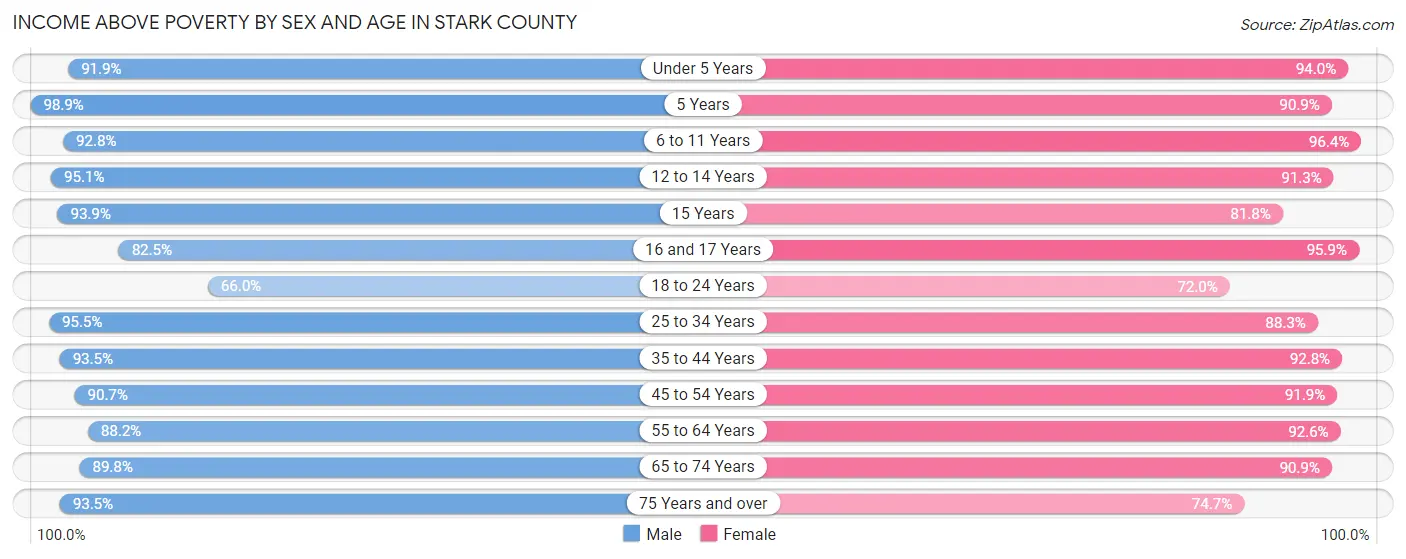
Income Above Poverty by Sex and Age in Stark County
According to the poverty statistics in Stark County, males aged 5 years and females aged 6 to 11 years are the age groups that are most secure financially, with 98.9% of males and 96.4% of females in these age groups living above the poverty line.
| Age Bracket | Male | Female |
| Under 5 Years | 1,260 (91.9%) | 1,195 (94.0%) |
| 5 Years | 272 (98.9%) | 330 (90.9%) |
| 6 to 11 Years | 1,426 (92.8%) | 1,362 (96.4%) |
| 12 to 14 Years | 733 (95.1%) | 387 (91.3%) |
| 15 Years | 153 (93.9%) | 81 (81.8%) |
| 16 and 17 Years | 439 (82.5%) | 473 (95.9%) |
| 18 to 24 Years | 787 (66.0%) | 827 (72.0%) |
| 25 to 34 Years | 2,636 (95.5%) | 2,125 (88.3%) |
| 35 to 44 Years | 2,218 (93.5%) | 1,993 (92.8%) |
| 45 to 54 Years | 1,718 (90.7%) | 1,412 (91.9%) |
| 55 to 64 Years | 1,740 (88.2%) | 1,678 (92.5%) |
| 65 to 74 Years | 1,092 (89.8%) | 1,023 (90.9%) |
| 75 Years and over | 671 (93.4%) | 798 (74.7%) |
| Total | 15,145 (90.3%) | 13,684 (89.4%) |
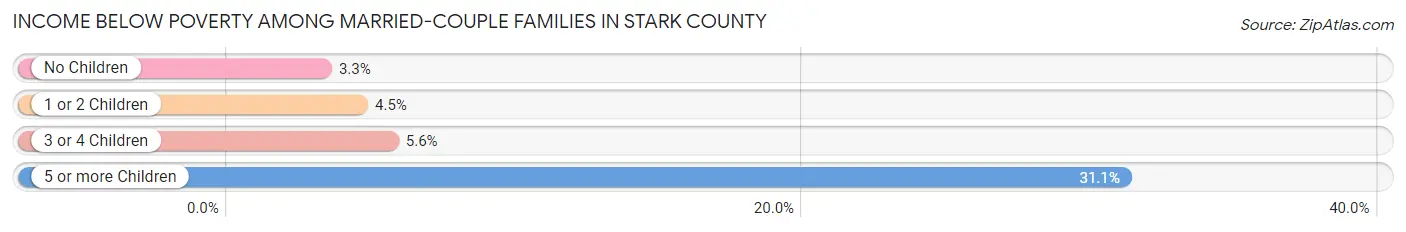
Income Below Poverty Among Married-Couple Families in Stark County
The poverty statistics for married-couple families in Stark County show that 4.2% or 276 of the total 6,510 families live below the poverty line. Families with 5 or more children have the highest poverty rate of 31.1%, comprising of 14 families. On the other hand, families with no children have the lowest poverty rate of 3.3%, which includes 111 families.
| Children | Above Poverty | Below Poverty |
| No Children | 3,288 (96.7%) | 111 (3.3%) |
| 1 or 2 Children | 1,853 (95.5%) | 88 (4.5%) |
| 3 or 4 Children | 1,062 (94.4%) | 63 (5.6%) |
| 5 or more Children | 31 (68.9%) | 14 (31.1%) |
| Total | 6,234 (95.8%) | 276 (4.2%) |
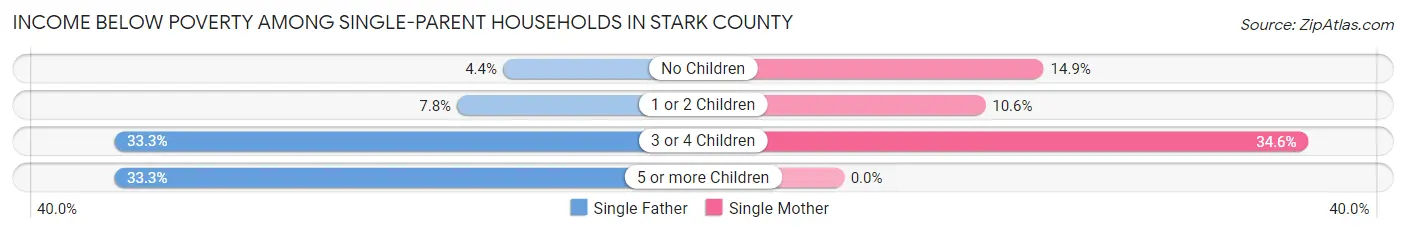
Income Below Poverty Among Single-Parent Households in Stark County
According to the poverty data in Stark County, 8.0% or 63 single-father households and 12.9% or 117 single-mother households are living below the poverty line. Among single-father households, those with 3 or 4 children have the highest poverty rate, with 6 households (33.3%) experiencing poverty. Likewise, among single-mother households, those with 3 or 4 children have the highest poverty rate, with 9 households (34.6%) falling below the poverty line.
| Children | Single Father | Single Mother |
| No Children | 15 (4.4%) | 52 (14.9%) |
| 1 or 2 Children | 31 (7.8%) | 56 (10.5%) |
| 3 or 4 Children | 6 (33.3%) | 9 (34.6%) |
| 5 or more Children | 11 (33.3%) | 0 (0.0%) |
| Total | 63 (8.0%) | 117 (12.9%) |
Income Below Poverty Among Married-Couple vs Single-Parent Households in Stark County
The poverty data for Stark County shows that 276 of the married-couple family households (4.2%) and 180 of the single-parent households (10.6%) are living below the poverty level. Within the married-couple family households, those with 5 or more children have the highest poverty rate, with 14 households (31.1%) falling below the poverty line. Among the single-parent households, those with 3 or 4 children have the highest poverty rate, with 15 household (34.1%) living below poverty.

| Children | Married-Couple Families | Single-Parent Households |
| No Children | 111 (3.3%) | 67 (9.7%) |
| 1 or 2 Children | 88 (4.5%) | 87 (9.4%) |
| 3 or 4 Children | 63 (5.6%) | 15 (34.1%) |
| 5 or more Children | 14 (31.1%) | 11 (33.3%) |
| Total | 276 (4.2%) | 180 (10.6%) |
Employment Characteristics in Stark County
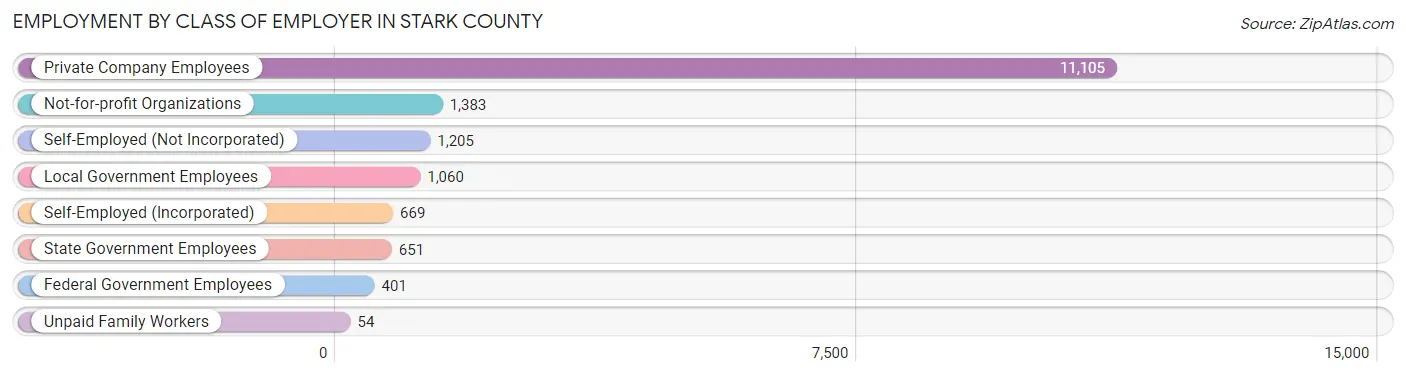
Employment by Class of Employer in Stark County
Among the 16,528 employed individuals in Stark County, private company employees (11,105 | 67.2%), not-for-profit organizations (1,383 | 8.4%), and self-employed (not incorporated) (1,205 | 7.3%) make up the most common classes of employment.
| Employer Class | # Employees | % Employees |
| Private Company Employees | 11,105 | 67.2% |
| Self-Employed (Incorporated) | 669 | 4.1% |
| Self-Employed (Not Incorporated) | 1,205 | 7.3% |
| Not-for-profit Organizations | 1,383 | 8.4% |
| Local Government Employees | 1,060 | 6.4% |
| State Government Employees | 651 | 3.9% |
| Federal Government Employees | 401 | 2.4% |
| Unpaid Family Workers | 54 | 0.3% |
| Total | 16,528 | 100.0% |
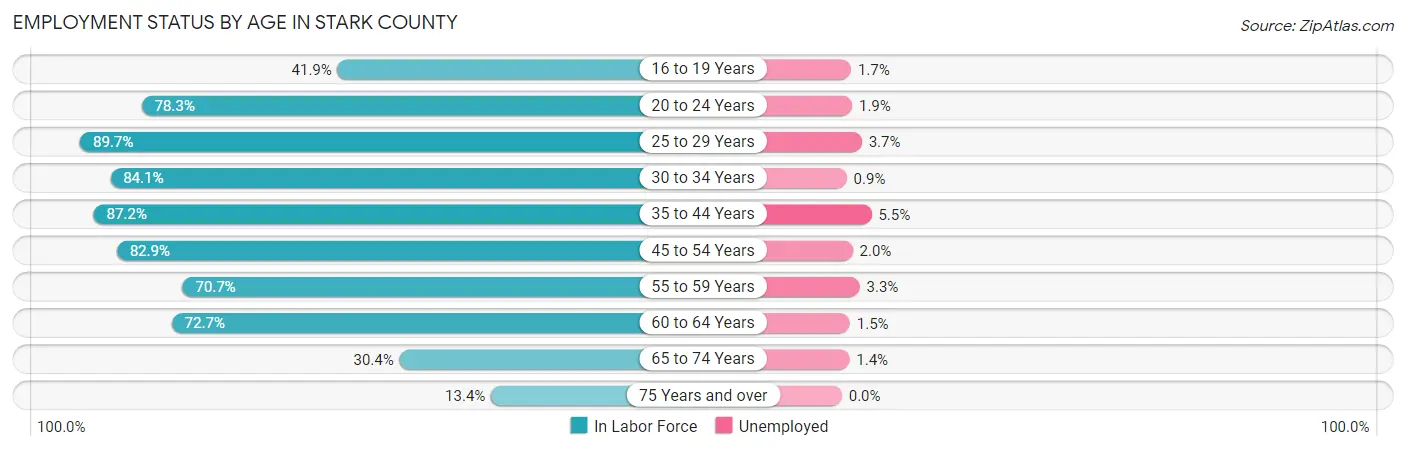
Employment Status by Age in Stark County
According to the labor force statistics for Stark County, out of the total population over 16 years of age (25,017), 69.0% or 17,262 individuals are in the labor force, with 2.9% or 501 of them unemployed. The age group with the highest labor force participation rate is 25 to 29 years, with 89.7% or 2,153 individuals in the labor force. Within the labor force, the 35 to 44 years age range has the highest percentage of unemployed individuals, with 5.5% or 217 of them being unemployed.
| Age Bracket | In Labor Force | Unemployed |
| 16 to 19 Years | 718 (41.9%) | 12 (1.7%) |
| 20 to 24 Years | 1,538 (78.3%) | 29 (1.9%) |
| 25 to 29 Years | 2,153 (89.7%) | 80 (3.7%) |
| 30 to 34 Years | 2,337 (84.1%) | 21 (0.9%) |
| 35 to 44 Years | 3,954 (87.2%) | 217 (5.5%) |
| 45 to 54 Years | 2,853 (82.9%) | 57 (2.0%) |
| 55 to 59 Years | 1,410 (70.7%) | 47 (3.3%) |
| 60 to 64 Years | 1,303 (72.7%) | 20 (1.5%) |
| 65 to 74 Years | 714 (30.4%) | 10 (1.4%) |
| 75 Years and over | 275 (13.4%) | 0 (0.0%) |
| Total | 17,262 (69.0%) | 501 (2.9%) |
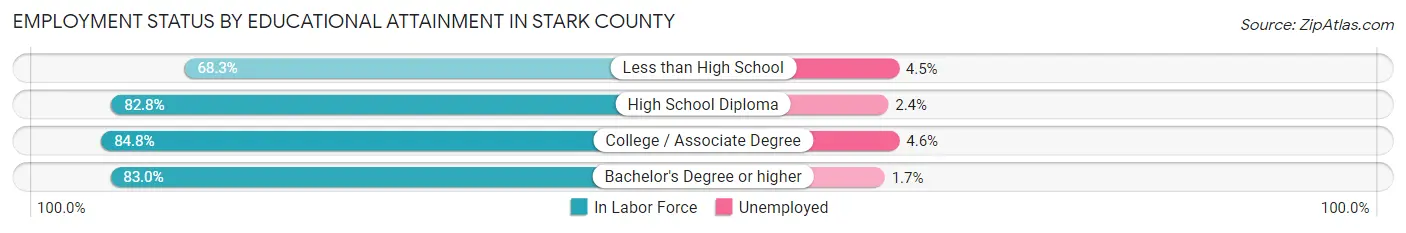
Employment Status by Educational Attainment in Stark County
According to labor force statistics for Stark County, 82.7% of individuals (14,010) out of the total population between 25 and 64 years of age (16,941) are in the labor force, with 3.2% or 448 of them being unemployed. The group with the highest labor force participation rate are those with the educational attainment of college / associate degree, with 84.8% or 5,424 individuals in the labor force. Within the labor force, individuals with college / associate degree education have the highest percentage of unemployment, with 4.6% or 250 of them being unemployed.
| Educational Attainment | In Labor Force | Unemployed |
| Less than High School | 749 (68.3%) | 49 (4.5%) |
| High School Diploma | 3,950 (82.8%) | 115 (2.4%) |
| College / Associate Degree | 5,424 (84.8%) | 294 (4.6%) |
| Bachelor's Degree or higher | 3,882 (83.0%) | 80 (1.7%) |
| Total | 14,010 (82.7%) | 542 (3.2%) |
Employment Occupations by Sex in Stark County
Management, Business, Science and Arts Occupations
The most common Management, Business, Science and Arts occupations in Stark County are Management (1,956 | 11.7%), Community & Social Service (1,358 | 8.1%), Computers, Engineering & Science (929 | 5.5%), Education Instruction & Library (738 | 4.4%), and Business & Financial (713 | 4.3%).
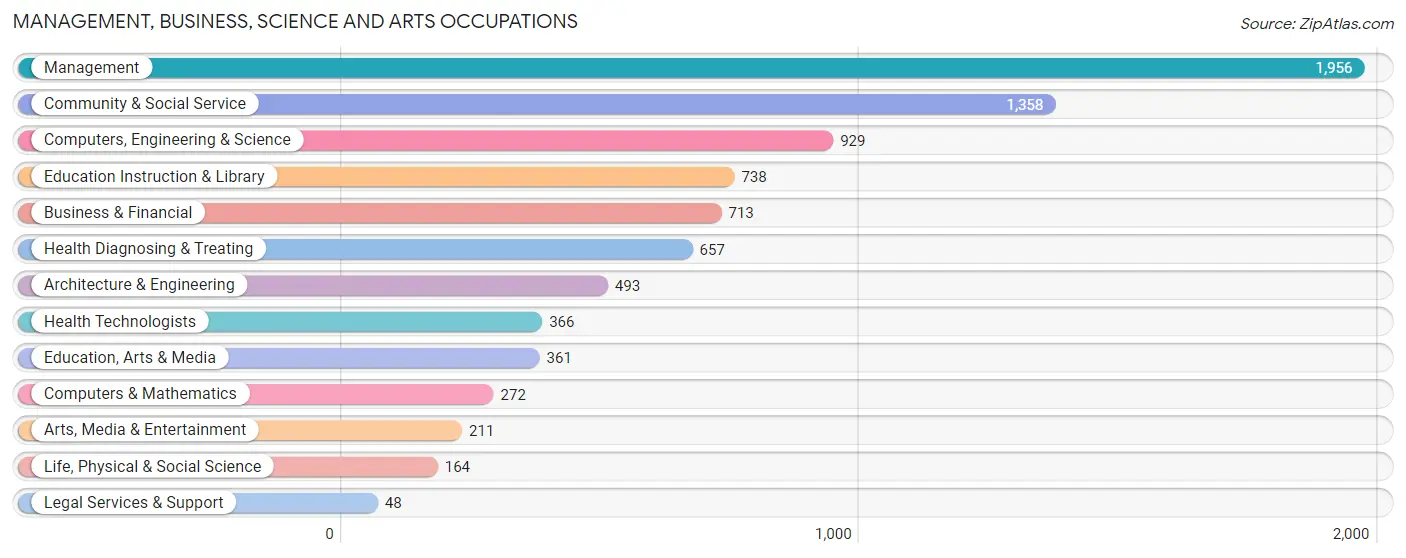
Management, Business, Science and Arts Occupations by Sex
Within the Management, Business, Science and Arts occupations in Stark County, the most male-oriented occupations are Architecture & Engineering (95.3%), Computers, Engineering & Science (86.1%), and Life, Physical & Social Science (81.7%), while the most female-oriented occupations are Legal Services & Support (100.0%), Health Diagnosing & Treating (95.1%), and Health Technologists (93.2%).
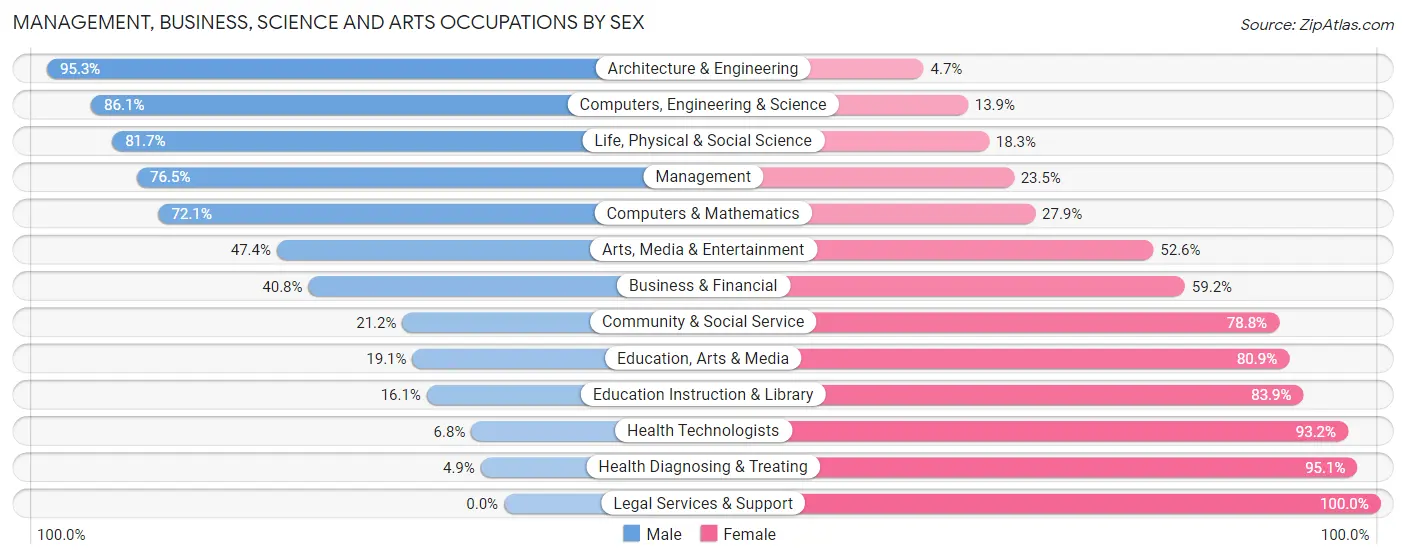
| Occupation | Male | Female |
| Management | 1,497 (76.5%) | 459 (23.5%) |
| Business & Financial | 291 (40.8%) | 422 (59.2%) |
| Computers, Engineering & Science | 800 (86.1%) | 129 (13.9%) |
| Computers & Mathematics | 196 (72.1%) | 76 (27.9%) |
| Architecture & Engineering | 470 (95.3%) | 23 (4.7%) |
| Life, Physical & Social Science | 134 (81.7%) | 30 (18.3%) |
| Community & Social Service | 288 (21.2%) | 1,070 (78.8%) |
| Education, Arts & Media | 69 (19.1%) | 292 (80.9%) |
| Legal Services & Support | 0 (0.0%) | 48 (100.0%) |
| Education Instruction & Library | 119 (16.1%) | 619 (83.9%) |
| Arts, Media & Entertainment | 100 (47.4%) | 111 (52.6%) |
| Health Diagnosing & Treating | 32 (4.9%) | 625 (95.1%) |
| Health Technologists | 25 (6.8%) | 341 (93.2%) |
| Total (Category) | 2,908 (51.8%) | 2,705 (48.2%) |
| Total (Overall) | 9,574 (57.1%) | 7,183 (42.9%) |
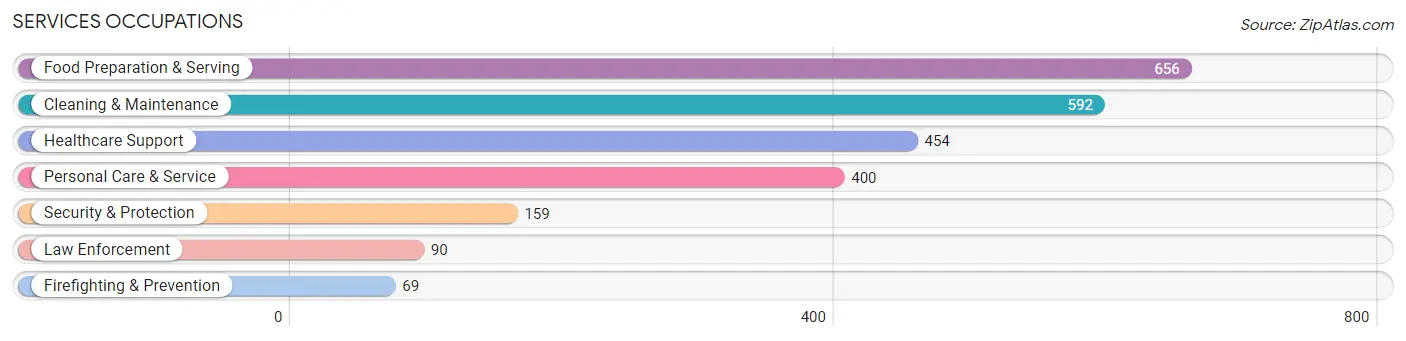
Services Occupations
The most common Services occupations in Stark County are Food Preparation & Serving (656 | 3.9%), Cleaning & Maintenance (592 | 3.5%), Healthcare Support (454 | 2.7%), Personal Care & Service (400 | 2.4%), and Security & Protection (159 | 0.9%).
Services Occupations by Sex
Within the Services occupations in Stark County, the most male-oriented occupations are Law Enforcement (100.0%), Security & Protection (89.9%), and Firefighting & Prevention (76.8%), while the most female-oriented occupations are Healthcare Support (89.2%), Personal Care & Service (78.2%), and Food Preparation & Serving (70.9%).
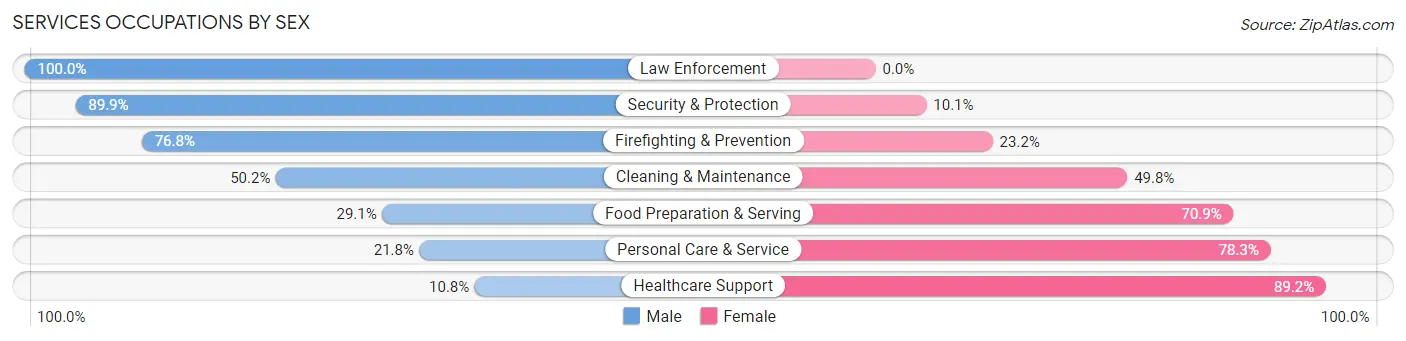
| Occupation | Male | Female |
| Healthcare Support | 49 (10.8%) | 405 (89.2%) |
| Security & Protection | 143 (89.9%) | 16 (10.1%) |
| Firefighting & Prevention | 53 (76.8%) | 16 (23.2%) |
| Law Enforcement | 90 (100.0%) | 0 (0.0%) |
| Food Preparation & Serving | 191 (29.1%) | 465 (70.9%) |
| Cleaning & Maintenance | 297 (50.2%) | 295 (49.8%) |
| Personal Care & Service | 87 (21.7%) | 313 (78.2%) |
| Total (Category) | 767 (33.9%) | 1,494 (66.1%) |
| Total (Overall) | 9,574 (57.1%) | 7,183 (42.9%) |
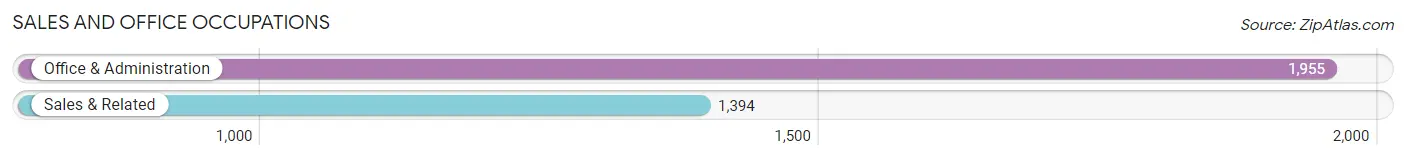
Sales and Office Occupations
The most common Sales and Office occupations in Stark County are Office & Administration (1,955 | 11.7%), and Sales & Related (1,394 | 8.3%).
Sales and Office Occupations by Sex

| Occupation | Male | Female |
| Sales & Related | 858 (61.6%) | 536 (38.5%) |
| Office & Administration | 387 (19.8%) | 1,568 (80.2%) |
| Total (Category) | 1,245 (37.2%) | 2,104 (62.8%) |
| Total (Overall) | 9,574 (57.1%) | 7,183 (42.9%) |
Natural Resources, Construction and Maintenance Occupations
The most common Natural Resources, Construction and Maintenance occupations in Stark County are Construction & Extraction (1,366 | 8.2%), Installation, Maintenance & Repair (1,140 | 6.8%), and Farming, Fishing & Forestry (164 | 1.0%).
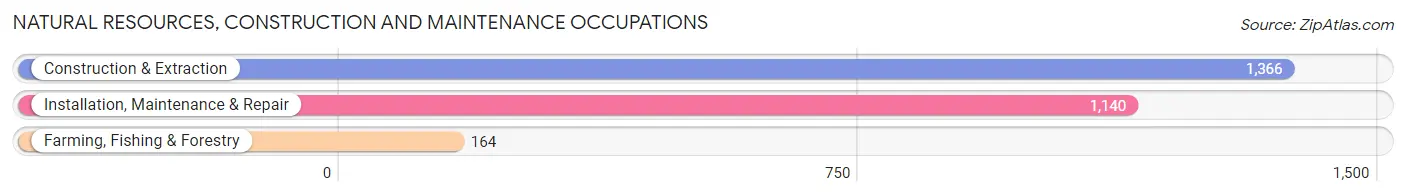
Natural Resources, Construction and Maintenance Occupations by Sex
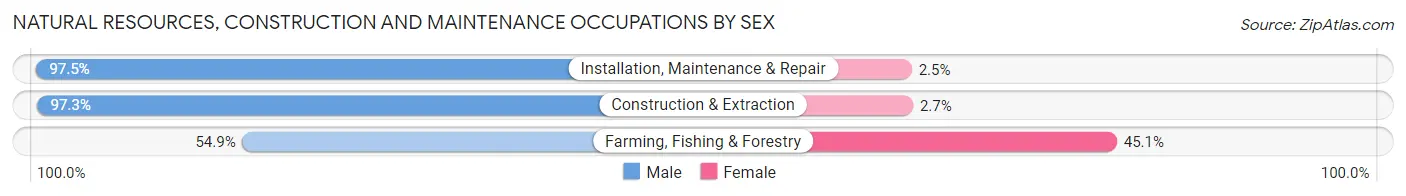
| Occupation | Male | Female |
| Farming, Fishing & Forestry | 90 (54.9%) | 74 (45.1%) |
| Construction & Extraction | 1,329 (97.3%) | 37 (2.7%) |
| Installation, Maintenance & Repair | 1,112 (97.5%) | 28 (2.5%) |
| Total (Category) | 2,531 (94.8%) | 139 (5.2%) |
| Total (Overall) | 9,574 (57.1%) | 7,183 (42.9%) |
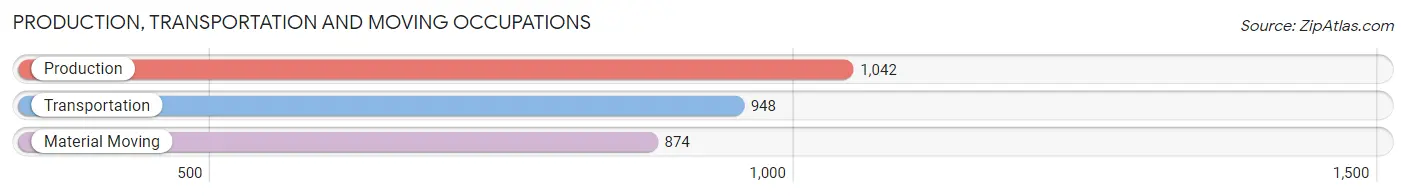
Production, Transportation and Moving Occupations
The most common Production, Transportation and Moving occupations in Stark County are Production (1,042 | 6.2%), Transportation (948 | 5.7%), and Material Moving (874 | 5.2%).
Production, Transportation and Moving Occupations by Sex
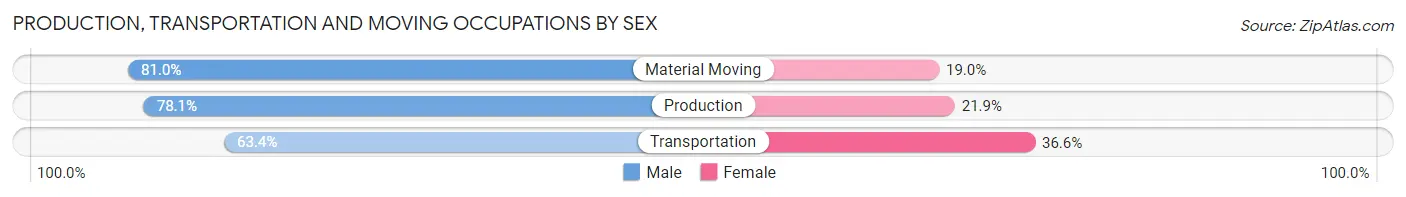
| Occupation | Male | Female |
| Production | 814 (78.1%) | 228 (21.9%) |
| Transportation | 601 (63.4%) | 347 (36.6%) |
| Material Moving | 708 (81.0%) | 166 (19.0%) |
| Total (Category) | 2,123 (74.1%) | 741 (25.9%) |
| Total (Overall) | 9,574 (57.1%) | 7,183 (42.9%) |
Employment Industries by Sex in Stark County
Employment Industries in Stark County
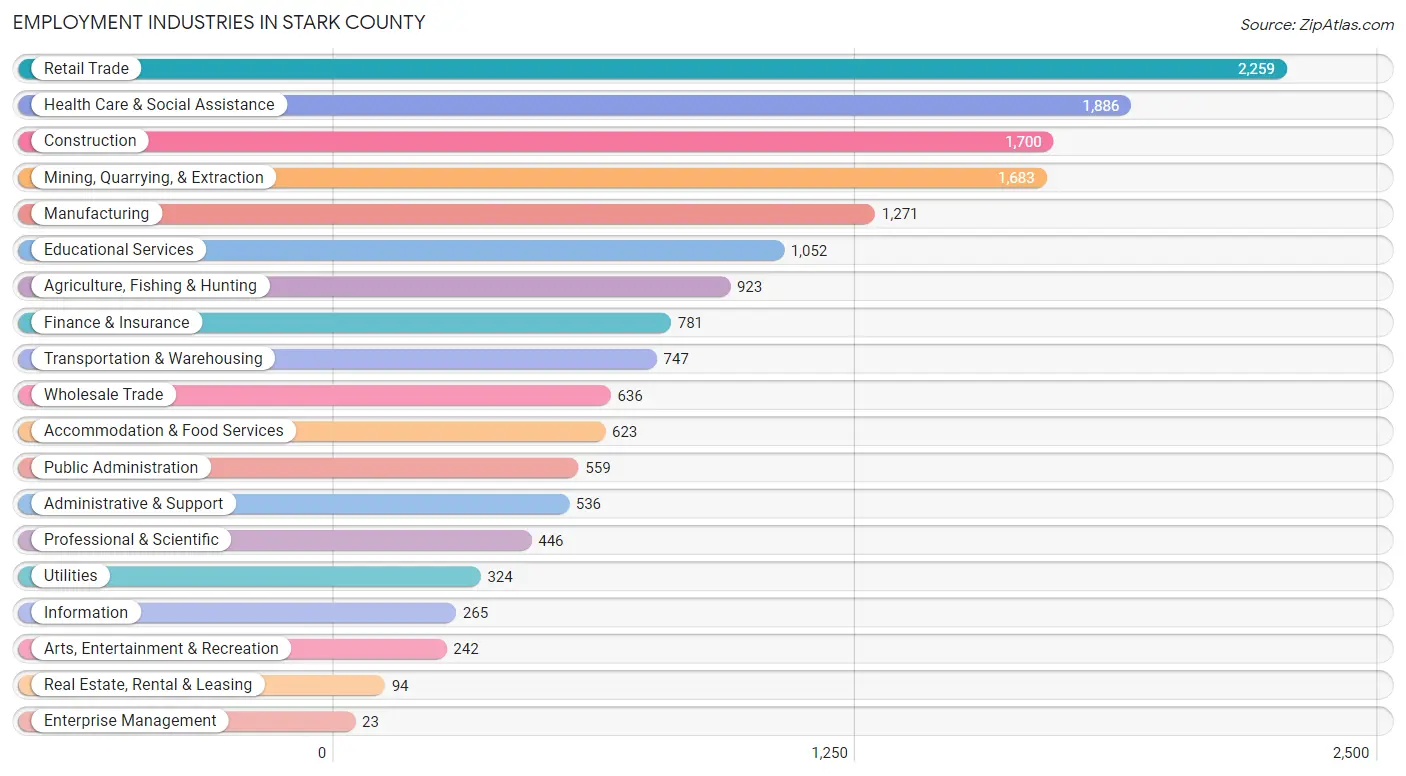
The major employment industries in Stark County include Retail Trade (2,259 | 13.5%), Health Care & Social Assistance (1,886 | 11.3%), Construction (1,700 | 10.2%), Mining, Quarrying, & Extraction (1,683 | 10.0%), and Manufacturing (1,271 | 7.6%).
Employment Industries by Sex in Stark County
The Stark County industries that see more men than women are Enterprise Management (100.0%), Utilities (92.3%), and Mining, Quarrying, & Extraction (90.7%), whereas the industries that tend to have a higher number of women are Health Care & Social Assistance (86.0%), Real Estate, Rental & Leasing (78.7%), and Educational Services (70.1%).
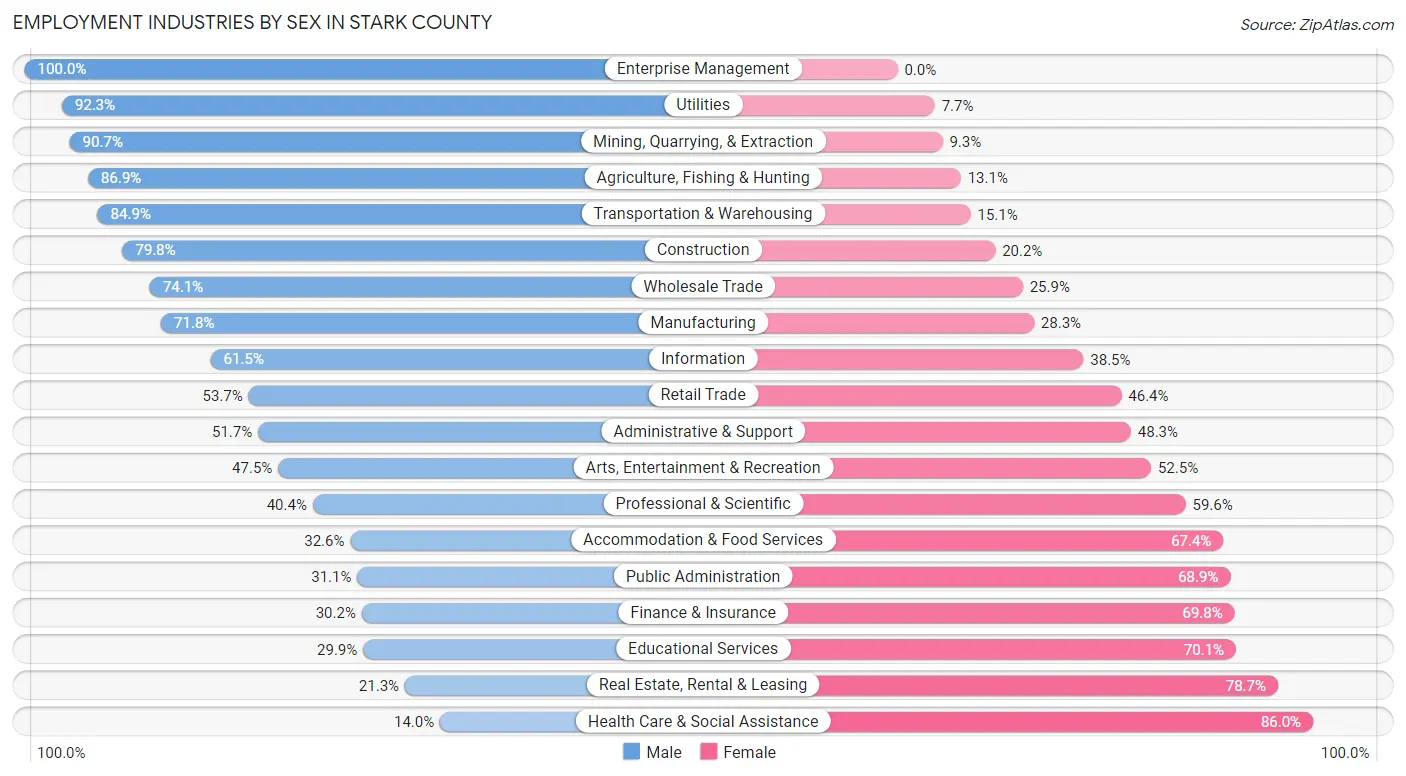
| Industry | Male | Female |
| Agriculture, Fishing & Hunting | 802 (86.9%) | 121 (13.1%) |
| Mining, Quarrying, & Extraction | 1,526 (90.7%) | 157 (9.3%) |
| Construction | 1,356 (79.8%) | 344 (20.2%) |
| Manufacturing | 912 (71.8%) | 359 (28.2%) |
| Wholesale Trade | 471 (74.1%) | 165 (25.9%) |
| Retail Trade | 1,212 (53.6%) | 1,047 (46.4%) |
| Transportation & Warehousing | 634 (84.9%) | 113 (15.1%) |
| Utilities | 299 (92.3%) | 25 (7.7%) |
| Information | 163 (61.5%) | 102 (38.5%) |
| Finance & Insurance | 236 (30.2%) | 545 (69.8%) |
| Real Estate, Rental & Leasing | 20 (21.3%) | 74 (78.7%) |
| Professional & Scientific | 180 (40.4%) | 266 (59.6%) |
| Enterprise Management | 23 (100.0%) | 0 (0.0%) |
| Administrative & Support | 277 (51.7%) | 259 (48.3%) |
| Educational Services | 315 (29.9%) | 737 (70.1%) |
| Health Care & Social Assistance | 264 (14.0%) | 1,622 (86.0%) |
| Arts, Entertainment & Recreation | 115 (47.5%) | 127 (52.5%) |
| Accommodation & Food Services | 203 (32.6%) | 420 (67.4%) |
| Public Administration | 174 (31.1%) | 385 (68.9%) |
| Total | 9,574 (57.1%) | 7,183 (42.9%) |
Education in Stark County
School Enrollment in Stark County
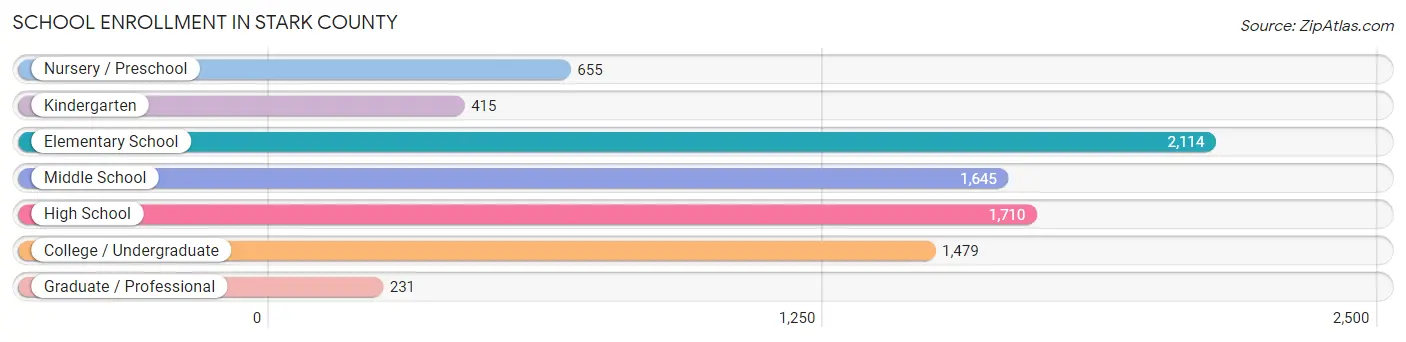
The most common levels of schooling among the 8,249 students in Stark County are elementary school (2,114 | 25.6%), high school (1,710 | 20.7%), and middle school (1,645 | 19.9%).
| School Level | # Students | % Students |
| Nursery / Preschool | 655 | 7.9% |
| Kindergarten | 415 | 5.0% |
| Elementary School | 2,114 | 25.6% |
| Middle School | 1,645 | 19.9% |
| High School | 1,710 | 20.7% |
| College / Undergraduate | 1,479 | 17.9% |
| Graduate / Professional | 231 | 2.8% |
| Total | 8,249 | 100.0% |
School Enrollment by Age by Funding Source in Stark County
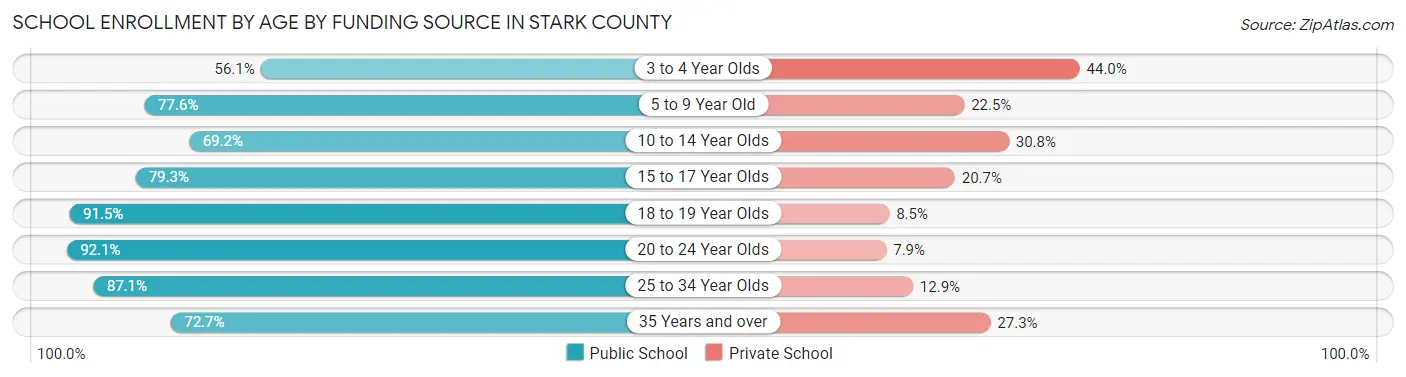
Out of a total of 8,249 students who are enrolled in schools in Stark County, 1,856 (22.5%) attend a private institution, while the remaining 6,393 (77.5%) are enrolled in public schools. The age group of 3 to 4 year olds has the highest likelihood of being enrolled in private schools, with 149 (44.0% in the age bracket) enrolled. Conversely, the age group of 20 to 24 year olds has the lowest likelihood of being enrolled in a private school, with 719 (92.1% in the age bracket) attending a public institution.
| Age Bracket | Public School | Private School |
| 3 to 4 Year Olds | 190 (56.0%) | 149 (44.0%) |
| 5 to 9 Year Old | 2,004 (77.5%) | 580 (22.5%) |
| 10 to 14 Year Olds | 1,407 (69.2%) | 625 (30.8%) |
| 15 to 17 Year Olds | 923 (79.3%) | 241 (20.7%) |
| 18 to 19 Year Olds | 561 (91.5%) | 52 (8.5%) |
| 20 to 24 Year Olds | 719 (92.1%) | 62 (7.9%) |
| 25 to 34 Year Olds | 351 (87.1%) | 52 (12.9%) |
| 35 Years and over | 242 (72.7%) | 91 (27.3%) |
| Total | 6,393 (77.5%) | 1,856 (22.5%) |
Educational Attainment by Field of Study in Stark County
Business (1,190 | 20.5%), education (798 | 13.8%), science & technology (550 | 9.5%), arts & humanities (460 | 7.9%), and engineering (417 | 7.2%) are the most common fields of study among 5,797 individuals in Stark County who have obtained a bachelor's degree or higher.
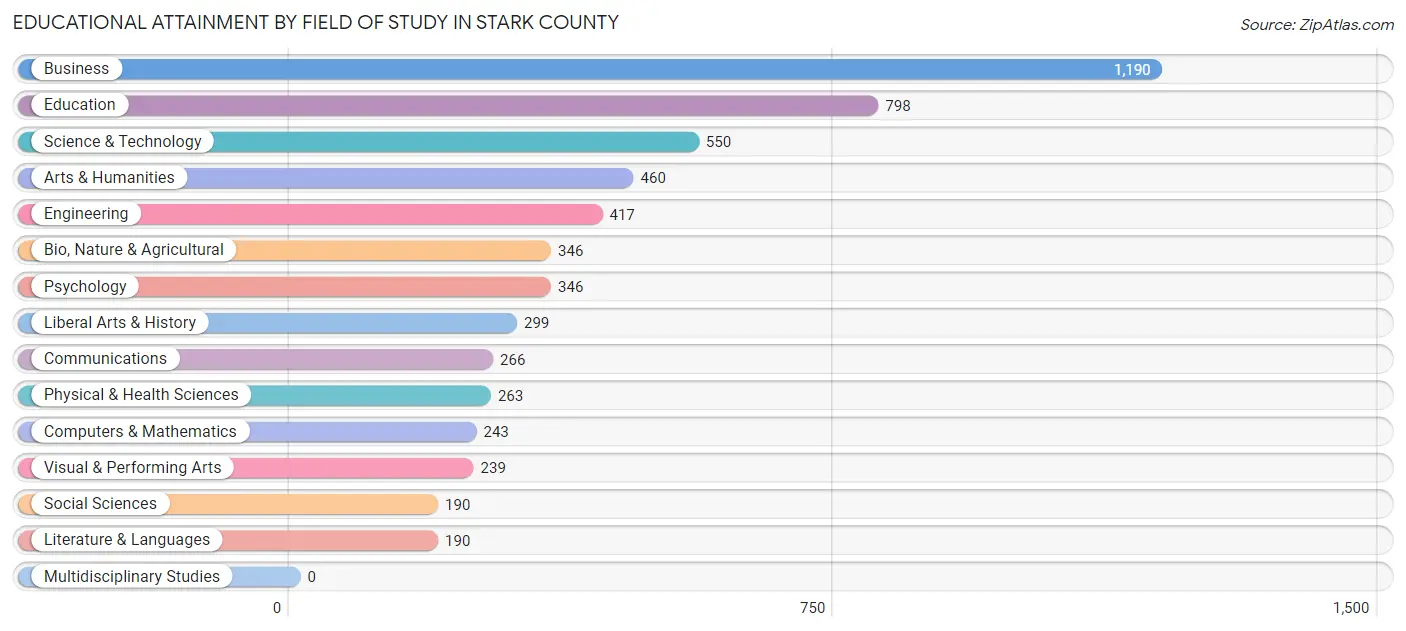
| Field of Study | # Graduates | % Graduates |
| Computers & Mathematics | 243 | 4.2% |
| Bio, Nature & Agricultural | 346 | 6.0% |
| Physical & Health Sciences | 263 | 4.5% |
| Psychology | 346 | 6.0% |
| Social Sciences | 190 | 3.3% |
| Engineering | 417 | 7.2% |
| Multidisciplinary Studies | 0 | 0.0% |
| Science & Technology | 550 | 9.5% |
| Business | 1,190 | 20.5% |
| Education | 798 | 13.8% |
| Literature & Languages | 190 | 3.3% |
| Liberal Arts & History | 299 | 5.2% |
| Visual & Performing Arts | 239 | 4.1% |
| Communications | 266 | 4.6% |
| Arts & Humanities | 460 | 7.9% |
| Total | 5,797 | 100.0% |
Transportation & Commute in Stark County
Vehicle Availability by Sex in Stark County
The most prevalent vehicle ownership categories in Stark County are males with 2 vehicles (3,909, accounting for 41.8%) and females with 2 vehicles (2,804, making up 55.7%).
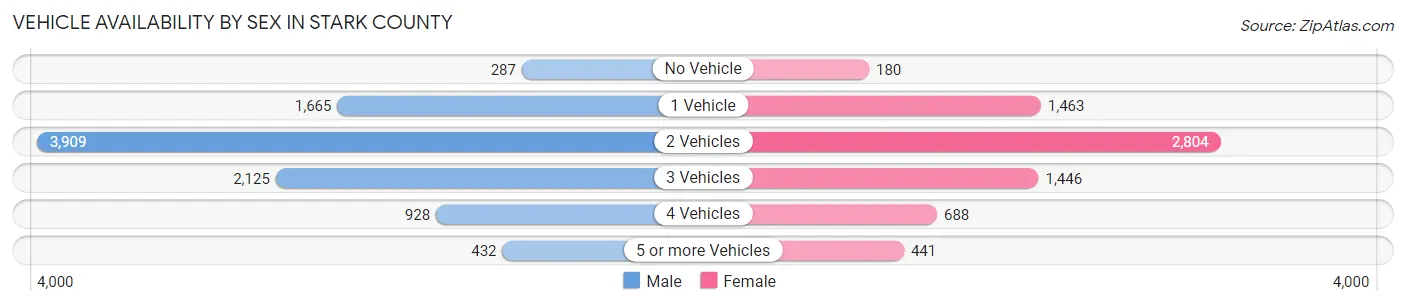
| Vehicles Available | Male | Female |
| No Vehicle | 287 (3.1%) | 180 (2.6%) |
| 1 Vehicle | 1,665 (17.8%) | 1,463 (20.8%) |
| 2 Vehicles | 3,909 (41.8%) | 2,804 (39.9%) |
| 3 Vehicles | 2,125 (22.7%) | 1,446 (20.6%) |
| 4 Vehicles | 928 (9.9%) | 688 (9.8%) |
| 5 or more Vehicles | 432 (4.6%) | 441 (6.3%) |
| Total | 9,346 (100.0%) | 7,022 (100.0%) |
Commute Time in Stark County
The most frequently occuring commute durations in Stark County are 5 to 9 minutes (4,325 commuters, 28.0%), 10 to 14 minutes (3,943 commuters, 25.5%), and 15 to 19 minutes (2,278 commuters, 14.7%).
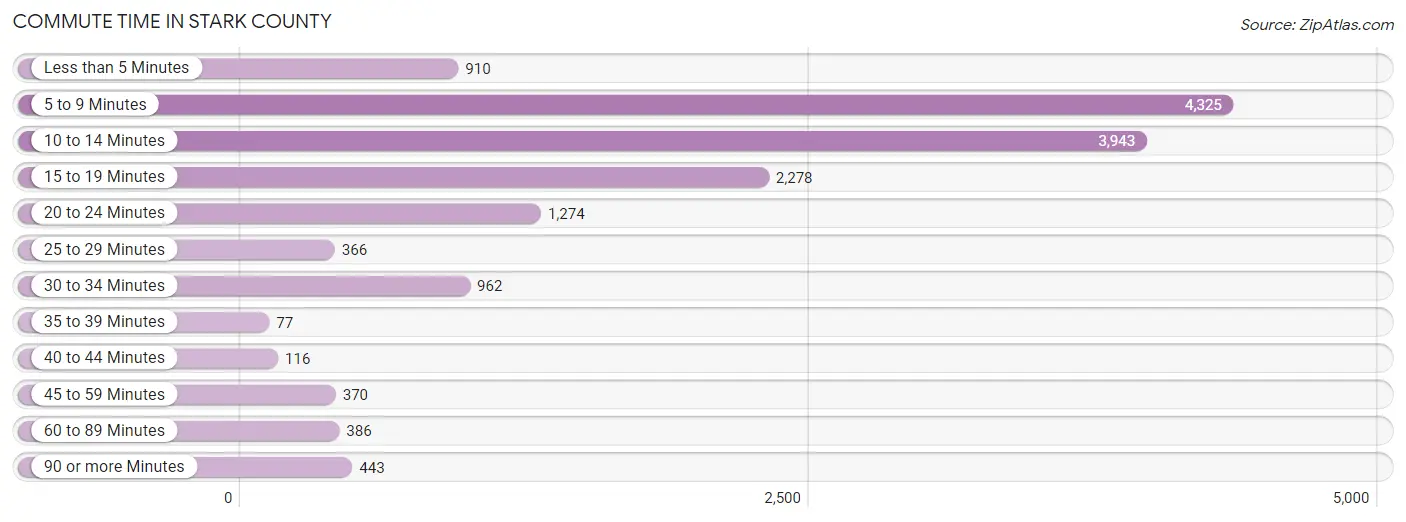
| Commute Time | # Commuters | % Commuters |
| Less than 5 Minutes | 910 | 5.9% |
| 5 to 9 Minutes | 4,325 | 28.0% |
| 10 to 14 Minutes | 3,943 | 25.5% |
| 15 to 19 Minutes | 2,278 | 14.7% |
| 20 to 24 Minutes | 1,274 | 8.3% |
| 25 to 29 Minutes | 366 | 2.4% |
| 30 to 34 Minutes | 962 | 6.2% |
| 35 to 39 Minutes | 77 | 0.5% |
| 40 to 44 Minutes | 116 | 0.7% |
| 45 to 59 Minutes | 370 | 2.4% |
| 60 to 89 Minutes | 386 | 2.5% |
| 90 or more Minutes | 443 | 2.9% |
Commute Time by Sex in Stark County
The most common commute times in Stark County are 5 to 9 minutes (2,217 commuters, 24.7%) for males and 5 to 9 minutes (2,108 commuters, 32.5%) for females.
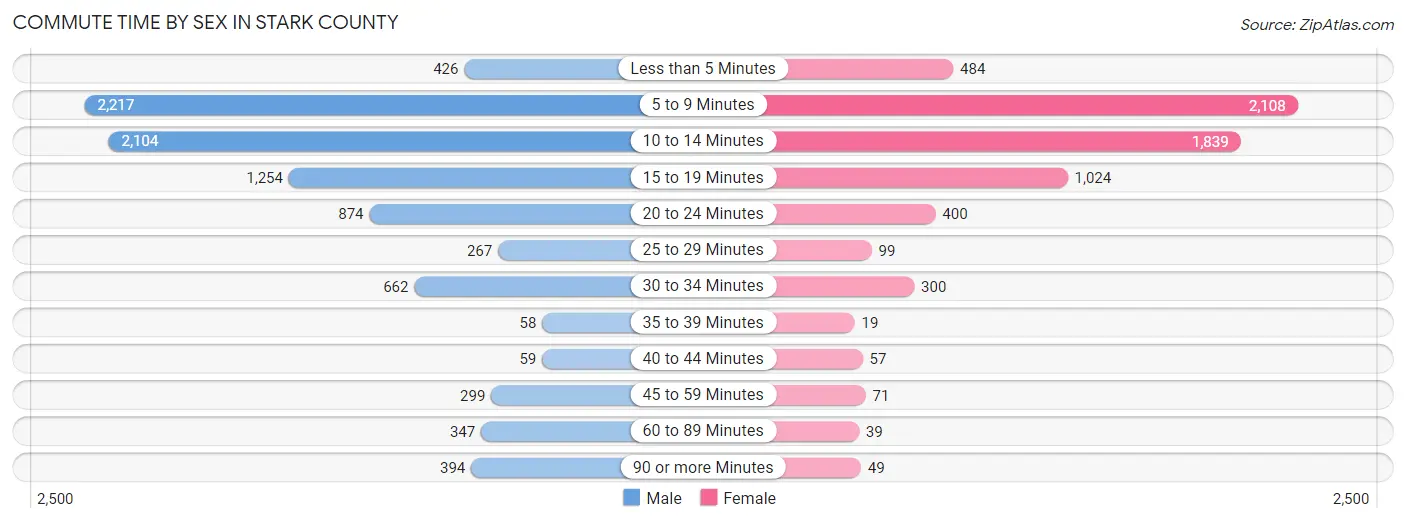
| Commute Time | Male | Female |
| Less than 5 Minutes | 426 (4.8%) | 484 (7.5%) |
| 5 to 9 Minutes | 2,217 (24.7%) | 2,108 (32.5%) |
| 10 to 14 Minutes | 2,104 (23.5%) | 1,839 (28.3%) |
| 15 to 19 Minutes | 1,254 (14.0%) | 1,024 (15.8%) |
| 20 to 24 Minutes | 874 (9.8%) | 400 (6.2%) |
| 25 to 29 Minutes | 267 (3.0%) | 99 (1.5%) |
| 30 to 34 Minutes | 662 (7.4%) | 300 (4.6%) |
| 35 to 39 Minutes | 58 (0.6%) | 19 (0.3%) |
| 40 to 44 Minutes | 59 (0.7%) | 57 (0.9%) |
| 45 to 59 Minutes | 299 (3.3%) | 71 (1.1%) |
| 60 to 89 Minutes | 347 (3.9%) | 39 (0.6%) |
| 90 or more Minutes | 394 (4.4%) | 49 (0.8%) |
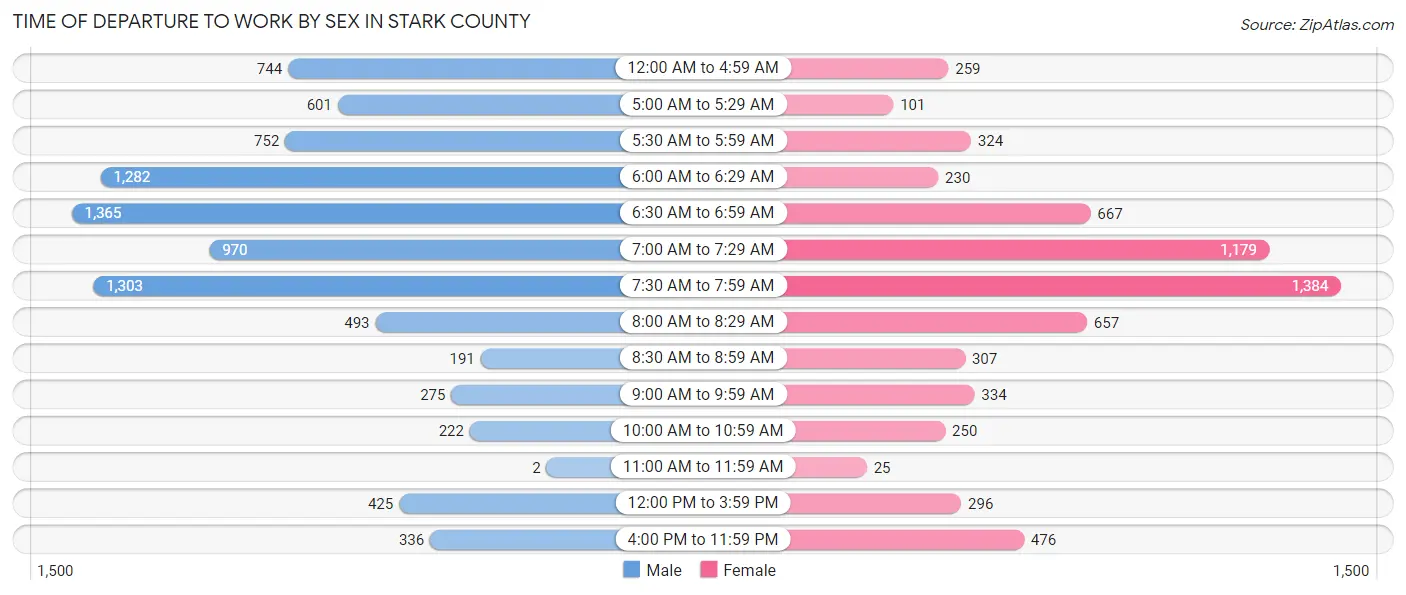
Time of Departure to Work by Sex in Stark County
The most frequent times of departure to work in Stark County are 6:30 AM to 6:59 AM (1,365, 15.2%) for males and 7:30 AM to 7:59 AM (1,384, 21.3%) for females.
| Time of Departure | Male | Female |
| 12:00 AM to 4:59 AM | 744 (8.3%) | 259 (4.0%) |
| 5:00 AM to 5:29 AM | 601 (6.7%) | 101 (1.6%) |
| 5:30 AM to 5:59 AM | 752 (8.4%) | 324 (5.0%) |
| 6:00 AM to 6:29 AM | 1,282 (14.3%) | 230 (3.5%) |
| 6:30 AM to 6:59 AM | 1,365 (15.2%) | 667 (10.3%) |
| 7:00 AM to 7:29 AM | 970 (10.8%) | 1,179 (18.2%) |
| 7:30 AM to 7:59 AM | 1,303 (14.5%) | 1,384 (21.3%) |
| 8:00 AM to 8:29 AM | 493 (5.5%) | 657 (10.1%) |
| 8:30 AM to 8:59 AM | 191 (2.1%) | 307 (4.7%) |
| 9:00 AM to 9:59 AM | 275 (3.1%) | 334 (5.1%) |
| 10:00 AM to 10:59 AM | 222 (2.5%) | 250 (3.8%) |
| 11:00 AM to 11:59 AM | 2 (0.0%) | 25 (0.4%) |
| 12:00 PM to 3:59 PM | 425 (4.7%) | 296 (4.6%) |
| 4:00 PM to 11:59 PM | 336 (3.7%) | 476 (7.3%) |
| Total | 8,961 (100.0%) | 6,489 (100.0%) |
Housing Occupancy in Stark County
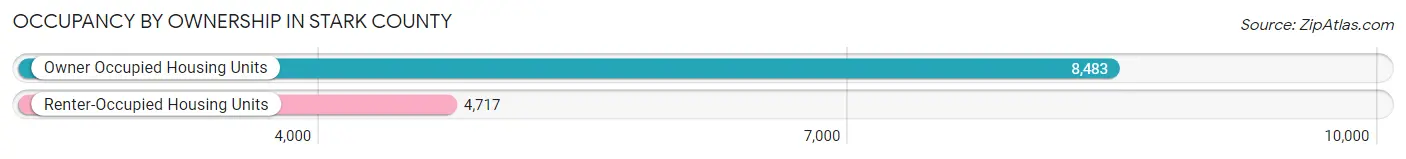
Occupancy by Ownership in Stark County
Of the total 13,200 dwellings in Stark County, owner-occupied units account for 8,483 (64.3%), while renter-occupied units make up 4,717 (35.7%).
| Occupancy | # Housing Units | % Housing Units |
| Owner Occupied Housing Units | 8,483 | 64.3% |
| Renter-Occupied Housing Units | 4,717 | 35.7% |
| Total Occupied Housing Units | 13,200 | 100.0% |
Occupancy by Household Size in Stark County
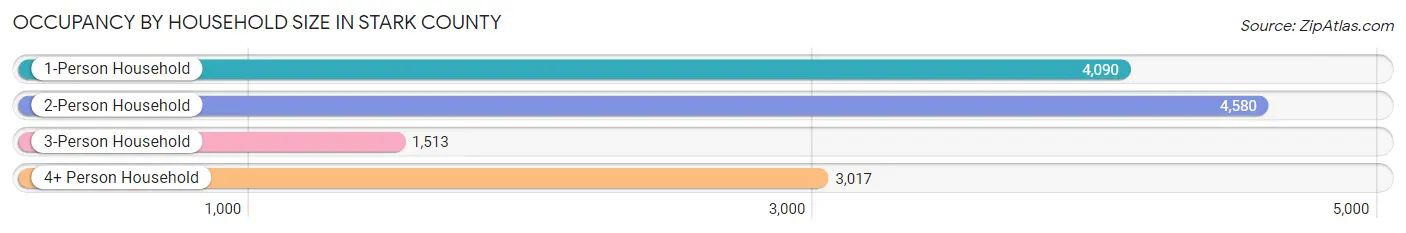
| Household Size | # Housing Units | % Housing Units |
| 1-Person Household | 4,090 | 31.0% |
| 2-Person Household | 4,580 | 34.7% |
| 3-Person Household | 1,513 | 11.5% |
| 4+ Person Household | 3,017 | 22.9% |
| Total Housing Units | 13,200 | 100.0% |
Occupancy by Ownership by Household Size in Stark County
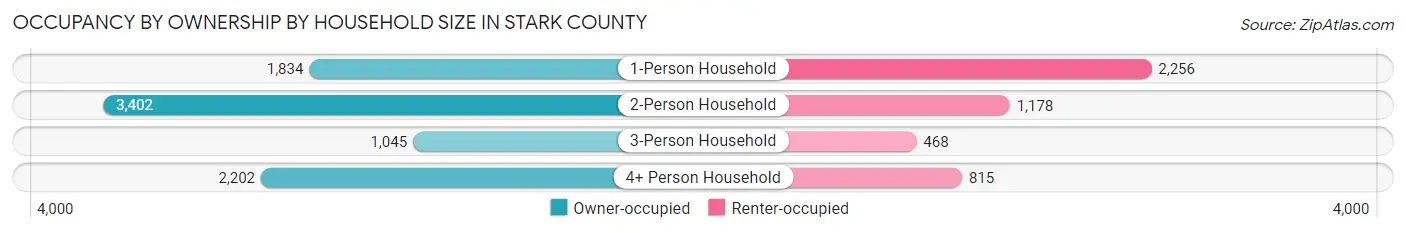
| Household Size | Owner-occupied | Renter-occupied |
| 1-Person Household | 1,834 (44.8%) | 2,256 (55.2%) |
| 2-Person Household | 3,402 (74.3%) | 1,178 (25.7%) |
| 3-Person Household | 1,045 (69.1%) | 468 (30.9%) |
| 4+ Person Household | 2,202 (73.0%) | 815 (27.0%) |
| Total Housing Units | 8,483 (64.3%) | 4,717 (35.7%) |
Occupancy by Educational Attainment in Stark County
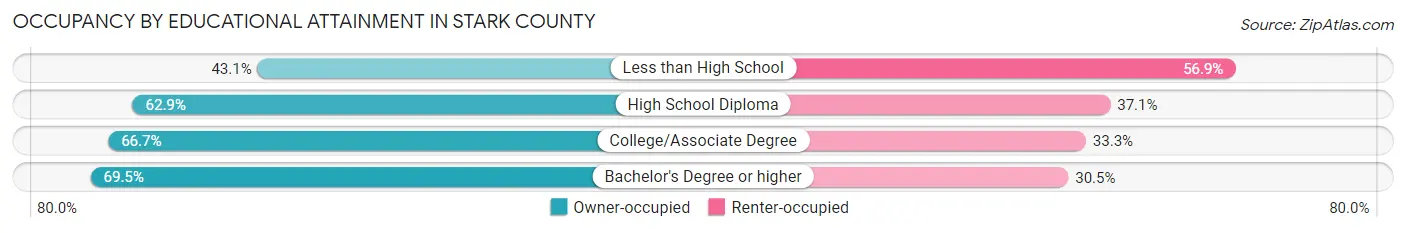
| Household Size | Owner-occupied | Renter-occupied |
| Less than High School | 453 (43.1%) | 599 (56.9%) |
| High School Diploma | 2,655 (62.9%) | 1,569 (37.1%) |
| College/Associate Degree | 3,197 (66.7%) | 1,594 (33.3%) |
| Bachelor's Degree or higher | 2,178 (69.5%) | 955 (30.5%) |
Occupancy by Age of Householder in Stark County
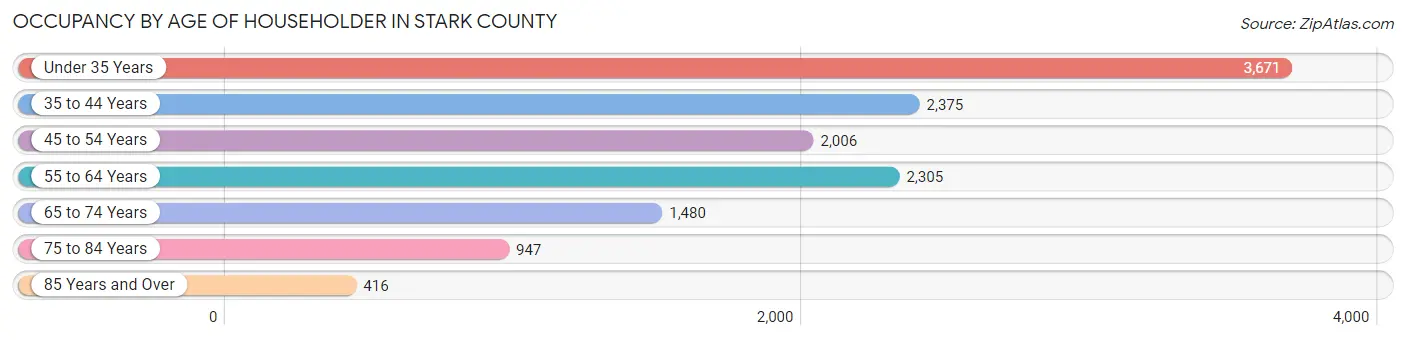
| Age Bracket | # Households | % Households |
| Under 35 Years | 3,671 | 27.8% |
| 35 to 44 Years | 2,375 | 18.0% |
| 45 to 54 Years | 2,006 | 15.2% |
| 55 to 64 Years | 2,305 | 17.5% |
| 65 to 74 Years | 1,480 | 11.2% |
| 75 to 84 Years | 947 | 7.2% |
| 85 Years and Over | 416 | 3.2% |
| Total | 13,200 | 100.0% |
Housing Finances in Stark County
Median Income by Occupancy in Stark County
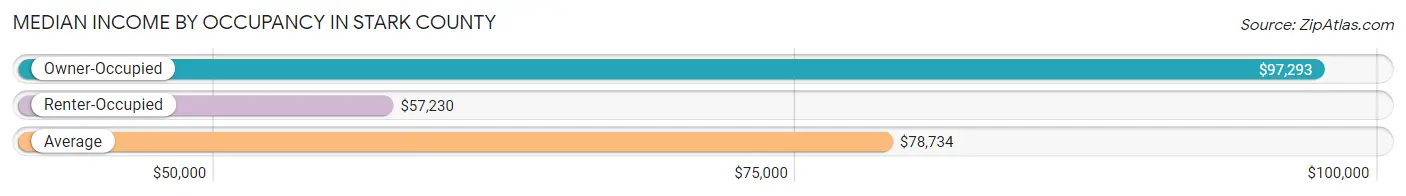
| Occupancy Type | # Households | Median Income |
| Owner-Occupied | 8,483 (64.3%) | $97,293 |
| Renter-Occupied | 4,717 (35.7%) | $57,230 |
| Average | 13,200 (100.0%) | $78,734 |
Occupancy by Householder Income Bracket in Stark County
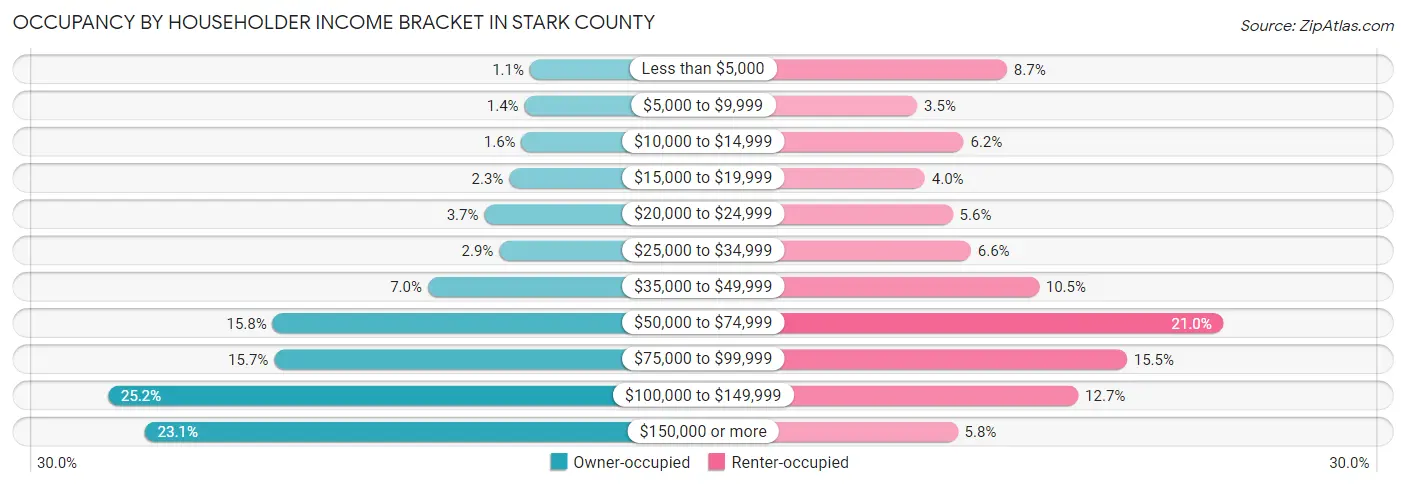
| Income Bracket | Owner-occupied | Renter-occupied |
| Less than $5,000 | 96 (1.1%) | 408 (8.6%) |
| $5,000 to $9,999 | 122 (1.4%) | 166 (3.5%) |
| $10,000 to $14,999 | 137 (1.6%) | 291 (6.2%) |
| $15,000 to $19,999 | 196 (2.3%) | 187 (4.0%) |
| $20,000 to $24,999 | 316 (3.7%) | 262 (5.6%) |
| $25,000 to $34,999 | 244 (2.9%) | 311 (6.6%) |
| $35,000 to $49,999 | 590 (7.0%) | 494 (10.5%) |
| $50,000 to $74,999 | 1,343 (15.8%) | 992 (21.0%) |
| $75,000 to $99,999 | 1,335 (15.7%) | 731 (15.5%) |
| $100,000 to $149,999 | 2,141 (25.2%) | 600 (12.7%) |
| $150,000 or more | 1,963 (23.1%) | 275 (5.8%) |
| Total | 8,483 (100.0%) | 4,717 (100.0%) |
Monthly Housing Cost Tiers in Stark County
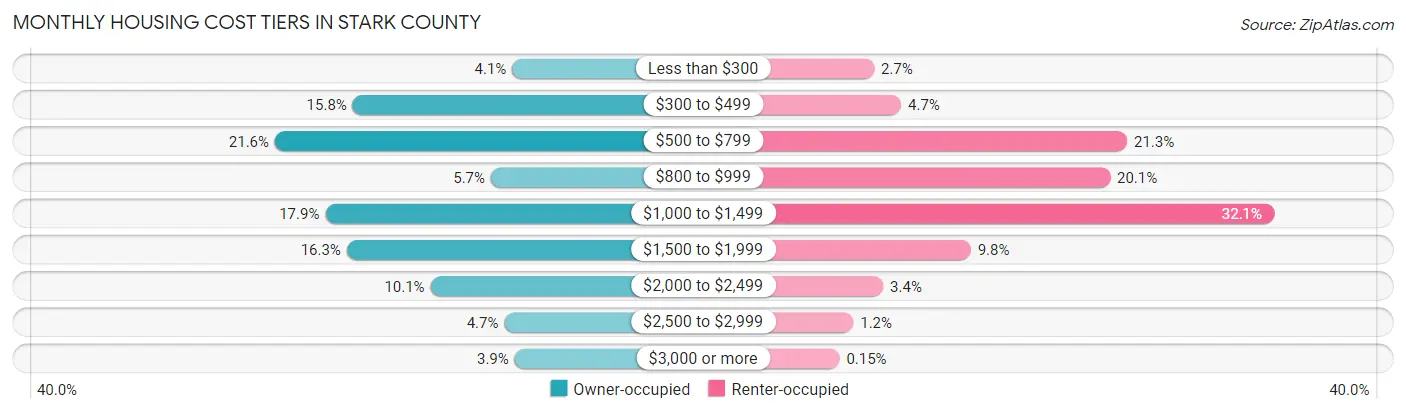
| Monthly Cost | Owner-occupied | Renter-occupied |
| Less than $300 | 347 (4.1%) | 127 (2.7%) |
| $300 to $499 | 1,344 (15.8%) | 221 (4.7%) |
| $500 to $799 | 1,830 (21.6%) | 1,006 (21.3%) |
| $800 to $999 | 480 (5.7%) | 947 (20.1%) |
| $1,000 to $1,499 | 1,515 (17.9%) | 1,516 (32.1%) |
| $1,500 to $1,999 | 1,381 (16.3%) | 463 (9.8%) |
| $2,000 to $2,499 | 858 (10.1%) | 159 (3.4%) |
| $2,500 to $2,999 | 396 (4.7%) | 55 (1.2%) |
| $3,000 or more | 332 (3.9%) | 7 (0.2%) |
| Total | 8,483 (100.0%) | 4,717 (100.0%) |
Physical Housing Characteristics in Stark County
Housing Structures in Stark County
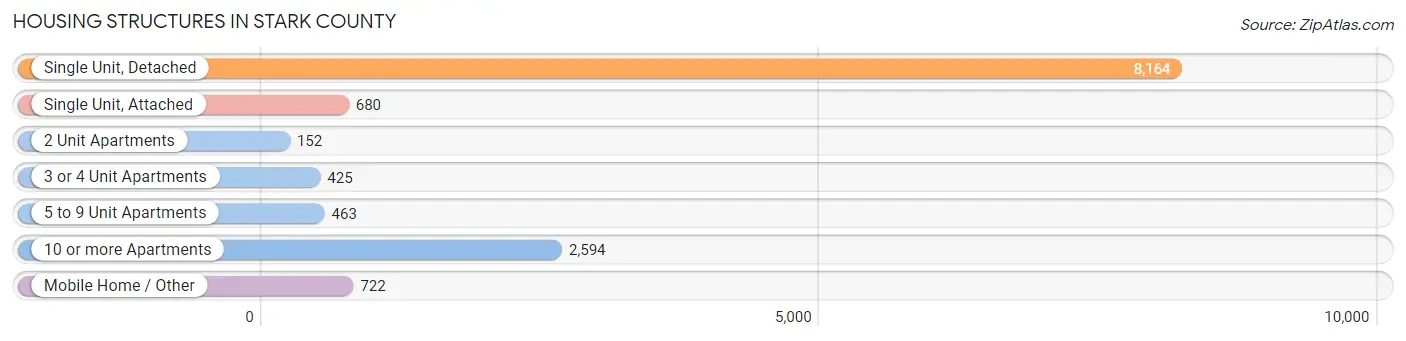
| Structure Type | # Housing Units | % Housing Units |
| Single Unit, Detached | 8,164 | 61.9% |
| Single Unit, Attached | 680 | 5.1% |
| 2 Unit Apartments | 152 | 1.1% |
| 3 or 4 Unit Apartments | 425 | 3.2% |
| 5 to 9 Unit Apartments | 463 | 3.5% |
| 10 or more Apartments | 2,594 | 19.7% |
| Mobile Home / Other | 722 | 5.5% |
| Total | 13,200 | 100.0% |
Housing Structures by Occupancy in Stark County
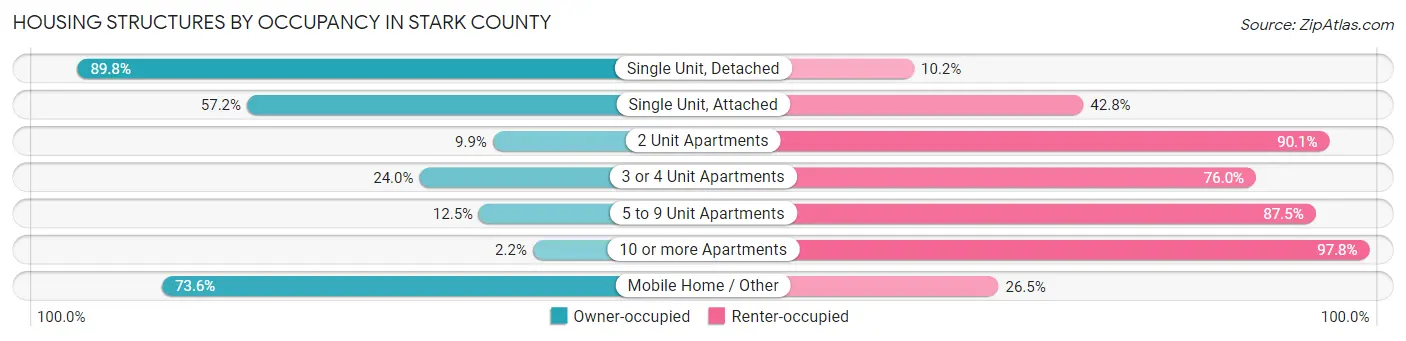
| Structure Type | Owner-occupied | Renter-occupied |
| Single Unit, Detached | 7,332 (89.8%) | 832 (10.2%) |
| Single Unit, Attached | 389 (57.2%) | 291 (42.8%) |
| 2 Unit Apartments | 15 (9.9%) | 137 (90.1%) |
| 3 or 4 Unit Apartments | 102 (24.0%) | 323 (76.0%) |
| 5 to 9 Unit Apartments | 58 (12.5%) | 405 (87.5%) |
| 10 or more Apartments | 56 (2.2%) | 2,538 (97.8%) |
| Mobile Home / Other | 531 (73.6%) | 191 (26.5%) |
| Total | 8,483 (64.3%) | 4,717 (35.7%) |
Housing Structures by Number of Rooms in Stark County
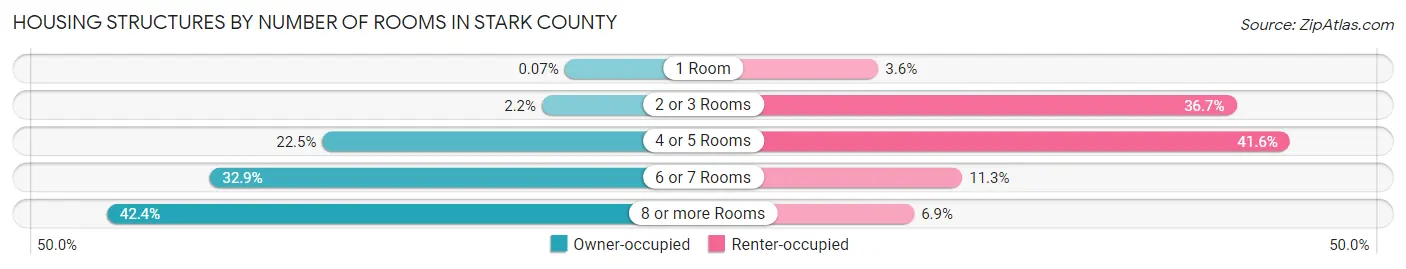
| Number of Rooms | Owner-occupied | Renter-occupied |
| 1 Room | 6 (0.1%) | 168 (3.6%) |
| 2 or 3 Rooms | 183 (2.2%) | 1,729 (36.6%) |
| 4 or 5 Rooms | 1,906 (22.5%) | 1,962 (41.6%) |
| 6 or 7 Rooms | 2,792 (32.9%) | 534 (11.3%) |
| 8 or more Rooms | 3,596 (42.4%) | 324 (6.9%) |
| Total | 8,483 (100.0%) | 4,717 (100.0%) |
Housing Structure by Heating Type in Stark County
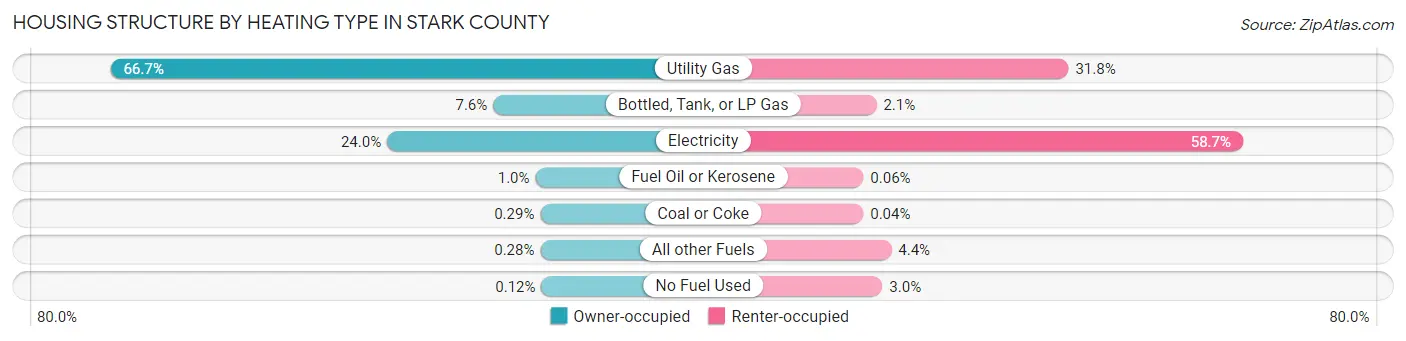
| Heating Type | Owner-occupied | Renter-occupied |
| Utility Gas | 5,660 (66.7%) | 1,498 (31.8%) |
| Bottled, Tank, or LP Gas | 642 (7.6%) | 98 (2.1%) |
| Electricity | 2,034 (24.0%) | 2,769 (58.7%) |
| Fuel Oil or Kerosene | 88 (1.0%) | 3 (0.1%) |
| Coal or Coke | 25 (0.3%) | 2 (0.0%) |
| All other Fuels | 24 (0.3%) | 206 (4.4%) |
| No Fuel Used | 10 (0.1%) | 141 (3.0%) |
| Total | 8,483 (100.0%) | 4,717 (100.0%) |
Household Vehicle Usage in Stark County
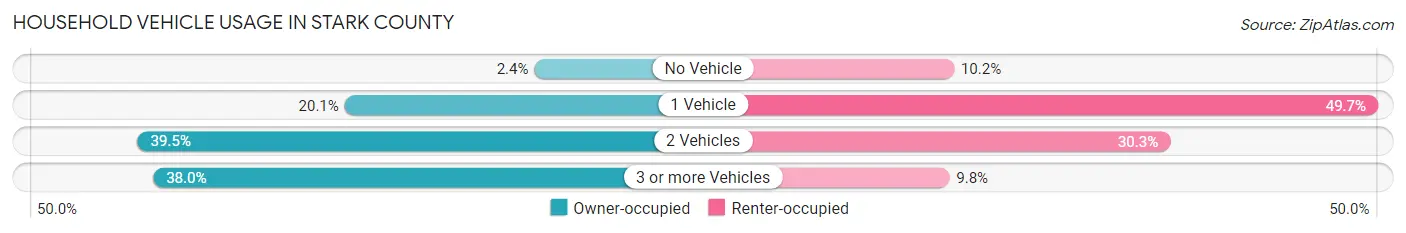
| Vehicles per Household | Owner-occupied | Renter-occupied |
| No Vehicle | 205 (2.4%) | 480 (10.2%) |
| 1 Vehicle | 1,708 (20.1%) | 2,346 (49.7%) |
| 2 Vehicles | 3,347 (39.5%) | 1,431 (30.3%) |
| 3 or more Vehicles | 3,223 (38.0%) | 460 (9.8%) |
| Total | 8,483 (100.0%) | 4,717 (100.0%) |
Real Estate & Mortgages in Stark County
Real Estate and Mortgage Overview in Stark County
| Characteristic | Without Mortgage | With Mortgage |
| Housing Units | 3,808 | 4,675 |
| Median Property Value | $246,700 | $263,900 |
| Median Household Income | $81,147 | $1,245 |
| Monthly Housing Costs | $531 | $323 |
| Real Estate Taxes | $2,111 | $95 |
Property Value by Mortgage Status in Stark County
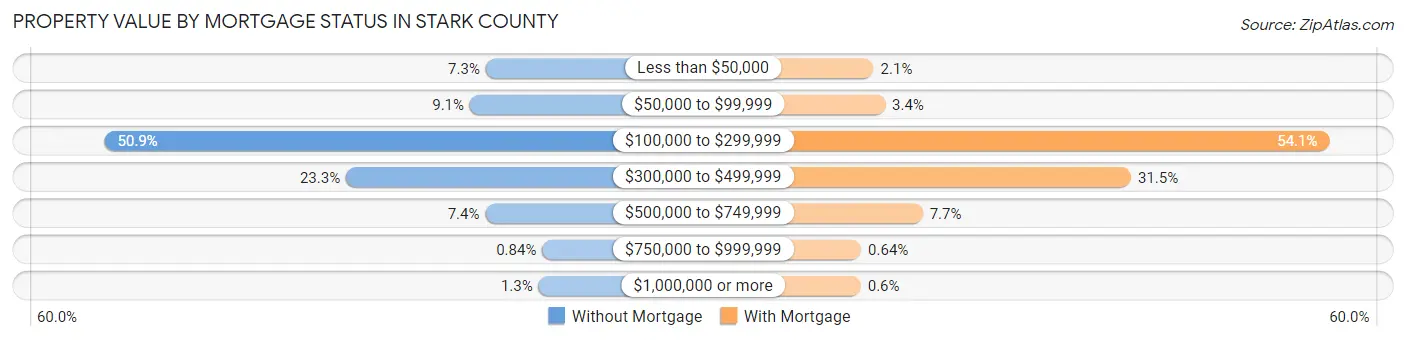
| Property Value | Without Mortgage | With Mortgage |
| Less than $50,000 | 278 (7.3%) | 97 (2.1%) |
| $50,000 to $99,999 | 347 (9.1%) | 158 (3.4%) |
| $100,000 to $299,999 | 1,937 (50.9%) | 2,531 (54.1%) |
| $300,000 to $499,999 | 886 (23.3%) | 1,472 (31.5%) |
| $500,000 to $749,999 | 280 (7.3%) | 359 (7.7%) |
| $750,000 to $999,999 | 32 (0.8%) | 30 (0.6%) |
| $1,000,000 or more | 48 (1.3%) | 28 (0.6%) |
| Total | 3,808 (100.0%) | 4,675 (100.0%) |
Household Income by Mortgage Status in Stark County
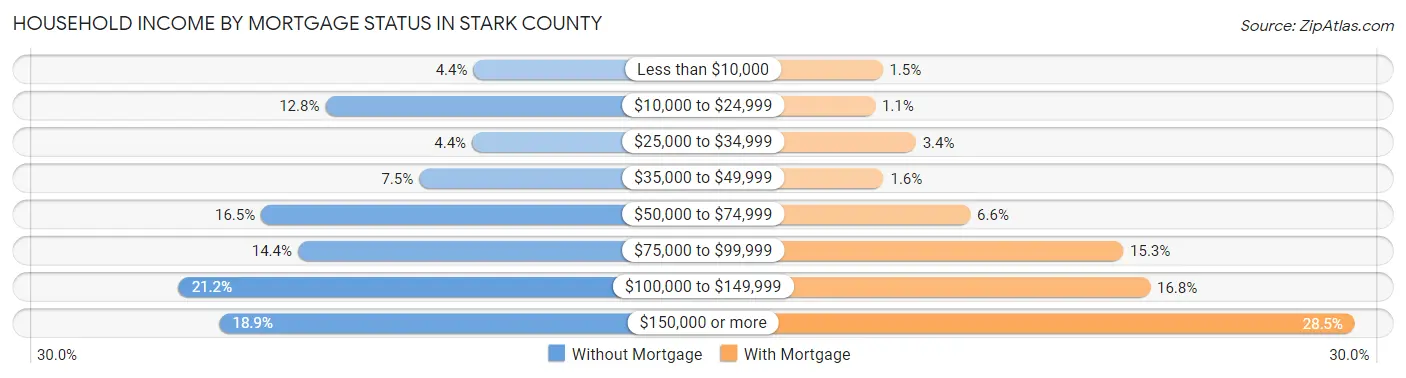
| Household Income | Without Mortgage | With Mortgage |
| Less than $10,000 | 166 (4.4%) | 72 (1.5%) |
| $10,000 to $24,999 | 488 (12.8%) | 52 (1.1%) |
| $25,000 to $34,999 | 169 (4.4%) | 161 (3.4%) |
| $35,000 to $49,999 | 284 (7.5%) | 75 (1.6%) |
| $50,000 to $74,999 | 628 (16.5%) | 306 (6.6%) |
| $75,000 to $99,999 | 548 (14.4%) | 715 (15.3%) |
| $100,000 to $149,999 | 807 (21.2%) | 787 (16.8%) |
| $150,000 or more | 718 (18.9%) | 1,334 (28.5%) |
| Total | 3,808 (100.0%) | 4,675 (100.0%) |
Property Value to Household Income Ratio in Stark County
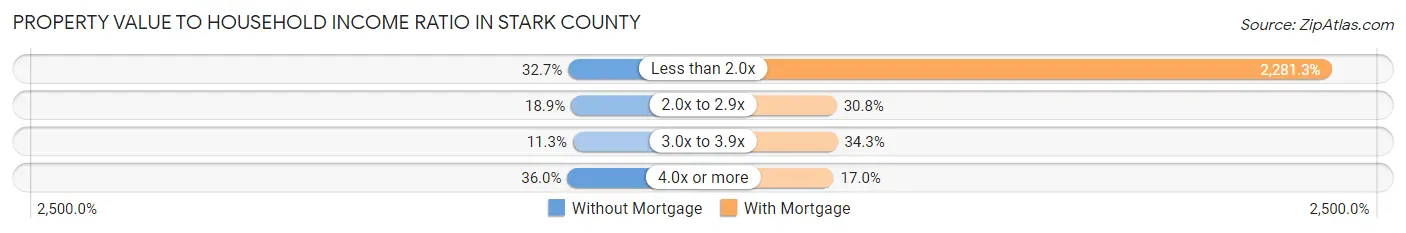
| Value-to-Income Ratio | Without Mortgage | With Mortgage |
| Less than 2.0x | 1,244 (32.7%) | 106,651 (2,281.3%) |
| 2.0x to 2.9x | 719 (18.9%) | 1,439 (30.8%) |
| 3.0x to 3.9x | 432 (11.3%) | 1,605 (34.3%) |
| 4.0x or more | 1,372 (36.0%) | 793 (17.0%) |
| Total | 3,808 (100.0%) | 4,675 (100.0%) |
Real Estate Taxes by Mortgage Status in Stark County
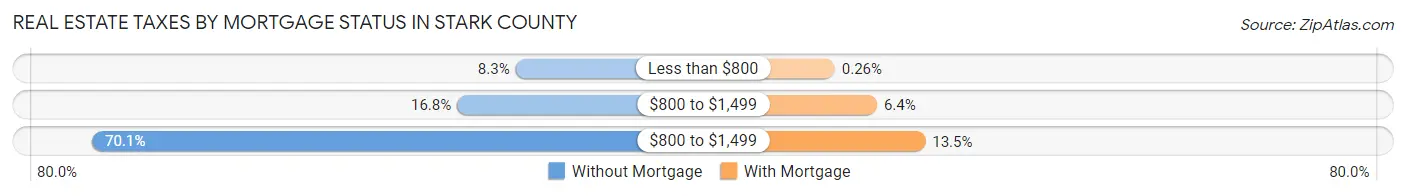
| Property Taxes | Without Mortgage | With Mortgage |
| Less than $800 | 315 (8.3%) | 12 (0.3%) |
| $800 to $1,499 | 640 (16.8%) | 300 (6.4%) |
| $800 to $1,499 | 2,671 (70.1%) | 630 (13.5%) |
| Total | 3,808 (100.0%) | 4,675 (100.0%) |
Health & Disability in Stark County
Health Insurance Coverage by Age in Stark County
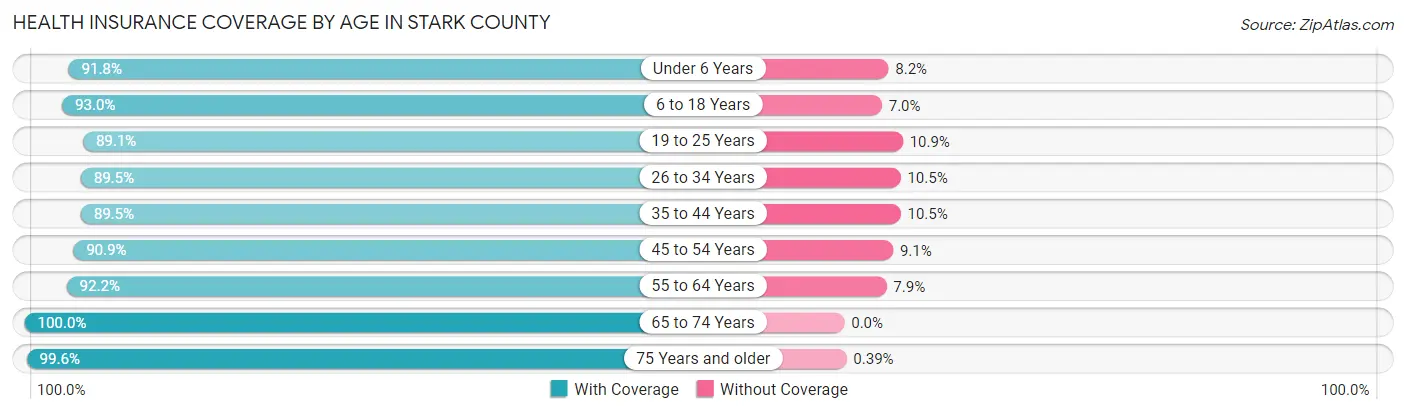
| Age Bracket | With Coverage | Without Coverage |
| Under 6 Years | 3,151 (91.8%) | 282 (8.2%) |
| 6 to 18 Years | 5,603 (93.0%) | 421 (7.0%) |
| 19 to 25 Years | 2,496 (89.1%) | 305 (10.9%) |
| 26 to 34 Years | 4,074 (89.5%) | 477 (10.5%) |
| 35 to 44 Years | 4,046 (89.5%) | 474 (10.5%) |
| 45 to 54 Years | 3,119 (90.9%) | 311 (9.1%) |
| 55 to 64 Years | 3,488 (92.1%) | 297 (7.9%) |
| 65 to 74 Years | 2,341 (100.0%) | 0 (0.0%) |
| 75 Years and older | 1,780 (99.6%) | 7 (0.4%) |
| Total | 30,098 (92.1%) | 2,574 (7.9%) |
Health Insurance Coverage by Citizenship Status in Stark County
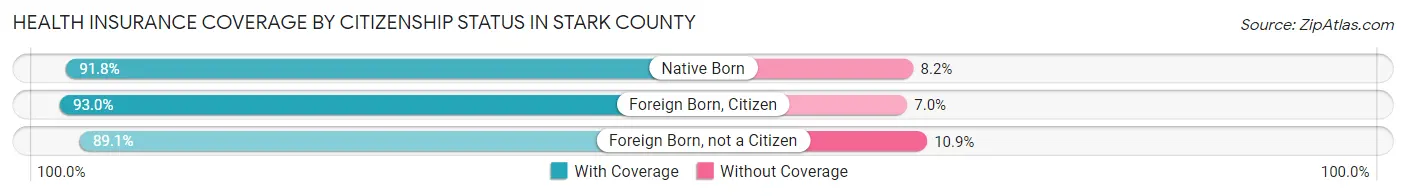
| Citizenship Status | With Coverage | Without Coverage |
| Native Born | 3,151 (91.8%) | 282 (8.2%) |
| Foreign Born, Citizen | 5,603 (93.0%) | 421 (7.0%) |
| Foreign Born, not a Citizen | 2,496 (89.1%) | 305 (10.9%) |
Health Insurance Coverage by Household Income in Stark County
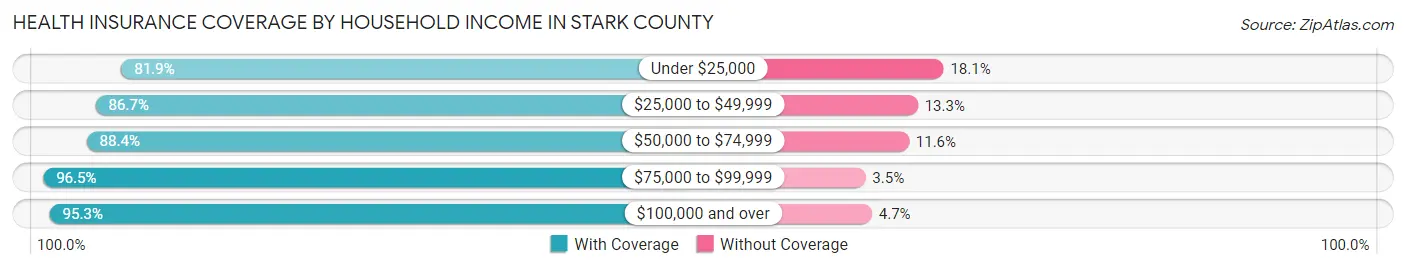
| Household Income | With Coverage | Without Coverage |
| Under $25,000 | 2,825 (81.9%) | 625 (18.1%) |
| $25,000 to $49,999 | 2,550 (86.7%) | 391 (13.3%) |
| $50,000 to $74,999 | 4,657 (88.4%) | 613 (11.6%) |
| $75,000 to $99,999 | 5,427 (96.5%) | 196 (3.5%) |
| $100,000 and over | 14,181 (95.3%) | 698 (4.7%) |
Public vs Private Health Insurance Coverage by Age in Stark County
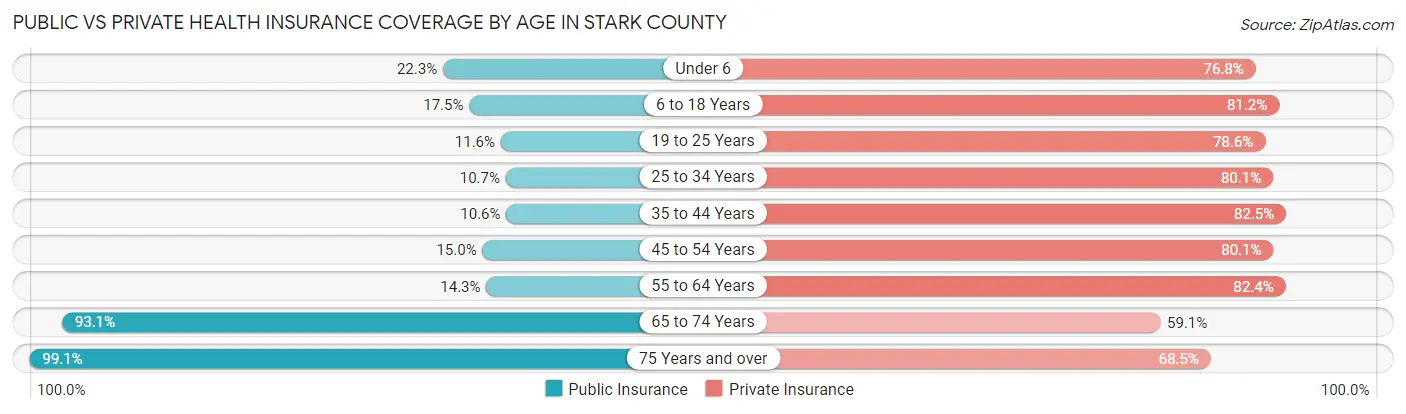
| Age Bracket | Public Insurance | Private Insurance |
| Under 6 | 767 (22.3%) | 2,637 (76.8%) |
| 6 to 18 Years | 1,052 (17.5%) | 4,889 (81.2%) |
| 19 to 25 Years | 325 (11.6%) | 2,201 (78.6%) |
| 25 to 34 Years | 486 (10.7%) | 3,643 (80.0%) |
| 35 to 44 Years | 478 (10.6%) | 3,727 (82.5%) |
| 45 to 54 Years | 515 (15.0%) | 2,747 (80.1%) |
| 55 to 64 Years | 541 (14.3%) | 3,118 (82.4%) |
| 65 to 74 Years | 2,179 (93.1%) | 1,383 (59.1%) |
| 75 Years and over | 1,771 (99.1%) | 1,224 (68.5%) |
| Total | 8,114 (24.8%) | 25,569 (78.3%) |
Disability Status by Sex by Age in Stark County
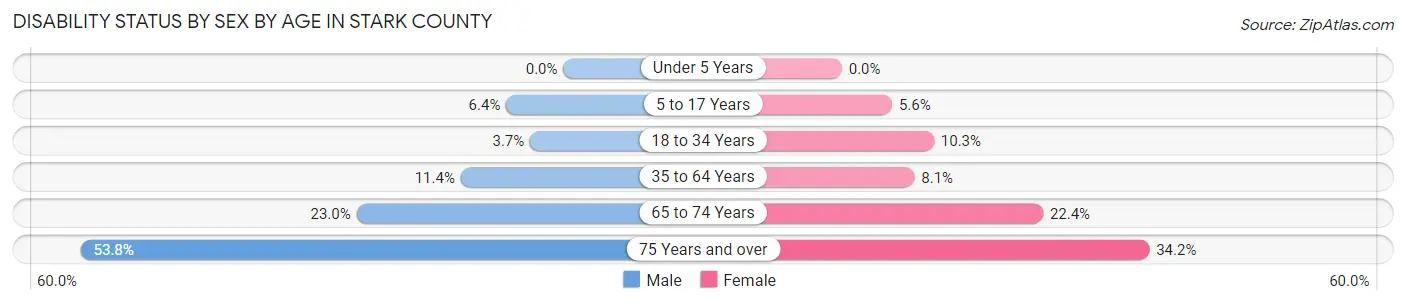
| Age Bracket | Male | Female |
| Under 5 Years | 0 (0.0%) | 0 (0.0%) |
| 5 to 17 Years | 217 (6.4%) | 160 (5.6%) |
| 18 to 34 Years | 153 (3.7%) | 377 (10.2%) |
| 35 to 64 Years | 713 (11.4%) | 444 (8.1%) |
| 65 to 74 Years | 280 (23.0%) | 252 (22.4%) |
| 75 Years and over | 386 (53.8%) | 366 (34.2%) |
Disability Class by Sex by Age in Stark County
Disability Class: Hearing Difficulty
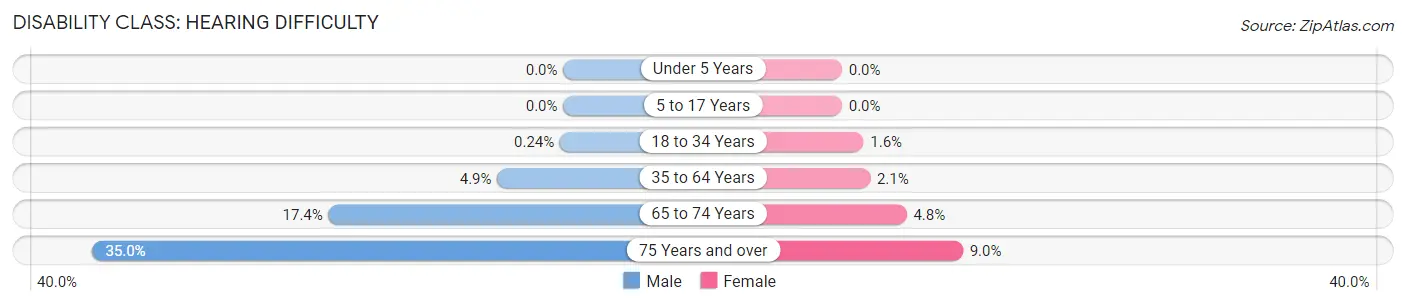
| Age Bracket | Male | Female |
| Under 5 Years | 0 (0.0%) | 0 (0.0%) |
| 5 to 17 Years | 0 (0.0%) | 0 (0.0%) |
| 18 to 34 Years | 10 (0.2%) | 59 (1.6%) |
| 35 to 64 Years | 306 (4.9%) | 115 (2.1%) |
| 65 to 74 Years | 212 (17.4%) | 54 (4.8%) |
| 75 Years and over | 251 (35.0%) | 96 (9.0%) |
Disability Class: Vision Difficulty
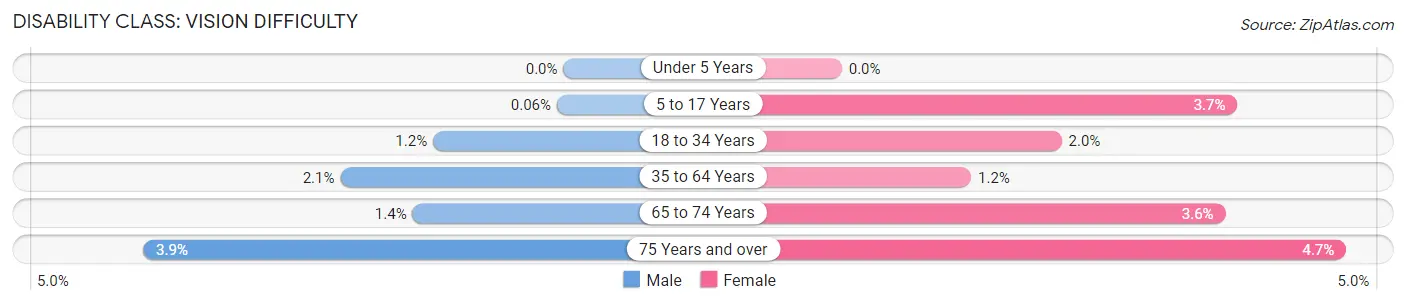
| Age Bracket | Male | Female |
| Under 5 Years | 0 (0.0%) | 0 (0.0%) |
| 5 to 17 Years | 2 (0.1%) | 105 (3.7%) |
| 18 to 34 Years | 50 (1.2%) | 75 (2.0%) |
| 35 to 64 Years | 129 (2.1%) | 66 (1.2%) |
| 65 to 74 Years | 17 (1.4%) | 40 (3.6%) |
| 75 Years and over | 28 (3.9%) | 50 (4.7%) |
Disability Class: Cognitive Difficulty
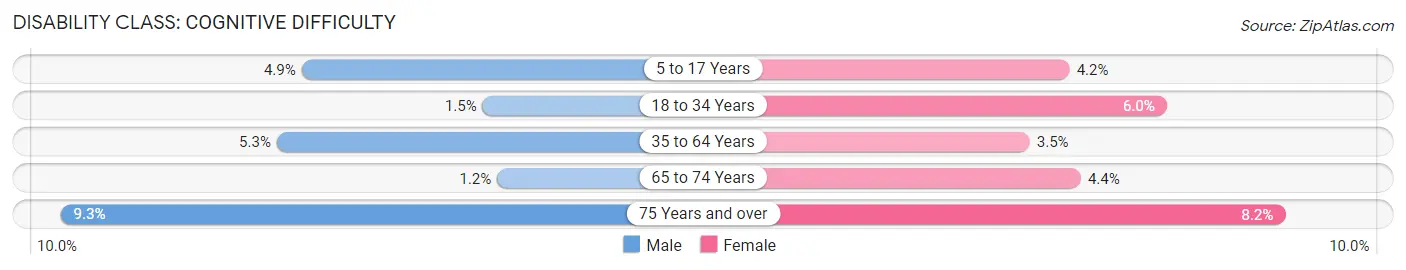
| Age Bracket | Male | Female |
| 5 to 17 Years | 166 (4.9%) | 121 (4.2%) |
| 18 to 34 Years | 62 (1.5%) | 222 (6.0%) |
| 35 to 64 Years | 332 (5.3%) | 192 (3.5%) |
| 65 to 74 Years | 15 (1.2%) | 50 (4.4%) |
| 75 Years and over | 67 (9.3%) | 88 (8.2%) |
Disability Class: Ambulatory Difficulty
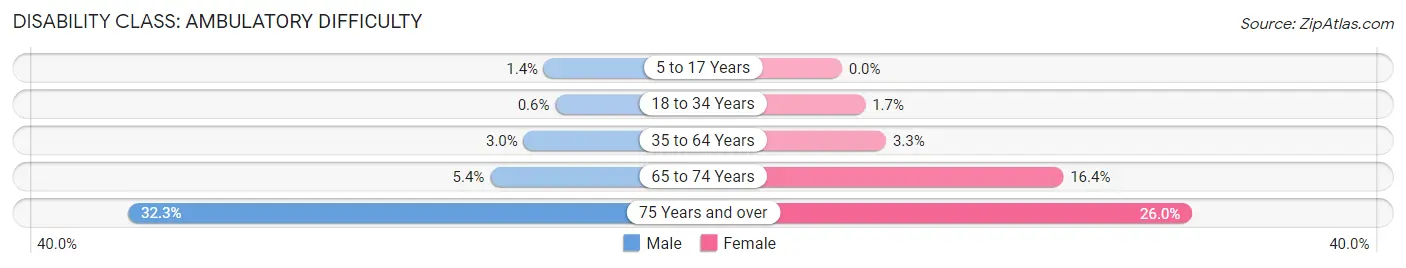
| Age Bracket | Male | Female |
| 5 to 17 Years | 49 (1.4%) | 0 (0.0%) |
| 18 to 34 Years | 25 (0.6%) | 64 (1.7%) |
| 35 to 64 Years | 184 (2.9%) | 180 (3.3%) |
| 65 to 74 Years | 66 (5.4%) | 185 (16.4%) |
| 75 Years and over | 232 (32.3%) | 278 (26.0%) |
Disability Class: Self-Care Difficulty
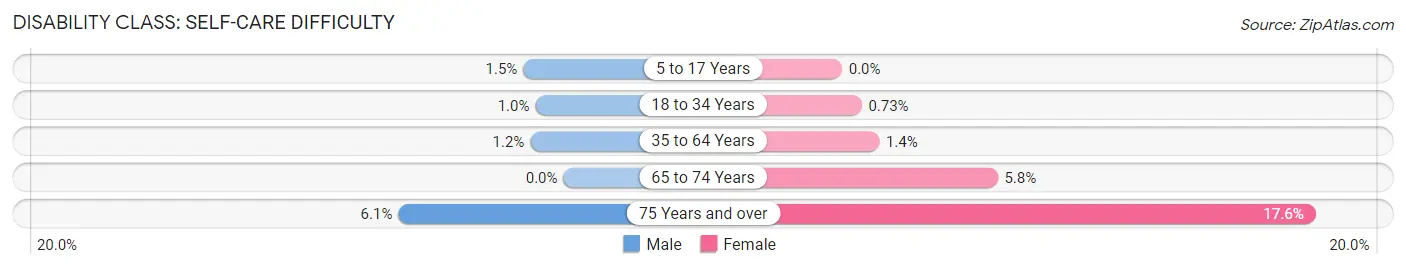
| Age Bracket | Male | Female |
| 5 to 17 Years | 51 (1.5%) | 0 (0.0%) |
| 18 to 34 Years | 43 (1.0%) | 27 (0.7%) |
| 35 to 64 Years | 77 (1.2%) | 76 (1.4%) |
| 65 to 74 Years | 0 (0.0%) | 65 (5.8%) |
| 75 Years and over | 44 (6.1%) | 188 (17.6%) |
Technology Access in Stark County
Computing Device Access in Stark County
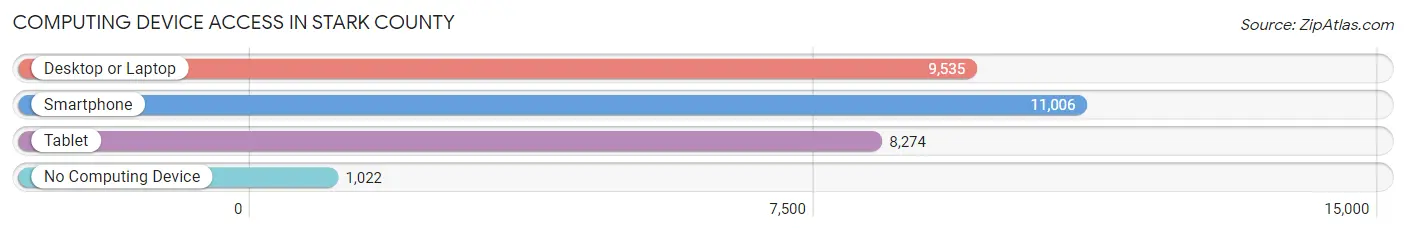
| Device Type | # Households | % Households |
| Desktop or Laptop | 9,535 | 72.2% |
| Smartphone | 11,006 | 83.4% |
| Tablet | 8,274 | 62.7% |
| No Computing Device | 1,022 | 7.7% |
| Total | 13,200 | 100.0% |
Internet Access in Stark County
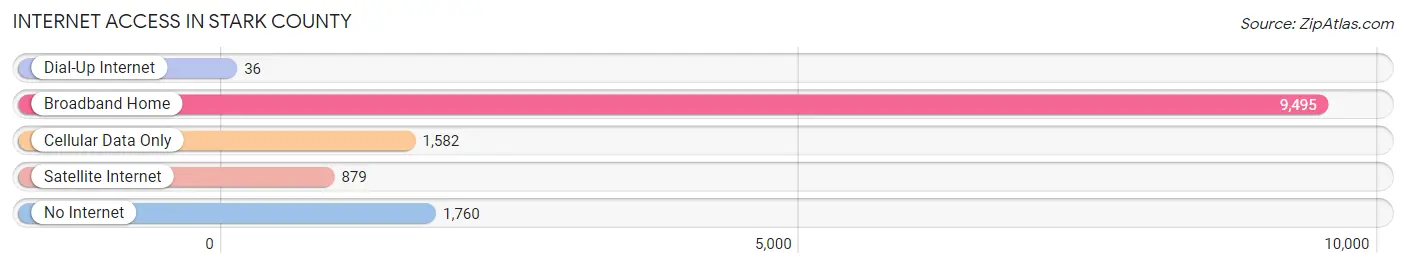
| Internet Type | # Households | % Households |
| Dial-Up Internet | 36 | 0.3% |
| Broadband Home | 9,495 | 71.9% |
| Cellular Data Only | 1,582 | 12.0% |
| Satellite Internet | 879 | 6.7% |
| No Internet | 1,760 | 13.3% |
| Total | 13,200 | 100.0% |
Stark County Summary
Stark County is located in the western part of North Dakota, and is part of the Dickinson Micropolitan Statistical Area. The county was established in 1883 and named after General John Stark, a Revolutionary War hero. As of the 2010 census, the population was 24,199, making it the fourth most populous county in the state.
Geography
Stark County is located in the western part of North Dakota, and is bordered by Billings County to the north, Dunn County to the east, Hettinger County to the south, and Adams County to the west. The county covers an area of 1,845 square miles, making it the fourth largest county in the state. The terrain is mostly flat, with rolling hills in the western part of the county. The county is drained by the Little Missouri River and its tributaries. The county is home to several lakes, including Lake Tschida, Lake Sakakawea, and Lake Audubon.
Economy
Stark County’s economy is largely based on agriculture, with wheat, barley, oats, and sunflowers being the main crops. Livestock production is also important, with cattle, sheep, and hogs being the main animals raised. Oil and gas production is also a major industry in the county, with the county being home to several oil and gas fields. Tourism is also an important part of the economy, with the county being home to several state parks and recreational areas.
Demographics
As of the 2010 census, there were 24,199 people, 9,845 households, and 6,845 families residing in the county. The population density was 13 people per square mile. The racial makeup of the county was 95.3% White, 0.7% Native American, 0.3% Asian, 0.1% Black or African American, 0.1% Pacific Islander, 2.2% from other races, and 1.3% from two or more races. Hispanic or Latino of any race were 4.2% of the population.
The median income for a household in the county was $45,945, and the median income for a family was $54,945. The per capita income for the county was $22,945. About 8.3% of families and 11.2% of the population were below the poverty line, including 14.2% of those under age 18 and 8.2% of those age 65 or over.
Conclusion
Stark County is a large county located in the western part of North Dakota. The county is largely rural, with agriculture and oil and gas production being the main industries. The population is mostly white, with a small percentage of Native Americans, Asians, and other races. The median income for a household in the county is slightly above the state average, and the poverty rate is slightly below the state average.
Common Questions
What is the Total Population of Stark County?
Total Population of Stark County is 32,989.
What is the Total Male Population of Stark County?
Total Male Population of Stark County is 17,290.
What is the Total Female Population of Stark County?
Total Female Population of Stark County is 15,699.
What is the Ratio of Males per 100 Females in Stark County?
There are 110.13 Males per 100 Females in Stark County.
What is the Ratio of Females per 100 Males in Stark County?
There are 90.80 Females per 100 Males in Stark County.
What is the Median Population Age in Stark County?
Median Population Age in Stark County is 34.3 Years.
What is the Average Family Size in Stark County
Average Family Size in Stark County is 3.1 People.
What is the Average Household Size in Stark County
Average Household Size in Stark County is 2.4 People.
What is Per Capita Income in Stark County?
Per Capita income in Stark County is $40,025.
What is the Median Family Income in Stark County?
Median Family Income in Stark County is $101,972.
What is the Median Household income in Stark County?
Median Household Income in Stark County is $78,734.
What is Income or Wage Gap in Stark County?
Income or Wage Gap in Stark County is 44.7%.
Women in Stark County earn 55.3 cents for every dollar earned by a man.
What is Family Income Deficit in Stark County?
Family Income Deficit in Stark County is $14,744.
Families that are below poverty line in Stark County earn $14,744 less on average than the poverty threshold level.
What is Inequality or Gini Index in Stark County?
Inequality or Gini Index in Stark County is 0.43.
How Large is the Labor Force in Stark County?
There are 17,262 People in the Labor Forcein in Stark County.
What is the Percentage of People in the Labor Force in Stark County?
69.0% of People are in the Labor Force in Stark County.
What is the Unemployment Rate in Stark County?
Unemployment Rate in Stark County is 2.9%.