Slope County, ND
Slope County Map
Slope County Overview
837
TOTAL POPULATION
466
MALE POPULATION
371
FEMALE POPULATION
125.61
MALES / 100 FEMALES
79.61
FEMALES / 100 MALES
54.1
MEDIAN AGE
2.8
AVG FAMILY SIZE
2.4
AVG HOUSEHOLD SIZE
$40,987
PER CAPITA INCOME
$80,972
AVG FAMILY INCOME
$70,625
AVG HOUSEHOLD INCOME
51.7%
WAGE / INCOME GAP [ % ]
48.3¢/ $1
WAGE / INCOME GAP [ $ ]
$4,293
FAMILY INCOME DEFICIT
0.44
INEQUALITY / GINI INDEX
440
LABOR FORCE [ PEOPLE ]
62.9%
PERCENT IN LABOR FORCE
4.5%
UNEMPLOYMENT RATE
Slope County Area Codes
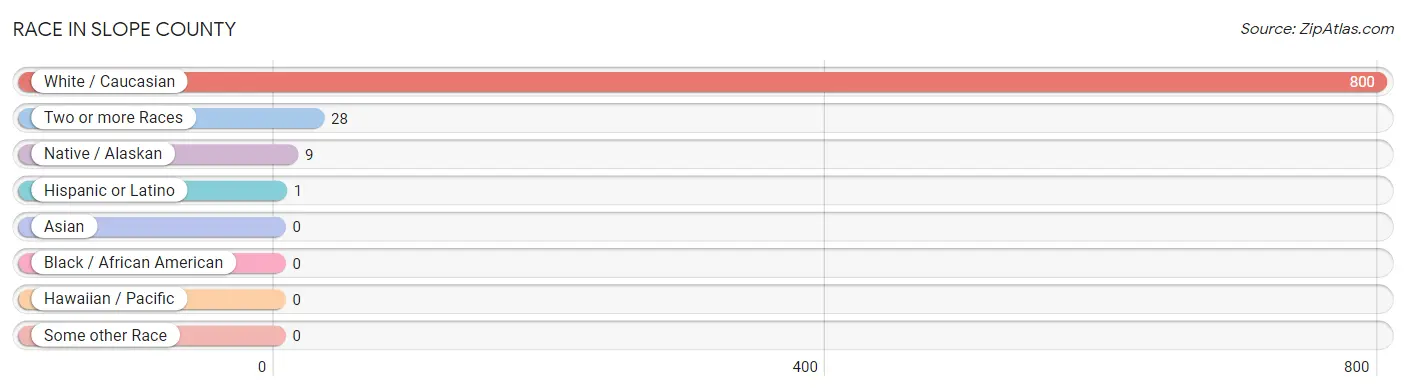
Race in Slope County
The most populous races in Slope County are White / Caucasian (800 | 95.6%), Two or more Races (28 | 3.4%), and Native / Alaskan (9 | 1.1%).
| Race | # Population | % Population |
| Asian | 0 | 0.0% |
| Black / African American | 0 | 0.0% |
| Hawaiian / Pacific | 0 | 0.0% |
| Hispanic or Latino | 1 | 0.1% |
| Native / Alaskan | 9 | 1.1% |
| White / Caucasian | 800 | 95.6% |
| Two or more Races | 28 | 3.4% |
| Some other Race | 0 | 0.0% |
| Total | 837 | 100.0% |
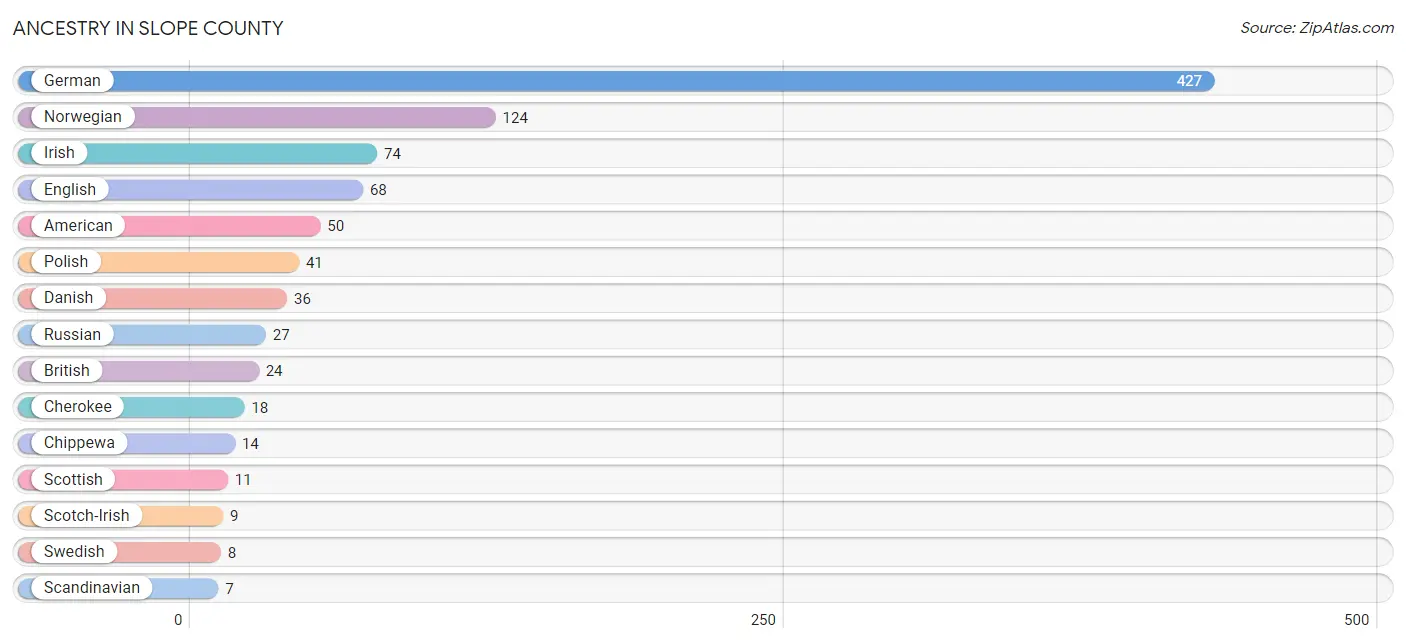
Ancestry in Slope County
The most populous ancestries reported in Slope County are German (427 | 51.0%), Norwegian (124 | 14.8%), Irish (74 | 8.8%), English (68 | 8.1%), and American (50 | 6.0%), together accounting for 88.8% of all Slope County residents.
| Ancestry | # Population | % Population |
| American | 50 | 6.0% |
| Brazilian | 4 | 0.5% |
| British | 24 | 2.9% |
| Bulgarian | 1 | 0.1% |
| Cherokee | 18 | 2.1% |
| Chippewa | 14 | 1.7% |
| Czech | 4 | 0.5% |
| Danish | 36 | 4.3% |
| Dutch | 5 | 0.6% |
| English | 68 | 8.1% |
| European | 5 | 0.6% |
| French | 5 | 0.6% |
| French Canadian | 4 | 0.5% |
| German | 427 | 51.0% |
| Irish | 74 | 8.8% |
| Mexican | 1 | 0.1% |
| Norwegian | 124 | 14.8% |
| Polish | 41 | 4.9% |
| Russian | 27 | 3.2% |
| Scandinavian | 7 | 0.8% |
| Scotch-Irish | 9 | 1.1% |
| Scottish | 11 | 1.3% |
| Swedish | 8 | 1.0% |
| Swiss | 4 | 0.5% | View All 24 Rows |
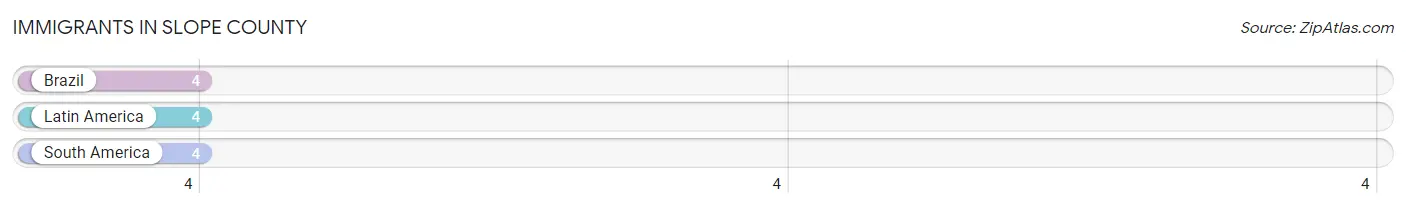
Immigrants in Slope County
The most numerous immigrant groups reported in Slope County came from Brazil (4 | 0.5%), Latin America (4 | 0.5%), and South America (4 | 0.5%), together accounting for 1.4% of all Slope County residents.
| Immigration Origin | # Population | % Population |
| Brazil | 4 | 0.5% |
| Latin America | 4 | 0.5% |
| South America | 4 | 0.5% | View All 3 Rows |
Sex and Age in Slope County
Sex and Age in Slope County
The most populous age groups in Slope County are 60 to 64 Years (64 | 13.7%) for men and 30 to 34 Years (40 | 10.8%) for women.
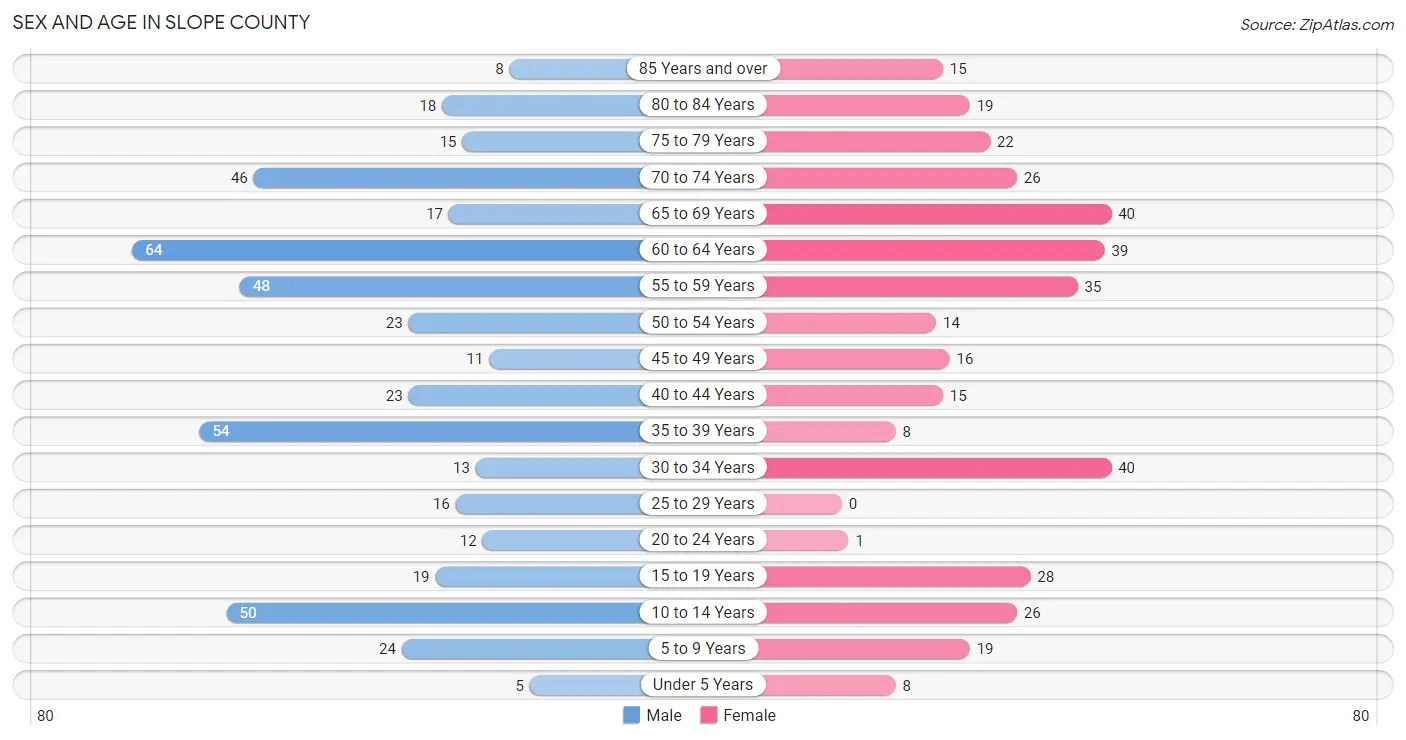
| Age Bracket | Male | Female |
| Under 5 Years | 5 (1.1%) | 8 (2.2%) |
| 5 to 9 Years | 24 (5.1%) | 19 (5.1%) |
| 10 to 14 Years | 50 (10.7%) | 26 (7.0%) |
| 15 to 19 Years | 19 (4.1%) | 28 (7.5%) |
| 20 to 24 Years | 12 (2.6%) | 1 (0.3%) |
| 25 to 29 Years | 16 (3.4%) | 0 (0.0%) |
| 30 to 34 Years | 13 (2.8%) | 40 (10.8%) |
| 35 to 39 Years | 54 (11.6%) | 8 (2.2%) |
| 40 to 44 Years | 23 (4.9%) | 15 (4.0%) |
| 45 to 49 Years | 11 (2.4%) | 16 (4.3%) |
| 50 to 54 Years | 23 (4.9%) | 14 (3.8%) |
| 55 to 59 Years | 48 (10.3%) | 35 (9.4%) |
| 60 to 64 Years | 64 (13.7%) | 39 (10.5%) |
| 65 to 69 Years | 17 (3.6%) | 40 (10.8%) |
| 70 to 74 Years | 46 (9.9%) | 26 (7.0%) |
| 75 to 79 Years | 15 (3.2%) | 22 (5.9%) |
| 80 to 84 Years | 18 (3.9%) | 19 (5.1%) |
| 85 Years and over | 8 (1.7%) | 15 (4.0%) |
| Total | 466 (100.0%) | 371 (100.0%) |
Families and Households in Slope County
Median Family Size in Slope County
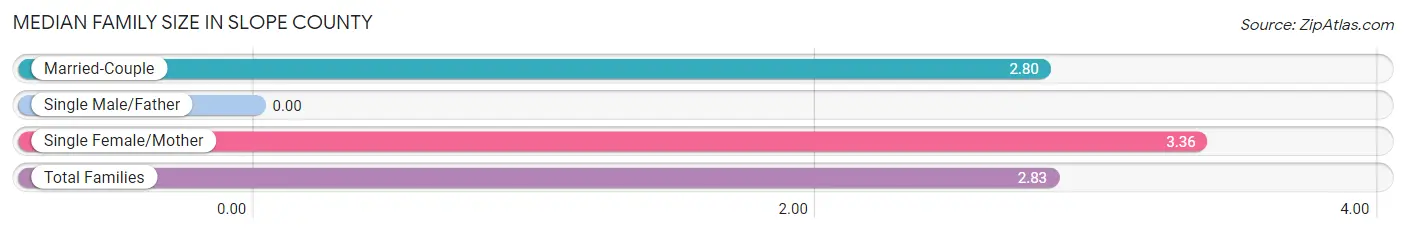
| Family Type | # Families | Family Size |
| Married-Couple | 239 (94.5%) | 2.80 |
| Single Male/Father | 0 (0.0%) | - |
| Single Female/Mother | 14 (5.5%) | 3.36 |
| Total Families | 253 (100.0%) | 2.83 |
Median Household Size in Slope County
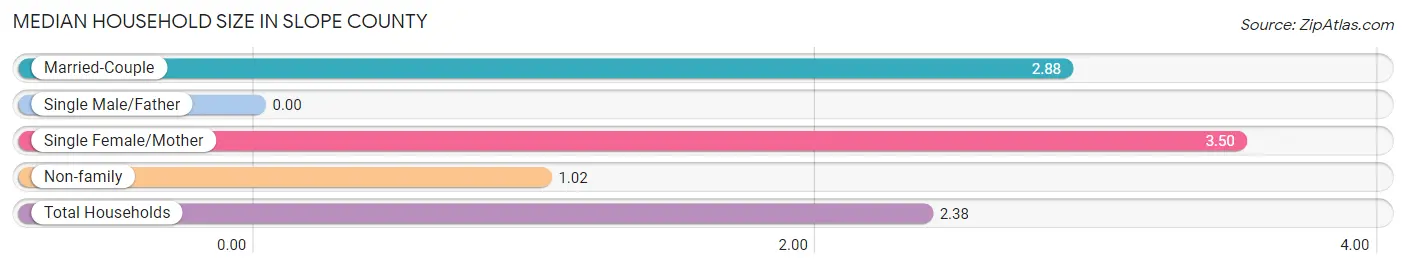
| Household Type | # Households | Household Size |
| Married-Couple | 239 (68.1%) | 2.88 |
| Single Male/Father | 0 (0.0%) | - |
| Single Female/Mother | 14 (4.0%) | 3.50 |
| Non-family | 98 (27.9%) | 1.02 |
| Total Households | 351 (100.0%) | 2.38 |
Household Size by Marriage Status in Slope County
Out of a total of 351 households in Slope County, 253 (72.1%) are family households, while 98 (27.9%) are nonfamily households. The most numerous type of family households are 2-person households, comprising 143, and the most common type of nonfamily households are 1-person households, comprising 96.
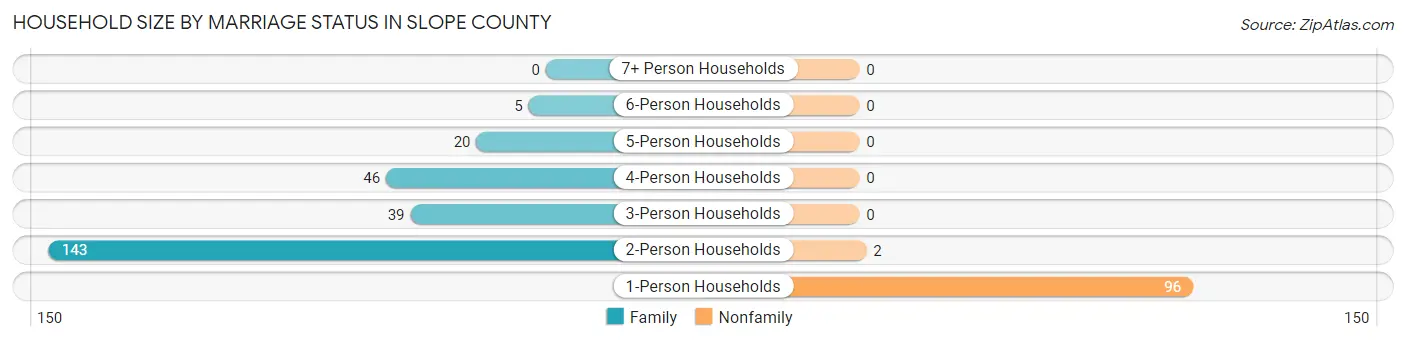
| Household Size | Family Households | Nonfamily Households |
| 1-Person Households | - | 96 (27.4%) |
| 2-Person Households | 143 (40.7%) | 2 (0.6%) |
| 3-Person Households | 39 (11.1%) | 0 (0.0%) |
| 4-Person Households | 46 (13.1%) | 0 (0.0%) |
| 5-Person Households | 20 (5.7%) | 0 (0.0%) |
| 6-Person Households | 5 (1.4%) | 0 (0.0%) |
| 7+ Person Households | 0 (0.0%) | 0 (0.0%) |
| Total | 253 (72.1%) | 98 (27.9%) |
Female Fertility in Slope County
Fertility by Age in Slope County

| Age Bracket | Women with Births | Births / 1,000 Women |
| 15 to 19 years | 0 (0.0%) | 0.0 |
| 20 to 34 years | 0 (0.0%) | 0.0 |
| 35 to 50 years | 0 (0.0%) | 0.0 |
| Total | 0 (0.0%) | 0.0 |
Fertility by Age by Marriage Status in Slope County

| Age Bracket | Married | Unmarried |
| 15 to 19 years | 0 (0.0%) | 0 (0.0%) |
| 20 to 34 years | 0 (0.0%) | 0 (0.0%) |
| 35 to 50 years | 0 (0.0%) | 0 (0.0%) |
| Total | 0 (0.0%) | 0 (0.0%) |
Fertility by Education in Slope County
| Educational Attainment | Women with Births | Births / 1,000 Women |
| Less than High School | 0 (0.0%) | 0.0 |
| High School Diploma | 0 (0.0%) | 0.0 |
| College or Associate's Degree | 0 (0.0%) | 0.0 |
| Bachelor's Degree | 0 (0.0%) | 0.0 |
| Graduate Degree | 0 (0.0%) | 0.0 |
| Total | 0 (0.0%) | 0.0 |
Fertility by Education by Marriage Status in Slope County
| Educational Attainment | Married | Unmarried |
| Less than High School | 0 (0.0%) | 0 (0.0%) |
| High School Diploma | 0 (0.0%) | 0 (0.0%) |
| College or Associate's Degree | 0 (0.0%) | 0 (0.0%) |
| Bachelor's Degree | 0 (0.0%) | 0 (0.0%) |
| Graduate Degree | 0 (0.0%) | 0 (0.0%) |
| Total | 0 (0.0%) | 0 (0.0%) |
Income in Slope County
Income Overview in Slope County
Per Capita Income in Slope County is $40,987, while median incomes of families and households are $80,972 and $70,625 respectively.
| Characteristic | Number | Measure |
| Per Capita Income | 837 | $40,987 |
| Median Family Income | 253 | $80,972 |
| Mean Family Income | 253 | $110,847 |
| Median Household Income | 351 | $70,625 |
| Mean Household Income | 351 | $96,181 |
| Income Deficit | 253 | $4,293 |
| Wage / Income Gap (%) | 837 | 51.74% |
| Wage / Income Gap ($) | 837 | 48.26¢ per $1 |
| Gini / Inequality Index | 837 | 0.44 |
Earnings by Sex in Slope County
Average Earnings in Slope County are $37,361, $46,618 for men and $22,500 for women, a difference of 51.7%.
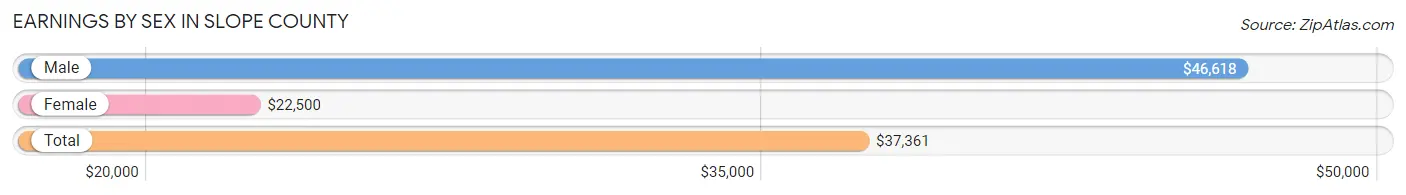
| Sex | Number | Average Earnings |
| Male | 290 (64.2%) | $46,618 |
| Female | 162 (35.8%) | $22,500 |
| Total | 452 (100.0%) | $37,361 |
Earnings by Sex by Income Bracket in Slope County
The most common earnings brackets in Slope County are $100,000+ for men (66 | 22.8%) and $25,000 to $29,999 for women (20 | 12.3%).

| Income | Male | Female |
| $2,499 or less | 9 (3.1%) | 16 (9.9%) |
| $2,500 to $4,999 | 4 (1.4%) | 13 (8.0%) |
| $5,000 to $7,499 | 7 (2.4%) | 13 (8.0%) |
| $7,500 to $9,999 | 0 (0.0%) | 9 (5.6%) |
| $10,000 to $12,499 | 15 (5.2%) | 12 (7.4%) |
| $12,500 to $14,999 | 8 (2.8%) | 1 (0.6%) |
| $15,000 to $17,499 | 8 (2.8%) | 2 (1.2%) |
| $17,500 to $19,999 | 0 (0.0%) | 0 (0.0%) |
| $20,000 to $22,499 | 8 (2.8%) | 15 (9.3%) |
| $22,500 to $24,999 | 7 (2.4%) | 6 (3.7%) |
| $25,000 to $29,999 | 20 (6.9%) | 20 (12.3%) |
| $30,000 to $34,999 | 2 (0.7%) | 14 (8.6%) |
| $35,000 to $39,999 | 19 (6.6%) | 9 (5.6%) |
| $40,000 to $44,999 | 5 (1.7%) | 1 (0.6%) |
| $45,000 to $49,999 | 51 (17.6%) | 2 (1.2%) |
| $50,000 to $54,999 | 1 (0.3%) | 5 (3.1%) |
| $55,000 to $64,999 | 23 (7.9%) | 6 (3.7%) |
| $65,000 to $74,999 | 14 (4.8%) | 6 (3.7%) |
| $75,000 to $99,999 | 23 (7.9%) | 9 (5.6%) |
| $100,000+ | 66 (22.8%) | 3 (1.8%) |
| Total | 290 (100.0%) | 162 (100.0%) |
Earnings by Sex by Educational Attainment in Slope County
Average earnings in Slope County are $46,667 for men and $23,542 for women, a difference of 49.5%. Men with an educational attainment of bachelor's degree enjoy the highest average annual earnings of $72,500, while those with high school diploma education earn the least with $39,375. Women with an educational attainment of bachelor's degree earn the most with the average annual earnings of $51,750, while those with college or associate's degree education have the smallest earnings of $21,458.
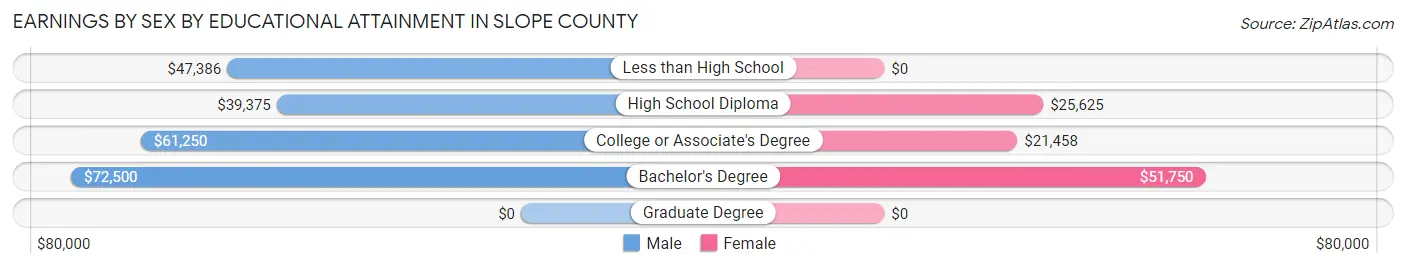
| Educational Attainment | Male Income | Female Income |
| Less than High School | $47,386 | $0 |
| High School Diploma | $39,375 | $25,625 |
| College or Associate's Degree | $61,250 | $21,458 |
| Bachelor's Degree | $72,500 | $51,750 |
| Graduate Degree | - | - |
| Total | $46,667 | $23,542 |
Family Income in Slope County
Family Income Brackets in Slope County
According to the Slope County family income data, there are 55 families falling into the $50,000 to $74,999 income range, which is the most common income bracket and makes up 21.7% of all families.

| Income Bracket | # Families | % Families |
| Less than $10,000 | 0 | 0.0% |
| $10,000 to $14,999 | 10 | 4.0% |
| $15,000 to $24,999 | 16 | 6.3% |
| $25,000 to $34,999 | 17 | 6.7% |
| $35,000 to $49,999 | 20 | 7.9% |
| $50,000 to $74,999 | 55 | 21.7% |
| $75,000 to $99,999 | 23 | 9.1% |
| $100,000 to $149,999 | 52 | 20.6% |
| $150,000 to $199,999 | 34 | 13.4% |
| $200,000+ | 26 | 10.3% |
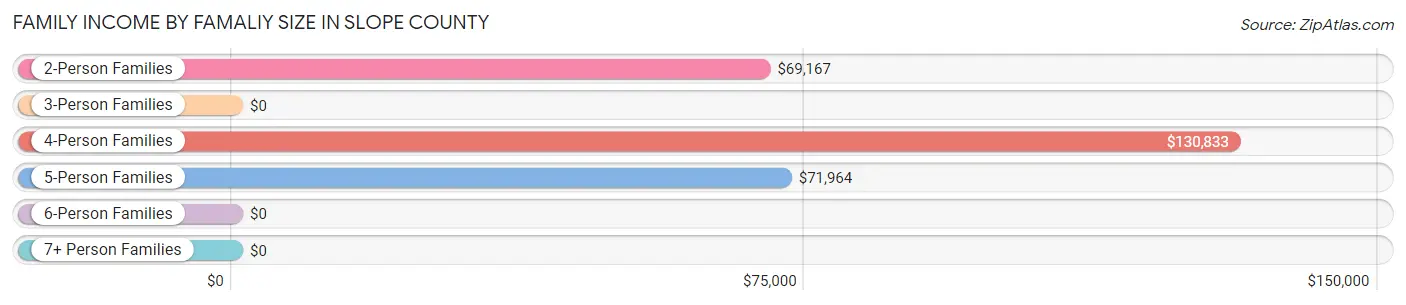
Family Income by Famaliy Size in Slope County
4-person families (46 | 18.2%) account for the highest median family income in Slope County with $130,833 per family, while 2-person families (144 | 56.9%) have the highest median income of $34,584 per family member.
| Income Bracket | # Families | Median Income |
| 2-Person Families | 144 (56.9%) | $69,167 |
| 3-Person Families | 41 (16.2%) | $0 |
| 4-Person Families | 46 (18.2%) | $130,833 |
| 5-Person Families | 17 (6.7%) | $71,964 |
| 6-Person Families | 5 (2.0%) | $0 |
| 7+ Person Families | 0 (0.0%) | $0 |
| Total | 253 (100.0%) | $80,972 |
Family Income by Number of Earners in Slope County

| Number of Earners | # Families | Median Income |
| No Earners | 43 (17.0%) | $31,458 |
| 1 Earner | 84 (33.2%) | $59,643 |
| 2 Earners | 99 (39.1%) | $104,107 |
| 3+ Earners | 27 (10.7%) | $0 |
| Total | 253 (100.0%) | $80,972 |
Household Income in Slope County
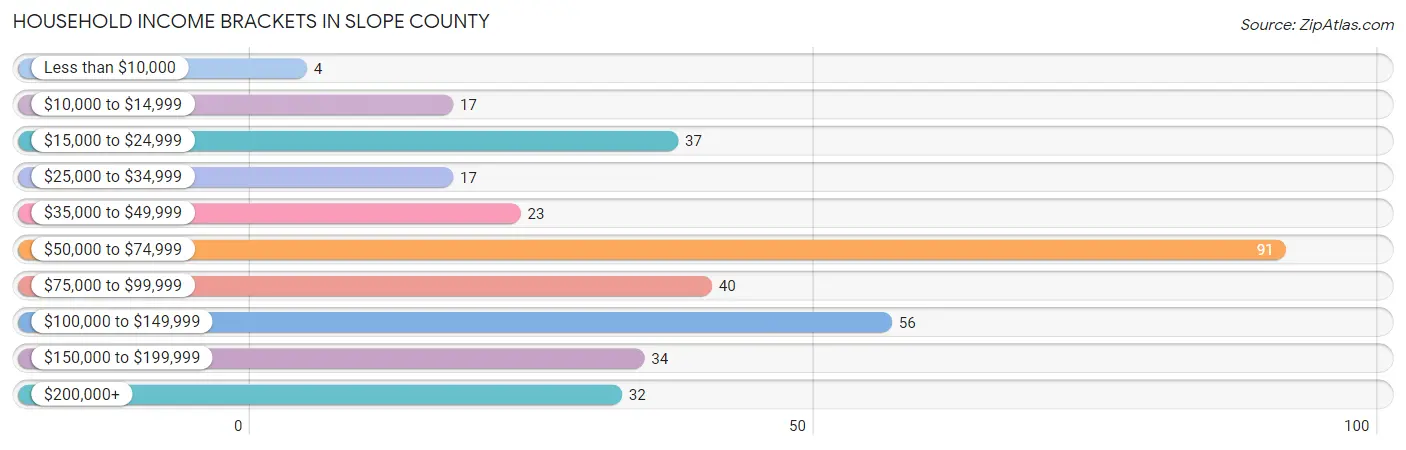
Household Income Brackets in Slope County
With 91 households falling in the category, the $50,000 to $74,999 income range is the most frequent in Slope County, accounting for 25.9% of all households. In contrast, only 4 households (1.1%) fall into the less than $10,000 income bracket, making it the least populous group.
| Income Bracket | # Households | % Households |
| Less than $10,000 | 4 | 1.1% |
| $10,000 to $14,999 | 17 | 4.8% |
| $15,000 to $24,999 | 37 | 10.5% |
| $25,000 to $34,999 | 17 | 4.8% |
| $35,000 to $49,999 | 23 | 6.6% |
| $50,000 to $74,999 | 91 | 25.9% |
| $75,000 to $99,999 | 40 | 11.4% |
| $100,000 to $149,999 | 56 | 16.0% |
| $150,000 to $199,999 | 34 | 9.7% |
| $200,000+ | 32 | 9.1% |
Household Income by Householder Age in Slope County
The median household income in Slope County is $70,625, with the highest median household income of $102,083 found in the 25 to 44 years age bracket for the primary householder. A total of 60 households (17.1%) fall into this category. Meanwhile, the 15 to 24 years age bracket for the primary householder has the lowest median household income of $0, with 2 households (0.6%) in this group.

| Income Bracket | # Households | Median Income |
| 15 to 24 Years | 2 (0.6%) | $0 |
| 25 to 44 Years | 60 (17.1%) | $102,083 |
| 45 to 64 Years | 152 (43.3%) | $59,500 |
| 65+ Years | 137 (39.0%) | $65,179 |
| Total | 351 (100.0%) | $70,625 |
Poverty in Slope County
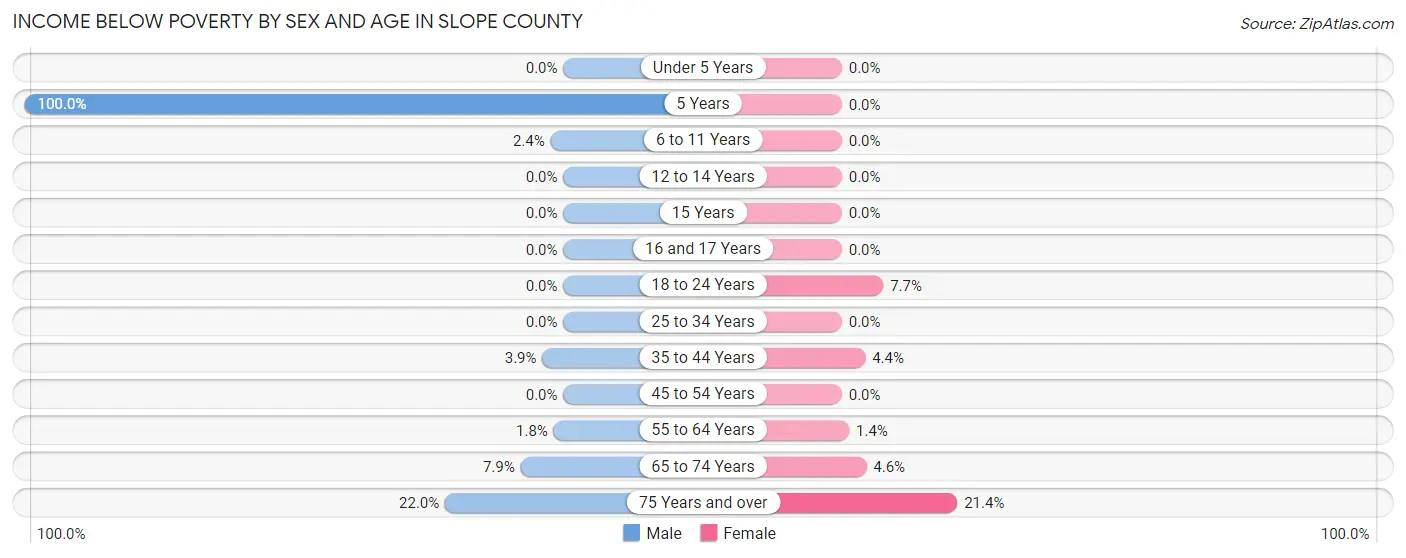
Income Below Poverty by Sex and Age in Slope County
With 4.5% poverty level for males and 4.9% for females among the residents of Slope County, 5 year old males and 75 year old and over females are the most vulnerable to poverty, with 1 males (100.0%) and 12 females (21.4%) in their respective age groups living below the poverty level.
| Age Bracket | Male | Female |
| Under 5 Years | 0 (0.0%) | 0 (0.0%) |
| 5 Years | 1 (100.0%) | 0 (0.0%) |
| 6 to 11 Years | 1 (2.4%) | 0 (0.0%) |
| 12 to 14 Years | 0 (0.0%) | 0 (0.0%) |
| 15 Years | 0 (0.0%) | 0 (0.0%) |
| 16 and 17 Years | 0 (0.0%) | 0 (0.0%) |
| 18 to 24 Years | 0 (0.0%) | 1 (7.7%) |
| 25 to 34 Years | 0 (0.0%) | 0 (0.0%) |
| 35 to 44 Years | 3 (3.9%) | 1 (4.3%) |
| 45 to 54 Years | 0 (0.0%) | 0 (0.0%) |
| 55 to 64 Years | 2 (1.8%) | 1 (1.3%) |
| 65 to 74 Years | 5 (7.9%) | 3 (4.5%) |
| 75 Years and over | 9 (22.0%) | 12 (21.4%) |
| Total | 21 (4.5%) | 18 (4.9%) |
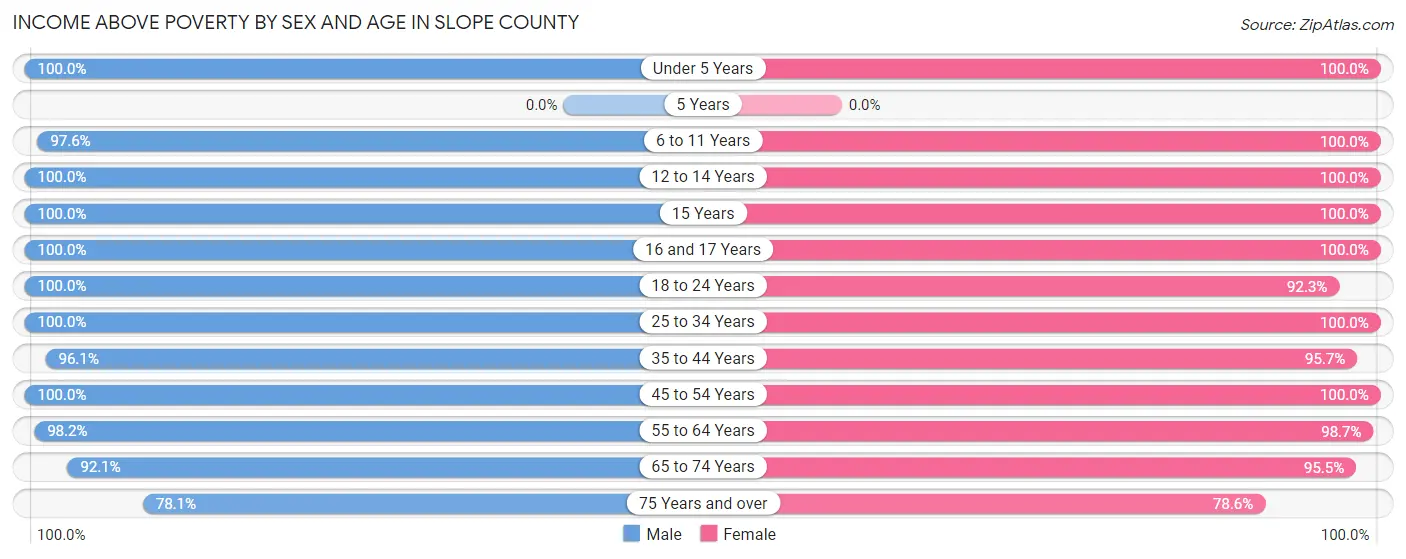
Income Above Poverty by Sex and Age in Slope County
According to the poverty statistics in Slope County, males aged under 5 years and females aged under 5 years are the age groups that are most secure financially, with 100.0% of males and 100.0% of females in these age groups living above the poverty line.
| Age Bracket | Male | Female |
| Under 5 Years | 5 (100.0%) | 8 (100.0%) |
| 5 Years | 0 (0.0%) | 0 (0.0%) |
| 6 to 11 Years | 41 (97.6%) | 34 (100.0%) |
| 12 to 14 Years | 31 (100.0%) | 11 (100.0%) |
| 15 Years | 2 (100.0%) | 3 (100.0%) |
| 16 and 17 Years | 17 (100.0%) | 13 (100.0%) |
| 18 to 24 Years | 12 (100.0%) | 12 (92.3%) |
| 25 to 34 Years | 29 (100.0%) | 40 (100.0%) |
| 35 to 44 Years | 74 (96.1%) | 22 (95.7%) |
| 45 to 54 Years | 34 (100.0%) | 30 (100.0%) |
| 55 to 64 Years | 110 (98.2%) | 73 (98.7%) |
| 65 to 74 Years | 58 (92.1%) | 63 (95.5%) |
| 75 Years and over | 32 (78.0%) | 44 (78.6%) |
| Total | 445 (95.5%) | 353 (95.2%) |
Income Below Poverty Among Married-Couple Families in Slope County
The poverty statistics for married-couple families in Slope County show that 5.9% or 14 of the total 239 families live below the poverty line. Families with no children have the highest poverty rate of 8.3%, comprising of 13 families. On the other hand, families with 3 or 4 children have the lowest poverty rate of 0.0%, which includes 0 families.
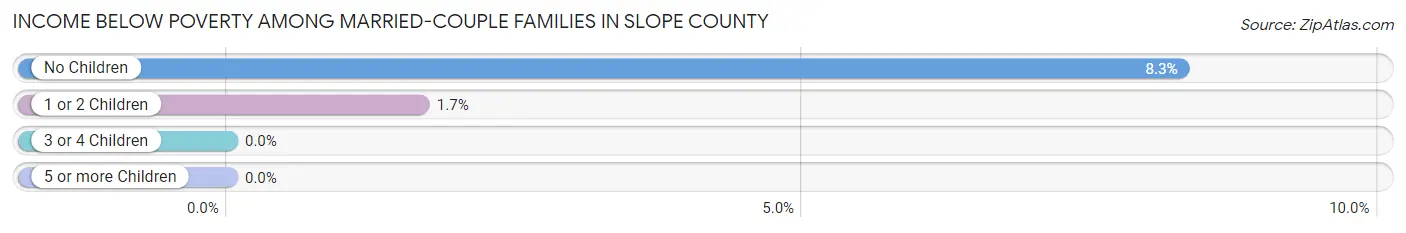
| Children | Above Poverty | Below Poverty |
| No Children | 144 (91.7%) | 13 (8.3%) |
| 1 or 2 Children | 59 (98.3%) | 1 (1.7%) |
| 3 or 4 Children | 22 (100.0%) | 0 (0.0%) |
| 5 or more Children | 0 (0.0%) | 0 (0.0%) |
| Total | 225 (94.1%) | 14 (5.9%) |
Income Below Poverty Among Single-Parent Households in Slope County
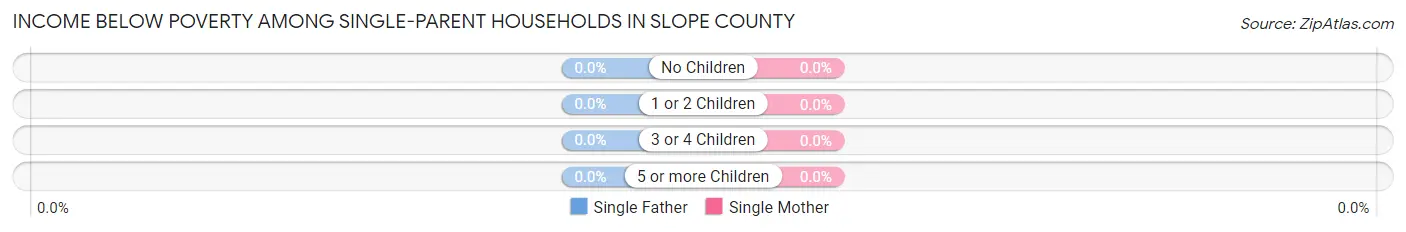
| Children | Single Father | Single Mother |
| No Children | 0 (0.0%) | 0 (0.0%) |
| 1 or 2 Children | 0 (0.0%) | 0 (0.0%) |
| 3 or 4 Children | 0 (0.0%) | 0 (0.0%) |
| 5 or more Children | 0 (0.0%) | 0 (0.0%) |
| Total | 0 (0.0%) | 0 (0.0%) |
Income Below Poverty Among Married-Couple vs Single-Parent Households in Slope County

| Children | Married-Couple Families | Single-Parent Households |
| No Children | 13 (8.3%) | 0 (0.0%) |
| 1 or 2 Children | 1 (1.7%) | 0 (0.0%) |
| 3 or 4 Children | 0 (0.0%) | 0 (0.0%) |
| 5 or more Children | 0 (0.0%) | 0 (0.0%) |
| Total | 14 (5.9%) | 0 (0.0%) |
Employment Characteristics in Slope County
Employment by Class of Employer in Slope County
Among the 412 employed individuals in Slope County, self-employed (not incorporated) (179 | 43.4%), private company employees (111 | 26.9%), and local government employees (54 | 13.1%) make up the most common classes of employment.
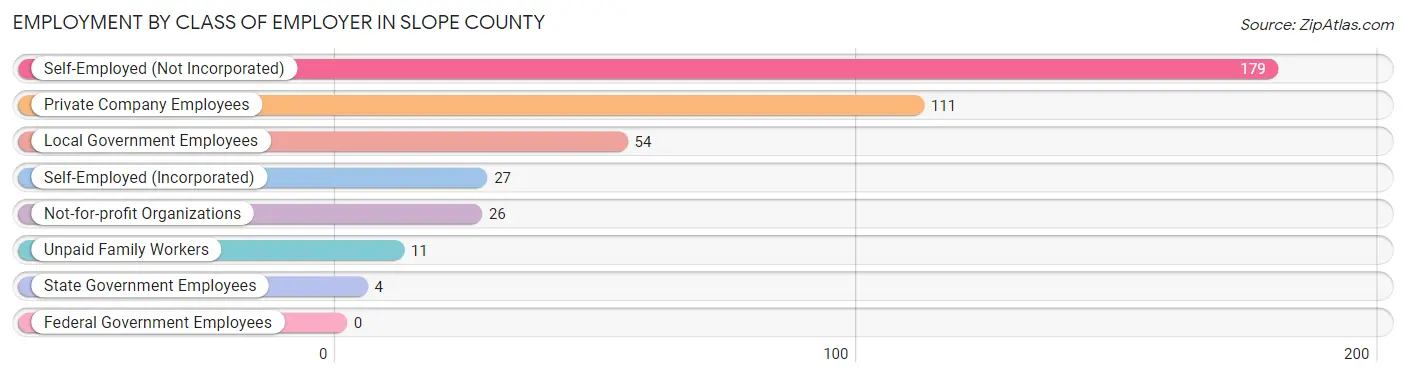
| Employer Class | # Employees | % Employees |
| Private Company Employees | 111 | 26.9% |
| Self-Employed (Incorporated) | 27 | 6.6% |
| Self-Employed (Not Incorporated) | 179 | 43.4% |
| Not-for-profit Organizations | 26 | 6.3% |
| Local Government Employees | 54 | 13.1% |
| State Government Employees | 4 | 1.0% |
| Federal Government Employees | 0 | 0.0% |
| Unpaid Family Workers | 11 | 2.7% |
| Total | 412 | 100.0% |
Employment Status by Age in Slope County
According to the labor force statistics for Slope County, out of the total population over 16 years of age (700), 62.9% or 440 individuals are in the labor force, with 4.5% or 20 of them unemployed. The age group with the highest labor force participation rate is 25 to 29 years, with 100.0% or 16 individuals in the labor force. Within the labor force, the 30 to 34 years age range has the highest percentage of unemployed individuals, with 38.0% or 19 of them being unemployed.
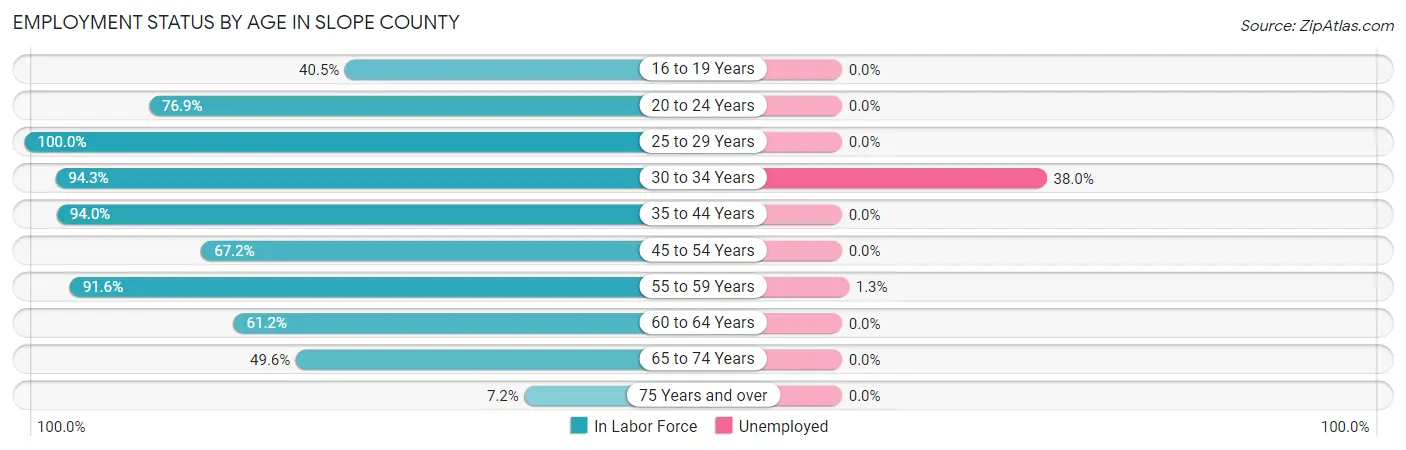
| Age Bracket | In Labor Force | Unemployed |
| 16 to 19 Years | 17 (40.5%) | 0 (0.0%) |
| 20 to 24 Years | 10 (76.9%) | 0 (0.0%) |
| 25 to 29 Years | 16 (100.0%) | 0 (0.0%) |
| 30 to 34 Years | 50 (94.3%) | 19 (38.0%) |
| 35 to 44 Years | 94 (94.0%) | 0 (0.0%) |
| 45 to 54 Years | 43 (67.2%) | 0 (0.0%) |
| 55 to 59 Years | 76 (91.6%) | 1 (1.3%) |
| 60 to 64 Years | 63 (61.2%) | 0 (0.0%) |
| 65 to 74 Years | 64 (49.6%) | 0 (0.0%) |
| 75 Years and over | 7 (7.2%) | 0 (0.0%) |
| Total | 440 (62.9%) | 20 (4.5%) |
Employment Status by Educational Attainment in Slope County
According to labor force statistics for Slope County, 81.6% of individuals (342) out of the total population between 25 and 64 years of age (419) are in the labor force, with 5.8% or 20 of them being unemployed. The group with the highest labor force participation rate are those with the educational attainment of high school diploma, with 86.7% or 137 individuals in the labor force. Within the labor force, individuals with college / associate degree education have the highest percentage of unemployment, with 16.7% or 19 of them being unemployed.
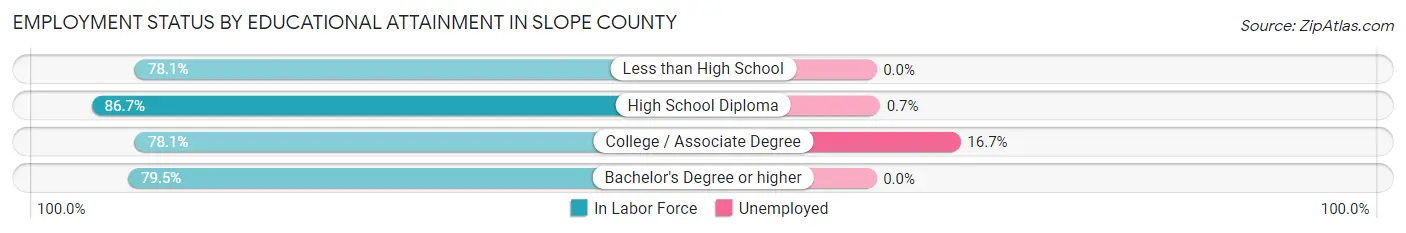
| Educational Attainment | In Labor Force | Unemployed |
| Less than High School | 25 (78.1%) | 0 (0.0%) |
| High School Diploma | 137 (86.7%) | 1 (0.7%) |
| College / Associate Degree | 114 (78.1%) | 24 (16.7%) |
| Bachelor's Degree or higher | 66 (79.5%) | 0 (0.0%) |
| Total | 342 (81.6%) | 24 (5.8%) |
Employment Occupations by Sex in Slope County
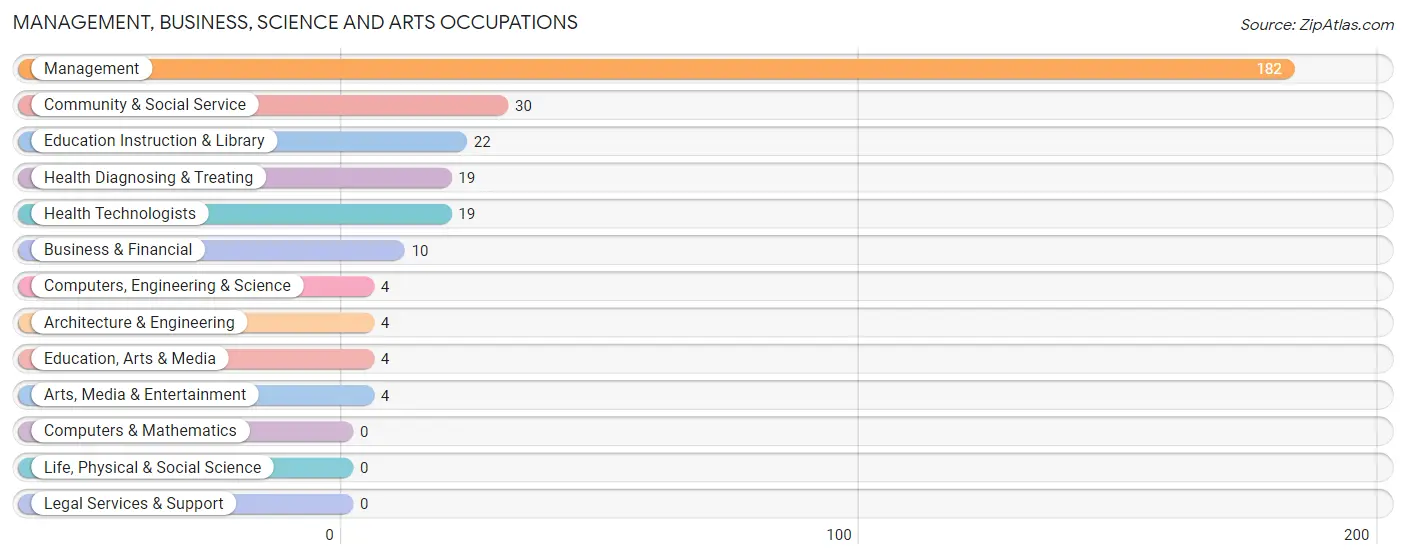
Management, Business, Science and Arts Occupations
The most common Management, Business, Science and Arts occupations in Slope County are Management (182 | 43.3%), Community & Social Service (30 | 7.1%), Education Instruction & Library (22 | 5.2%), Health Diagnosing & Treating (19 | 4.5%), and Health Technologists (19 | 4.5%).
Management, Business, Science and Arts Occupations by Sex
Within the Management, Business, Science and Arts occupations in Slope County, the most male-oriented occupations are Computers, Engineering & Science (100.0%), Architecture & Engineering (100.0%), and Education, Arts & Media (100.0%), while the most female-oriented occupations are Education Instruction & Library (100.0%), Health Diagnosing & Treating (100.0%), and Health Technologists (100.0%).
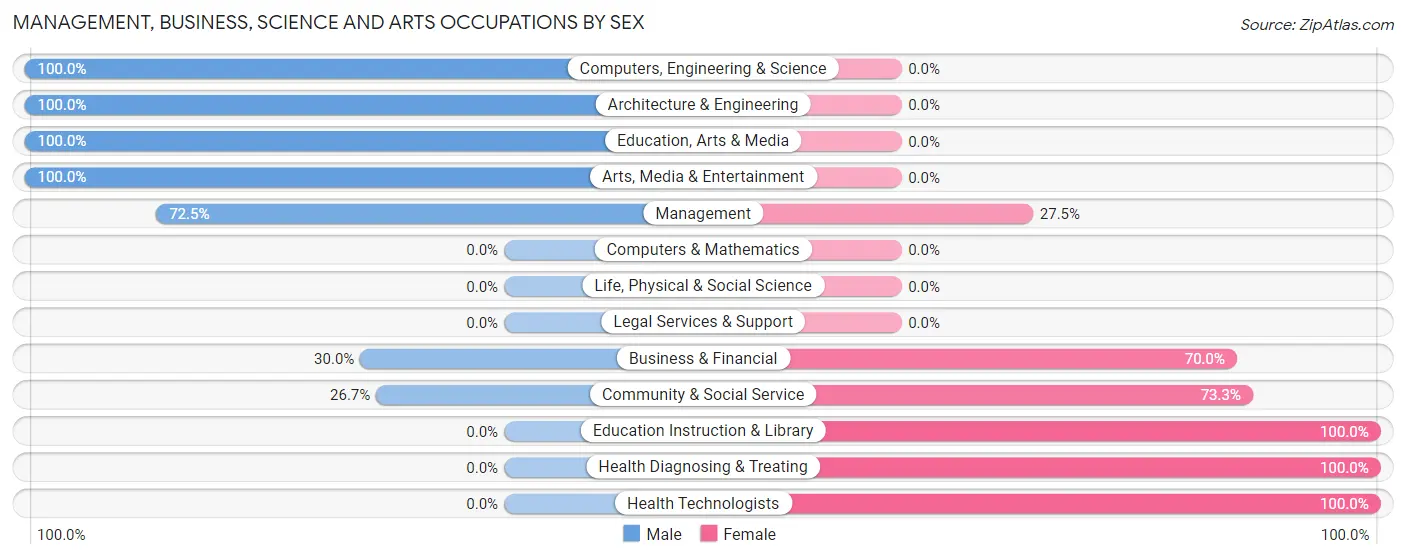
| Occupation | Male | Female |
| Management | 132 (72.5%) | 50 (27.5%) |
| Business & Financial | 3 (30.0%) | 7 (70.0%) |
| Computers, Engineering & Science | 4 (100.0%) | 0 (0.0%) |
| Computers & Mathematics | 0 (0.0%) | 0 (0.0%) |
| Architecture & Engineering | 4 (100.0%) | 0 (0.0%) |
| Life, Physical & Social Science | 0 (0.0%) | 0 (0.0%) |
| Community & Social Service | 8 (26.7%) | 22 (73.3%) |
| Education, Arts & Media | 4 (100.0%) | 0 (0.0%) |
| Legal Services & Support | 0 (0.0%) | 0 (0.0%) |
| Education Instruction & Library | 0 (0.0%) | 22 (100.0%) |
| Arts, Media & Entertainment | 4 (100.0%) | 0 (0.0%) |
| Health Diagnosing & Treating | 0 (0.0%) | 19 (100.0%) |
| Health Technologists | 0 (0.0%) | 19 (100.0%) |
| Total (Category) | 147 (60.0%) | 98 (40.0%) |
| Total (Overall) | 273 (65.0%) | 147 (35.0%) |
Services Occupations
The most common Services occupations in Slope County are Food Preparation & Serving (10 | 2.4%), Cleaning & Maintenance (10 | 2.4%), Healthcare Support (9 | 2.1%), Security & Protection (4 | 0.9%), and Personal Care & Service (4 | 0.9%).

Services Occupations by Sex
Within the Services occupations in Slope County, the most male-oriented occupations are Law Enforcement (100.0%), Cleaning & Maintenance (80.0%), and Security & Protection (50.0%), while the most female-oriented occupations are Healthcare Support (100.0%), Firefighting & Prevention (100.0%), and Food Preparation & Serving (100.0%).

| Occupation | Male | Female |
| Healthcare Support | 0 (0.0%) | 9 (100.0%) |
| Security & Protection | 2 (50.0%) | 2 (50.0%) |
| Firefighting & Prevention | 0 (0.0%) | 2 (100.0%) |
| Law Enforcement | 2 (100.0%) | 0 (0.0%) |
| Food Preparation & Serving | 0 (0.0%) | 10 (100.0%) |
| Cleaning & Maintenance | 8 (80.0%) | 2 (20.0%) |
| Personal Care & Service | 0 (0.0%) | 4 (100.0%) |
| Total (Category) | 10 (27.0%) | 27 (73.0%) |
| Total (Overall) | 273 (65.0%) | 147 (35.0%) |
Sales and Office Occupations
The most common Sales and Office occupations in Slope County are Sales & Related (17 | 4.1%), and Office & Administration (4 | 0.9%).

Sales and Office Occupations by Sex
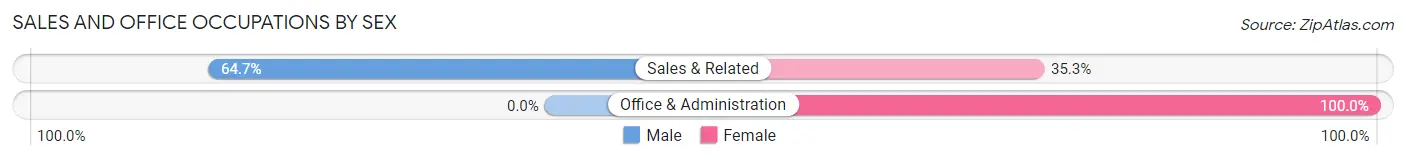
| Occupation | Male | Female |
| Sales & Related | 11 (64.7%) | 6 (35.3%) |
| Office & Administration | 0 (0.0%) | 4 (100.0%) |
| Total (Category) | 11 (52.4%) | 10 (47.6%) |
| Total (Overall) | 273 (65.0%) | 147 (35.0%) |
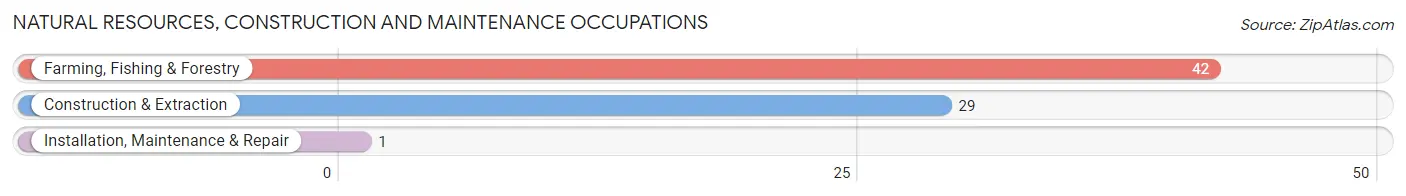
Natural Resources, Construction and Maintenance Occupations
The most common Natural Resources, Construction and Maintenance occupations in Slope County are Farming, Fishing & Forestry (42 | 10.0%), Construction & Extraction (29 | 6.9%), and Installation, Maintenance & Repair (1 | 0.2%).
Natural Resources, Construction and Maintenance Occupations by Sex
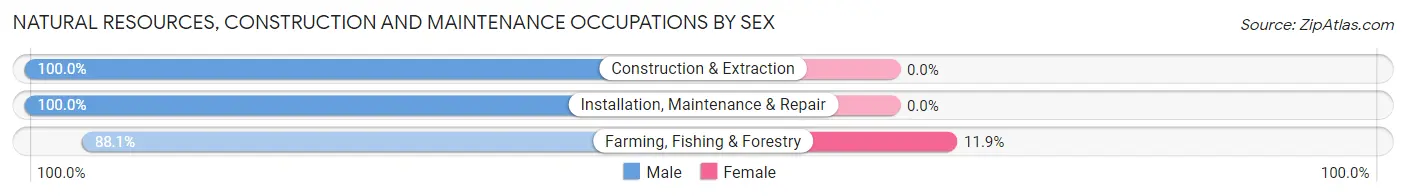
| Occupation | Male | Female |
| Farming, Fishing & Forestry | 37 (88.1%) | 5 (11.9%) |
| Construction & Extraction | 29 (100.0%) | 0 (0.0%) |
| Installation, Maintenance & Repair | 1 (100.0%) | 0 (0.0%) |
| Total (Category) | 67 (93.1%) | 5 (6.9%) |
| Total (Overall) | 273 (65.0%) | 147 (35.0%) |
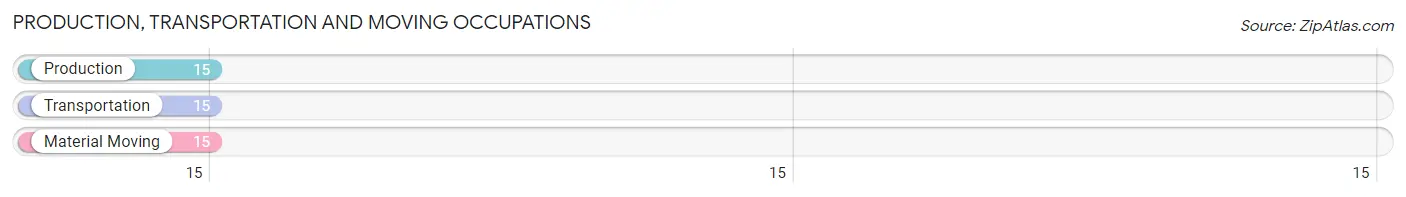
Production, Transportation and Moving Occupations
The most common Production, Transportation and Moving occupations in Slope County are Production (15 | 3.6%), Transportation (15 | 3.6%), and Material Moving (15 | 3.6%).
Production, Transportation and Moving Occupations by Sex

| Occupation | Male | Female |
| Production | 14 (93.3%) | 1 (6.7%) |
| Transportation | 13 (86.7%) | 2 (13.3%) |
| Material Moving | 11 (73.3%) | 4 (26.7%) |
| Total (Category) | 38 (84.4%) | 7 (15.6%) |
| Total (Overall) | 273 (65.0%) | 147 (35.0%) |
Employment Industries by Sex in Slope County
Employment Industries in Slope County
The major employment industries in Slope County include Agriculture, Fishing & Hunting (208 | 49.5%), Educational Services (34 | 8.1%), Health Care & Social Assistance (30 | 7.1%), Construction (28 | 6.7%), and Retail Trade (19 | 4.5%).

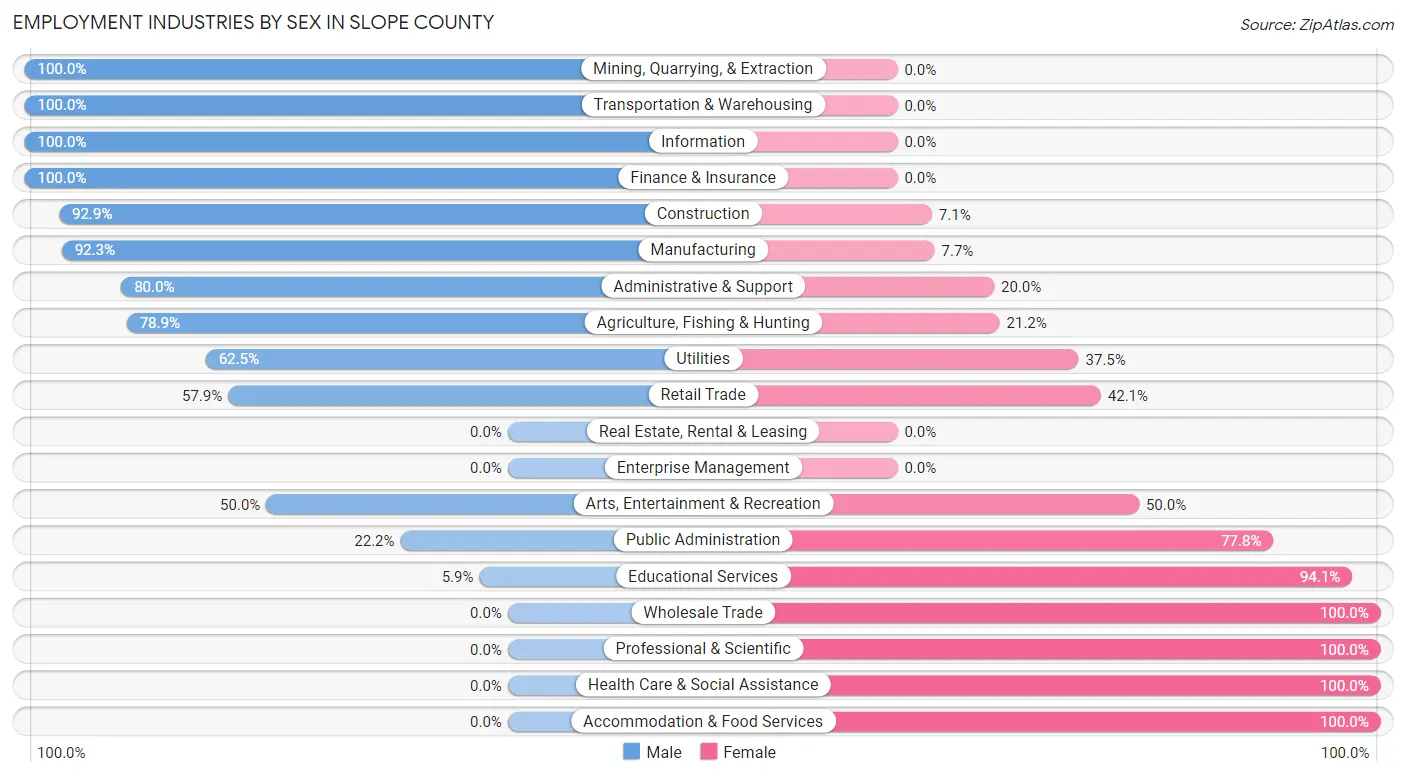
Employment Industries by Sex in Slope County
The Slope County industries that see more men than women are Mining, Quarrying, & Extraction (100.0%), Transportation & Warehousing (100.0%), and Information (100.0%), whereas the industries that tend to have a higher number of women are Wholesale Trade (100.0%), Professional & Scientific (100.0%), and Health Care & Social Assistance (100.0%).
| Industry | Male | Female |
| Agriculture, Fishing & Hunting | 164 (78.8%) | 44 (21.1%) |
| Mining, Quarrying, & Extraction | 13 (100.0%) | 0 (0.0%) |
| Construction | 26 (92.9%) | 2 (7.1%) |
| Manufacturing | 12 (92.3%) | 1 (7.7%) |
| Wholesale Trade | 0 (0.0%) | 4 (100.0%) |
| Retail Trade | 11 (57.9%) | 8 (42.1%) |
| Transportation & Warehousing | 11 (100.0%) | 0 (0.0%) |
| Utilities | 5 (62.5%) | 3 (37.5%) |
| Information | 2 (100.0%) | 0 (0.0%) |
| Finance & Insurance | 3 (100.0%) | 0 (0.0%) |
| Real Estate, Rental & Leasing | 0 (0.0%) | 0 (0.0%) |
| Professional & Scientific | 0 (0.0%) | 2 (100.0%) |
| Enterprise Management | 0 (0.0%) | 0 (0.0%) |
| Administrative & Support | 8 (80.0%) | 2 (20.0%) |
| Educational Services | 2 (5.9%) | 32 (94.1%) |
| Health Care & Social Assistance | 0 (0.0%) | 30 (100.0%) |
| Arts, Entertainment & Recreation | 4 (50.0%) | 4 (50.0%) |
| Accommodation & Food Services | 0 (0.0%) | 8 (100.0%) |
| Public Administration | 2 (22.2%) | 7 (77.8%) |
| Total | 273 (65.0%) | 147 (35.0%) |
Education in Slope County
School Enrollment in Slope County
The most common levels of schooling among the 172 students in Slope County are high school (59 | 34.3%), middle school (52 | 30.2%), and elementary school (44 | 25.6%).
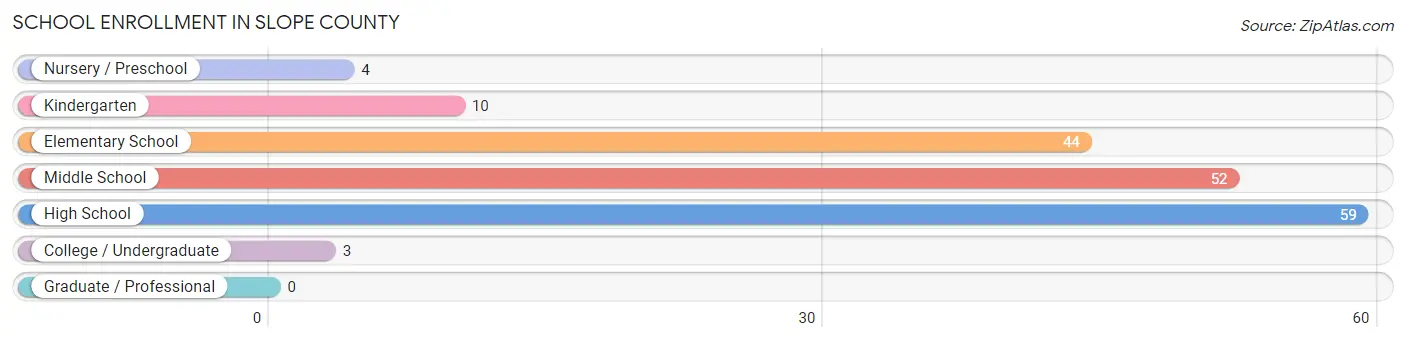
| School Level | # Students | % Students |
| Nursery / Preschool | 4 | 2.3% |
| Kindergarten | 10 | 5.8% |
| Elementary School | 44 | 25.6% |
| Middle School | 52 | 30.2% |
| High School | 59 | 34.3% |
| College / Undergraduate | 3 | 1.7% |
| Graduate / Professional | 0 | 0.0% |
| Total | 172 | 100.0% |
School Enrollment by Age by Funding Source in Slope County
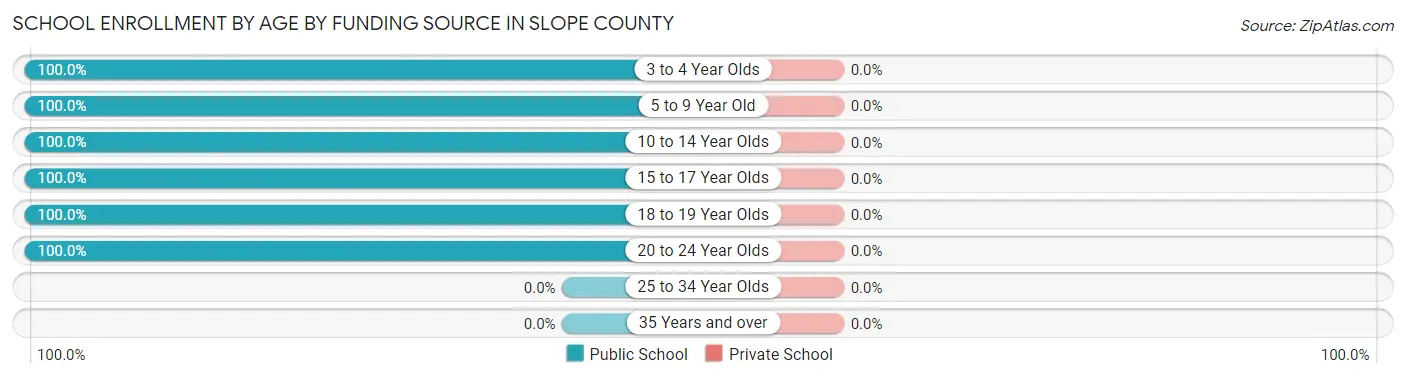
| Age Bracket | Public School | Private School |
| 3 to 4 Year Olds | 4 (100.0%) | 0 (0.0%) |
| 5 to 9 Year Old | 42 (100.0%) | 0 (0.0%) |
| 10 to 14 Year Olds | 76 (100.0%) | 0 (0.0%) |
| 15 to 17 Year Olds | 35 (100.0%) | 0 (0.0%) |
| 18 to 19 Year Olds | 12 (100.0%) | 0 (0.0%) |
| 20 to 24 Year Olds | 3 (100.0%) | 0 (0.0%) |
| 25 to 34 Year Olds | 0 (0.0%) | 0 (0.0%) |
| 35 Years and over | 0 (0.0%) | 0 (0.0%) |
| Total | 172 (100.0%) | 0 (0.0%) |
Educational Attainment by Field of Study in Slope County
Education (47 | 31.1%), business (45 | 29.8%), arts & humanities (18 | 11.9%), science & technology (13 | 8.6%), and bio, nature & agricultural (7 | 4.6%) are the most common fields of study among 151 individuals in Slope County who have obtained a bachelor's degree or higher.
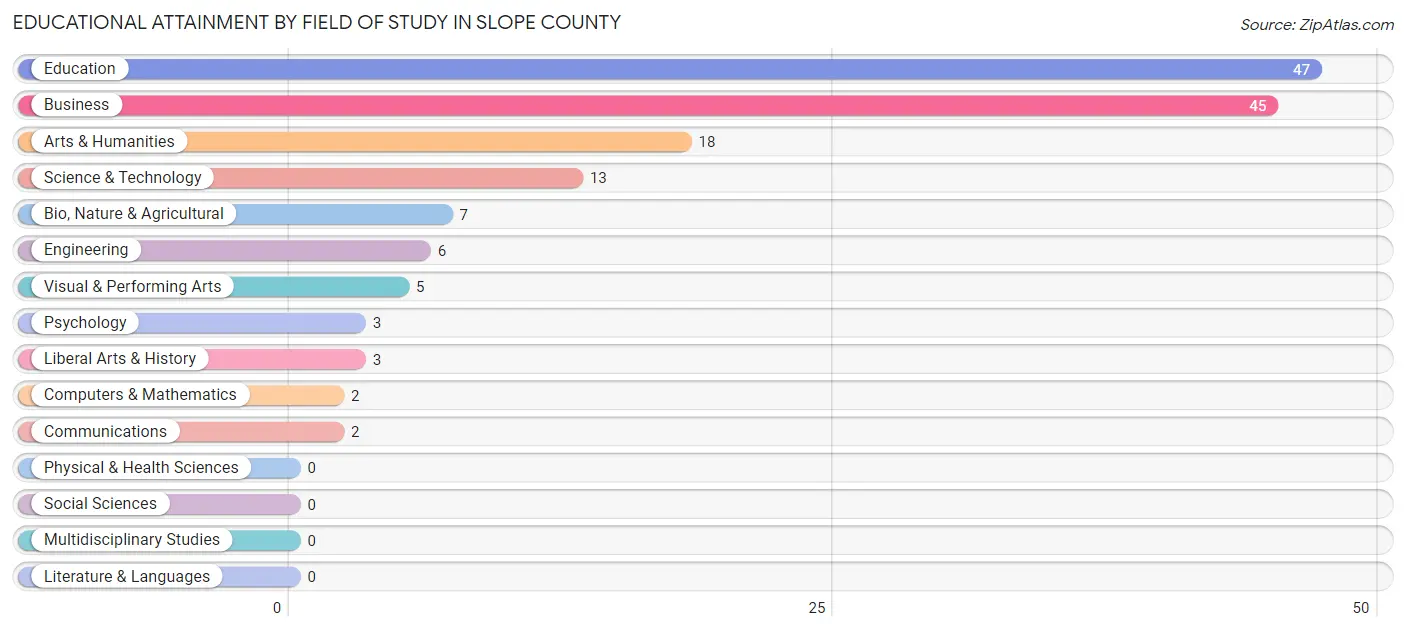
| Field of Study | # Graduates | % Graduates |
| Computers & Mathematics | 2 | 1.3% |
| Bio, Nature & Agricultural | 7 | 4.6% |
| Physical & Health Sciences | 0 | 0.0% |
| Psychology | 3 | 2.0% |
| Social Sciences | 0 | 0.0% |
| Engineering | 6 | 4.0% |
| Multidisciplinary Studies | 0 | 0.0% |
| Science & Technology | 13 | 8.6% |
| Business | 45 | 29.8% |
| Education | 47 | 31.1% |
| Literature & Languages | 0 | 0.0% |
| Liberal Arts & History | 3 | 2.0% |
| Visual & Performing Arts | 5 | 3.3% |
| Communications | 2 | 1.3% |
| Arts & Humanities | 18 | 11.9% |
| Total | 151 | 100.0% |
Transportation & Commute in Slope County
Vehicle Availability by Sex in Slope County
The most prevalent vehicle ownership categories in Slope County are males with 4 vehicles (83, accounting for 30.4%) and females with 4 vehicles (51, making up 59.7%).
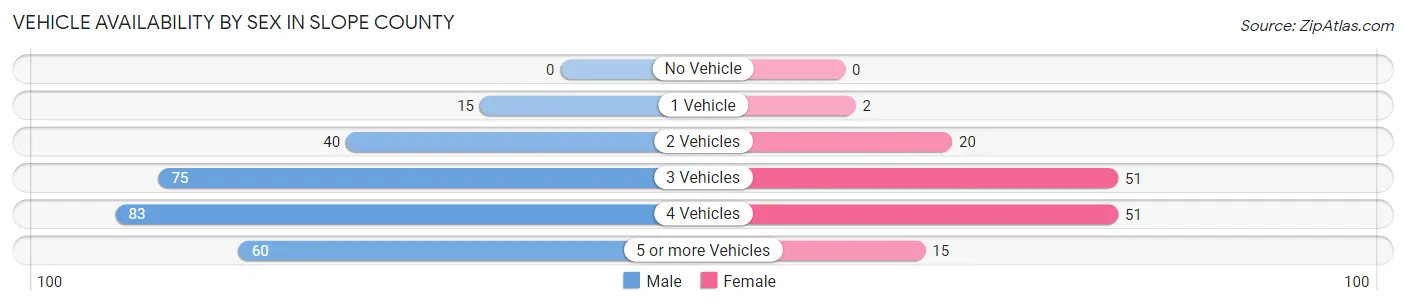
| Vehicles Available | Male | Female |
| No Vehicle | 0 (0.0%) | 0 (0.0%) |
| 1 Vehicle | 15 (5.5%) | 2 (1.4%) |
| 2 Vehicles | 40 (14.6%) | 20 (14.4%) |
| 3 Vehicles | 75 (27.5%) | 51 (36.7%) |
| 4 Vehicles | 83 (30.4%) | 51 (36.7%) |
| 5 or more Vehicles | 60 (22.0%) | 15 (10.8%) |
| Total | 273 (100.0%) | 139 (100.0%) |
Commute Time in Slope County
The most frequently occuring commute durations in Slope County are less than 5 minutes (79 commuters, 24.3%), 10 to 14 minutes (43 commuters, 13.2%), and 15 to 19 minutes (41 commuters, 12.6%).
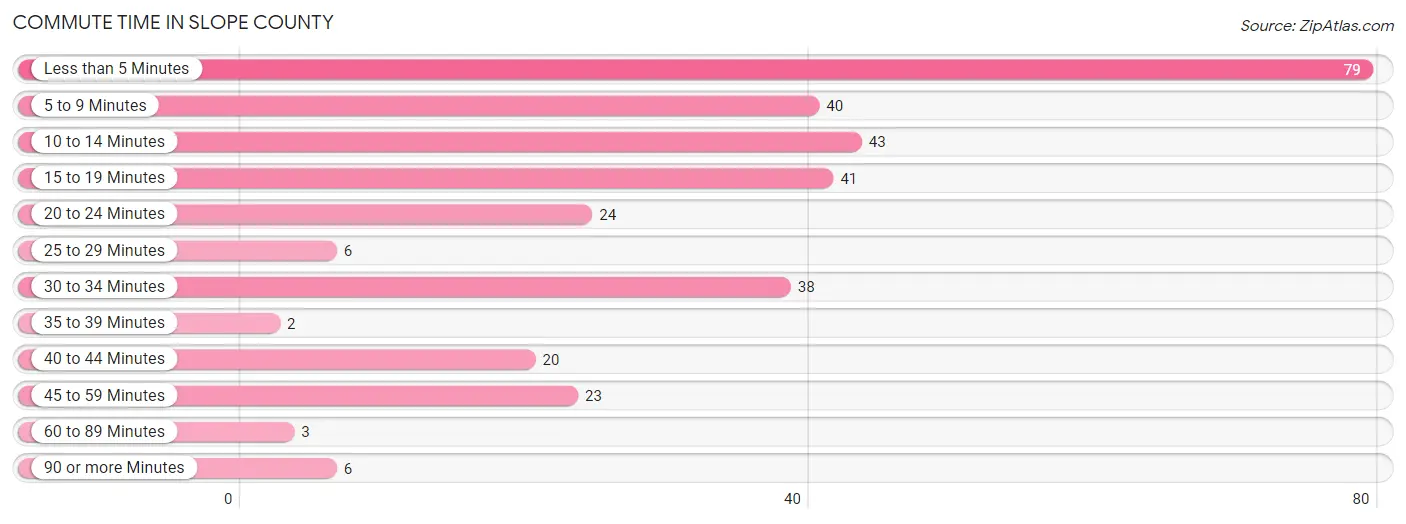
| Commute Time | # Commuters | % Commuters |
| Less than 5 Minutes | 79 | 24.3% |
| 5 to 9 Minutes | 40 | 12.3% |
| 10 to 14 Minutes | 43 | 13.2% |
| 15 to 19 Minutes | 41 | 12.6% |
| 20 to 24 Minutes | 24 | 7.4% |
| 25 to 29 Minutes | 6 | 1.8% |
| 30 to 34 Minutes | 38 | 11.7% |
| 35 to 39 Minutes | 2 | 0.6% |
| 40 to 44 Minutes | 20 | 6.1% |
| 45 to 59 Minutes | 23 | 7.1% |
| 60 to 89 Minutes | 3 | 0.9% |
| 90 or more Minutes | 6 | 1.8% |
Commute Time by Sex in Slope County
The most common commute times in Slope County are less than 5 minutes (48 commuters, 22.1%) for males and less than 5 minutes (31 commuters, 28.7%) for females.
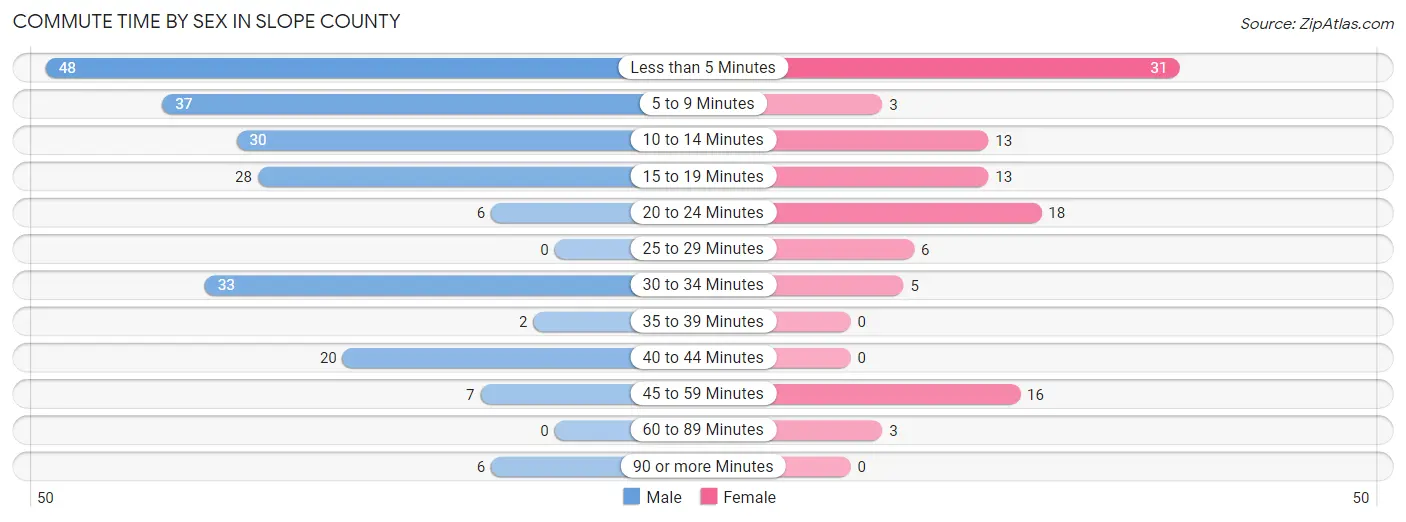
| Commute Time | Male | Female |
| Less than 5 Minutes | 48 (22.1%) | 31 (28.7%) |
| 5 to 9 Minutes | 37 (17.1%) | 3 (2.8%) |
| 10 to 14 Minutes | 30 (13.8%) | 13 (12.0%) |
| 15 to 19 Minutes | 28 (12.9%) | 13 (12.0%) |
| 20 to 24 Minutes | 6 (2.8%) | 18 (16.7%) |
| 25 to 29 Minutes | 0 (0.0%) | 6 (5.6%) |
| 30 to 34 Minutes | 33 (15.2%) | 5 (4.6%) |
| 35 to 39 Minutes | 2 (0.9%) | 0 (0.0%) |
| 40 to 44 Minutes | 20 (9.2%) | 0 (0.0%) |
| 45 to 59 Minutes | 7 (3.2%) | 16 (14.8%) |
| 60 to 89 Minutes | 0 (0.0%) | 3 (2.8%) |
| 90 or more Minutes | 6 (2.8%) | 0 (0.0%) |
Time of Departure to Work by Sex in Slope County
The most frequent times of departure to work in Slope County are 6:30 AM to 6:59 AM (52, 24.0%) for males and 6:30 AM to 6:59 AM (37, 34.3%) for females.
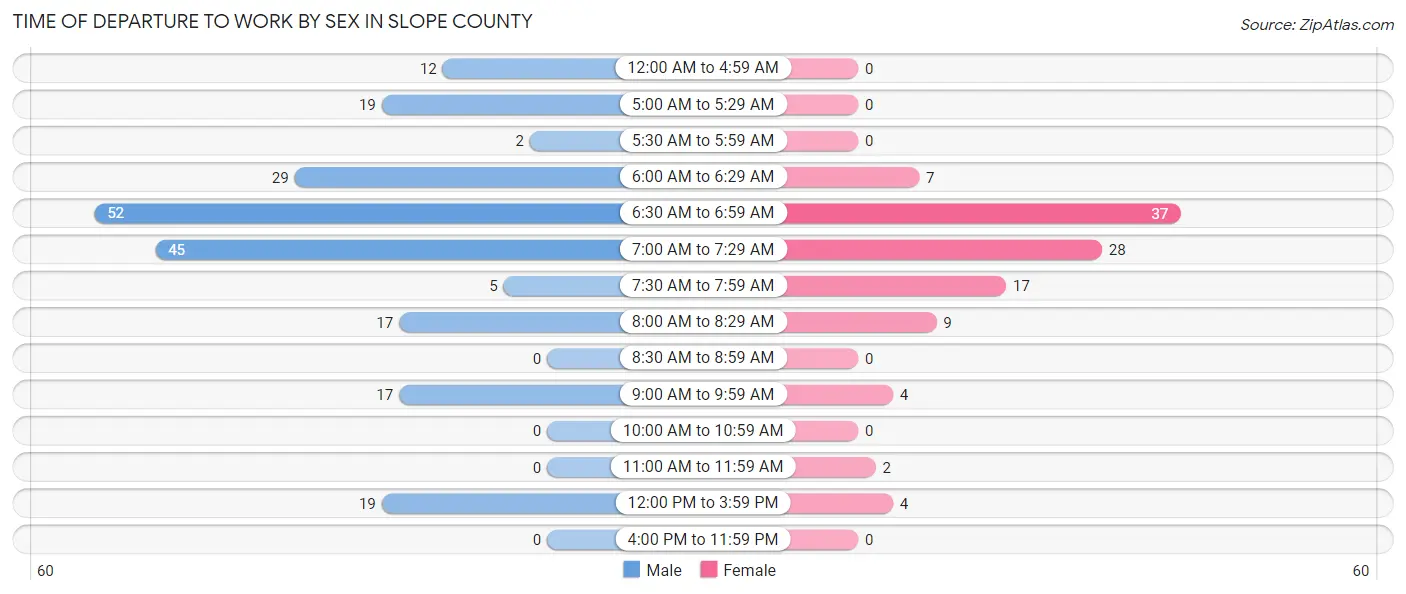
| Time of Departure | Male | Female |
| 12:00 AM to 4:59 AM | 12 (5.5%) | 0 (0.0%) |
| 5:00 AM to 5:29 AM | 19 (8.8%) | 0 (0.0%) |
| 5:30 AM to 5:59 AM | 2 (0.9%) | 0 (0.0%) |
| 6:00 AM to 6:29 AM | 29 (13.4%) | 7 (6.5%) |
| 6:30 AM to 6:59 AM | 52 (24.0%) | 37 (34.3%) |
| 7:00 AM to 7:29 AM | 45 (20.7%) | 28 (25.9%) |
| 7:30 AM to 7:59 AM | 5 (2.3%) | 17 (15.7%) |
| 8:00 AM to 8:29 AM | 17 (7.8%) | 9 (8.3%) |
| 8:30 AM to 8:59 AM | 0 (0.0%) | 0 (0.0%) |
| 9:00 AM to 9:59 AM | 17 (7.8%) | 4 (3.7%) |
| 10:00 AM to 10:59 AM | 0 (0.0%) | 0 (0.0%) |
| 11:00 AM to 11:59 AM | 0 (0.0%) | 2 (1.8%) |
| 12:00 PM to 3:59 PM | 19 (8.8%) | 4 (3.7%) |
| 4:00 PM to 11:59 PM | 0 (0.0%) | 0 (0.0%) |
| Total | 217 (100.0%) | 108 (100.0%) |
Housing Occupancy in Slope County
Occupancy by Ownership in Slope County
Of the total 351 dwellings in Slope County, owner-occupied units account for 317 (90.3%), while renter-occupied units make up 34 (9.7%).
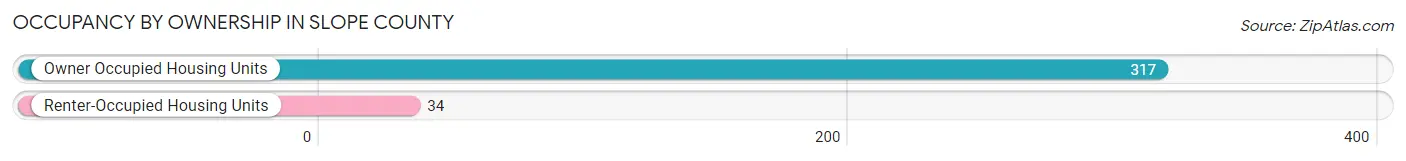
| Occupancy | # Housing Units | % Housing Units |
| Owner Occupied Housing Units | 317 | 90.3% |
| Renter-Occupied Housing Units | 34 | 9.7% |
| Total Occupied Housing Units | 351 | 100.0% |
Occupancy by Household Size in Slope County
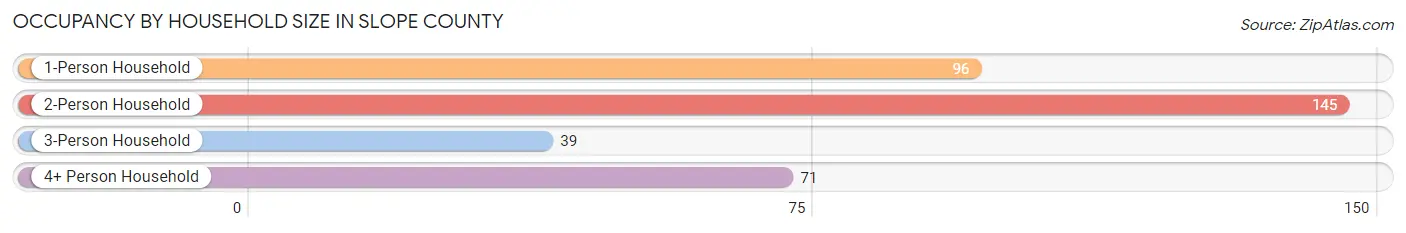
| Household Size | # Housing Units | % Housing Units |
| 1-Person Household | 96 | 27.4% |
| 2-Person Household | 145 | 41.3% |
| 3-Person Household | 39 | 11.1% |
| 4+ Person Household | 71 | 20.2% |
| Total Housing Units | 351 | 100.0% |
Occupancy by Ownership by Household Size in Slope County

| Household Size | Owner-occupied | Renter-occupied |
| 1-Person Household | 80 (83.3%) | 16 (16.7%) |
| 2-Person Household | 138 (95.2%) | 7 (4.8%) |
| 3-Person Household | 39 (100.0%) | 0 (0.0%) |
| 4+ Person Household | 60 (84.5%) | 11 (15.5%) |
| Total Housing Units | 317 (90.3%) | 34 (9.7%) |
Occupancy by Educational Attainment in Slope County

| Household Size | Owner-occupied | Renter-occupied |
| Less than High School | 26 (78.8%) | 7 (21.2%) |
| High School Diploma | 124 (95.4%) | 6 (4.6%) |
| College/Associate Degree | 89 (96.7%) | 3 (3.3%) |
| Bachelor's Degree or higher | 78 (81.2%) | 18 (18.8%) |
Occupancy by Age of Householder in Slope County
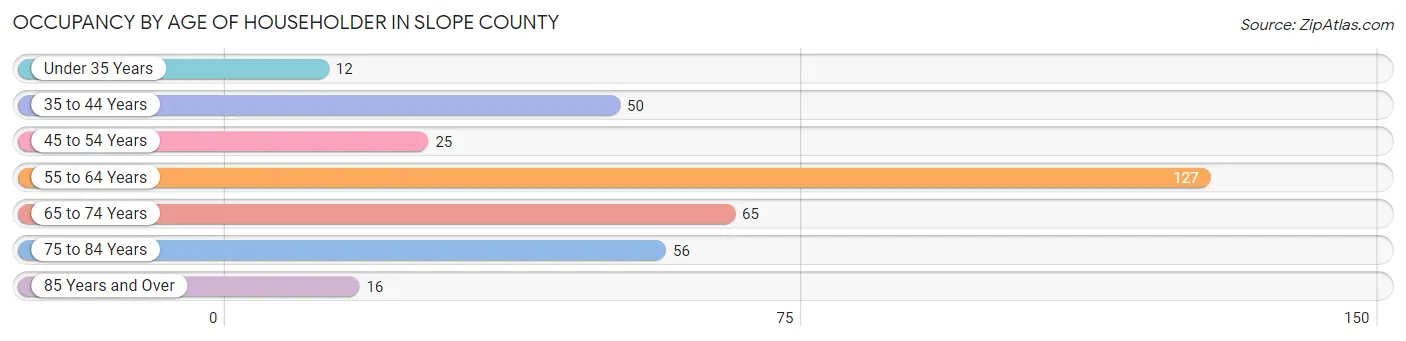
| Age Bracket | # Households | % Households |
| Under 35 Years | 12 | 3.4% |
| 35 to 44 Years | 50 | 14.2% |
| 45 to 54 Years | 25 | 7.1% |
| 55 to 64 Years | 127 | 36.2% |
| 65 to 74 Years | 65 | 18.5% |
| 75 to 84 Years | 56 | 16.0% |
| 85 Years and Over | 16 | 4.6% |
| Total | 351 | 100.0% |
Housing Finances in Slope County
Median Income by Occupancy in Slope County
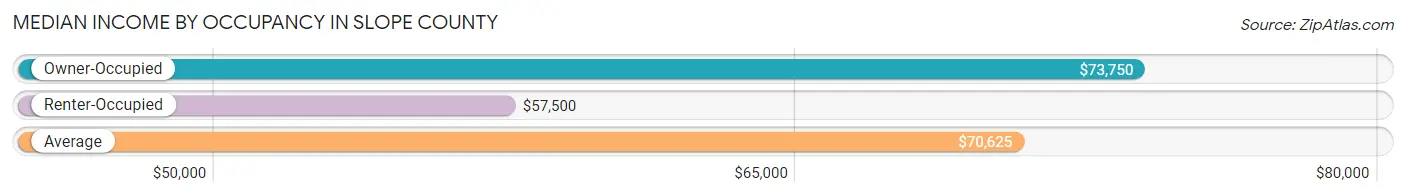
| Occupancy Type | # Households | Median Income |
| Owner-Occupied | 317 (90.3%) | $73,750 |
| Renter-Occupied | 34 (9.7%) | $57,500 |
| Average | 351 (100.0%) | $70,625 |
Occupancy by Householder Income Bracket in Slope County
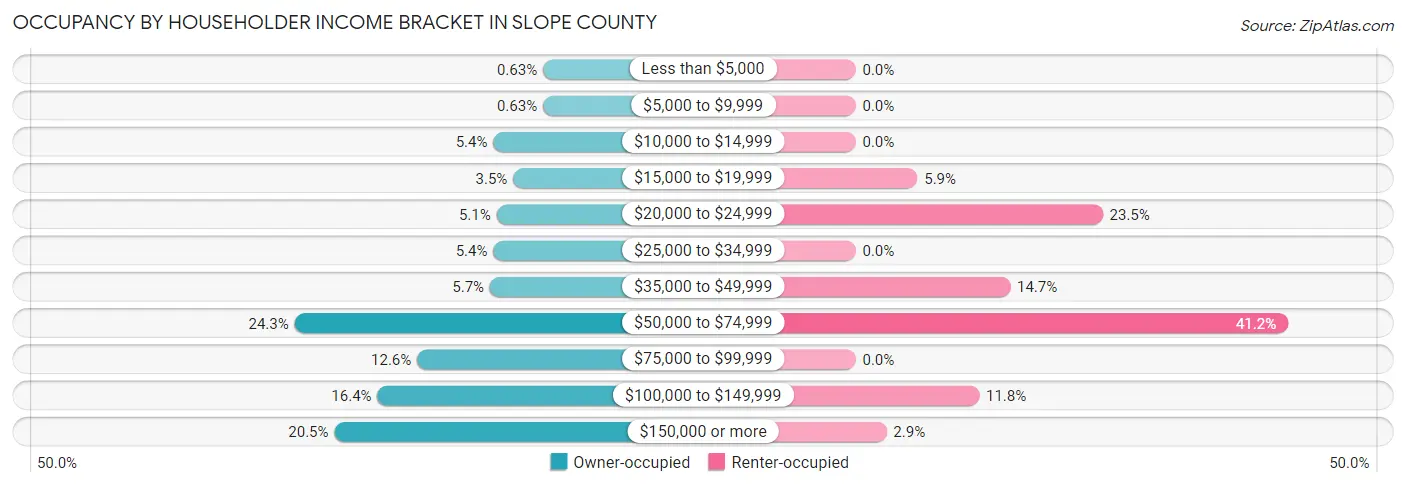
| Income Bracket | Owner-occupied | Renter-occupied |
| Less than $5,000 | 2 (0.6%) | 0 (0.0%) |
| $5,000 to $9,999 | 2 (0.6%) | 0 (0.0%) |
| $10,000 to $14,999 | 17 (5.4%) | 0 (0.0%) |
| $15,000 to $19,999 | 11 (3.5%) | 2 (5.9%) |
| $20,000 to $24,999 | 16 (5.1%) | 8 (23.5%) |
| $25,000 to $34,999 | 17 (5.4%) | 0 (0.0%) |
| $35,000 to $49,999 | 18 (5.7%) | 5 (14.7%) |
| $50,000 to $74,999 | 77 (24.3%) | 14 (41.2%) |
| $75,000 to $99,999 | 40 (12.6%) | 0 (0.0%) |
| $100,000 to $149,999 | 52 (16.4%) | 4 (11.8%) |
| $150,000 or more | 65 (20.5%) | 1 (2.9%) |
| Total | 317 (100.0%) | 34 (100.0%) |
Monthly Housing Cost Tiers in Slope County

| Monthly Cost | Owner-occupied | Renter-occupied |
| Less than $300 | 53 (16.7%) | 0 (0.0%) |
| $300 to $499 | 114 (36.0%) | 5 (14.7%) |
| $500 to $799 | 32 (10.1%) | 9 (26.5%) |
| $800 to $999 | 22 (6.9%) | 0 (0.0%) |
| $1,000 to $1,499 | 46 (14.5%) | 1 (2.9%) |
| $1,500 to $1,999 | 27 (8.5%) | 0 (0.0%) |
| $2,000 to $2,499 | 12 (3.8%) | 0 (0.0%) |
| $2,500 to $2,999 | 8 (2.5%) | 0 (0.0%) |
| $3,000 or more | 3 (0.9%) | 0 (0.0%) |
| Total | 317 (100.0%) | 34 (100.0%) |
Physical Housing Characteristics in Slope County
Housing Structures in Slope County

| Structure Type | # Housing Units | % Housing Units |
| Single Unit, Detached | 294 | 83.8% |
| Single Unit, Attached | 5 | 1.4% |
| 2 Unit Apartments | 0 | 0.0% |
| 3 or 4 Unit Apartments | 0 | 0.0% |
| 5 to 9 Unit Apartments | 0 | 0.0% |
| 10 or more Apartments | 1 | 0.3% |
| Mobile Home / Other | 51 | 14.5% |
| Total | 351 | 100.0% |
Housing Structures by Occupancy in Slope County
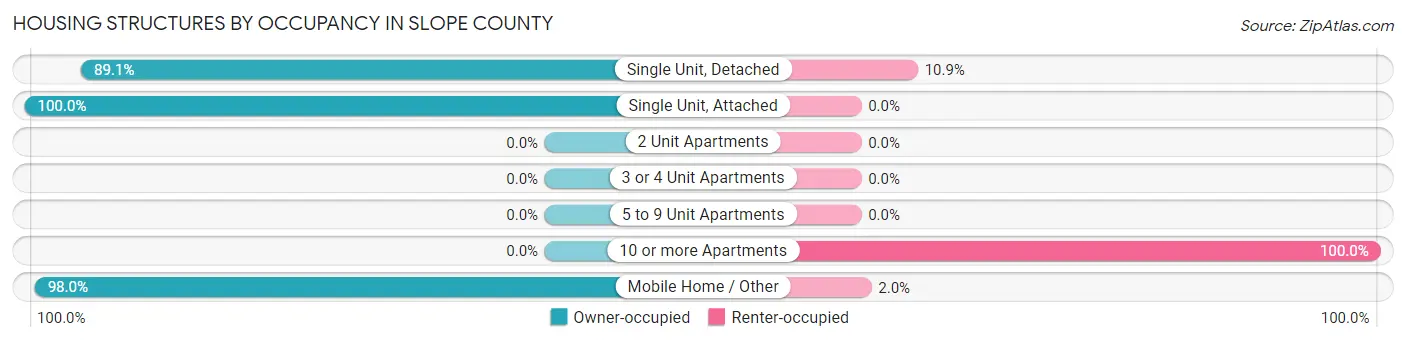
| Structure Type | Owner-occupied | Renter-occupied |
| Single Unit, Detached | 262 (89.1%) | 32 (10.9%) |
| Single Unit, Attached | 5 (100.0%) | 0 (0.0%) |
| 2 Unit Apartments | 0 (0.0%) | 0 (0.0%) |
| 3 or 4 Unit Apartments | 0 (0.0%) | 0 (0.0%) |
| 5 to 9 Unit Apartments | 0 (0.0%) | 0 (0.0%) |
| 10 or more Apartments | 0 (0.0%) | 1 (100.0%) |
| Mobile Home / Other | 50 (98.0%) | 1 (2.0%) |
| Total | 317 (90.3%) | 34 (9.7%) |
Housing Structures by Number of Rooms in Slope County
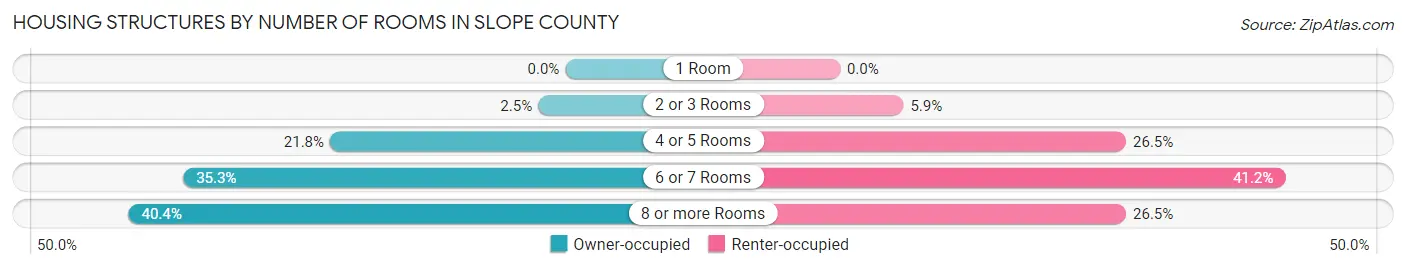
| Number of Rooms | Owner-occupied | Renter-occupied |
| 1 Room | 0 (0.0%) | 0 (0.0%) |
| 2 or 3 Rooms | 8 (2.5%) | 2 (5.9%) |
| 4 or 5 Rooms | 69 (21.8%) | 9 (26.5%) |
| 6 or 7 Rooms | 112 (35.3%) | 14 (41.2%) |
| 8 or more Rooms | 128 (40.4%) | 9 (26.5%) |
| Total | 317 (100.0%) | 34 (100.0%) |
Housing Structure by Heating Type in Slope County
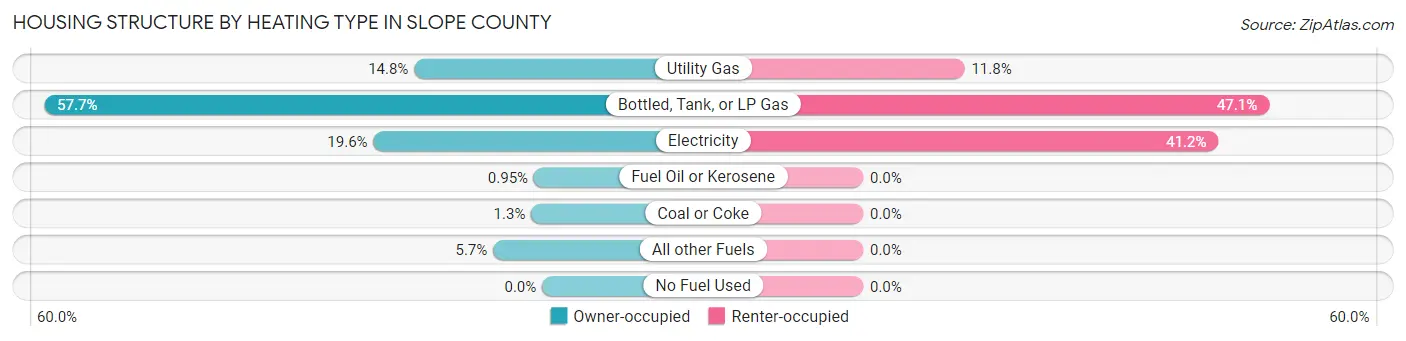
| Heating Type | Owner-occupied | Renter-occupied |
| Utility Gas | 47 (14.8%) | 4 (11.8%) |
| Bottled, Tank, or LP Gas | 183 (57.7%) | 16 (47.1%) |
| Electricity | 62 (19.6%) | 14 (41.2%) |
| Fuel Oil or Kerosene | 3 (0.9%) | 0 (0.0%) |
| Coal or Coke | 4 (1.3%) | 0 (0.0%) |
| All other Fuels | 18 (5.7%) | 0 (0.0%) |
| No Fuel Used | 0 (0.0%) | 0 (0.0%) |
| Total | 317 (100.0%) | 34 (100.0%) |
Household Vehicle Usage in Slope County
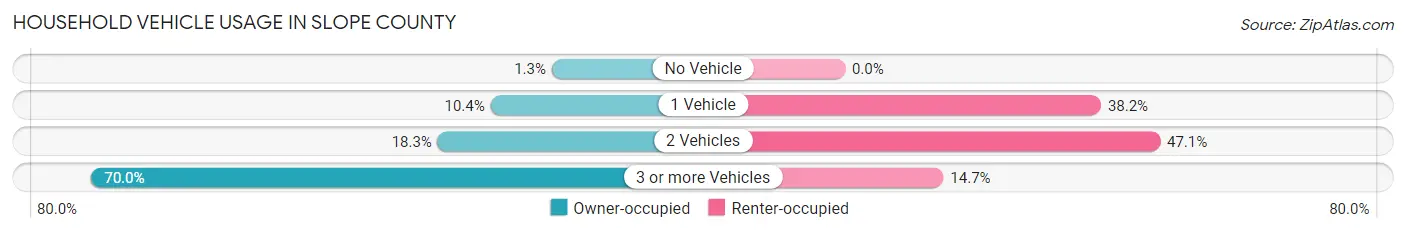
| Vehicles per Household | Owner-occupied | Renter-occupied |
| No Vehicle | 4 (1.3%) | 0 (0.0%) |
| 1 Vehicle | 33 (10.4%) | 13 (38.2%) |
| 2 Vehicles | 58 (18.3%) | 16 (47.1%) |
| 3 or more Vehicles | 222 (70.0%) | 5 (14.7%) |
| Total | 317 (100.0%) | 34 (100.0%) |
Real Estate & Mortgages in Slope County
Real Estate and Mortgage Overview in Slope County
| Characteristic | Without Mortgage | With Mortgage |
| Housing Units | 247 | 70 |
| Median Property Value | $96,700 | $253,300 |
| Median Household Income | $69,107 | $21 |
| Monthly Housing Costs | $411 | $3 |
| Real Estate Taxes | $281 | $2 |
Property Value by Mortgage Status in Slope County

| Property Value | Without Mortgage | With Mortgage |
| Less than $50,000 | 64 (25.9%) | 4 (5.7%) |
| $50,000 to $99,999 | 68 (27.5%) | 11 (15.7%) |
| $100,000 to $299,999 | 89 (36.0%) | 34 (48.6%) |
| $300,000 to $499,999 | 8 (3.2%) | 21 (30.0%) |
| $500,000 to $749,999 | 18 (7.3%) | 0 (0.0%) |
| $750,000 to $999,999 | 0 (0.0%) | 0 (0.0%) |
| $1,000,000 or more | 0 (0.0%) | 0 (0.0%) |
| Total | 247 (100.0%) | 70 (100.0%) |
Household Income by Mortgage Status in Slope County

| Household Income | Without Mortgage | With Mortgage |
| Less than $10,000 | 4 (1.6%) | 5 (7.1%) |
| $10,000 to $24,999 | 44 (17.8%) | 0 (0.0%) |
| $25,000 to $34,999 | 17 (6.9%) | 0 (0.0%) |
| $35,000 to $49,999 | 11 (4.4%) | 0 (0.0%) |
| $50,000 to $74,999 | 58 (23.5%) | 7 (10.0%) |
| $75,000 to $99,999 | 28 (11.3%) | 19 (27.1%) |
| $100,000 to $149,999 | 41 (16.6%) | 12 (17.1%) |
| $150,000 or more | 44 (17.8%) | 11 (15.7%) |
| Total | 247 (100.0%) | 70 (100.0%) |
Property Value to Household Income Ratio in Slope County
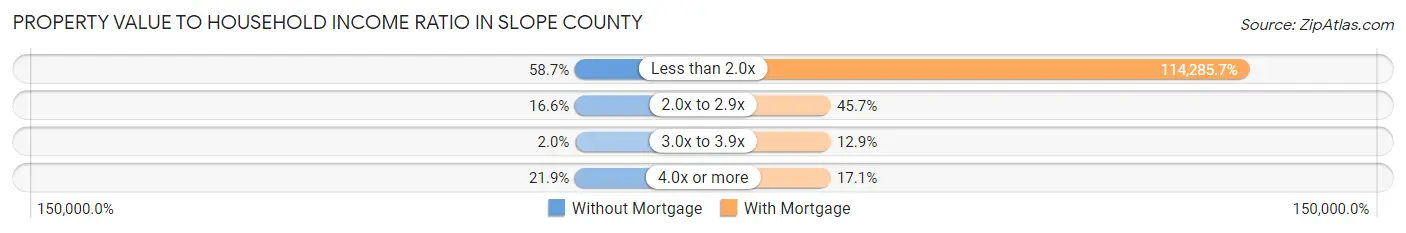
| Value-to-Income Ratio | Without Mortgage | With Mortgage |
| Less than 2.0x | 145 (58.7%) | 80,000 (114,285.7%) |
| 2.0x to 2.9x | 41 (16.6%) | 32 (45.7%) |
| 3.0x to 3.9x | 5 (2.0%) | 9 (12.9%) |
| 4.0x or more | 54 (21.9%) | 12 (17.1%) |
| Total | 247 (100.0%) | 70 (100.0%) |
Real Estate Taxes by Mortgage Status in Slope County

| Property Taxes | Without Mortgage | With Mortgage |
| Less than $800 | 127 (51.4%) | 0 (0.0%) |
| $800 to $1,499 | 20 (8.1%) | 50 (71.4%) |
| $800 to $1,499 | 43 (17.4%) | 12 (17.1%) |
| Total | 247 (100.0%) | 70 (100.0%) |
Health & Disability in Slope County
Health Insurance Coverage by Age in Slope County
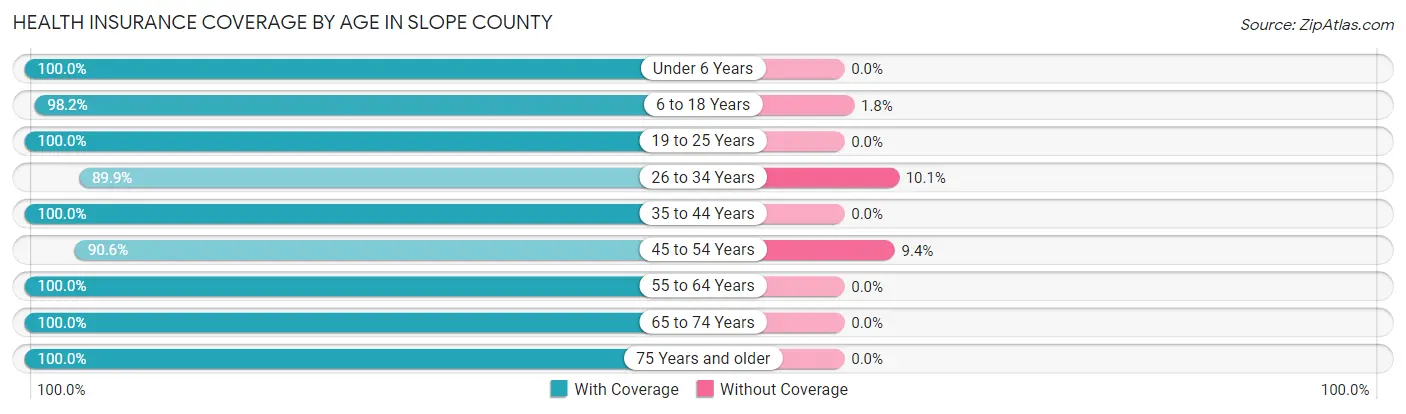
| Age Bracket | With Coverage | Without Coverage |
| Under 6 Years | 14 (100.0%) | 0 (0.0%) |
| 6 to 18 Years | 162 (98.2%) | 3 (1.8%) |
| 19 to 25 Years | 13 (100.0%) | 0 (0.0%) |
| 26 to 34 Years | 62 (89.9%) | 7 (10.1%) |
| 35 to 44 Years | 100 (100.0%) | 0 (0.0%) |
| 45 to 54 Years | 58 (90.6%) | 6 (9.4%) |
| 55 to 64 Years | 186 (100.0%) | 0 (0.0%) |
| 65 to 74 Years | 129 (100.0%) | 0 (0.0%) |
| 75 Years and older | 97 (100.0%) | 0 (0.0%) |
| Total | 821 (98.1%) | 16 (1.9%) |
Health Insurance Coverage by Citizenship Status in Slope County
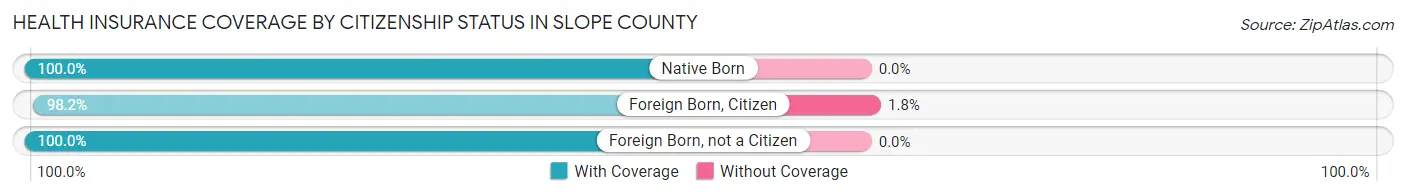
| Citizenship Status | With Coverage | Without Coverage |
| Native Born | 14 (100.0%) | 0 (0.0%) |
| Foreign Born, Citizen | 162 (98.2%) | 3 (1.8%) |
| Foreign Born, not a Citizen | 13 (100.0%) | 0 (0.0%) |
Health Insurance Coverage by Household Income in Slope County

| Household Income | With Coverage | Without Coverage |
| Under $25,000 | 90 (100.0%) | 0 (0.0%) |
| $25,000 to $49,999 | 114 (100.0%) | 0 (0.0%) |
| $50,000 to $74,999 | 175 (95.1%) | 9 (4.9%) |
| $75,000 to $99,999 | 77 (100.0%) | 0 (0.0%) |
| $100,000 and over | 365 (98.1%) | 7 (1.9%) |
Public vs Private Health Insurance Coverage by Age in Slope County
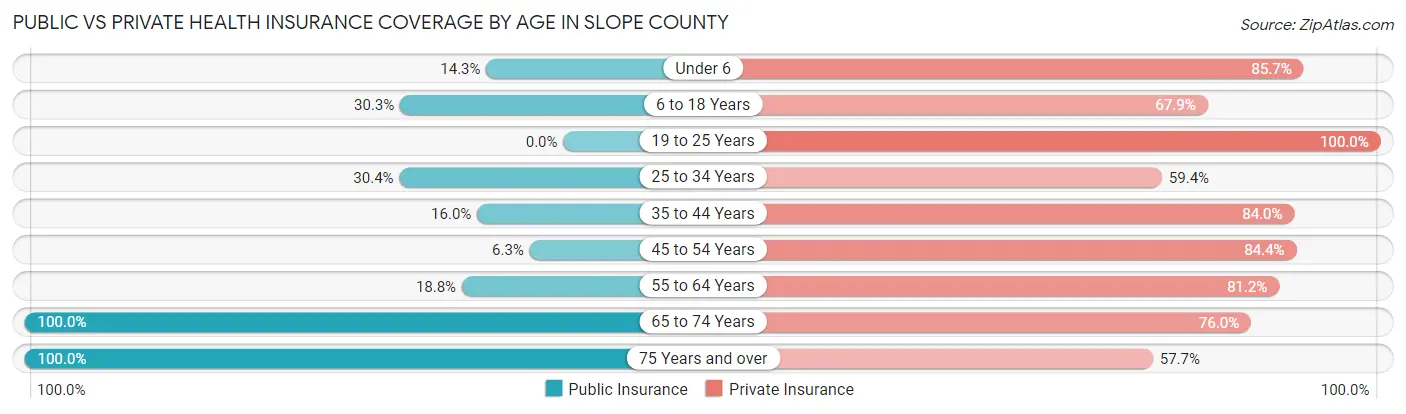
| Age Bracket | Public Insurance | Private Insurance |
| Under 6 | 2 (14.3%) | 12 (85.7%) |
| 6 to 18 Years | 50 (30.3%) | 112 (67.9%) |
| 19 to 25 Years | 0 (0.0%) | 13 (100.0%) |
| 25 to 34 Years | 21 (30.4%) | 41 (59.4%) |
| 35 to 44 Years | 16 (16.0%) | 84 (84.0%) |
| 45 to 54 Years | 4 (6.2%) | 54 (84.4%) |
| 55 to 64 Years | 35 (18.8%) | 151 (81.2%) |
| 65 to 74 Years | 129 (100.0%) | 98 (76.0%) |
| 75 Years and over | 97 (100.0%) | 56 (57.7%) |
| Total | 354 (42.3%) | 621 (74.2%) |
Disability Status by Sex by Age in Slope County
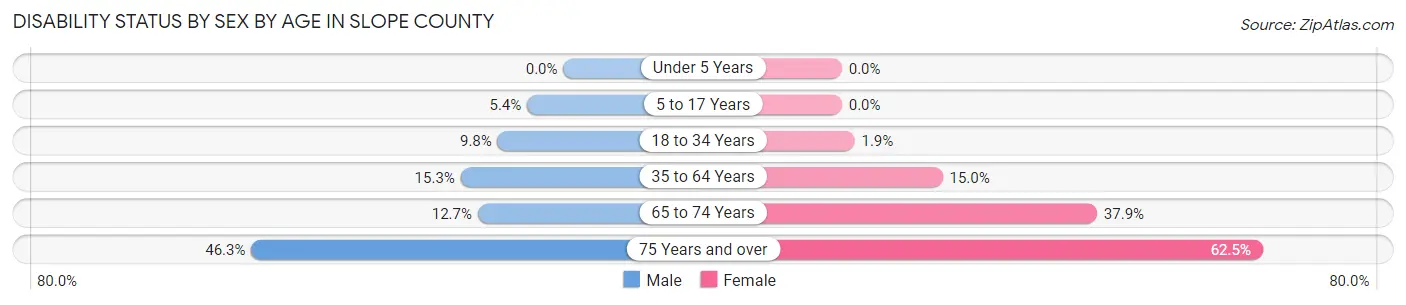
| Age Bracket | Male | Female |
| Under 5 Years | 0 (0.0%) | 0 (0.0%) |
| 5 to 17 Years | 5 (5.4%) | 0 (0.0%) |
| 18 to 34 Years | 4 (9.8%) | 1 (1.9%) |
| 35 to 64 Years | 34 (15.2%) | 19 (15.0%) |
| 65 to 74 Years | 8 (12.7%) | 25 (37.9%) |
| 75 Years and over | 19 (46.3%) | 35 (62.5%) |
Disability Class by Sex by Age in Slope County
Disability Class: Hearing Difficulty
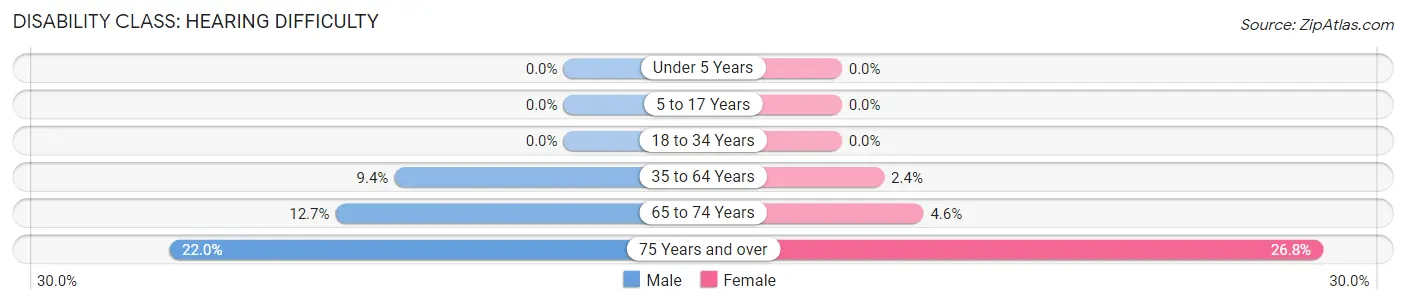
| Age Bracket | Male | Female |
| Under 5 Years | 0 (0.0%) | 0 (0.0%) |
| 5 to 17 Years | 0 (0.0%) | 0 (0.0%) |
| 18 to 34 Years | 0 (0.0%) | 0 (0.0%) |
| 35 to 64 Years | 21 (9.4%) | 3 (2.4%) |
| 65 to 74 Years | 8 (12.7%) | 3 (4.5%) |
| 75 Years and over | 9 (22.0%) | 15 (26.8%) |
Disability Class: Vision Difficulty
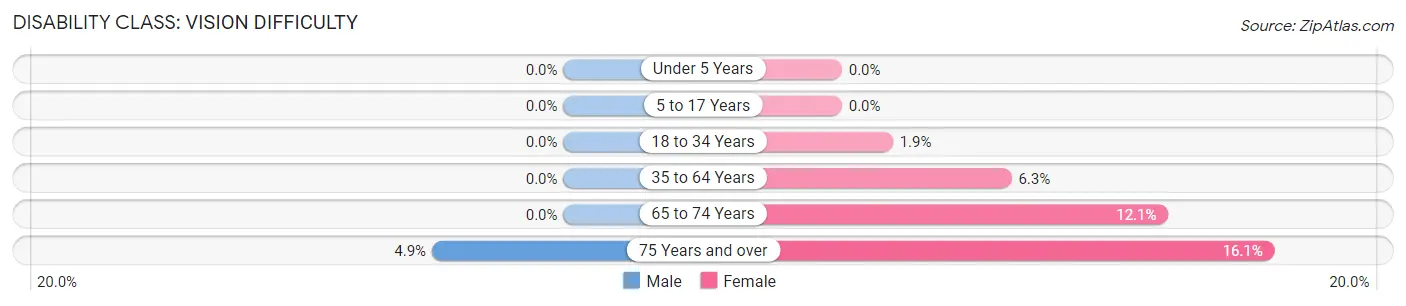
| Age Bracket | Male | Female |
| Under 5 Years | 0 (0.0%) | 0 (0.0%) |
| 5 to 17 Years | 0 (0.0%) | 0 (0.0%) |
| 18 to 34 Years | 0 (0.0%) | 1 (1.9%) |
| 35 to 64 Years | 0 (0.0%) | 8 (6.3%) |
| 65 to 74 Years | 0 (0.0%) | 8 (12.1%) |
| 75 Years and over | 2 (4.9%) | 9 (16.1%) |
Disability Class: Cognitive Difficulty
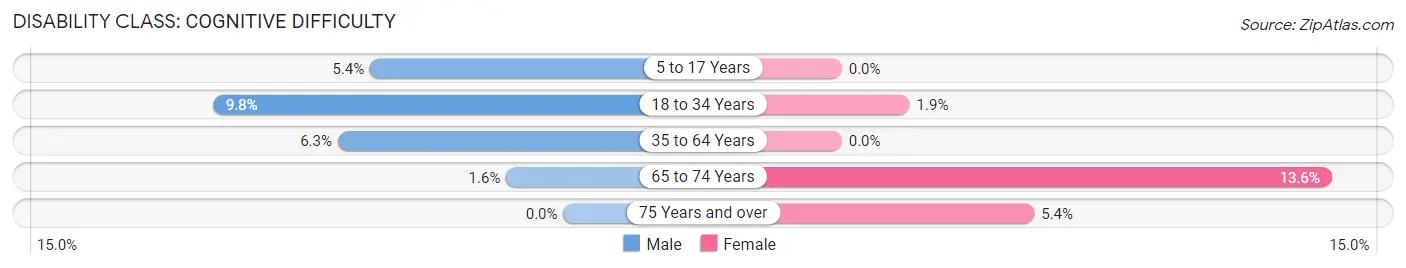
| Age Bracket | Male | Female |
| 5 to 17 Years | 5 (5.4%) | 0 (0.0%) |
| 18 to 34 Years | 4 (9.8%) | 1 (1.9%) |
| 35 to 64 Years | 14 (6.3%) | 0 (0.0%) |
| 65 to 74 Years | 1 (1.6%) | 9 (13.6%) |
| 75 Years and over | 0 (0.0%) | 3 (5.4%) |
Disability Class: Ambulatory Difficulty

| Age Bracket | Male | Female |
| 5 to 17 Years | 0 (0.0%) | 0 (0.0%) |
| 18 to 34 Years | 0 (0.0%) | 0 (0.0%) |
| 35 to 64 Years | 13 (5.8%) | 14 (11.0%) |
| 65 to 74 Years | 5 (7.9%) | 8 (12.1%) |
| 75 Years and over | 8 (19.5%) | 19 (33.9%) |
Disability Class: Self-Care Difficulty
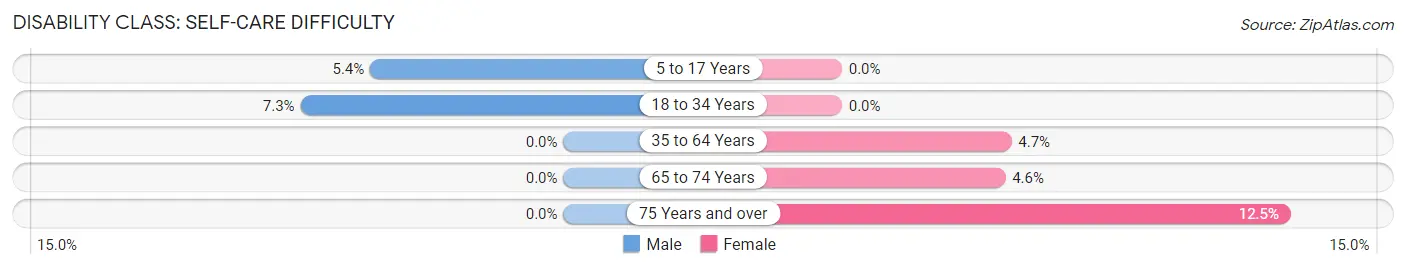
| Age Bracket | Male | Female |
| 5 to 17 Years | 5 (5.4%) | 0 (0.0%) |
| 18 to 34 Years | 3 (7.3%) | 0 (0.0%) |
| 35 to 64 Years | 0 (0.0%) | 6 (4.7%) |
| 65 to 74 Years | 0 (0.0%) | 3 (4.5%) |
| 75 Years and over | 0 (0.0%) | 7 (12.5%) |
Technology Access in Slope County
Computing Device Access in Slope County
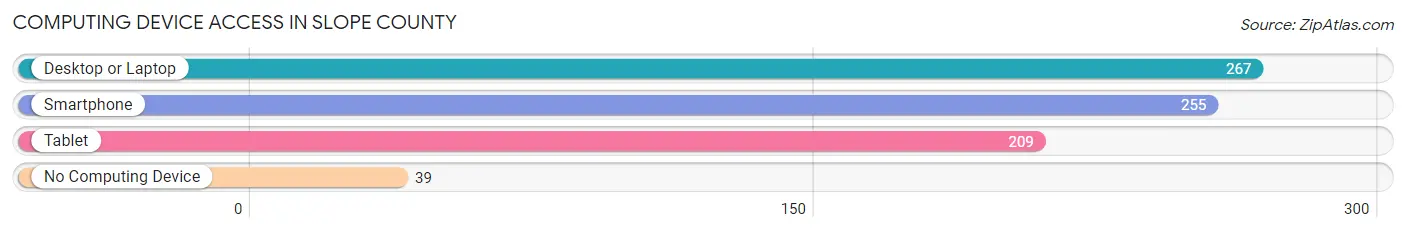
| Device Type | # Households | % Households |
| Desktop or Laptop | 267 | 76.1% |
| Smartphone | 255 | 72.7% |
| Tablet | 209 | 59.5% |
| No Computing Device | 39 | 11.1% |
| Total | 351 | 100.0% |
Internet Access in Slope County
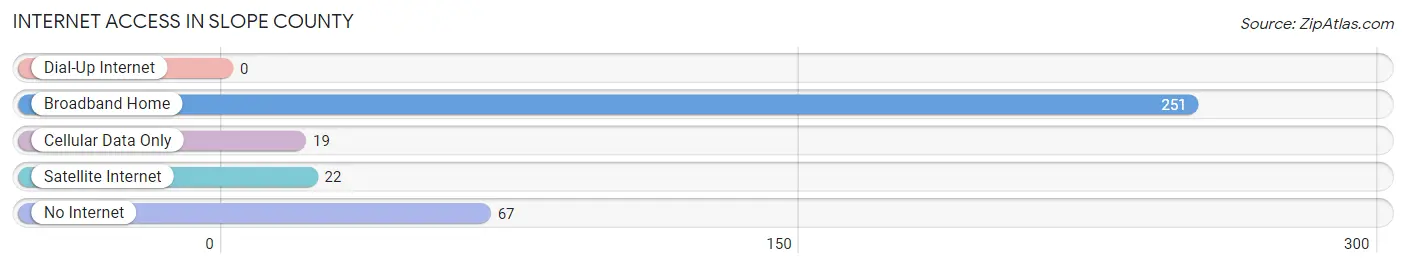
| Internet Type | # Households | % Households |
| Dial-Up Internet | 0 | 0.0% |
| Broadband Home | 251 | 71.5% |
| Cellular Data Only | 19 | 5.4% |
| Satellite Internet | 22 | 6.3% |
| No Internet | 67 | 19.1% |
| Total | 351 | 100.0% |
Slope County Summary
Slope County is located in the western part of North Dakota, and is bordered by Stark County to the north, Billings County to the east, Bowman County to the south, and Harding County to the west. The county seat is Amidon, and the county has a total area of 1,845 square miles.
History
Slope County was established in 1883, and was named for the sloping terrain of the area. The county was originally part of Stark County, and was created when the state legislature divided Stark County into two parts. The first settlers in the area were ranchers, who were attracted by the abundance of grass and water. The first town in the county was Amidon, which was established in 1884.
Geography
Slope County is located in the western part of North Dakota, and is bordered by Stark County to the north, Billings County to the east, Bowman County to the south, and Harding County to the west. The county has a total area of 1,845 square miles, and is mostly covered by prairie grasslands. The terrain is generally flat, with some rolling hills in the western part of the county. The county is home to several small lakes, including Lake Sakakawea, which is the largest lake in the state.
Economy
The economy of Slope County is largely based on agriculture. The county is home to several large farms, which produce a variety of crops, including wheat, corn, soybeans, and sunflowers. Cattle ranching is also an important part of the local economy. The county is also home to several oil and gas wells, which provide jobs and revenue for the county.
Demographics
As of the 2010 census, Slope County had a population of 1,845. The population is mostly white (97.2%), with a small Native American population (1.2%). The median household income is $45,000, and the median home value is $90,000. The unemployment rate is 4.2%.
Slope County is a rural area, and is home to several small towns, including Amidon, Marmarth, and Reeder. The county is served by several small schools, including Amidon Elementary School, Marmarth Elementary School, and Reeder High School. The county is also home to several churches, including the Amidon United Methodist Church, the Marmarth Lutheran Church, and the Reeder Baptist Church.
Common Questions
What is the Total Population of Slope County?
Total Population of Slope County is 837.
What is the Total Male Population of Slope County?
Total Male Population of Slope County is 466.
What is the Total Female Population of Slope County?
Total Female Population of Slope County is 371.
What is the Ratio of Males per 100 Females in Slope County?
There are 125.61 Males per 100 Females in Slope County.
What is the Ratio of Females per 100 Males in Slope County?
There are 79.61 Females per 100 Males in Slope County.
What is the Median Population Age in Slope County?
Median Population Age in Slope County is 54.1 Years.
What is the Average Family Size in Slope County
Average Family Size in Slope County is 2.8 People.
What is the Average Household Size in Slope County
Average Household Size in Slope County is 2.4 People.
What is Per Capita Income in Slope County?
Per Capita income in Slope County is $40,987.
What is the Median Family Income in Slope County?
Median Family Income in Slope County is $80,972.
What is the Median Household income in Slope County?
Median Household Income in Slope County is $70,625.
What is Income or Wage Gap in Slope County?
Income or Wage Gap in Slope County is 51.7%.
Women in Slope County earn 48.3 cents for every dollar earned by a man.
What is Family Income Deficit in Slope County?
Family Income Deficit in Slope County is $4,293.
Families that are below poverty line in Slope County earn $4,293 less on average than the poverty threshold level.
What is Inequality or Gini Index in Slope County?
Inequality or Gini Index in Slope County is 0.44.
How Large is the Labor Force in Slope County?
There are 440 People in the Labor Forcein in Slope County.
What is the Percentage of People in the Labor Force in Slope County?
62.9% of People are in the Labor Force in Slope County.
What is the Unemployment Rate in Slope County?
Unemployment Rate in Slope County is 4.5%.