Sioux County, ND
Sioux County Map
Sioux County Overview
3,896
TOTAL POPULATION
1,958
MALE POPULATION
1,938
FEMALE POPULATION
101.03
MALES / 100 FEMALES
98.98
FEMALES / 100 MALES
27.1
MEDIAN AGE
4.4
AVG FAMILY SIZE
3.7
AVG HOUSEHOLD SIZE
$17,185
PER CAPITA INCOME
$46,719
AVG FAMILY INCOME
$41,201
AVG HOUSEHOLD INCOME
10.7%
WAGE / INCOME GAP [ % ]
89.3¢/ $1
WAGE / INCOME GAP [ $ ]
$18,880
FAMILY INCOME DEFICIT
0.52
INEQUALITY / GINI INDEX
1,345
LABOR FORCE [ PEOPLE ]
50.1%
PERCENT IN LABOR FORCE
20.7%
UNEMPLOYMENT RATE
Sioux County Area Codes
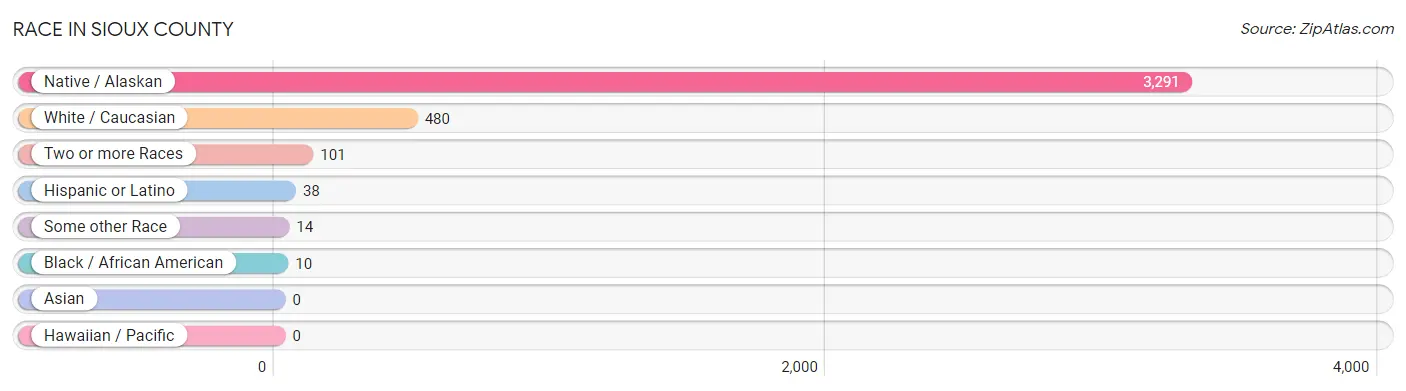
Race in Sioux County
The most populous races in Sioux County are Native / Alaskan (3,291 | 84.5%), White / Caucasian (480 | 12.3%), and Two or more Races (101 | 2.6%).
| Race | # Population | % Population |
| Asian | 0 | 0.0% |
| Black / African American | 10 | 0.3% |
| Hawaiian / Pacific | 0 | 0.0% |
| Hispanic or Latino | 38 | 1.0% |
| Native / Alaskan | 3,291 | 84.5% |
| White / Caucasian | 480 | 12.3% |
| Two or more Races | 101 | 2.6% |
| Some other Race | 14 | 0.4% |
| Total | 3,896 | 100.0% |
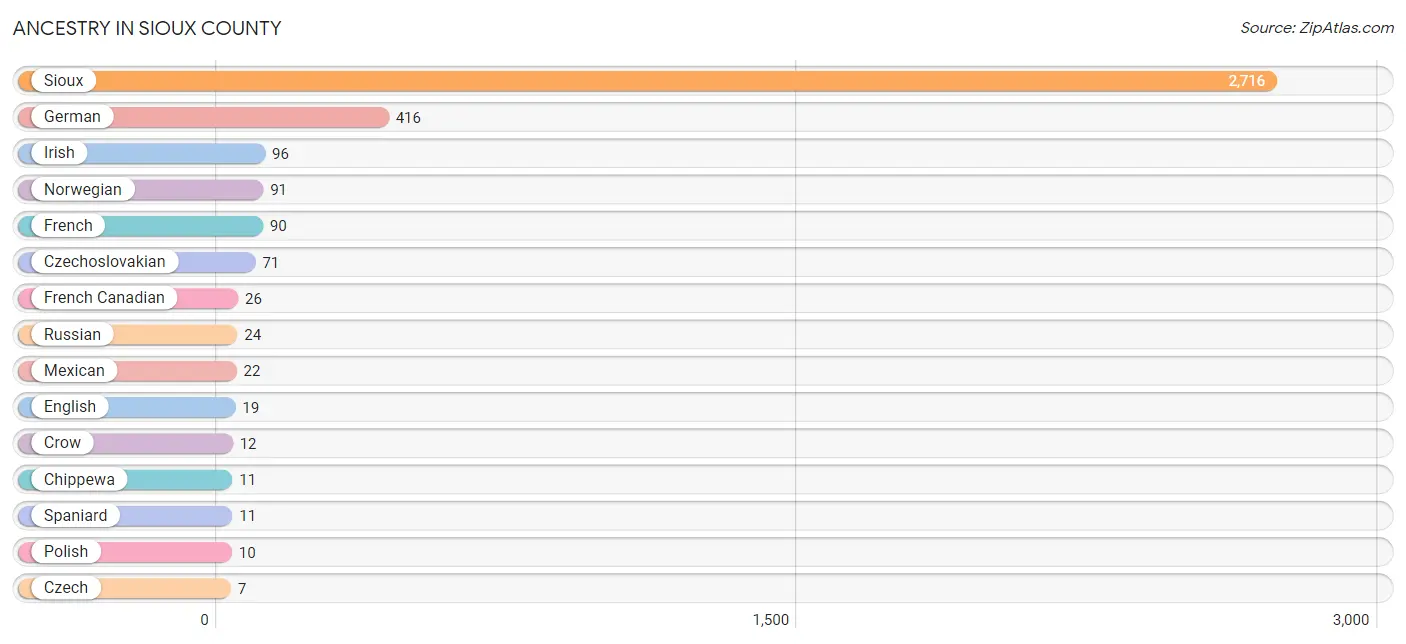
Ancestry in Sioux County
The most populous ancestries reported in Sioux County are Sioux (2,716 | 69.7%), German (416 | 10.7%), Irish (96 | 2.5%), Norwegian (91 | 2.3%), and French (90 | 2.3%), together accounting for 87.5% of all Sioux County residents.
| Ancestry | # Population | % Population |
| Apache | 6 | 0.2% |
| Arab | 1 | 0.0% |
| Australian | 1 | 0.0% |
| Austrian | 1 | 0.0% |
| Cherokee | 4 | 0.1% |
| Chippewa | 11 | 0.3% |
| Croatian | 2 | 0.1% |
| Crow | 12 | 0.3% |
| Czech | 7 | 0.2% |
| Czechoslovakian | 71 | 1.8% |
| Danish | 7 | 0.2% |
| English | 19 | 0.5% |
| French | 90 | 2.3% |
| French Canadian | 26 | 0.7% |
| German | 416 | 10.7% |
| German Russian | 2 | 0.1% |
| Hungarian | 5 | 0.1% |
| Icelander | 1 | 0.0% |
| Irish | 96 | 2.5% |
| Italian | 2 | 0.1% |
| Lebanese | 1 | 0.0% |
| Macedonian | 2 | 0.1% |
| Mexican | 22 | 0.6% |
| Navajo | 2 | 0.1% |
| Nigerian | 1 | 0.0% |
| Norwegian | 91 | 2.3% |
| Paiute | 2 | 0.1% |
| Polish | 10 | 0.3% |
| Russian | 24 | 0.6% |
| Scotch-Irish | 3 | 0.1% |
| Scottish | 2 | 0.1% |
| Sioux | 2,716 | 69.7% |
| Spaniard | 11 | 0.3% |
| Spanish | 5 | 0.1% |
| Subsaharan African | 1 | 0.0% |
| Swedish | 5 | 0.1% |
| Swiss | 7 | 0.2% |
| Ukrainian | 1 | 0.0% |
| Welsh | 3 | 0.1% | View All 39 Rows |
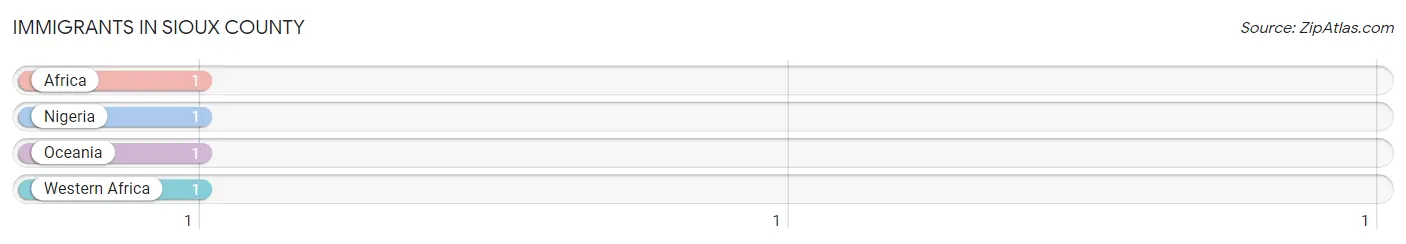
Immigrants in Sioux County
The most numerous immigrant groups reported in Sioux County came from Africa (1 | 0.0%), Nigeria (1 | 0.0%), Oceania (1 | 0.0%), and Western Africa (1 | 0.0%), together accounting for 0.1% of all Sioux County residents.
| Immigration Origin | # Population | % Population |
| Africa | 1 | 0.0% |
| Nigeria | 1 | 0.0% |
| Oceania | 1 | 0.0% |
| Western Africa | 1 | 0.0% | View All 4 Rows |
Sex and Age in Sioux County
Sex and Age in Sioux County
The most populous age groups in Sioux County are 10 to 14 Years (243 | 12.4%) for men and 10 to 14 Years (227 | 11.7%) for women.
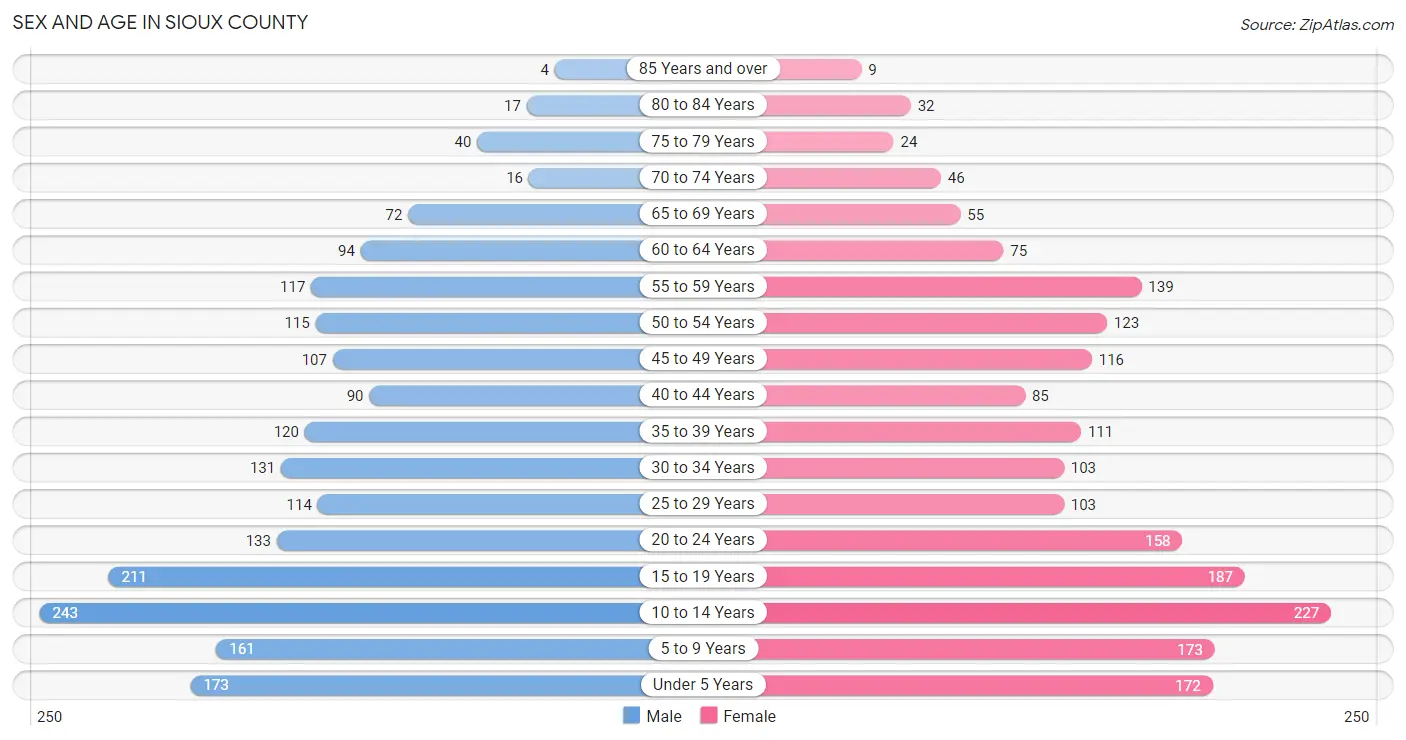
| Age Bracket | Male | Female |
| Under 5 Years | 173 (8.8%) | 172 (8.9%) |
| 5 to 9 Years | 161 (8.2%) | 173 (8.9%) |
| 10 to 14 Years | 243 (12.4%) | 227 (11.7%) |
| 15 to 19 Years | 211 (10.8%) | 187 (9.7%) |
| 20 to 24 Years | 133 (6.8%) | 158 (8.2%) |
| 25 to 29 Years | 114 (5.8%) | 103 (5.3%) |
| 30 to 34 Years | 131 (6.7%) | 103 (5.3%) |
| 35 to 39 Years | 120 (6.1%) | 111 (5.7%) |
| 40 to 44 Years | 90 (4.6%) | 85 (4.4%) |
| 45 to 49 Years | 107 (5.5%) | 116 (6.0%) |
| 50 to 54 Years | 115 (5.9%) | 123 (6.4%) |
| 55 to 59 Years | 117 (6.0%) | 139 (7.2%) |
| 60 to 64 Years | 94 (4.8%) | 75 (3.9%) |
| 65 to 69 Years | 72 (3.7%) | 55 (2.8%) |
| 70 to 74 Years | 16 (0.8%) | 46 (2.4%) |
| 75 to 79 Years | 40 (2.0%) | 24 (1.2%) |
| 80 to 84 Years | 17 (0.9%) | 32 (1.7%) |
| 85 Years and over | 4 (0.2%) | 9 (0.5%) |
| Total | 1,958 (100.0%) | 1,938 (100.0%) |
Families and Households in Sioux County
Median Family Size in Sioux County
The median family size in Sioux County is 4.43 persons per family, with single female/mother families (317 | 42.0%) accounting for the largest median family size of 4.71 persons per family. On the other hand, single male/father families (124 | 16.4%) represent the smallest median family size with 3.98 persons per family.
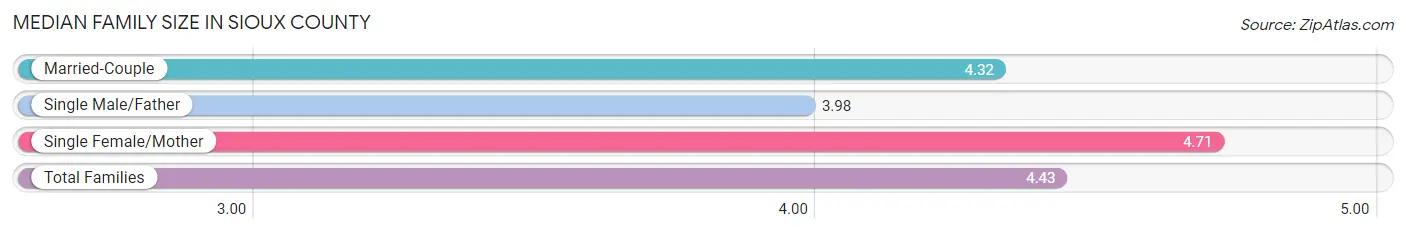
| Family Type | # Families | Family Size |
| Married-Couple | 314 (41.6%) | 4.32 |
| Single Male/Father | 124 (16.4%) | 3.98 |
| Single Female/Mother | 317 (42.0%) | 4.71 |
| Total Families | 755 (100.0%) | 4.43 |
Median Household Size in Sioux County
The median household size in Sioux County is 3.67 persons per household, with single female/mother households (317 | 30.3%) accounting for the largest median household size of 4.96 persons per household. non-family households (292 | 27.9%) represent the smallest median household size with 1.15 persons per household.
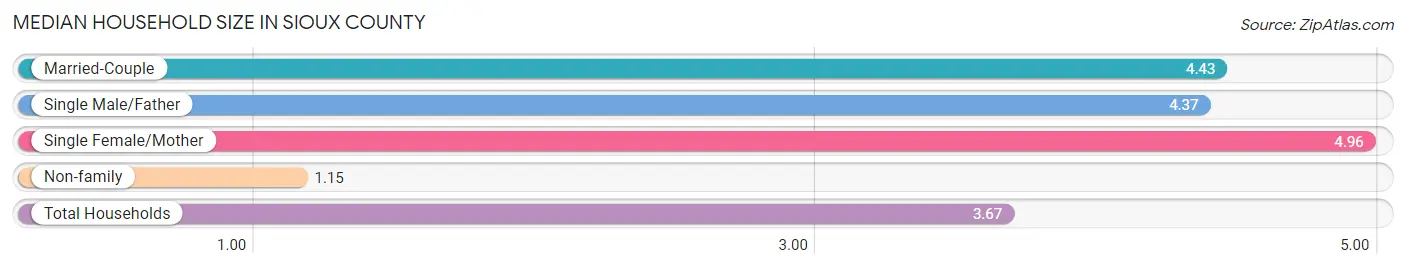
| Household Type | # Households | Household Size |
| Married-Couple | 314 (30.0%) | 4.43 |
| Single Male/Father | 124 (11.8%) | 4.37 |
| Single Female/Mother | 317 (30.3%) | 4.96 |
| Non-family | 292 (27.9%) | 1.15 |
| Total Households | 1,047 (100.0%) | 3.67 |
Household Size by Marriage Status in Sioux County
Out of a total of 1,047 households in Sioux County, 755 (72.1%) are family households, while 292 (27.9%) are nonfamily households. The most numerous type of family households are 2-person households, comprising 189, and the most common type of nonfamily households are 1-person households, comprising 245.
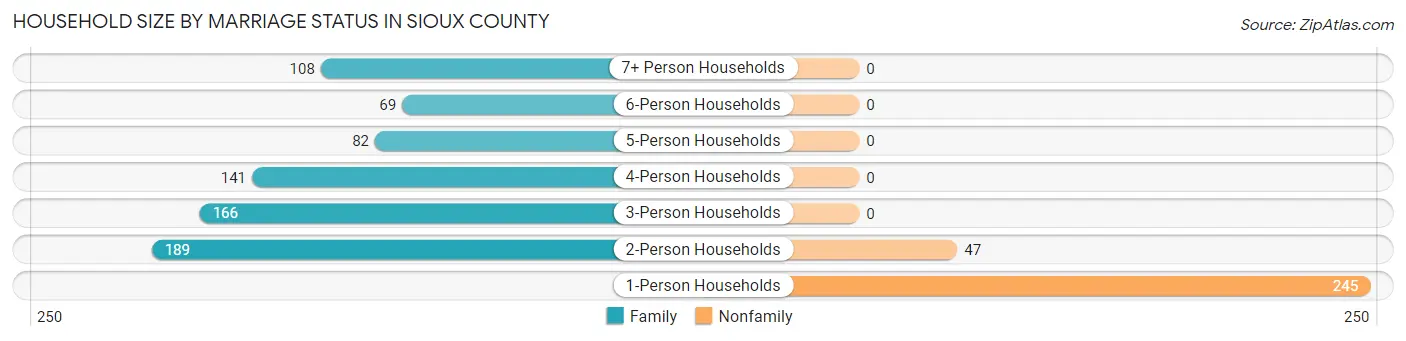
| Household Size | Family Households | Nonfamily Households |
| 1-Person Households | - | 245 (23.4%) |
| 2-Person Households | 189 (18.0%) | 47 (4.5%) |
| 3-Person Households | 166 (15.9%) | 0 (0.0%) |
| 4-Person Households | 141 (13.5%) | 0 (0.0%) |
| 5-Person Households | 82 (7.8%) | 0 (0.0%) |
| 6-Person Households | 69 (6.6%) | 0 (0.0%) |
| 7+ Person Households | 108 (10.3%) | 0 (0.0%) |
| Total | 755 (72.1%) | 292 (27.9%) |
Female Fertility in Sioux County
Fertility by Age in Sioux County
Average fertility rate in Sioux County is 73.0 births per 1,000 women. Women in the age bracket of 20 to 34 years have the highest fertility rate with 91.0 births per 1,000 women. Women in the age bracket of 20 to 34 years acount for 51.6% of all women with births.
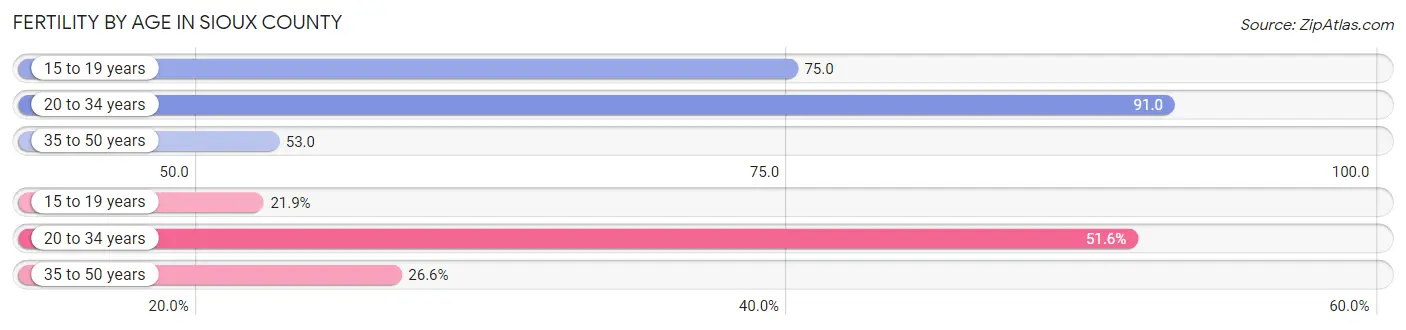
| Age Bracket | Women with Births | Births / 1,000 Women |
| 15 to 19 years | 14 (21.9%) | 75.0 |
| 20 to 34 years | 33 (51.6%) | 91.0 |
| 35 to 50 years | 17 (26.6%) | 53.0 |
| Total | 64 (100.0%) | 73.0 |
Fertility by Age by Marriage Status in Sioux County
42.2% of women with births (64) in Sioux County are married. The highest percentage of unmarried women with births falls into 15 to 19 years age bracket with 100.0% of them unmarried at the time of birth, while the lowest percentage of unmarried women with births belong to 20 to 34 years age bracket with 18.2% of them unmarried.
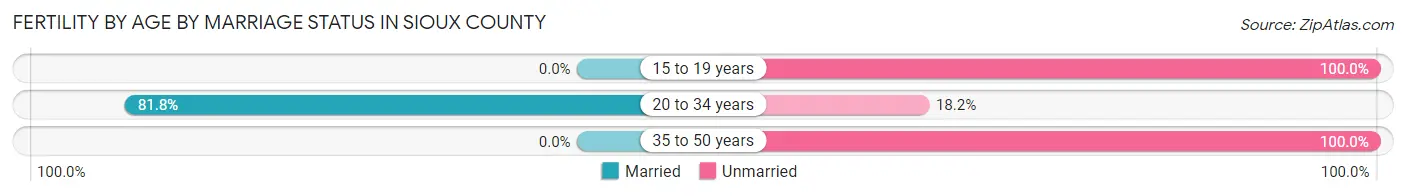
| Age Bracket | Married | Unmarried |
| 15 to 19 years | 0 (0.0%) | 14 (100.0%) |
| 20 to 34 years | 27 (81.8%) | 6 (18.2%) |
| 35 to 50 years | 0 (0.0%) | 17 (100.0%) |
| Total | 27 (42.2%) | 37 (57.8%) |
Fertility by Education in Sioux County
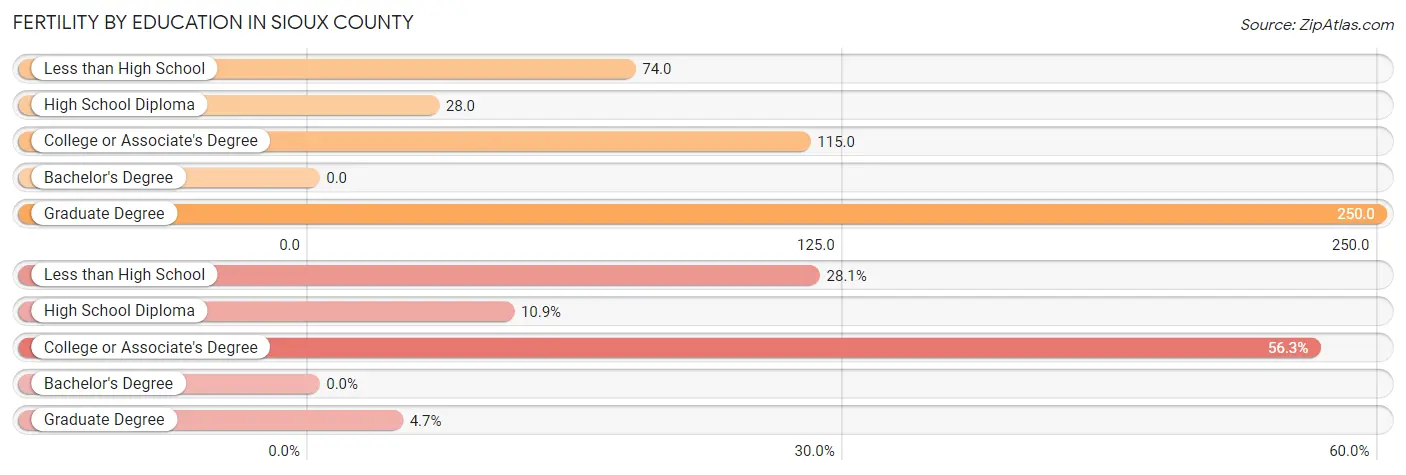
| Educational Attainment | Women with Births | Births / 1,000 Women |
| Less than High School | 18 (28.1%) | 74.0 |
| High School Diploma | 7 (10.9%) | 28.0 |
| College or Associate's Degree | 36 (56.2%) | 115.0 |
| Bachelor's Degree | 0 (0.0%) | 0.0 |
| Graduate Degree | 3 (4.7%) | 250.0 |
| Total | 64 (100.0%) | 73.0 |
Fertility by Education by Marriage Status in Sioux County
57.8% of women with births in Sioux County are unmarried. Women with the educational attainment of graduate degree are most likely to be married with 100.0% of them married at childbirth, while women with the educational attainment of high school diploma are least likely to be married with 100.0% of them unmarried at childbirth.
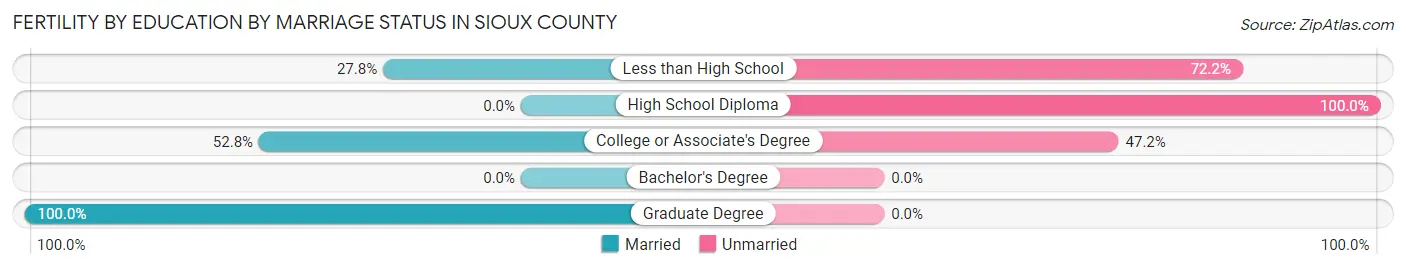
| Educational Attainment | Married | Unmarried |
| Less than High School | 5 (27.8%) | 13 (72.2%) |
| High School Diploma | 0 (0.0%) | 7 (100.0%) |
| College or Associate's Degree | 19 (52.8%) | 17 (47.2%) |
| Bachelor's Degree | 0 (0.0%) | 0 (0.0%) |
| Graduate Degree | 3 (100.0%) | 0 (0.0%) |
| Total | 27 (42.2%) | 37 (57.8%) |
Income in Sioux County
Income Overview in Sioux County
Per Capita Income in Sioux County is $17,185, while median incomes of families and households are $46,719 and $41,201 respectively.
| Characteristic | Number | Measure |
| Per Capita Income | 3,896 | $17,185 |
| Median Family Income | 755 | $46,719 |
| Mean Family Income | 755 | $64,421 |
| Median Household Income | 1,047 | $41,201 |
| Mean Household Income | 1,047 | $59,293 |
| Income Deficit | 755 | $18,880 |
| Wage / Income Gap (%) | 3,896 | 10.74% |
| Wage / Income Gap ($) | 3,896 | 89.26¢ per $1 |
| Gini / Inequality Index | 3,896 | 0.52 |
Earnings by Sex in Sioux County
Average Earnings in Sioux County are $31,765, $30,172 for men and $33,804 for women, a difference of 10.7%.
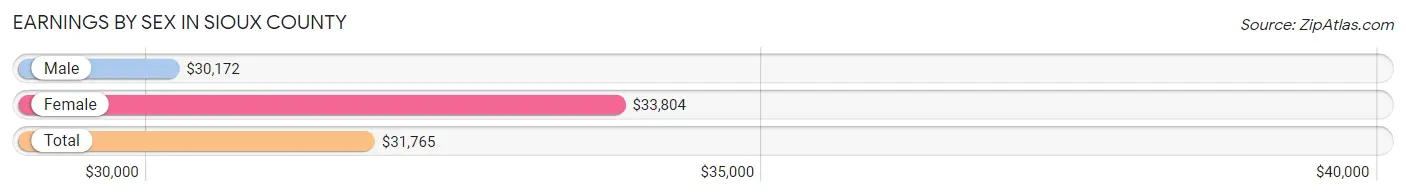
| Sex | Number | Average Earnings |
| Male | 716 (52.5%) | $30,172 |
| Female | 648 (47.5%) | $33,804 |
| Total | 1,364 (100.0%) | $31,765 |
Earnings by Sex by Income Bracket in Sioux County
The most common earnings brackets in Sioux County are $75,000 to $99,999 for men (66 | 9.2%) and $35,000 to $39,999 for women (97 | 15.0%).
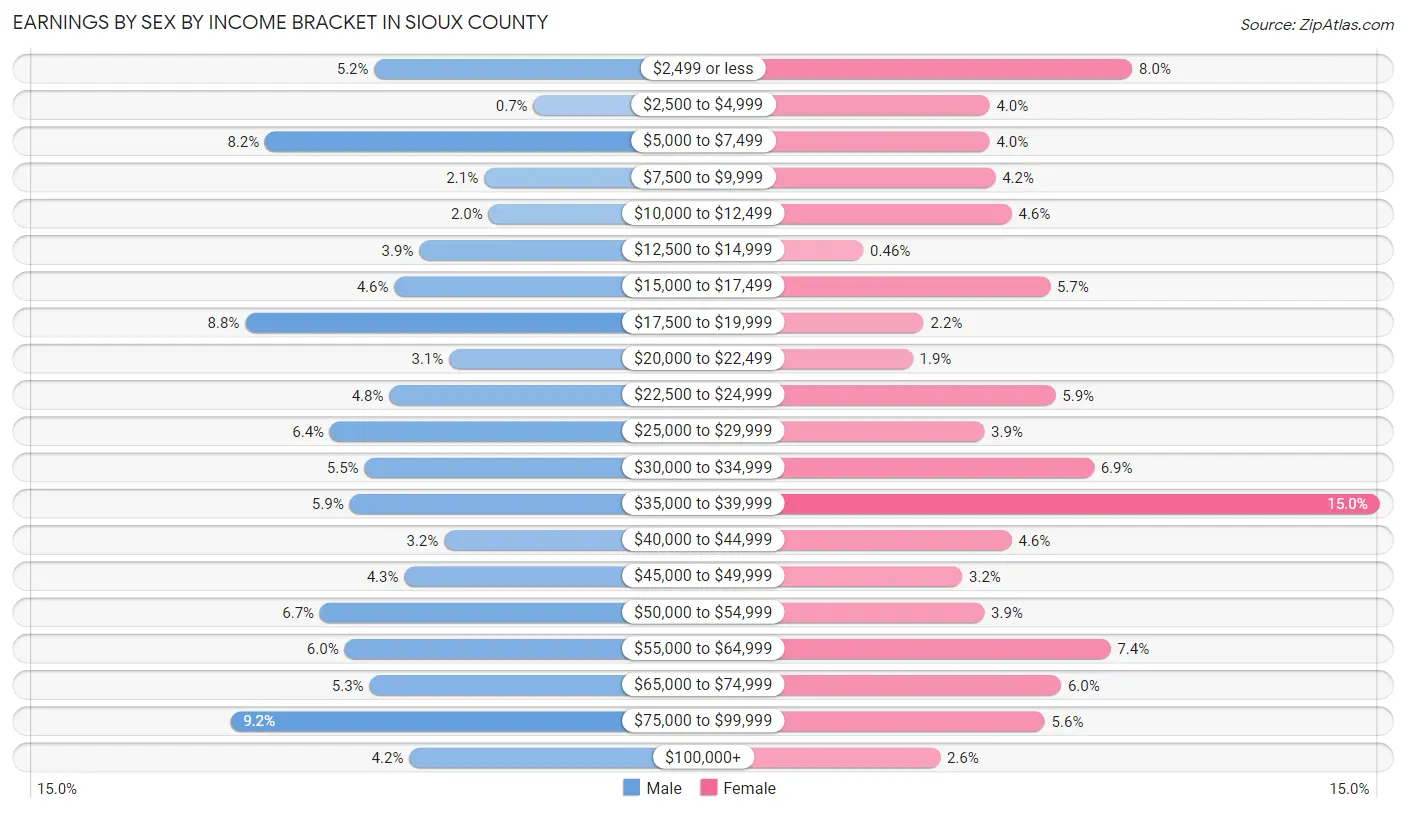
| Income | Male | Female |
| $2,499 or less | 37 (5.2%) | 52 (8.0%) |
| $2,500 to $4,999 | 5 (0.7%) | 26 (4.0%) |
| $5,000 to $7,499 | 59 (8.2%) | 26 (4.0%) |
| $7,500 to $9,999 | 15 (2.1%) | 27 (4.2%) |
| $10,000 to $12,499 | 14 (2.0%) | 30 (4.6%) |
| $12,500 to $14,999 | 28 (3.9%) | 3 (0.5%) |
| $15,000 to $17,499 | 33 (4.6%) | 37 (5.7%) |
| $17,500 to $19,999 | 63 (8.8%) | 14 (2.2%) |
| $20,000 to $22,499 | 22 (3.1%) | 12 (1.8%) |
| $22,500 to $24,999 | 34 (4.8%) | 38 (5.9%) |
| $25,000 to $29,999 | 46 (6.4%) | 25 (3.9%) |
| $30,000 to $34,999 | 39 (5.4%) | 45 (6.9%) |
| $35,000 to $39,999 | 42 (5.9%) | 97 (15.0%) |
| $40,000 to $44,999 | 23 (3.2%) | 30 (4.6%) |
| $45,000 to $49,999 | 31 (4.3%) | 21 (3.2%) |
| $50,000 to $54,999 | 48 (6.7%) | 25 (3.9%) |
| $55,000 to $64,999 | 43 (6.0%) | 48 (7.4%) |
| $65,000 to $74,999 | 38 (5.3%) | 39 (6.0%) |
| $75,000 to $99,999 | 66 (9.2%) | 36 (5.6%) |
| $100,000+ | 30 (4.2%) | 17 (2.6%) |
| Total | 716 (100.0%) | 648 (100.0%) |
Earnings by Sex by Educational Attainment in Sioux County
Average earnings in Sioux County are $36,957 for men and $38,025 for women, a difference of 2.8%. Men with an educational attainment of bachelor's degree enjoy the highest average annual earnings of $56,000, while those with high school diploma education earn the least with $30,833. Women with an educational attainment of bachelor's degree earn the most with the average annual earnings of $58,750, while those with high school diploma education have the smallest earnings of $36,000.
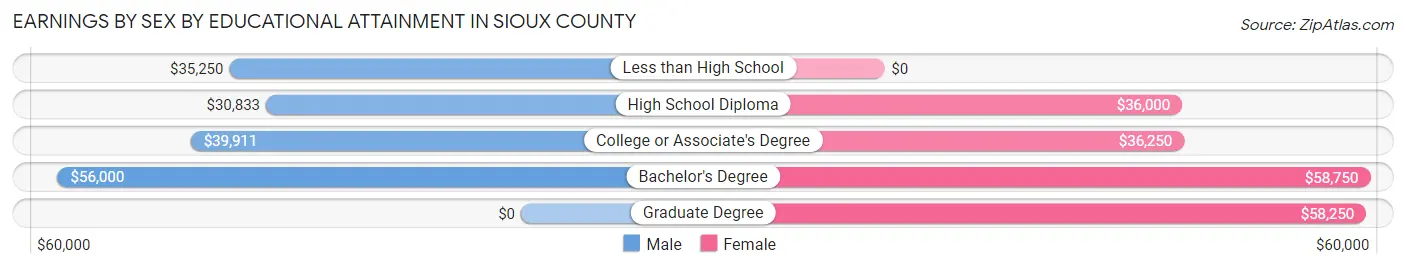
| Educational Attainment | Male Income | Female Income |
| Less than High School | $35,250 | $0 |
| High School Diploma | $30,833 | $36,000 |
| College or Associate's Degree | $39,911 | $36,250 |
| Bachelor's Degree | $56,000 | $58,750 |
| Graduate Degree | - | - |
| Total | $36,957 | $38,025 |
Family Income in Sioux County
Family Income Brackets in Sioux County
According to the Sioux County family income data, there are 139 families falling into the $50,000 to $74,999 income range, which is the most common income bracket and makes up 18.4% of all families. Conversely, the $200,000+ income bracket is the least frequent group with only 25 families (3.3%) belonging to this category.
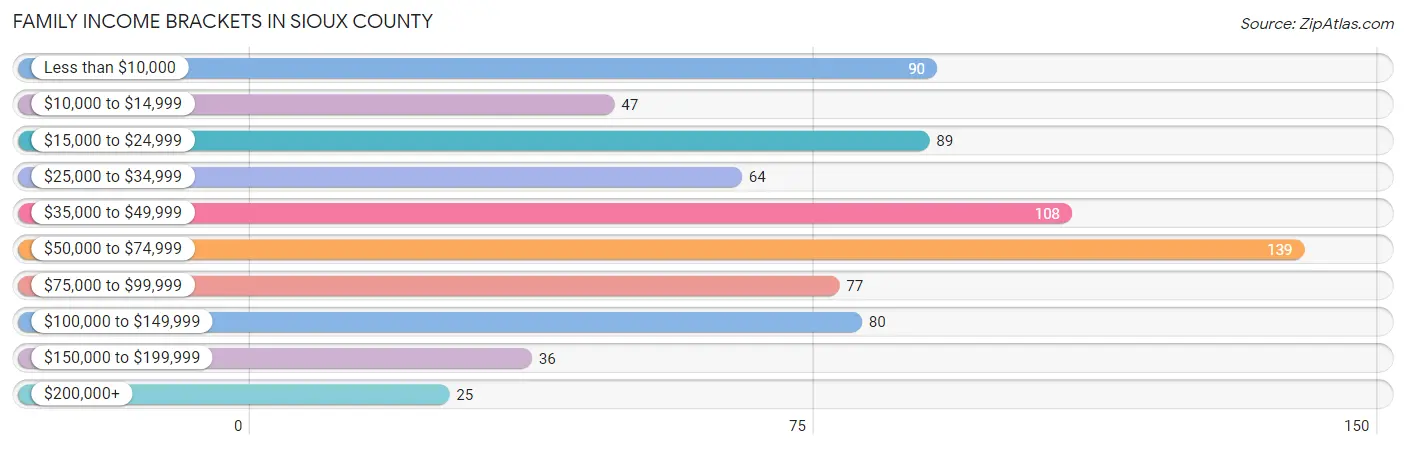
| Income Bracket | # Families | % Families |
| Less than $10,000 | 90 | 11.9% |
| $10,000 to $14,999 | 47 | 6.2% |
| $15,000 to $24,999 | 89 | 11.8% |
| $25,000 to $34,999 | 64 | 8.5% |
| $35,000 to $49,999 | 108 | 14.3% |
| $50,000 to $74,999 | 139 | 18.4% |
| $75,000 to $99,999 | 77 | 10.2% |
| $100,000 to $149,999 | 80 | 10.6% |
| $150,000 to $199,999 | 36 | 4.8% |
| $200,000+ | 25 | 3.3% |
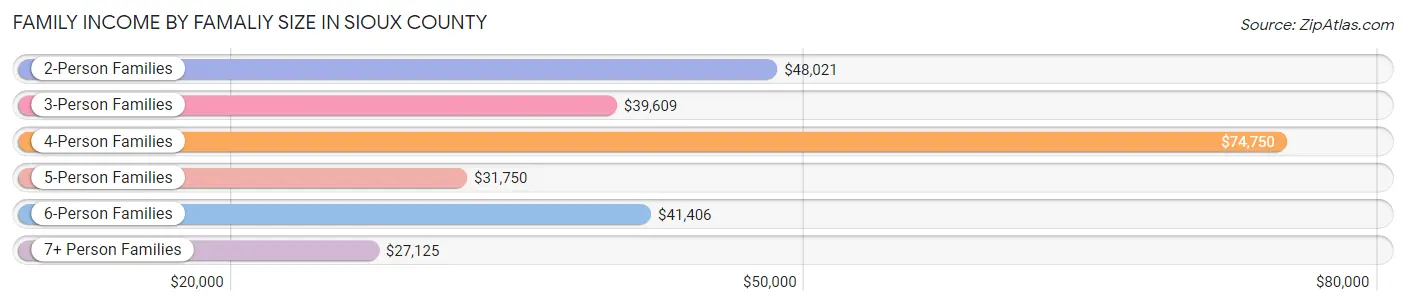
Family Income by Famaliy Size in Sioux County
4-person families (136 | 18.0%) account for the highest median family income in Sioux County with $74,750 per family, while 2-person families (217 | 28.7%) have the highest median income of $24,010 per family member.
| Income Bracket | # Families | Median Income |
| 2-Person Families | 217 (28.7%) | $48,021 |
| 3-Person Families | 183 (24.2%) | $39,609 |
| 4-Person Families | 136 (18.0%) | $74,750 |
| 5-Person Families | 59 (7.8%) | $31,750 |
| 6-Person Families | 69 (9.1%) | $41,406 |
| 7+ Person Families | 91 (12.0%) | $27,125 |
| Total | 755 (100.0%) | $46,719 |
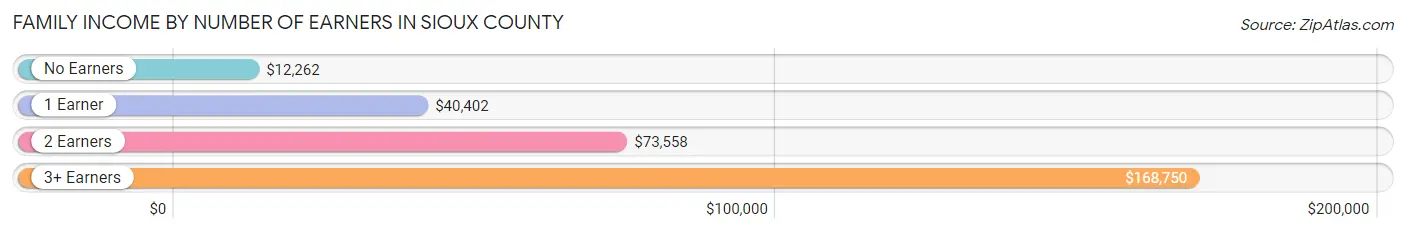
Family Income by Number of Earners in Sioux County
The median family income in Sioux County is $46,719, with families comprising 3+ earners (73) having the highest median family income of $168,750, while families with no earners (178) have the lowest median family income of $12,262, accounting for 9.7% and 23.6% of families, respectively.
| Number of Earners | # Families | Median Income |
| No Earners | 178 (23.6%) | $12,262 |
| 1 Earner | 305 (40.4%) | $40,402 |
| 2 Earners | 199 (26.4%) | $73,558 |
| 3+ Earners | 73 (9.7%) | $168,750 |
| Total | 755 (100.0%) | $46,719 |
Household Income in Sioux County
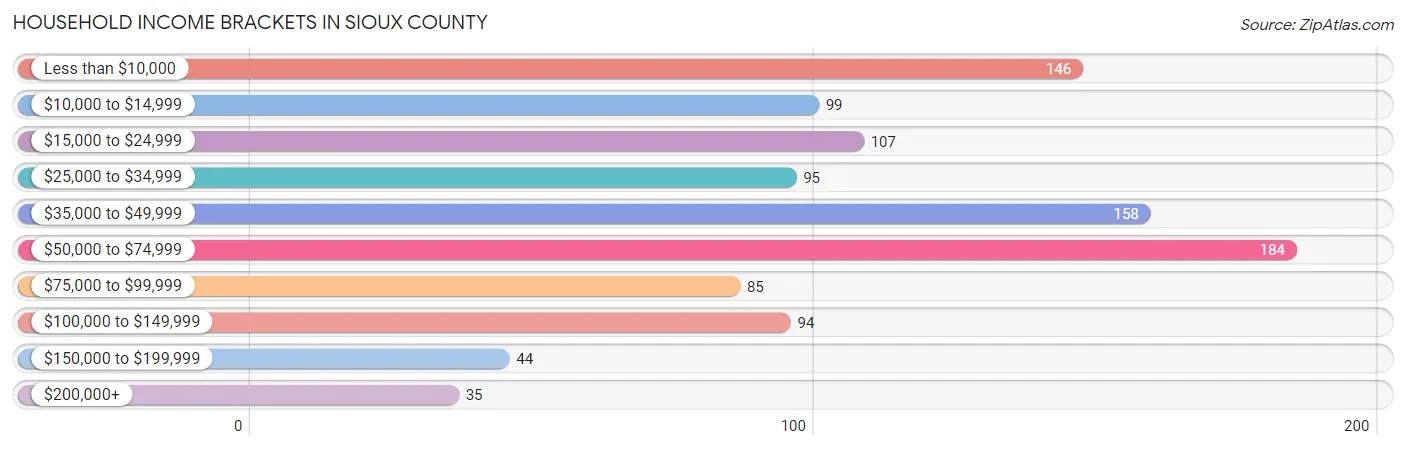
Household Income Brackets in Sioux County
With 184 households falling in the category, the $50,000 to $74,999 income range is the most frequent in Sioux County, accounting for 17.6% of all households. In contrast, only 35 households (3.3%) fall into the $200,000+ income bracket, making it the least populous group.
| Income Bracket | # Households | % Households |
| Less than $10,000 | 146 | 13.9% |
| $10,000 to $14,999 | 99 | 9.5% |
| $15,000 to $24,999 | 107 | 10.2% |
| $25,000 to $34,999 | 95 | 9.1% |
| $35,000 to $49,999 | 158 | 15.1% |
| $50,000 to $74,999 | 184 | 17.6% |
| $75,000 to $99,999 | 85 | 8.1% |
| $100,000 to $149,999 | 94 | 9.0% |
| $150,000 to $199,999 | 44 | 4.2% |
| $200,000+ | 35 | 3.3% |
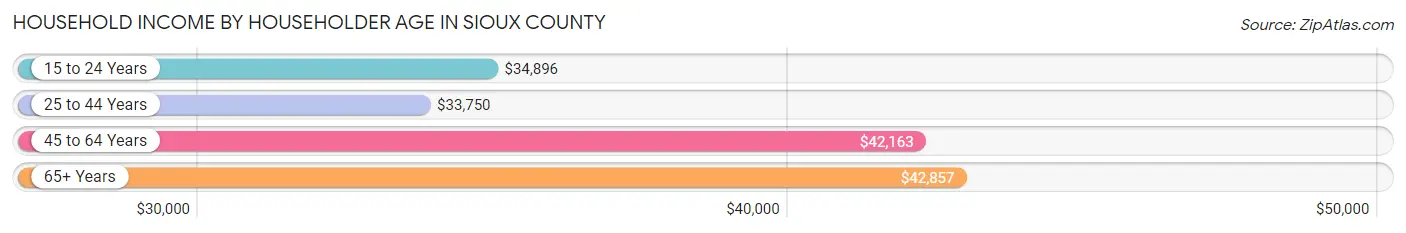
Household Income by Householder Age in Sioux County
The median household income in Sioux County is $41,201, with the highest median household income of $42,857 found in the 65+ years age bracket for the primary householder. A total of 204 households (19.5%) fall into this category. Meanwhile, the 25 to 44 years age bracket for the primary householder has the lowest median household income of $33,750, with 277 households (26.5%) in this group.
| Income Bracket | # Households | Median Income |
| 15 to 24 Years | 27 (2.6%) | $34,896 |
| 25 to 44 Years | 277 (26.5%) | $33,750 |
| 45 to 64 Years | 539 (51.5%) | $42,163 |
| 65+ Years | 204 (19.5%) | $42,857 |
| Total | 1,047 (100.0%) | $41,201 |
Poverty in Sioux County
Income Below Poverty by Sex and Age in Sioux County
With 37.4% poverty level for males and 42.1% for females among the residents of Sioux County, under 5 year old males and 6 to 11 year old females are the most vulnerable to poverty, with 116 males (67.0%) and 157 females (62.5%) in their respective age groups living below the poverty level.
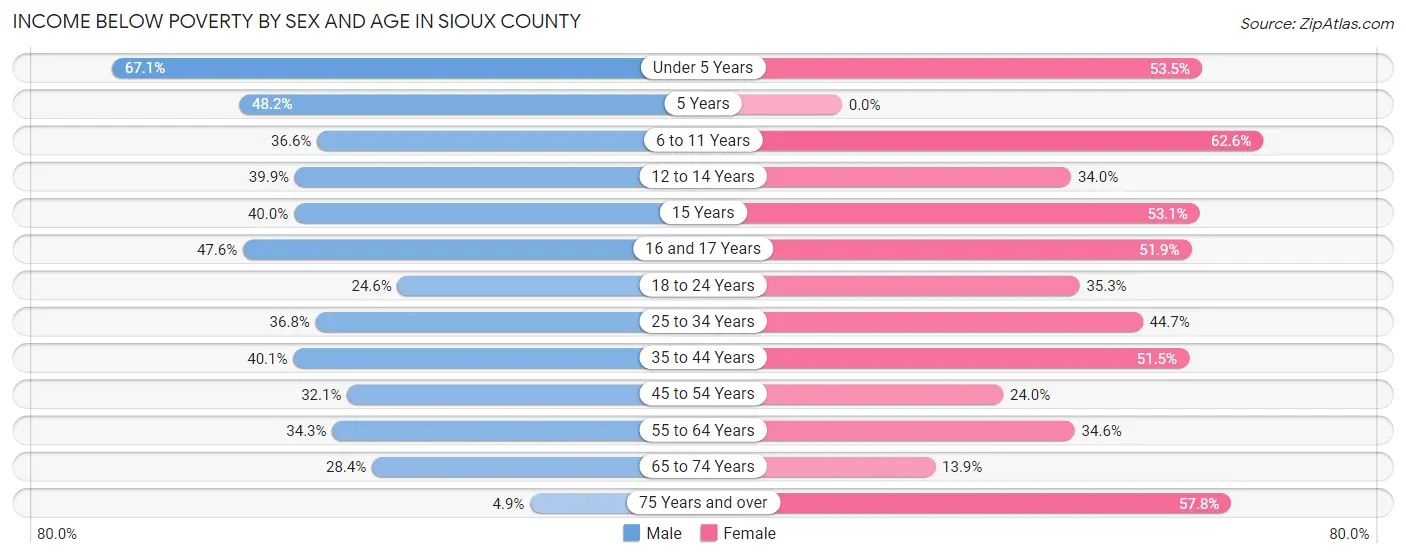
| Age Bracket | Male | Female |
| Under 5 Years | 116 (67.0%) | 85 (53.5%) |
| 5 Years | 13 (48.1%) | 0 (0.0%) |
| 6 to 11 Years | 83 (36.6%) | 157 (62.5%) |
| 12 to 14 Years | 57 (39.9%) | 49 (34.0%) |
| 15 Years | 12 (40.0%) | 17 (53.1%) |
| 16 and 17 Years | 49 (47.6%) | 41 (51.9%) |
| 18 to 24 Years | 49 (24.6%) | 78 (35.3%) |
| 25 to 34 Years | 89 (36.8%) | 92 (44.7%) |
| 35 to 44 Years | 83 (40.1%) | 101 (51.5%) |
| 45 to 54 Years | 69 (32.1%) | 57 (23.9%) |
| 55 to 64 Years | 71 (34.3%) | 74 (34.6%) |
| 65 to 74 Years | 25 (28.4%) | 14 (13.9%) |
| 75 Years and over | 3 (4.9%) | 37 (57.8%) |
| Total | 719 (37.4%) | 802 (42.1%) |
Income Above Poverty by Sex and Age in Sioux County
According to the poverty statistics in Sioux County, males aged 75 years and over and females aged 65 to 74 years are the age groups that are most secure financially, with 95.1% of males and 86.1% of females in these age groups living above the poverty line.
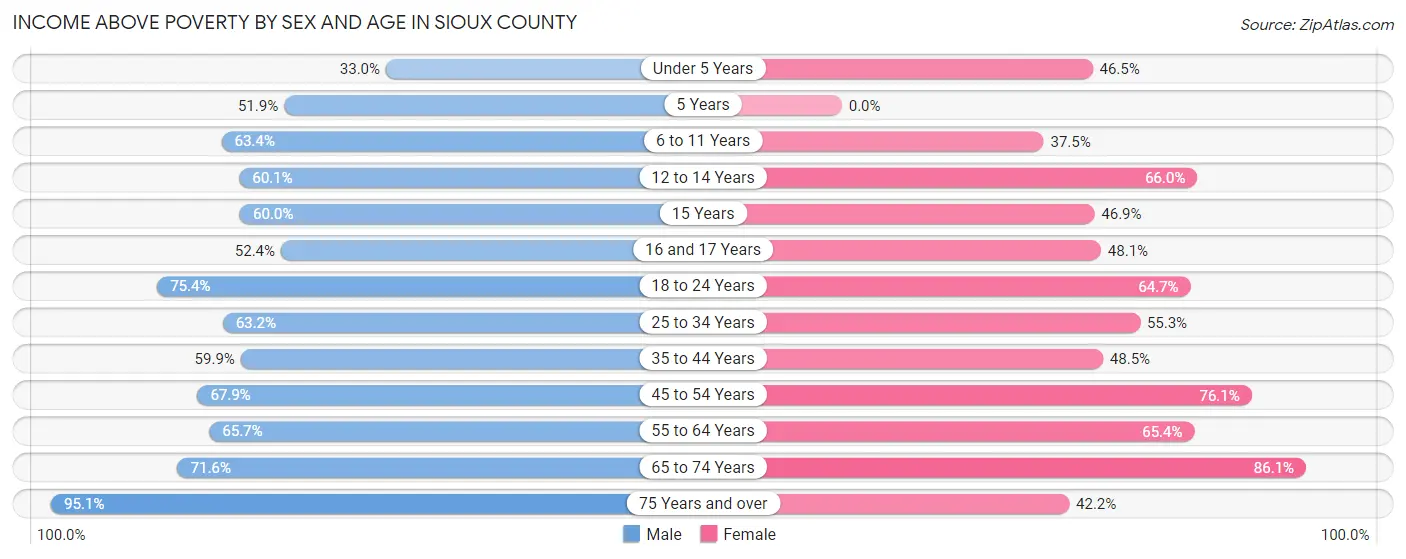
| Age Bracket | Male | Female |
| Under 5 Years | 57 (33.0%) | 74 (46.5%) |
| 5 Years | 14 (51.8%) | 0 (0.0%) |
| 6 to 11 Years | 144 (63.4%) | 94 (37.4%) |
| 12 to 14 Years | 86 (60.1%) | 95 (66.0%) |
| 15 Years | 18 (60.0%) | 15 (46.9%) |
| 16 and 17 Years | 54 (52.4%) | 38 (48.1%) |
| 18 to 24 Years | 150 (75.4%) | 143 (64.7%) |
| 25 to 34 Years | 153 (63.2%) | 114 (55.3%) |
| 35 to 44 Years | 124 (59.9%) | 95 (48.5%) |
| 45 to 54 Years | 146 (67.9%) | 181 (76.0%) |
| 55 to 64 Years | 136 (65.7%) | 140 (65.4%) |
| 65 to 74 Years | 63 (71.6%) | 87 (86.1%) |
| 75 Years and over | 58 (95.1%) | 27 (42.2%) |
| Total | 1,203 (62.6%) | 1,103 (57.9%) |
Income Below Poverty Among Married-Couple Families in Sioux County
The poverty statistics for married-couple families in Sioux County show that 15.9% or 50 of the total 314 families live below the poverty line. Families with 3 or 4 children have the highest poverty rate of 50.9%, comprising of 29 families. On the other hand, families with no children have the lowest poverty rate of 1.4%, which includes 2 families.
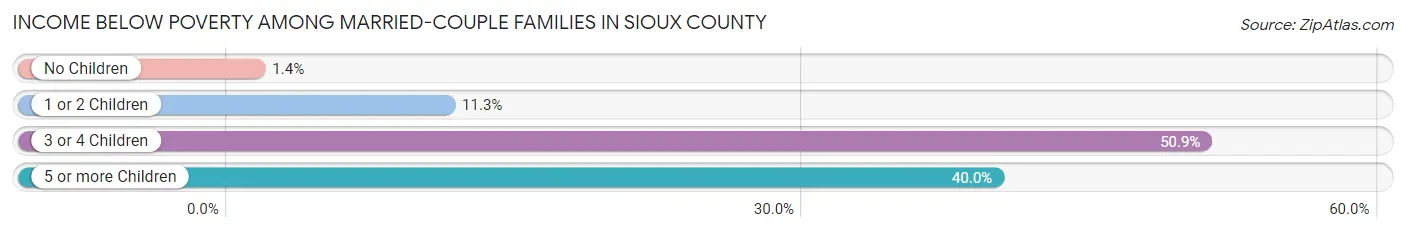
| Children | Above Poverty | Below Poverty |
| No Children | 138 (98.6%) | 2 (1.4%) |
| 1 or 2 Children | 86 (88.7%) | 11 (11.3%) |
| 3 or 4 Children | 28 (49.1%) | 29 (50.9%) |
| 5 or more Children | 12 (60.0%) | 8 (40.0%) |
| Total | 264 (84.1%) | 50 (15.9%) |
Income Below Poverty Among Single-Parent Households in Sioux County
According to the poverty data in Sioux County, 30.6% or 38 single-father households and 48.3% or 153 single-mother households are living below the poverty line. Among single-father households, those with 3 or 4 children have the highest poverty rate, with 24 households (88.9%) experiencing poverty. Likewise, among single-mother households, those with 5 or more children have the highest poverty rate, with 12 households (100.0%) falling below the poverty line.
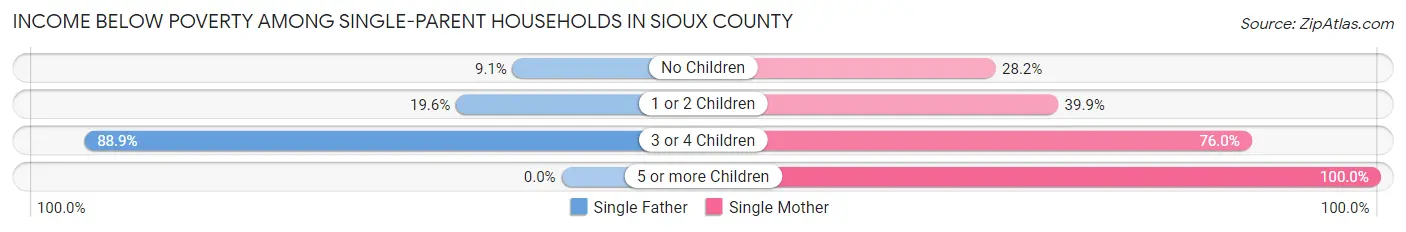
| Children | Single Father | Single Mother |
| No Children | 3 (9.1%) | 22 (28.2%) |
| 1 or 2 Children | 11 (19.6%) | 59 (39.9%) |
| 3 or 4 Children | 24 (88.9%) | 60 (75.9%) |
| 5 or more Children | 0 (0.0%) | 12 (100.0%) |
| Total | 38 (30.6%) | 153 (48.3%) |
Income Below Poverty Among Married-Couple vs Single-Parent Households in Sioux County
The poverty data for Sioux County shows that 50 of the married-couple family households (15.9%) and 191 of the single-parent households (43.3%) are living below the poverty level. Within the married-couple family households, those with 3 or 4 children have the highest poverty rate, with 29 households (50.9%) falling below the poverty line. Among the single-parent households, those with 3 or 4 children have the highest poverty rate, with 84 household (79.2%) living below poverty.
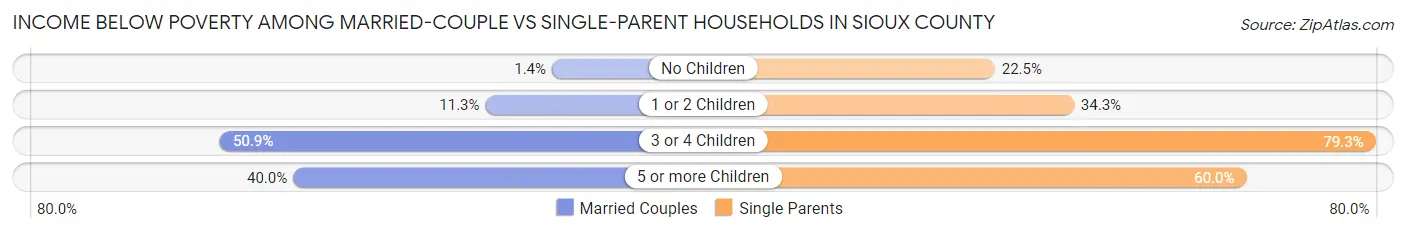
| Children | Married-Couple Families | Single-Parent Households |
| No Children | 2 (1.4%) | 25 (22.5%) |
| 1 or 2 Children | 11 (11.3%) | 70 (34.3%) |
| 3 or 4 Children | 29 (50.9%) | 84 (79.2%) |
| 5 or more Children | 8 (40.0%) | 12 (60.0%) |
| Total | 50 (15.9%) | 191 (43.3%) |
Employment Characteristics in Sioux County
Employment by Class of Employer in Sioux County
Among the 1,037 employed individuals in Sioux County, local government employees (358 | 34.5%), private company employees (265 | 25.6%), and federal government employees (166 | 16.0%) make up the most common classes of employment.
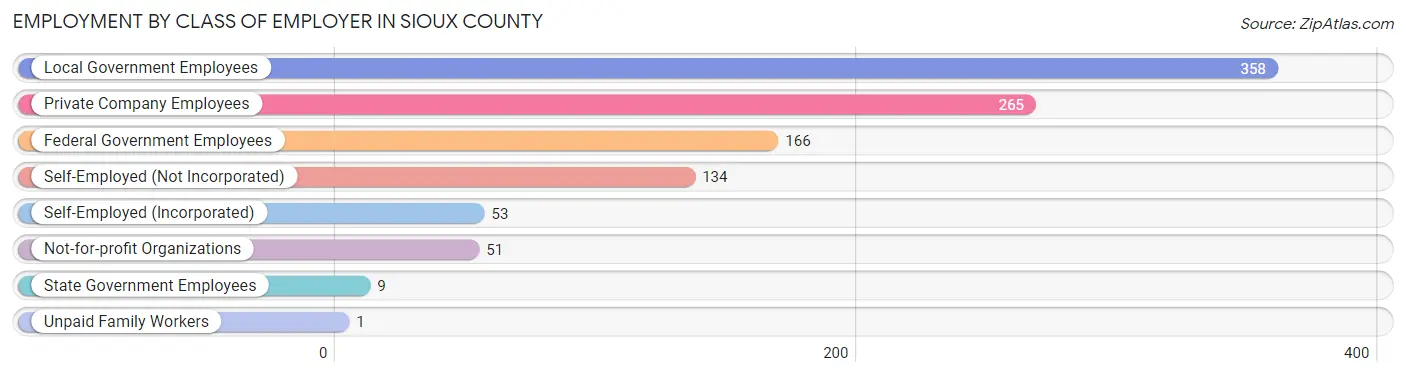
| Employer Class | # Employees | % Employees |
| Private Company Employees | 265 | 25.6% |
| Self-Employed (Incorporated) | 53 | 5.1% |
| Self-Employed (Not Incorporated) | 134 | 12.9% |
| Not-for-profit Organizations | 51 | 4.9% |
| Local Government Employees | 358 | 34.5% |
| State Government Employees | 9 | 0.9% |
| Federal Government Employees | 166 | 16.0% |
| Unpaid Family Workers | 1 | 0.1% |
| Total | 1,037 | 100.0% |
Employment Status by Age in Sioux County
According to the labor force statistics for Sioux County, out of the total population over 16 years of age (2,684), 50.1% or 1,345 individuals are in the labor force, with 20.7% or 278 of them unemployed. The age group with the highest labor force participation rate is 30 to 34 years, with 66.7% or 156 individuals in the labor force. Within the labor force, the 20 to 24 years age range has the highest percentage of unemployed individuals, with 47.9% or 80 of them being unemployed.
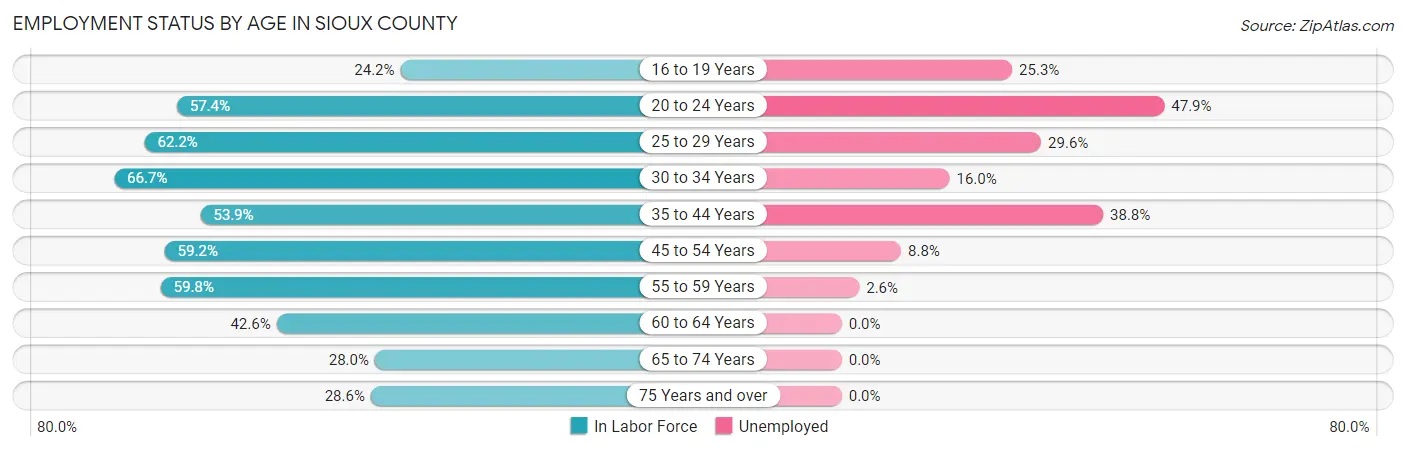
| Age Bracket | In Labor Force | Unemployed |
| 16 to 19 Years | 81 (24.2%) | 20 (25.3%) |
| 20 to 24 Years | 167 (57.4%) | 80 (47.9%) |
| 25 to 29 Years | 135 (62.2%) | 40 (29.6%) |
| 30 to 34 Years | 156 (66.7%) | 25 (16.0%) |
| 35 to 44 Years | 219 (53.9%) | 85 (38.8%) |
| 45 to 54 Years | 273 (59.2%) | 24 (8.8%) |
| 55 to 59 Years | 153 (59.8%) | 4 (2.6%) |
| 60 to 64 Years | 72 (42.6%) | 0 (0.0%) |
| 65 to 74 Years | 53 (28.0%) | 0 (0.0%) |
| 75 Years and over | 36 (28.6%) | 0 (0.0%) |
| Total | 1,345 (50.1%) | 278 (20.7%) |
Employment Status by Educational Attainment in Sioux County
According to labor force statistics for Sioux County, 57.8% of individuals (1,007) out of the total population between 25 and 64 years of age (1,743) are in the labor force, with 17.7% or 178 of them being unemployed. The group with the highest labor force participation rate are those with the educational attainment of bachelor's degree or higher, with 84.2% or 149 individuals in the labor force. Within the labor force, individuals with less than high school education have the highest percentage of unemployment, with 32.6% or 28 of them being unemployed.
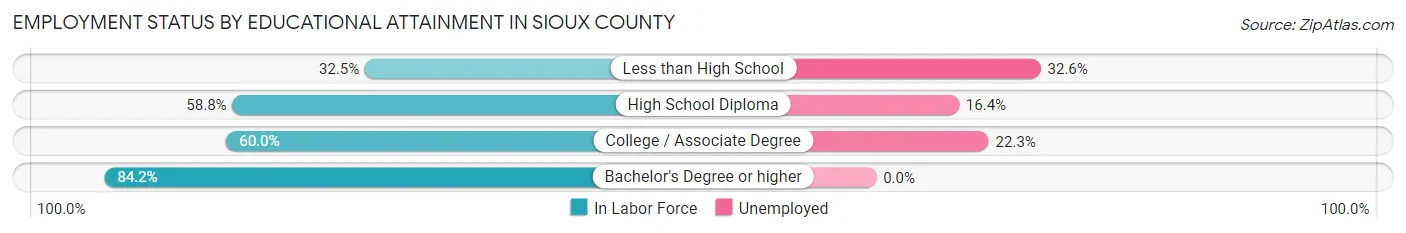
| Educational Attainment | In Labor Force | Unemployed |
| Less than High School | 86 (32.5%) | 86 (32.6%) |
| High School Diploma | 378 (58.8%) | 105 (16.4%) |
| College / Associate Degree | 395 (60.0%) | 147 (22.3%) |
| Bachelor's Degree or higher | 149 (84.2%) | 0 (0.0%) |
| Total | 1,007 (57.8%) | 309 (17.7%) |
Employment Occupations by Sex in Sioux County
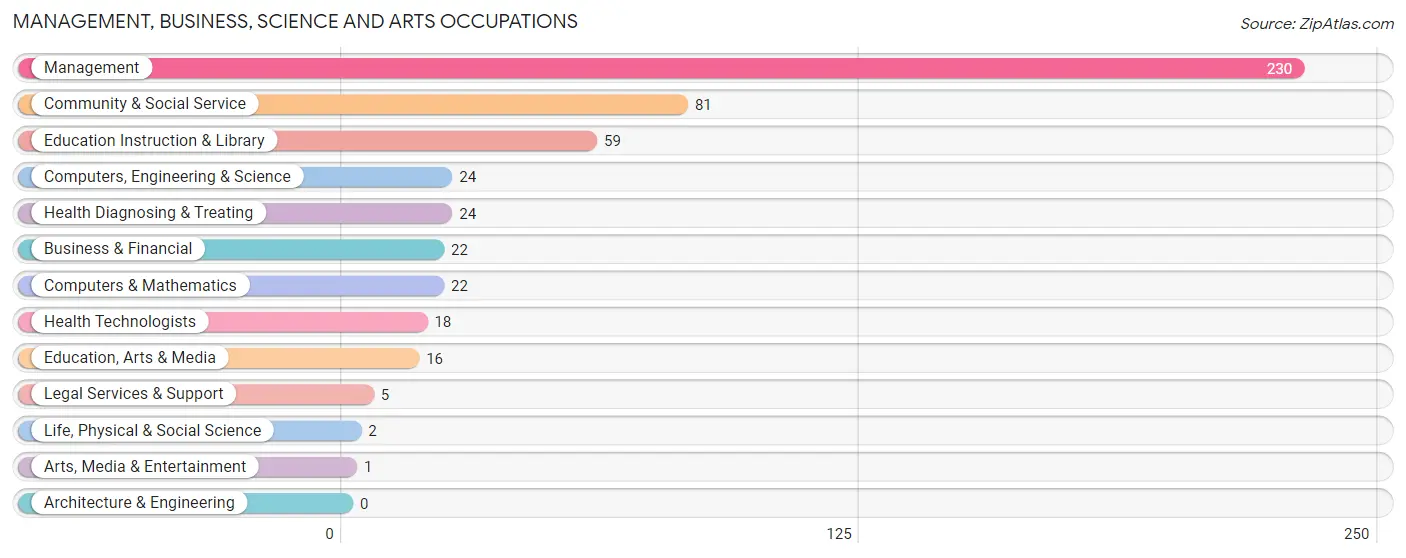
Management, Business, Science and Arts Occupations
The most common Management, Business, Science and Arts occupations in Sioux County are Management (230 | 21.6%), Community & Social Service (81 | 7.6%), Education Instruction & Library (59 | 5.5%), Computers, Engineering & Science (24 | 2.2%), and Health Diagnosing & Treating (24 | 2.2%).
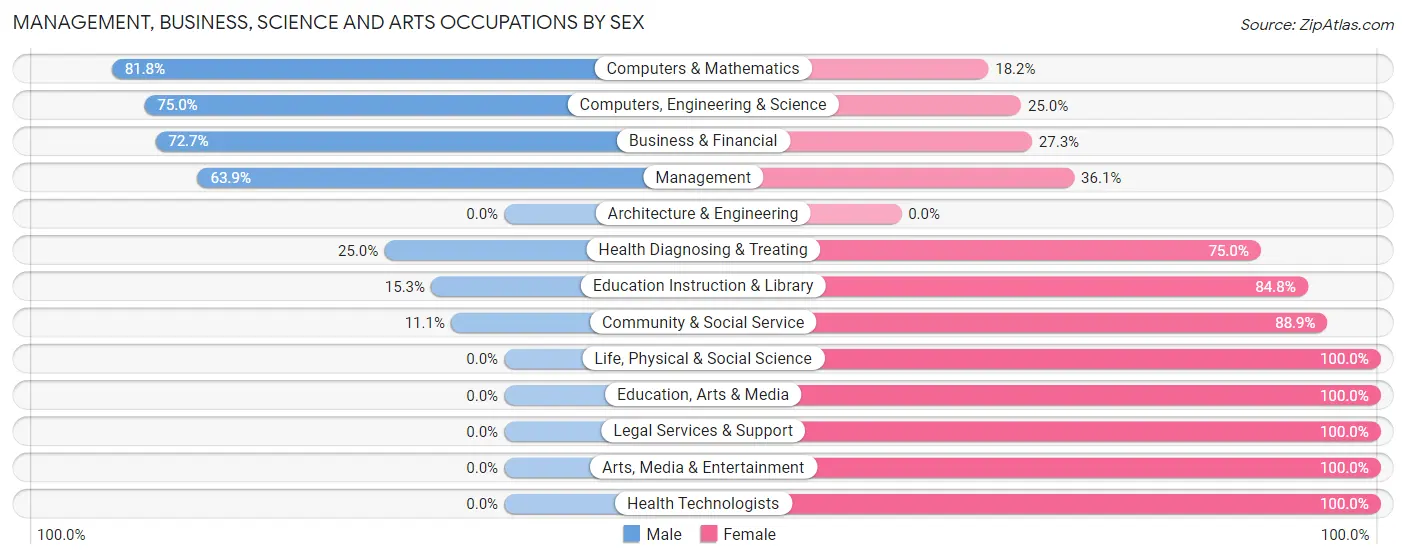
Management, Business, Science and Arts Occupations by Sex
Within the Management, Business, Science and Arts occupations in Sioux County, the most male-oriented occupations are Computers & Mathematics (81.8%), Computers, Engineering & Science (75.0%), and Business & Financial (72.7%), while the most female-oriented occupations are Life, Physical & Social Science (100.0%), Education, Arts & Media (100.0%), and Legal Services & Support (100.0%).
| Occupation | Male | Female |
| Management | 147 (63.9%) | 83 (36.1%) |
| Business & Financial | 16 (72.7%) | 6 (27.3%) |
| Computers, Engineering & Science | 18 (75.0%) | 6 (25.0%) |
| Computers & Mathematics | 18 (81.8%) | 4 (18.2%) |
| Architecture & Engineering | 0 (0.0%) | 0 (0.0%) |
| Life, Physical & Social Science | 0 (0.0%) | 2 (100.0%) |
| Community & Social Service | 9 (11.1%) | 72 (88.9%) |
| Education, Arts & Media | 0 (0.0%) | 16 (100.0%) |
| Legal Services & Support | 0 (0.0%) | 5 (100.0%) |
| Education Instruction & Library | 9 (15.2%) | 50 (84.8%) |
| Arts, Media & Entertainment | 0 (0.0%) | 1 (100.0%) |
| Health Diagnosing & Treating | 6 (25.0%) | 18 (75.0%) |
| Health Technologists | 0 (0.0%) | 18 (100.0%) |
| Total (Category) | 196 (51.4%) | 185 (48.6%) |
| Total (Overall) | 551 (51.7%) | 514 (48.3%) |
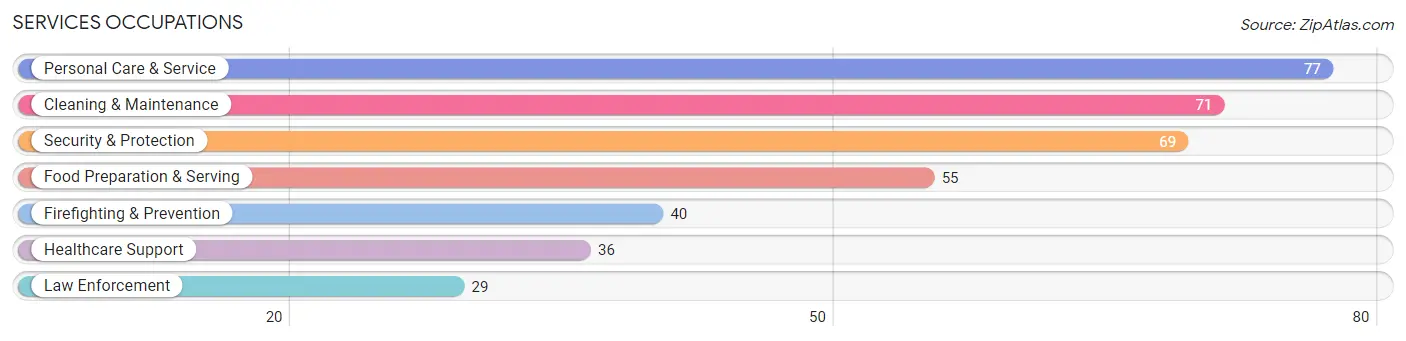
Services Occupations
The most common Services occupations in Sioux County are Personal Care & Service (77 | 7.2%), Cleaning & Maintenance (71 | 6.7%), Security & Protection (69 | 6.5%), Food Preparation & Serving (55 | 5.2%), and Firefighting & Prevention (40 | 3.8%).
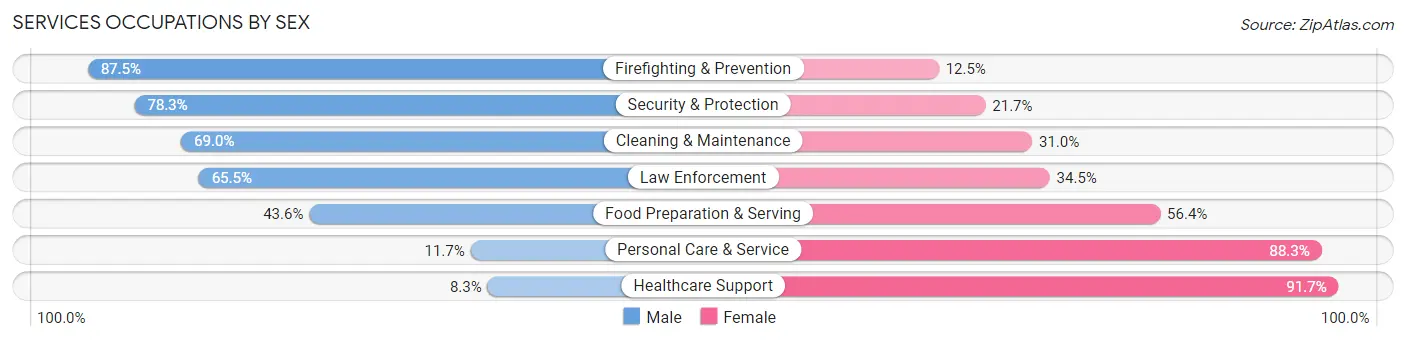
Services Occupations by Sex
Within the Services occupations in Sioux County, the most male-oriented occupations are Firefighting & Prevention (87.5%), Security & Protection (78.3%), and Cleaning & Maintenance (69.0%), while the most female-oriented occupations are Healthcare Support (91.7%), Personal Care & Service (88.3%), and Food Preparation & Serving (56.4%).
| Occupation | Male | Female |
| Healthcare Support | 3 (8.3%) | 33 (91.7%) |
| Security & Protection | 54 (78.3%) | 15 (21.7%) |
| Firefighting & Prevention | 35 (87.5%) | 5 (12.5%) |
| Law Enforcement | 19 (65.5%) | 10 (34.5%) |
| Food Preparation & Serving | 24 (43.6%) | 31 (56.4%) |
| Cleaning & Maintenance | 49 (69.0%) | 22 (31.0%) |
| Personal Care & Service | 9 (11.7%) | 68 (88.3%) |
| Total (Category) | 139 (45.1%) | 169 (54.9%) |
| Total (Overall) | 551 (51.7%) | 514 (48.3%) |
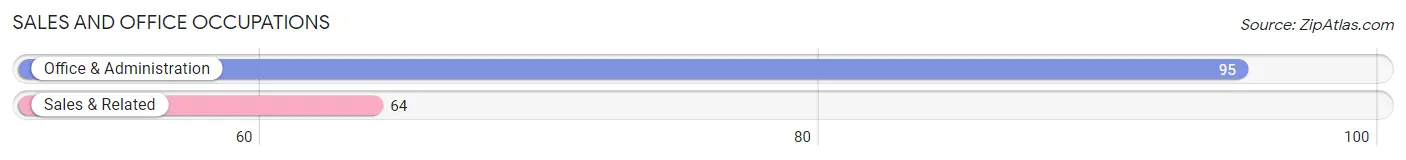
Sales and Office Occupations
The most common Sales and Office occupations in Sioux County are Office & Administration (95 | 8.9%), and Sales & Related (64 | 6.0%).
Sales and Office Occupations by Sex
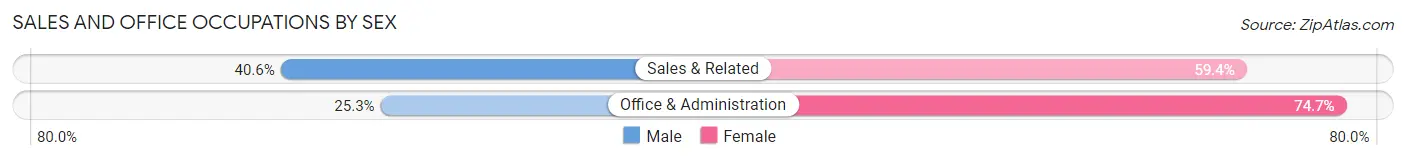
| Occupation | Male | Female |
| Sales & Related | 26 (40.6%) | 38 (59.4%) |
| Office & Administration | 24 (25.3%) | 71 (74.7%) |
| Total (Category) | 50 (31.5%) | 109 (68.5%) |
| Total (Overall) | 551 (51.7%) | 514 (48.3%) |
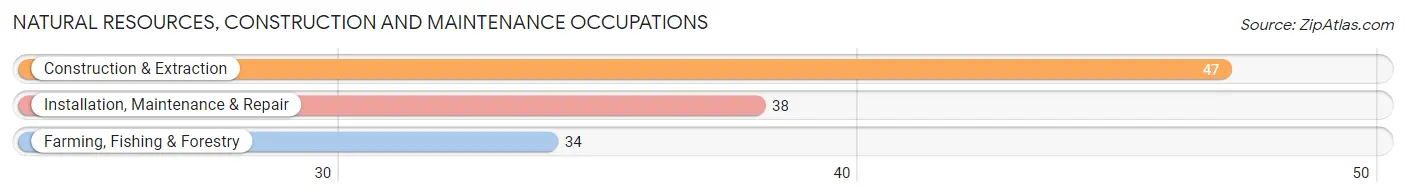
Natural Resources, Construction and Maintenance Occupations
The most common Natural Resources, Construction and Maintenance occupations in Sioux County are Construction & Extraction (47 | 4.4%), Installation, Maintenance & Repair (38 | 3.6%), and Farming, Fishing & Forestry (34 | 3.2%).
Natural Resources, Construction and Maintenance Occupations by Sex
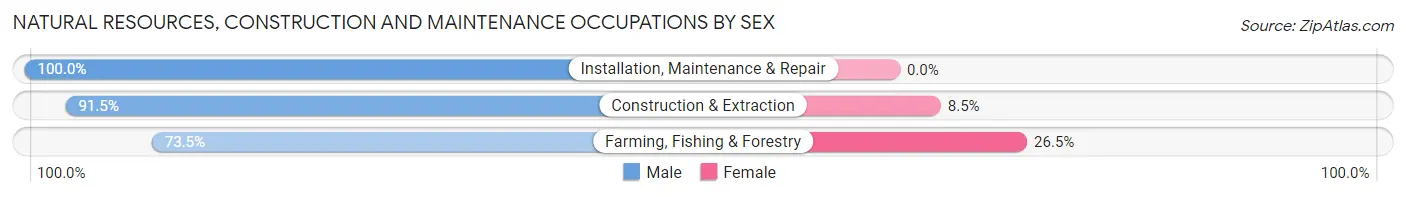
| Occupation | Male | Female |
| Farming, Fishing & Forestry | 25 (73.5%) | 9 (26.5%) |
| Construction & Extraction | 43 (91.5%) | 4 (8.5%) |
| Installation, Maintenance & Repair | 38 (100.0%) | 0 (0.0%) |
| Total (Category) | 106 (89.1%) | 13 (10.9%) |
| Total (Overall) | 551 (51.7%) | 514 (48.3%) |
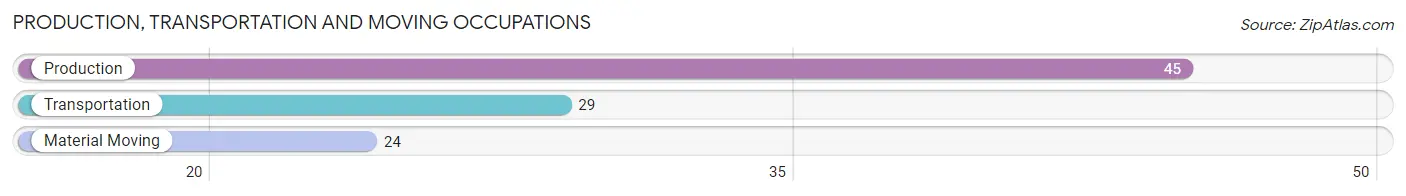
Production, Transportation and Moving Occupations
The most common Production, Transportation and Moving occupations in Sioux County are Production (45 | 4.2%), Transportation (29 | 2.7%), and Material Moving (24 | 2.2%).
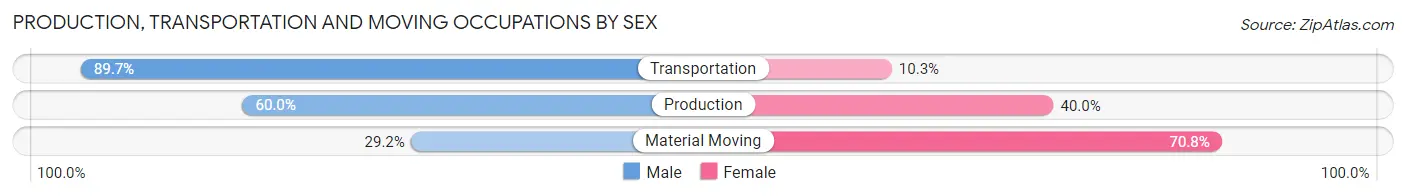
Production, Transportation and Moving Occupations by Sex
| Occupation | Male | Female |
| Production | 27 (60.0%) | 18 (40.0%) |
| Transportation | 26 (89.7%) | 3 (10.3%) |
| Material Moving | 7 (29.2%) | 17 (70.8%) |
| Total (Category) | 60 (61.2%) | 38 (38.8%) |
| Total (Overall) | 551 (51.7%) | 514 (48.3%) |
Employment Industries by Sex in Sioux County
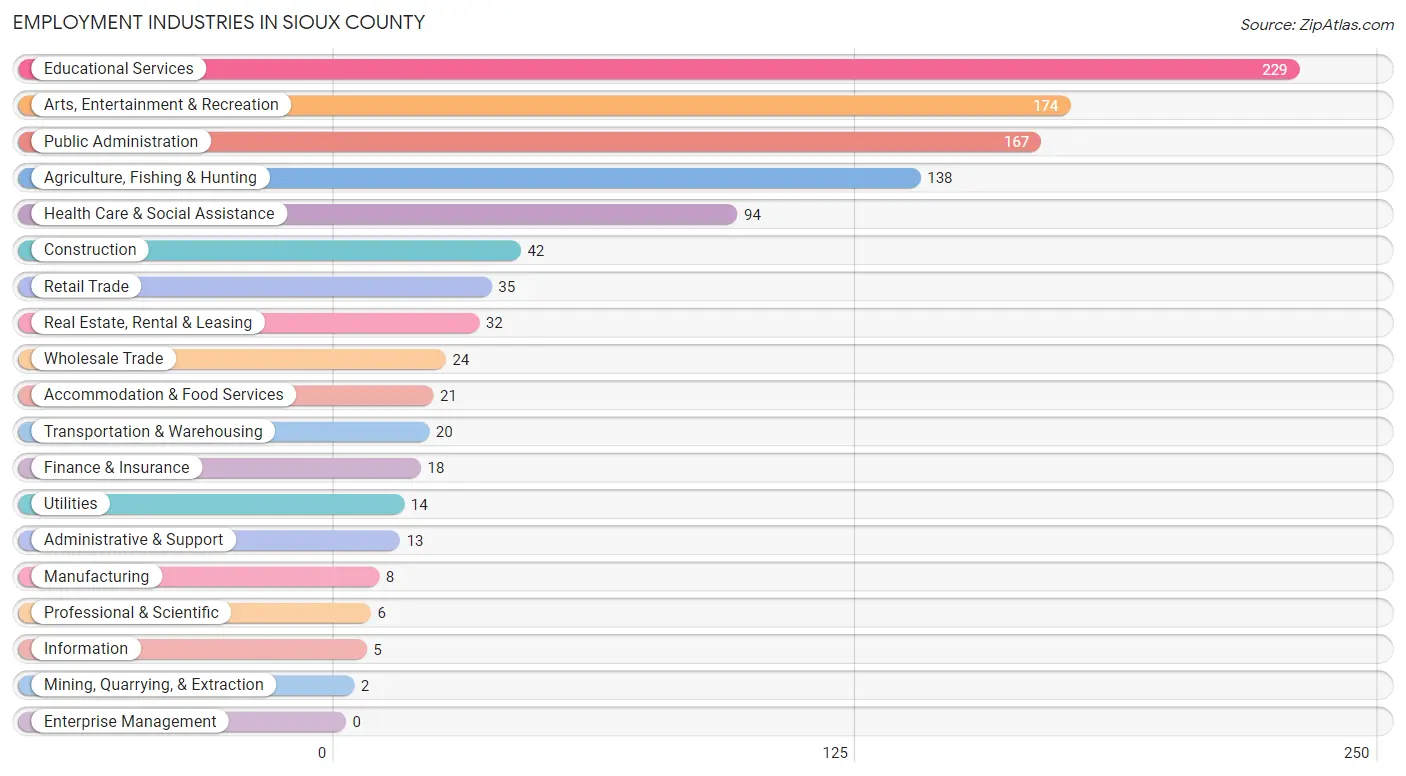
Employment Industries in Sioux County
The major employment industries in Sioux County include Educational Services (229 | 21.5%), Arts, Entertainment & Recreation (174 | 16.3%), Public Administration (167 | 15.7%), Agriculture, Fishing & Hunting (138 | 13.0%), and Health Care & Social Assistance (94 | 8.8%).
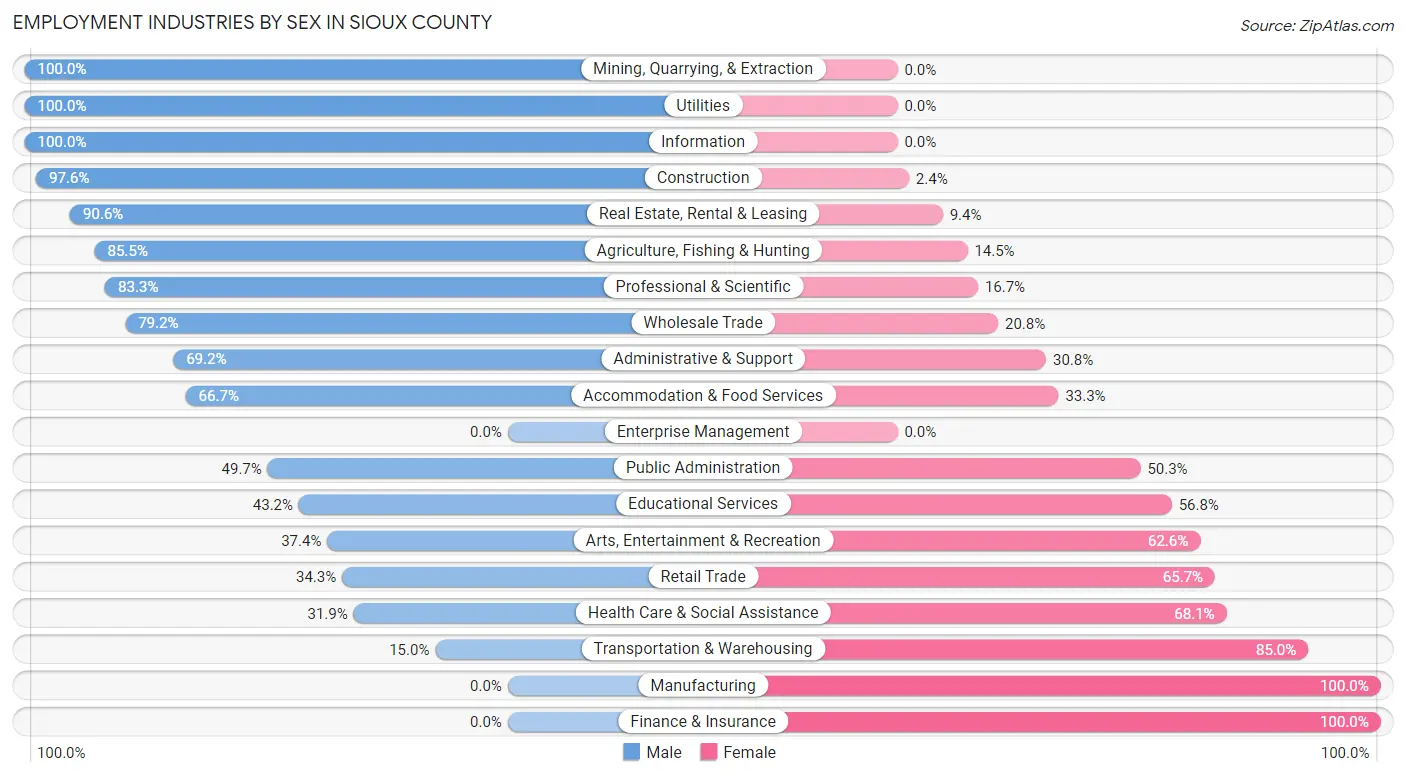
Employment Industries by Sex in Sioux County
The Sioux County industries that see more men than women are Mining, Quarrying, & Extraction (100.0%), Utilities (100.0%), and Information (100.0%), whereas the industries that tend to have a higher number of women are Manufacturing (100.0%), Finance & Insurance (100.0%), and Transportation & Warehousing (85.0%).
| Industry | Male | Female |
| Agriculture, Fishing & Hunting | 118 (85.5%) | 20 (14.5%) |
| Mining, Quarrying, & Extraction | 2 (100.0%) | 0 (0.0%) |
| Construction | 41 (97.6%) | 1 (2.4%) |
| Manufacturing | 0 (0.0%) | 8 (100.0%) |
| Wholesale Trade | 19 (79.2%) | 5 (20.8%) |
| Retail Trade | 12 (34.3%) | 23 (65.7%) |
| Transportation & Warehousing | 3 (15.0%) | 17 (85.0%) |
| Utilities | 14 (100.0%) | 0 (0.0%) |
| Information | 5 (100.0%) | 0 (0.0%) |
| Finance & Insurance | 0 (0.0%) | 18 (100.0%) |
| Real Estate, Rental & Leasing | 29 (90.6%) | 3 (9.4%) |
| Professional & Scientific | 5 (83.3%) | 1 (16.7%) |
| Enterprise Management | 0 (0.0%) | 0 (0.0%) |
| Administrative & Support | 9 (69.2%) | 4 (30.8%) |
| Educational Services | 99 (43.2%) | 130 (56.8%) |
| Health Care & Social Assistance | 30 (31.9%) | 64 (68.1%) |
| Arts, Entertainment & Recreation | 65 (37.4%) | 109 (62.6%) |
| Accommodation & Food Services | 14 (66.7%) | 7 (33.3%) |
| Public Administration | 83 (49.7%) | 84 (50.3%) |
| Total | 551 (51.7%) | 514 (48.3%) |
Education in Sioux County
School Enrollment in Sioux County
The most common levels of schooling among the 1,155 students in Sioux County are middle school (344 | 29.8%), elementary school (258 | 22.3%), and high school (254 | 22.0%).
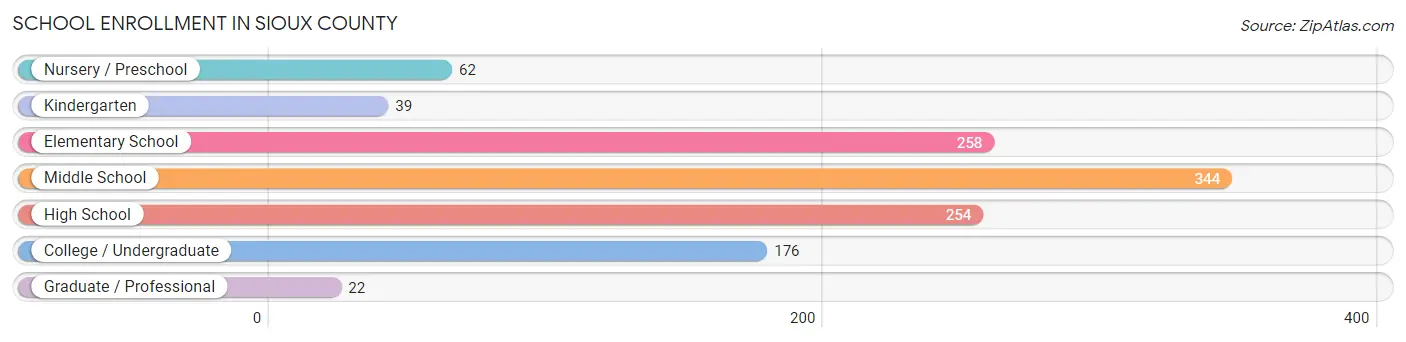
| School Level | # Students | % Students |
| Nursery / Preschool | 62 | 5.4% |
| Kindergarten | 39 | 3.4% |
| Elementary School | 258 | 22.3% |
| Middle School | 344 | 29.8% |
| High School | 254 | 22.0% |
| College / Undergraduate | 176 | 15.2% |
| Graduate / Professional | 22 | 1.9% |
| Total | 1,155 | 100.0% |
School Enrollment by Age by Funding Source in Sioux County
Out of a total of 1,155 students who are enrolled in schools in Sioux County, 82 (7.1%) attend a private institution, while the remaining 1,073 (92.9%) are enrolled in public schools. The age group of 35 years and over has the highest likelihood of being enrolled in private schools, with 12 (26.1% in the age bracket) enrolled. Conversely, the age group of 3 to 4 year olds has the lowest likelihood of being enrolled in a private school, with 48 (100.0% in the age bracket) attending a public institution.
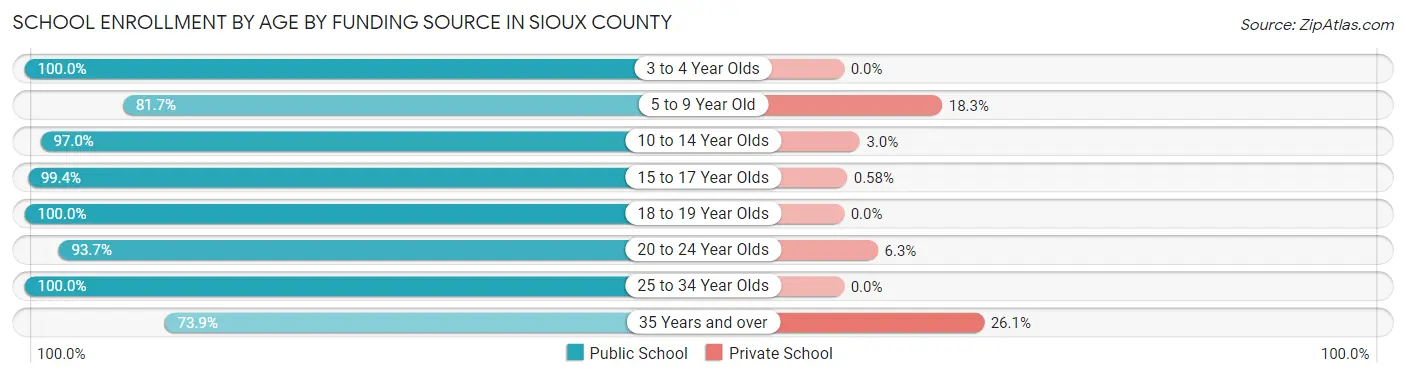
| Age Bracket | Public School | Private School |
| 3 to 4 Year Olds | 48 (100.0%) | 0 (0.0%) |
| 5 to 9 Year Old | 228 (81.7%) | 51 (18.3%) |
| 10 to 14 Year Olds | 394 (97.0%) | 12 (3.0%) |
| 15 to 17 Year Olds | 171 (99.4%) | 1 (0.6%) |
| 18 to 19 Year Olds | 96 (100.0%) | 0 (0.0%) |
| 20 to 24 Year Olds | 89 (93.7%) | 6 (6.3%) |
| 25 to 34 Year Olds | 13 (100.0%) | 0 (0.0%) |
| 35 Years and over | 34 (73.9%) | 12 (26.1%) |
| Total | 1,073 (92.9%) | 82 (7.1%) |
Educational Attainment by Field of Study in Sioux County
Education (87 | 34.5%), arts & humanities (41 | 16.3%), bio, nature & agricultural (35 | 13.9%), science & technology (28 | 11.1%), and business (26 | 10.3%) are the most common fields of study among 252 individuals in Sioux County who have obtained a bachelor's degree or higher.
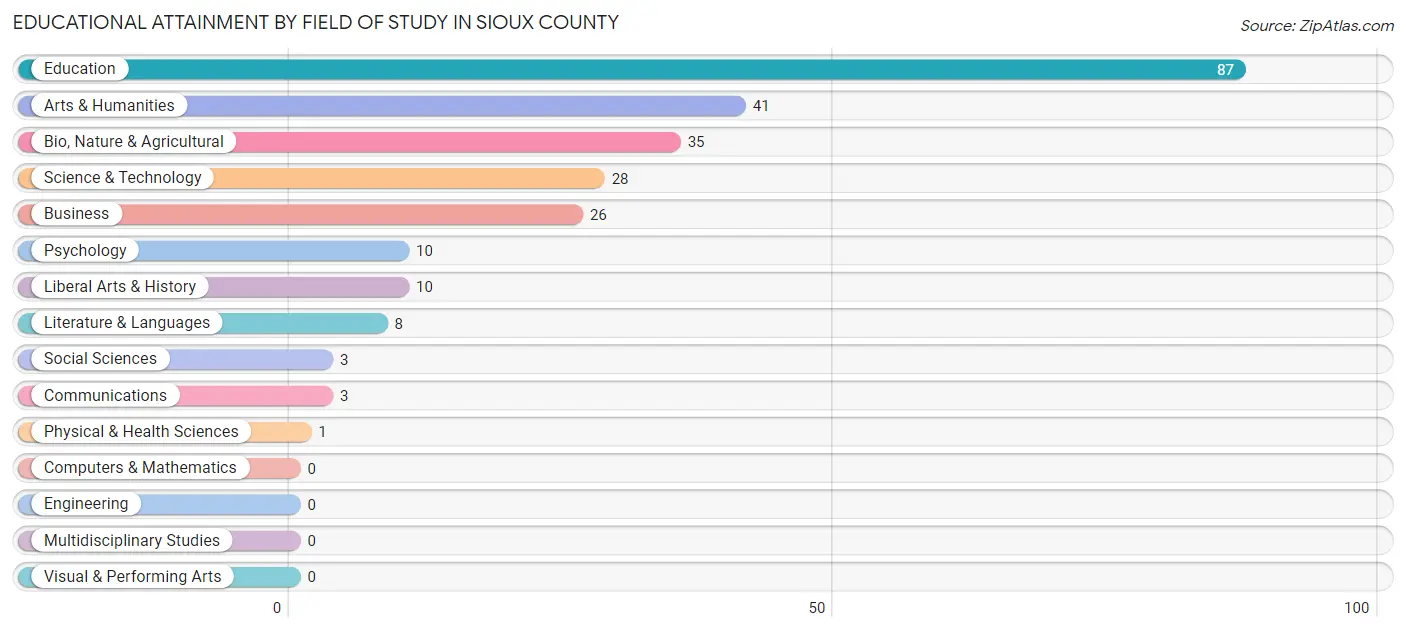
| Field of Study | # Graduates | % Graduates |
| Computers & Mathematics | 0 | 0.0% |
| Bio, Nature & Agricultural | 35 | 13.9% |
| Physical & Health Sciences | 1 | 0.4% |
| Psychology | 10 | 4.0% |
| Social Sciences | 3 | 1.2% |
| Engineering | 0 | 0.0% |
| Multidisciplinary Studies | 0 | 0.0% |
| Science & Technology | 28 | 11.1% |
| Business | 26 | 10.3% |
| Education | 87 | 34.5% |
| Literature & Languages | 8 | 3.2% |
| Liberal Arts & History | 10 | 4.0% |
| Visual & Performing Arts | 0 | 0.0% |
| Communications | 3 | 1.2% |
| Arts & Humanities | 41 | 16.3% |
| Total | 252 | 100.0% |
Transportation & Commute in Sioux County
Vehicle Availability by Sex in Sioux County
The most prevalent vehicle ownership categories in Sioux County are males with 1 vehicle (157, accounting for 28.8%) and females with 1 vehicle (93, making up 32.6%).
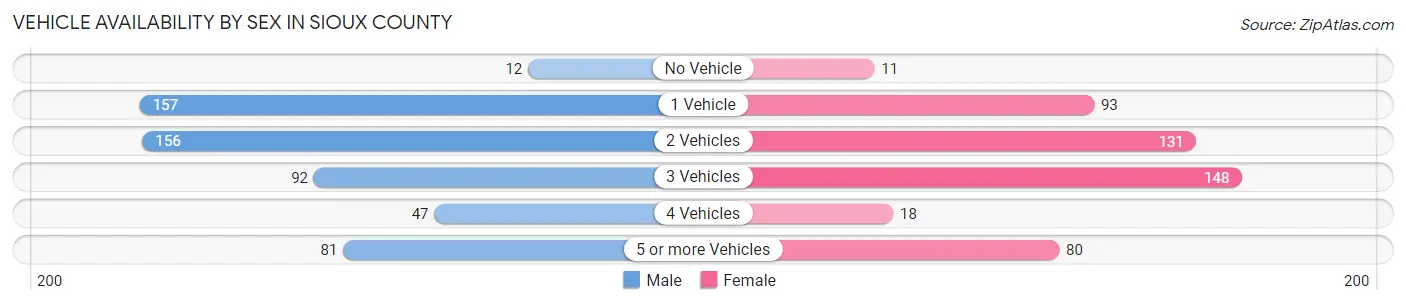
| Vehicles Available | Male | Female |
| No Vehicle | 12 (2.2%) | 11 (2.3%) |
| 1 Vehicle | 157 (28.8%) | 93 (19.3%) |
| 2 Vehicles | 156 (28.6%) | 131 (27.2%) |
| 3 Vehicles | 92 (16.9%) | 148 (30.8%) |
| 4 Vehicles | 47 (8.6%) | 18 (3.7%) |
| 5 or more Vehicles | 81 (14.9%) | 80 (16.6%) |
| Total | 545 (100.0%) | 481 (100.0%) |
Commute Time in Sioux County
The most frequently occuring commute durations in Sioux County are less than 5 minutes (221 commuters, 22.8%), 5 to 9 minutes (174 commuters, 18.0%), and 10 to 14 minutes (150 commuters, 15.5%).
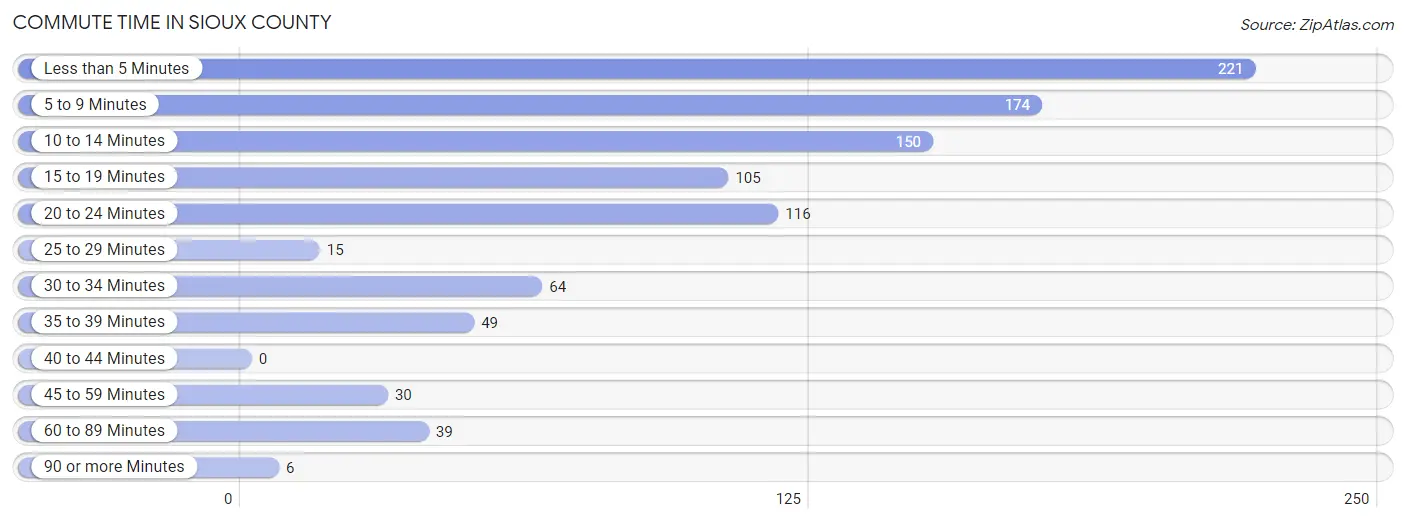
| Commute Time | # Commuters | % Commuters |
| Less than 5 Minutes | 221 | 22.8% |
| 5 to 9 Minutes | 174 | 18.0% |
| 10 to 14 Minutes | 150 | 15.5% |
| 15 to 19 Minutes | 105 | 10.8% |
| 20 to 24 Minutes | 116 | 12.0% |
| 25 to 29 Minutes | 15 | 1.5% |
| 30 to 34 Minutes | 64 | 6.6% |
| 35 to 39 Minutes | 49 | 5.1% |
| 40 to 44 Minutes | 0 | 0.0% |
| 45 to 59 Minutes | 30 | 3.1% |
| 60 to 89 Minutes | 39 | 4.0% |
| 90 or more Minutes | 6 | 0.6% |
Commute Time by Sex in Sioux County
The most common commute times in Sioux County are less than 5 minutes (131 commuters, 26.0%) for males and less than 5 minutes (90 commuters, 19.4%) for females.
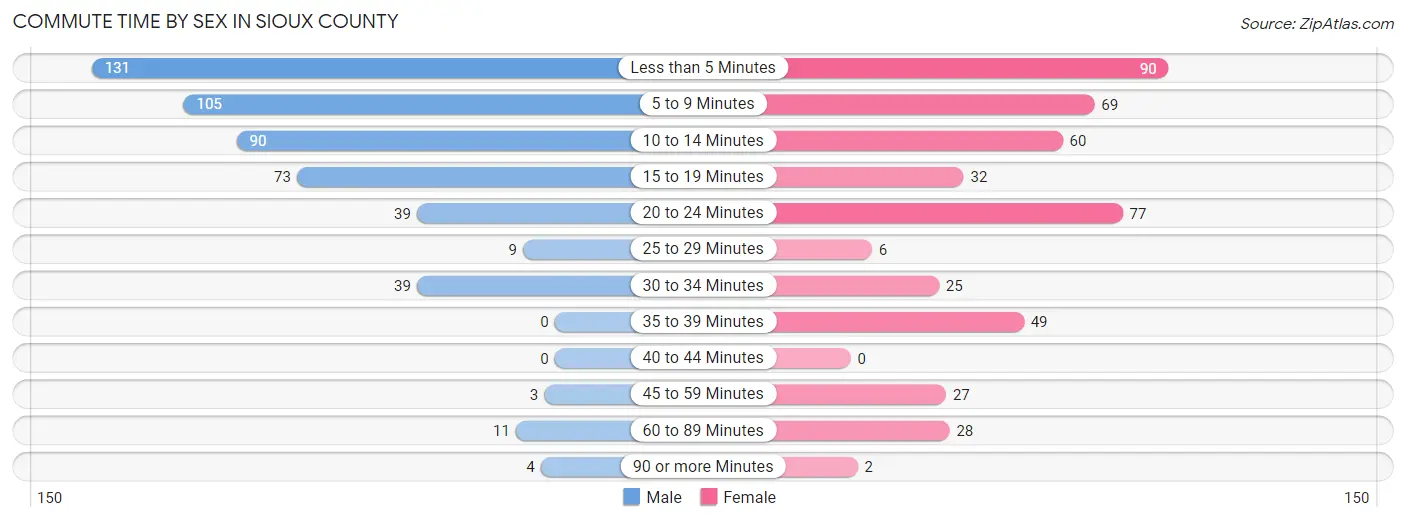
| Commute Time | Male | Female |
| Less than 5 Minutes | 131 (26.0%) | 90 (19.4%) |
| 5 to 9 Minutes | 105 (20.8%) | 69 (14.8%) |
| 10 to 14 Minutes | 90 (17.9%) | 60 (12.9%) |
| 15 to 19 Minutes | 73 (14.5%) | 32 (6.9%) |
| 20 to 24 Minutes | 39 (7.7%) | 77 (16.6%) |
| 25 to 29 Minutes | 9 (1.8%) | 6 (1.3%) |
| 30 to 34 Minutes | 39 (7.7%) | 25 (5.4%) |
| 35 to 39 Minutes | 0 (0.0%) | 49 (10.5%) |
| 40 to 44 Minutes | 0 (0.0%) | 0 (0.0%) |
| 45 to 59 Minutes | 3 (0.6%) | 27 (5.8%) |
| 60 to 89 Minutes | 11 (2.2%) | 28 (6.0%) |
| 90 or more Minutes | 4 (0.8%) | 2 (0.4%) |
Time of Departure to Work by Sex in Sioux County
The most frequent times of departure to work in Sioux County are 7:30 AM to 7:59 AM (229, 45.4%) for males and 7:00 AM to 7:29 AM (139, 29.9%) for females.
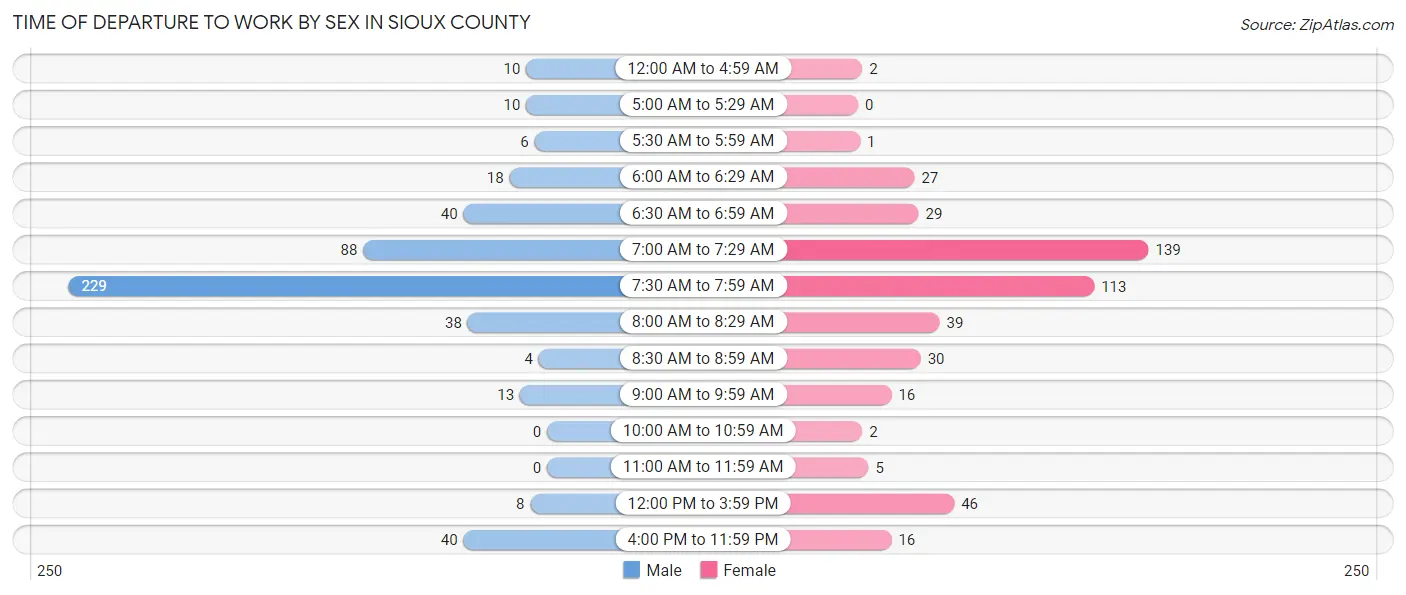
| Time of Departure | Male | Female |
| 12:00 AM to 4:59 AM | 10 (2.0%) | 2 (0.4%) |
| 5:00 AM to 5:29 AM | 10 (2.0%) | 0 (0.0%) |
| 5:30 AM to 5:59 AM | 6 (1.2%) | 1 (0.2%) |
| 6:00 AM to 6:29 AM | 18 (3.6%) | 27 (5.8%) |
| 6:30 AM to 6:59 AM | 40 (7.9%) | 29 (6.2%) |
| 7:00 AM to 7:29 AM | 88 (17.5%) | 139 (29.9%) |
| 7:30 AM to 7:59 AM | 229 (45.4%) | 113 (24.3%) |
| 8:00 AM to 8:29 AM | 38 (7.5%) | 39 (8.4%) |
| 8:30 AM to 8:59 AM | 4 (0.8%) | 30 (6.5%) |
| 9:00 AM to 9:59 AM | 13 (2.6%) | 16 (3.4%) |
| 10:00 AM to 10:59 AM | 0 (0.0%) | 2 (0.4%) |
| 11:00 AM to 11:59 AM | 0 (0.0%) | 5 (1.1%) |
| 12:00 PM to 3:59 PM | 8 (1.6%) | 46 (9.9%) |
| 4:00 PM to 11:59 PM | 40 (7.9%) | 16 (3.4%) |
| Total | 504 (100.0%) | 465 (100.0%) |
Housing Occupancy in Sioux County
Occupancy by Ownership in Sioux County
Of the total 1,047 dwellings in Sioux County, owner-occupied units account for 455 (43.5%), while renter-occupied units make up 592 (56.5%).
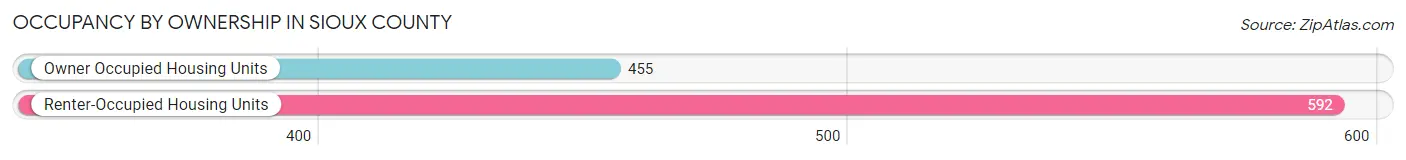
| Occupancy | # Housing Units | % Housing Units |
| Owner Occupied Housing Units | 455 | 43.5% |
| Renter-Occupied Housing Units | 592 | 56.5% |
| Total Occupied Housing Units | 1,047 | 100.0% |
Occupancy by Household Size in Sioux County
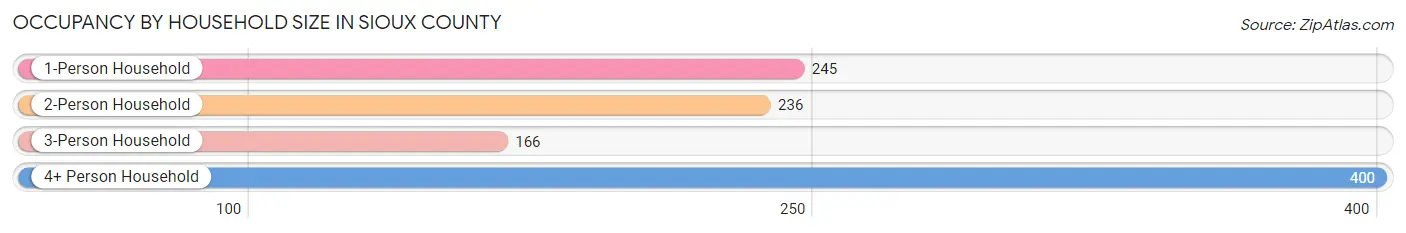
| Household Size | # Housing Units | % Housing Units |
| 1-Person Household | 245 | 23.4% |
| 2-Person Household | 236 | 22.5% |
| 3-Person Household | 166 | 15.9% |
| 4+ Person Household | 400 | 38.2% |
| Total Housing Units | 1,047 | 100.0% |
Occupancy by Ownership by Household Size in Sioux County
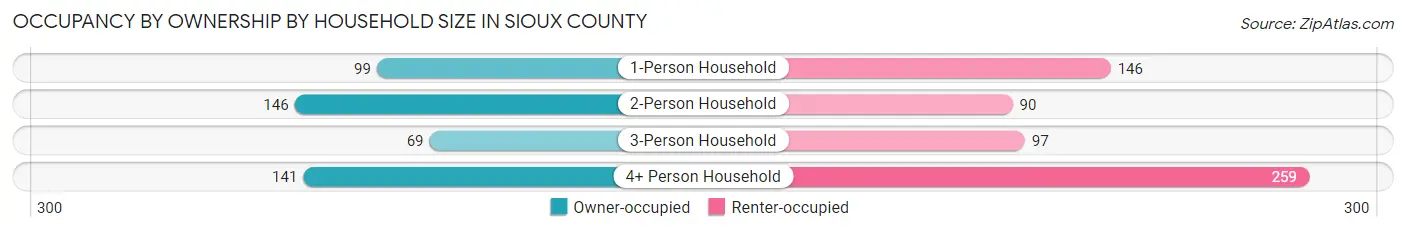
| Household Size | Owner-occupied | Renter-occupied |
| 1-Person Household | 99 (40.4%) | 146 (59.6%) |
| 2-Person Household | 146 (61.9%) | 90 (38.1%) |
| 3-Person Household | 69 (41.6%) | 97 (58.4%) |
| 4+ Person Household | 141 (35.2%) | 259 (64.7%) |
| Total Housing Units | 455 (43.5%) | 592 (56.5%) |
Occupancy by Educational Attainment in Sioux County
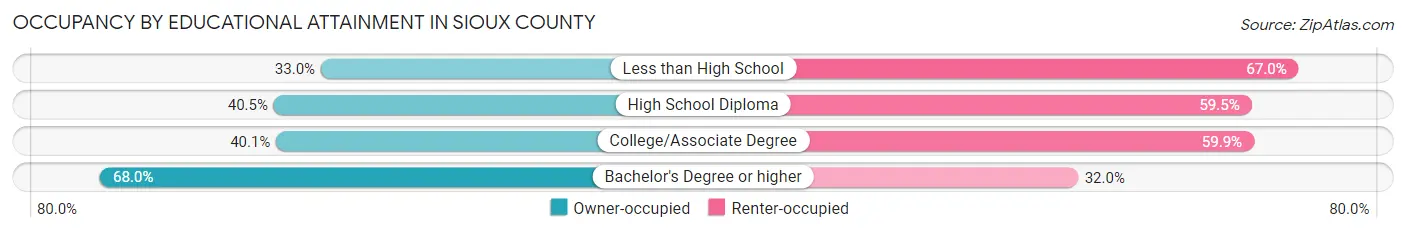
| Household Size | Owner-occupied | Renter-occupied |
| Less than High School | 33 (33.0%) | 67 (67.0%) |
| High School Diploma | 134 (40.5%) | 197 (59.5%) |
| College/Associate Degree | 188 (40.1%) | 281 (59.9%) |
| Bachelor's Degree or higher | 100 (68.0%) | 47 (32.0%) |
Occupancy by Age of Householder in Sioux County
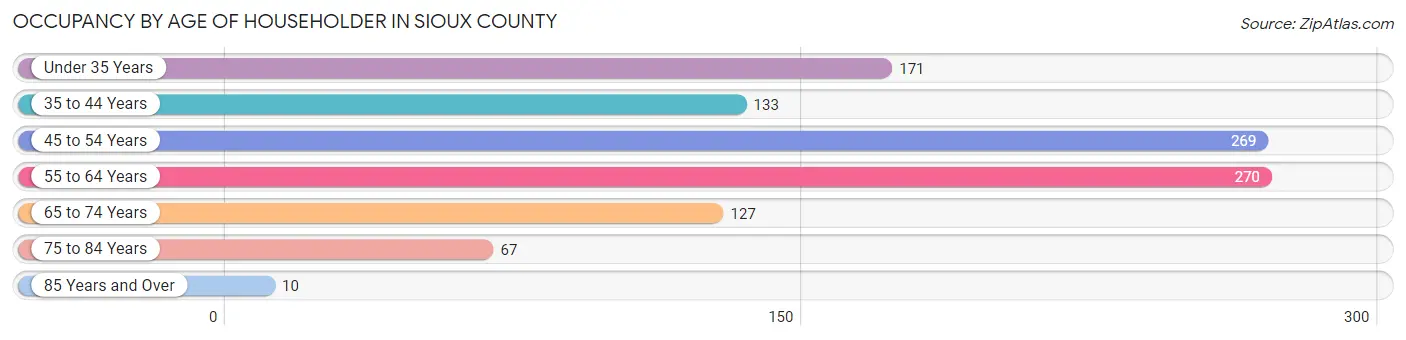
| Age Bracket | # Households | % Households |
| Under 35 Years | 171 | 16.3% |
| 35 to 44 Years | 133 | 12.7% |
| 45 to 54 Years | 269 | 25.7% |
| 55 to 64 Years | 270 | 25.8% |
| 65 to 74 Years | 127 | 12.1% |
| 75 to 84 Years | 67 | 6.4% |
| 85 Years and Over | 10 | 1.0% |
| Total | 1,047 | 100.0% |
Housing Finances in Sioux County
Median Income by Occupancy in Sioux County
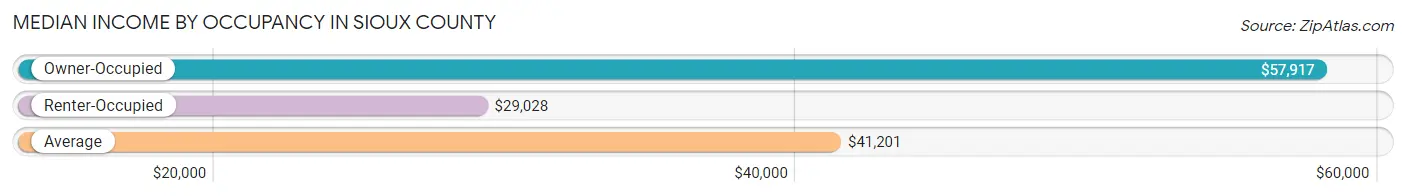
| Occupancy Type | # Households | Median Income |
| Owner-Occupied | 455 (43.5%) | $57,917 |
| Renter-Occupied | 592 (56.5%) | $29,028 |
| Average | 1,047 (100.0%) | $41,201 |
Occupancy by Householder Income Bracket in Sioux County
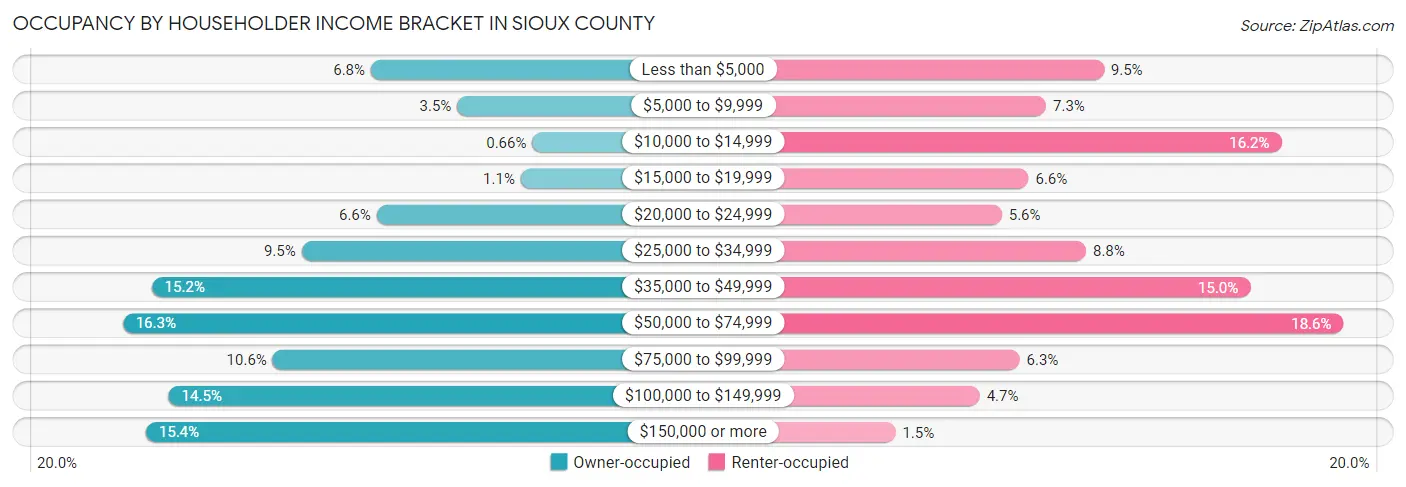
| Income Bracket | Owner-occupied | Renter-occupied |
| Less than $5,000 | 31 (6.8%) | 56 (9.5%) |
| $5,000 to $9,999 | 16 (3.5%) | 43 (7.3%) |
| $10,000 to $14,999 | 3 (0.7%) | 96 (16.2%) |
| $15,000 to $19,999 | 5 (1.1%) | 39 (6.6%) |
| $20,000 to $24,999 | 30 (6.6%) | 33 (5.6%) |
| $25,000 to $34,999 | 43 (9.5%) | 52 (8.8%) |
| $35,000 to $49,999 | 69 (15.2%) | 89 (15.0%) |
| $50,000 to $74,999 | 74 (16.3%) | 110 (18.6%) |
| $75,000 to $99,999 | 48 (10.5%) | 37 (6.2%) |
| $100,000 to $149,999 | 66 (14.5%) | 28 (4.7%) |
| $150,000 or more | 70 (15.4%) | 9 (1.5%) |
| Total | 455 (100.0%) | 592 (100.0%) |
Monthly Housing Cost Tiers in Sioux County
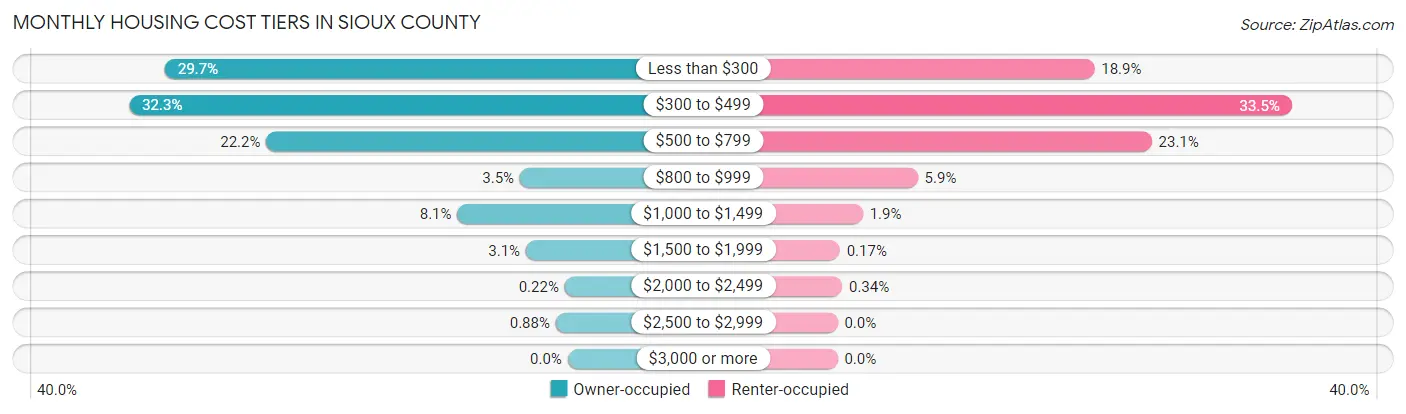
| Monthly Cost | Owner-occupied | Renter-occupied |
| Less than $300 | 135 (29.7%) | 112 (18.9%) |
| $300 to $499 | 147 (32.3%) | 198 (33.5%) |
| $500 to $799 | 101 (22.2%) | 137 (23.1%) |
| $800 to $999 | 16 (3.5%) | 35 (5.9%) |
| $1,000 to $1,499 | 37 (8.1%) | 11 (1.9%) |
| $1,500 to $1,999 | 14 (3.1%) | 1 (0.2%) |
| $2,000 to $2,499 | 1 (0.2%) | 2 (0.3%) |
| $2,500 to $2,999 | 4 (0.9%) | 0 (0.0%) |
| $3,000 or more | 0 (0.0%) | 0 (0.0%) |
| Total | 455 (100.0%) | 592 (100.0%) |
Physical Housing Characteristics in Sioux County
Housing Structures in Sioux County
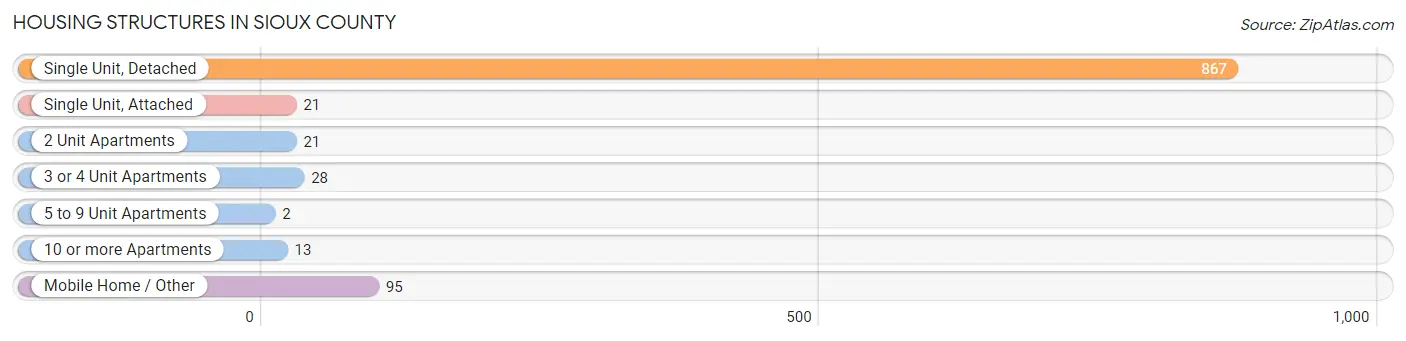
| Structure Type | # Housing Units | % Housing Units |
| Single Unit, Detached | 867 | 82.8% |
| Single Unit, Attached | 21 | 2.0% |
| 2 Unit Apartments | 21 | 2.0% |
| 3 or 4 Unit Apartments | 28 | 2.7% |
| 5 to 9 Unit Apartments | 2 | 0.2% |
| 10 or more Apartments | 13 | 1.2% |
| Mobile Home / Other | 95 | 9.1% |
| Total | 1,047 | 100.0% |
Housing Structures by Occupancy in Sioux County
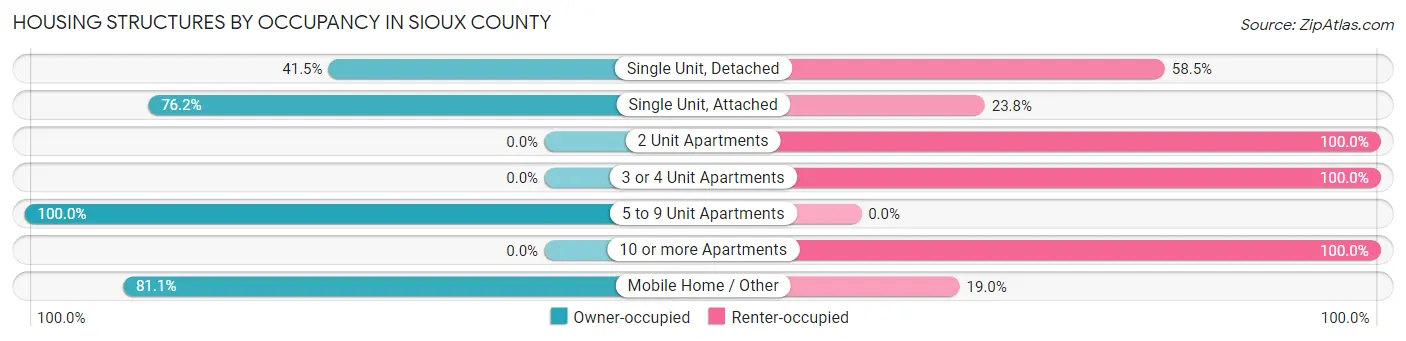
| Structure Type | Owner-occupied | Renter-occupied |
| Single Unit, Detached | 360 (41.5%) | 507 (58.5%) |
| Single Unit, Attached | 16 (76.2%) | 5 (23.8%) |
| 2 Unit Apartments | 0 (0.0%) | 21 (100.0%) |
| 3 or 4 Unit Apartments | 0 (0.0%) | 28 (100.0%) |
| 5 to 9 Unit Apartments | 2 (100.0%) | 0 (0.0%) |
| 10 or more Apartments | 0 (0.0%) | 13 (100.0%) |
| Mobile Home / Other | 77 (81.0%) | 18 (19.0%) |
| Total | 455 (43.5%) | 592 (56.5%) |
Housing Structures by Number of Rooms in Sioux County
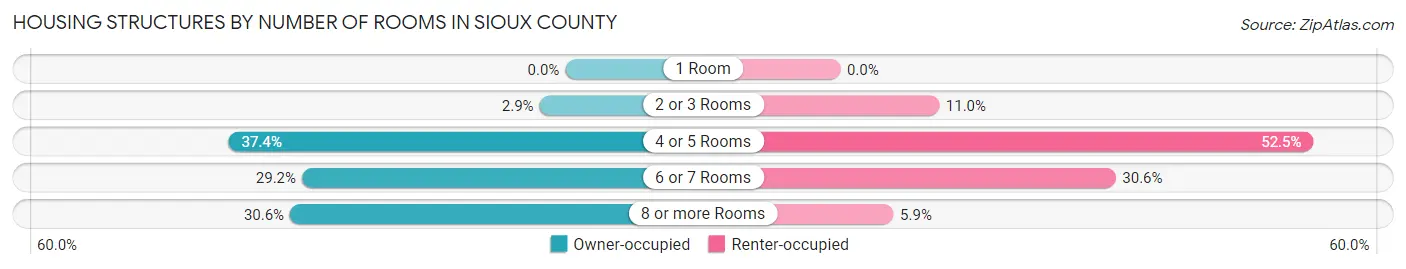
| Number of Rooms | Owner-occupied | Renter-occupied |
| 1 Room | 0 (0.0%) | 0 (0.0%) |
| 2 or 3 Rooms | 13 (2.9%) | 65 (11.0%) |
| 4 or 5 Rooms | 170 (37.4%) | 311 (52.5%) |
| 6 or 7 Rooms | 133 (29.2%) | 181 (30.6%) |
| 8 or more Rooms | 139 (30.5%) | 35 (5.9%) |
| Total | 455 (100.0%) | 592 (100.0%) |
Housing Structure by Heating Type in Sioux County
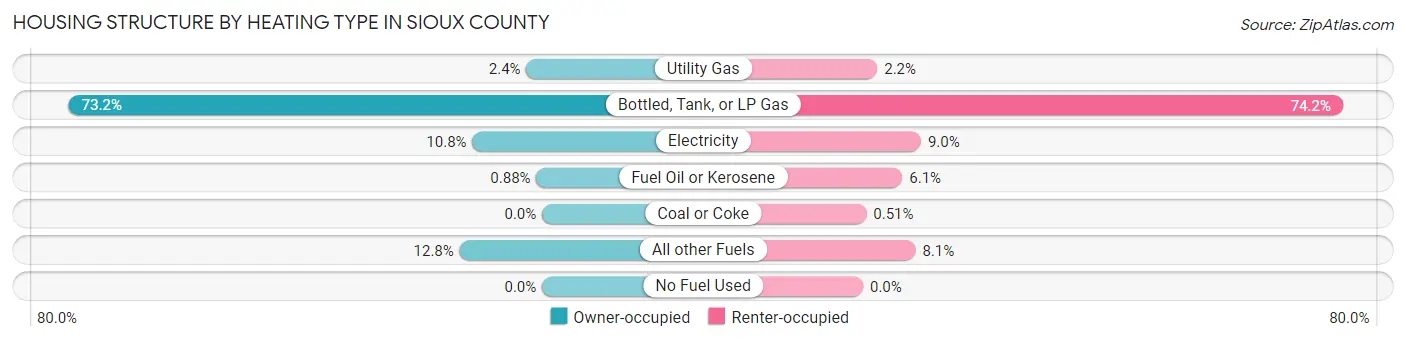
| Heating Type | Owner-occupied | Renter-occupied |
| Utility Gas | 11 (2.4%) | 13 (2.2%) |
| Bottled, Tank, or LP Gas | 333 (73.2%) | 439 (74.2%) |
| Electricity | 49 (10.8%) | 53 (8.9%) |
| Fuel Oil or Kerosene | 4 (0.9%) | 36 (6.1%) |
| Coal or Coke | 0 (0.0%) | 3 (0.5%) |
| All other Fuels | 58 (12.8%) | 48 (8.1%) |
| No Fuel Used | 0 (0.0%) | 0 (0.0%) |
| Total | 455 (100.0%) | 592 (100.0%) |
Household Vehicle Usage in Sioux County
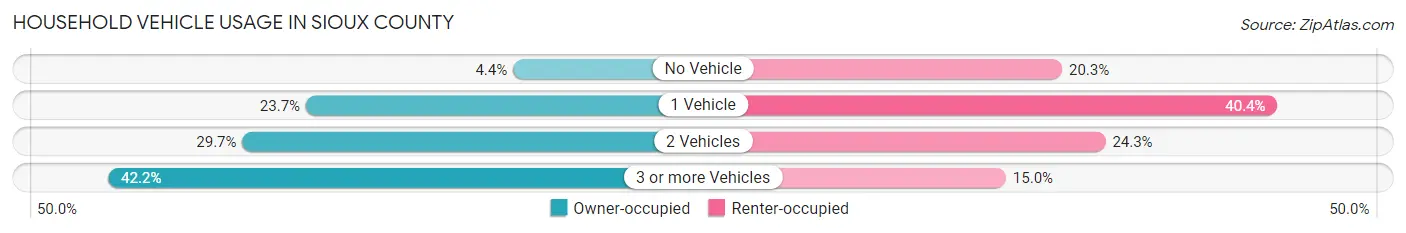
| Vehicles per Household | Owner-occupied | Renter-occupied |
| No Vehicle | 20 (4.4%) | 120 (20.3%) |
| 1 Vehicle | 108 (23.7%) | 239 (40.4%) |
| 2 Vehicles | 135 (29.7%) | 144 (24.3%) |
| 3 or more Vehicles | 192 (42.2%) | 89 (15.0%) |
| Total | 455 (100.0%) | 592 (100.0%) |
Real Estate & Mortgages in Sioux County
Real Estate and Mortgage Overview in Sioux County
| Characteristic | Without Mortgage | With Mortgage |
| Housing Units | 370 | 85 |
| Median Property Value | $71,300 | $221,000 |
| Median Household Income | $55,000 | $14 |
| Monthly Housing Costs | $334 | $0 |
| Real Estate Taxes | $220 | $49 |
Property Value by Mortgage Status in Sioux County
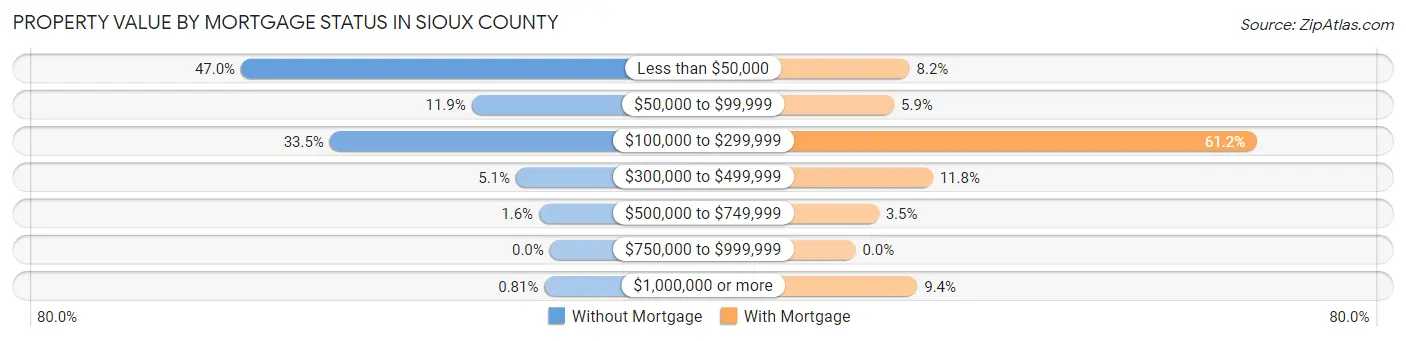
| Property Value | Without Mortgage | With Mortgage |
| Less than $50,000 | 174 (47.0%) | 7 (8.2%) |
| $50,000 to $99,999 | 44 (11.9%) | 5 (5.9%) |
| $100,000 to $299,999 | 124 (33.5%) | 52 (61.2%) |
| $300,000 to $499,999 | 19 (5.1%) | 10 (11.8%) |
| $500,000 to $749,999 | 6 (1.6%) | 3 (3.5%) |
| $750,000 to $999,999 | 0 (0.0%) | 0 (0.0%) |
| $1,000,000 or more | 3 (0.8%) | 8 (9.4%) |
| Total | 370 (100.0%) | 85 (100.0%) |
Household Income by Mortgage Status in Sioux County
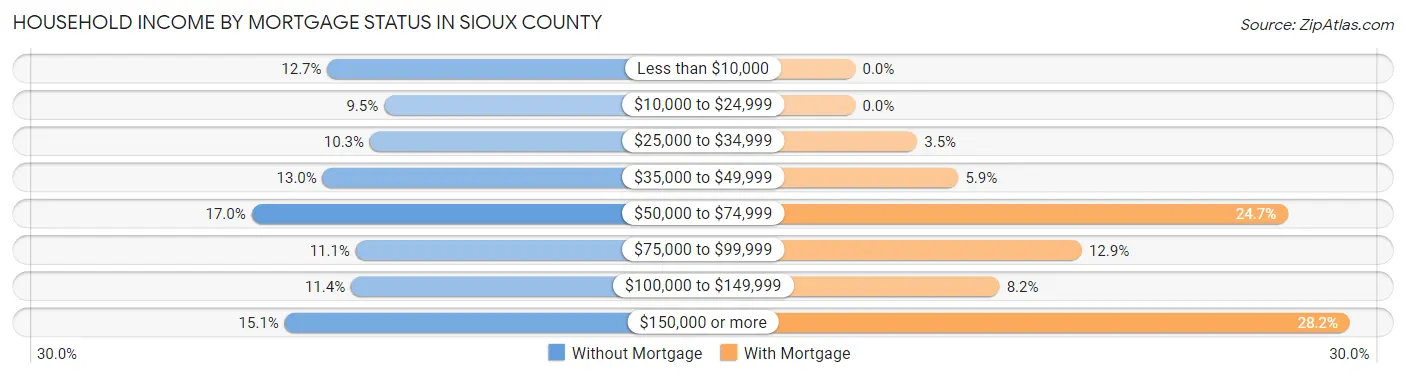
| Household Income | Without Mortgage | With Mortgage |
| Less than $10,000 | 47 (12.7%) | 0 (0.0%) |
| $10,000 to $24,999 | 35 (9.5%) | 0 (0.0%) |
| $25,000 to $34,999 | 38 (10.3%) | 3 (3.5%) |
| $35,000 to $49,999 | 48 (13.0%) | 5 (5.9%) |
| $50,000 to $74,999 | 63 (17.0%) | 21 (24.7%) |
| $75,000 to $99,999 | 41 (11.1%) | 11 (12.9%) |
| $100,000 to $149,999 | 42 (11.4%) | 7 (8.2%) |
| $150,000 or more | 56 (15.1%) | 24 (28.2%) |
| Total | 370 (100.0%) | 85 (100.0%) |
Property Value to Household Income Ratio in Sioux County
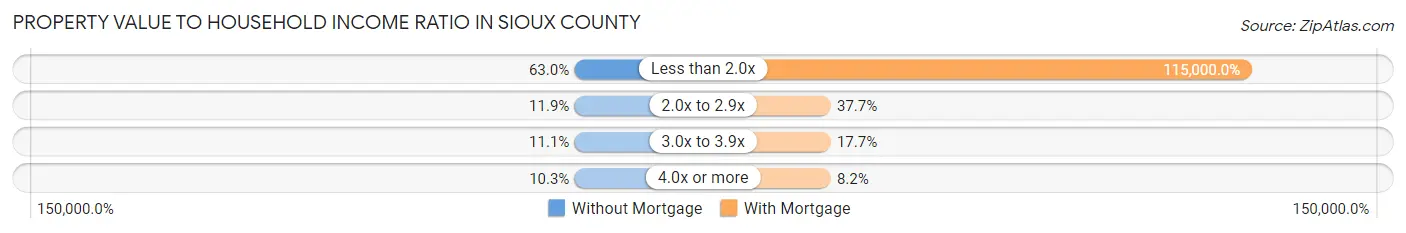
| Value-to-Income Ratio | Without Mortgage | With Mortgage |
| Less than 2.0x | 233 (63.0%) | 97,750 (115,000.0%) |
| 2.0x to 2.9x | 44 (11.9%) | 32 (37.7%) |
| 3.0x to 3.9x | 41 (11.1%) | 15 (17.6%) |
| 4.0x or more | 38 (10.3%) | 7 (8.2%) |
| Total | 370 (100.0%) | 85 (100.0%) |
Real Estate Taxes by Mortgage Status in Sioux County
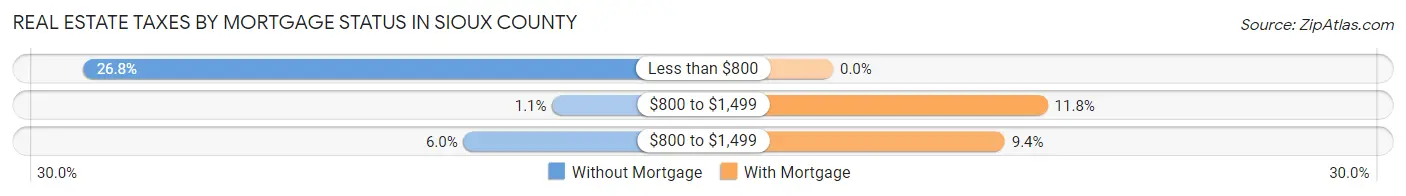
| Property Taxes | Without Mortgage | With Mortgage |
| Less than $800 | 99 (26.8%) | 0 (0.0%) |
| $800 to $1,499 | 4 (1.1%) | 10 (11.8%) |
| $800 to $1,499 | 22 (5.9%) | 8 (9.4%) |
| Total | 370 (100.0%) | 85 (100.0%) |
Health & Disability in Sioux County
Health Insurance Coverage by Age in Sioux County
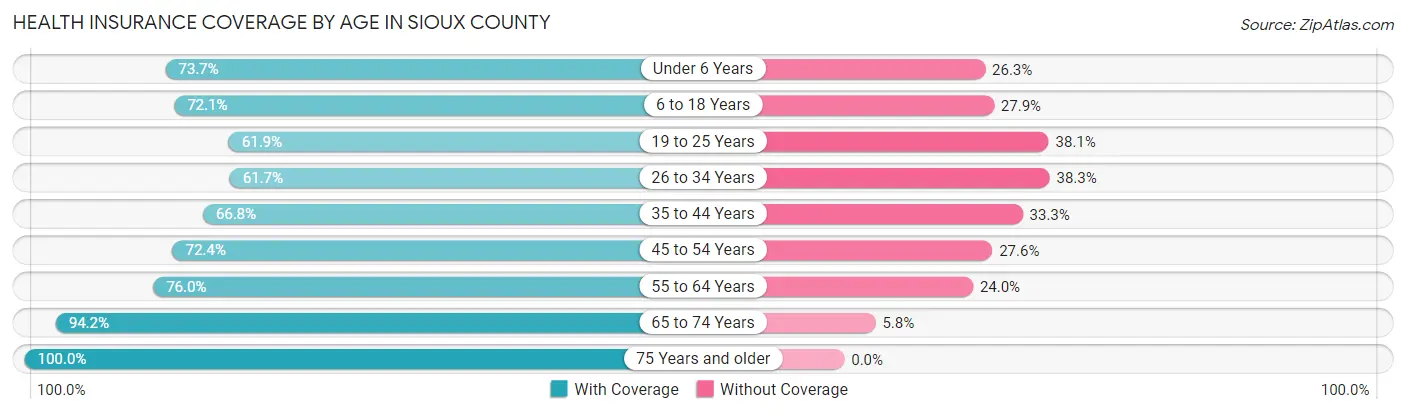
| Age Bracket | With Coverage | Without Coverage |
| Under 6 Years | 278 (73.7%) | 99 (26.3%) |
| 6 to 18 Years | 783 (72.1%) | 303 (27.9%) |
| 19 to 25 Years | 260 (61.9%) | 160 (38.1%) |
| 26 to 34 Years | 242 (61.7%) | 150 (38.3%) |
| 35 to 44 Years | 269 (66.7%) | 134 (33.3%) |
| 45 to 54 Years | 328 (72.4%) | 125 (27.6%) |
| 55 to 64 Years | 320 (76.0%) | 101 (24.0%) |
| 65 to 74 Years | 178 (94.2%) | 11 (5.8%) |
| 75 Years and older | 125 (100.0%) | 0 (0.0%) |
| Total | 2,783 (72.0%) | 1,083 (28.0%) |
Health Insurance Coverage by Citizenship Status in Sioux County
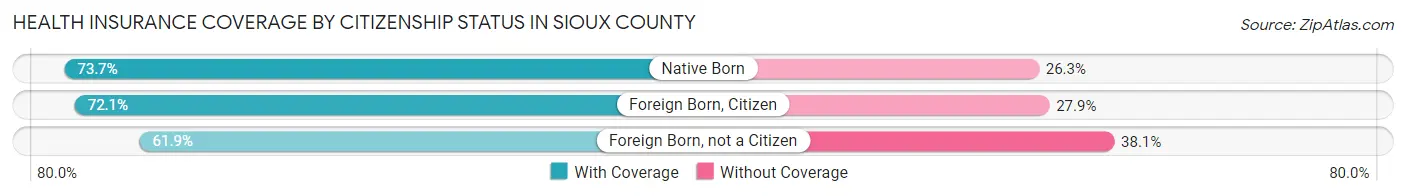
| Citizenship Status | With Coverage | Without Coverage |
| Native Born | 278 (73.7%) | 99 (26.3%) |
| Foreign Born, Citizen | 783 (72.1%) | 303 (27.9%) |
| Foreign Born, not a Citizen | 260 (61.9%) | 160 (38.1%) |
Health Insurance Coverage by Household Income in Sioux County
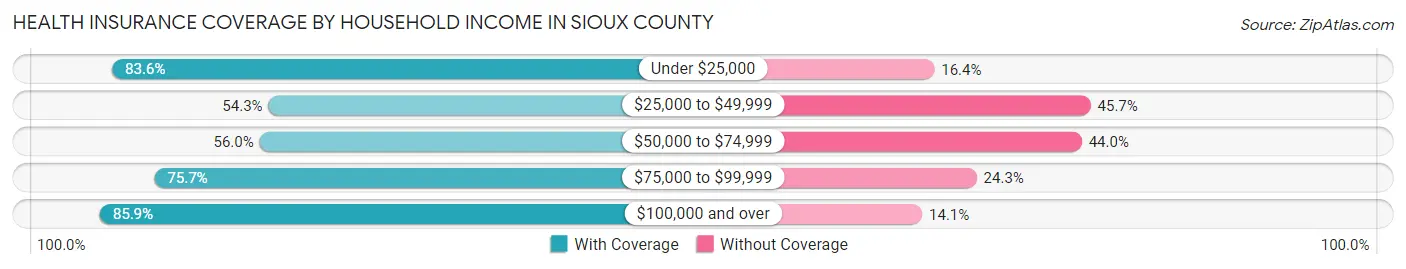
| Household Income | With Coverage | Without Coverage |
| Under $25,000 | 984 (83.6%) | 193 (16.4%) |
| $25,000 to $49,999 | 528 (54.3%) | 444 (45.7%) |
| $50,000 to $74,999 | 309 (56.0%) | 243 (44.0%) |
| $75,000 to $99,999 | 311 (75.7%) | 100 (24.3%) |
| $100,000 and over | 627 (85.9%) | 103 (14.1%) |
Public vs Private Health Insurance Coverage by Age in Sioux County
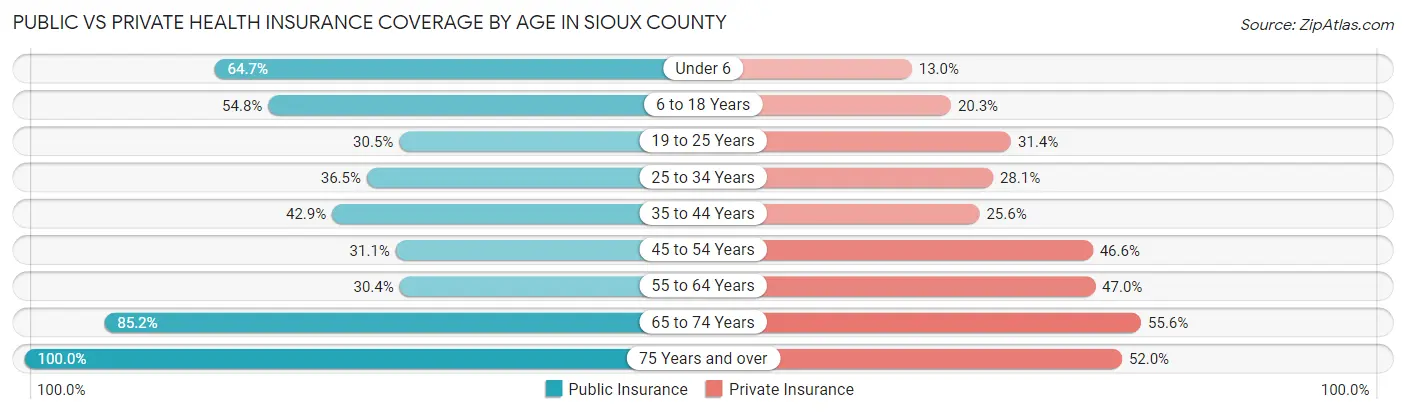
| Age Bracket | Public Insurance | Private Insurance |
| Under 6 | 244 (64.7%) | 49 (13.0%) |
| 6 to 18 Years | 595 (54.8%) | 220 (20.3%) |
| 19 to 25 Years | 128 (30.5%) | 132 (31.4%) |
| 25 to 34 Years | 143 (36.5%) | 110 (28.1%) |
| 35 to 44 Years | 173 (42.9%) | 103 (25.6%) |
| 45 to 54 Years | 141 (31.1%) | 211 (46.6%) |
| 55 to 64 Years | 128 (30.4%) | 198 (47.0%) |
| 65 to 74 Years | 161 (85.2%) | 105 (55.6%) |
| 75 Years and over | 125 (100.0%) | 65 (52.0%) |
| Total | 1,838 (47.5%) | 1,193 (30.9%) |
Disability Status by Sex by Age in Sioux County
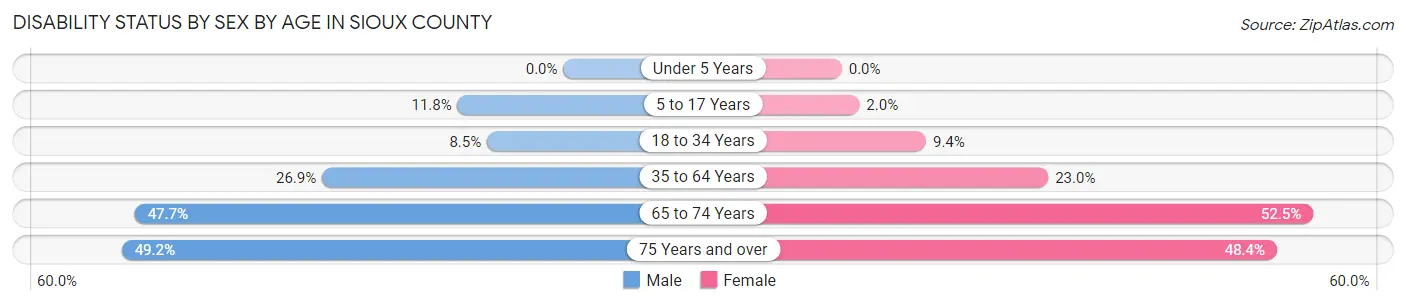
| Age Bracket | Male | Female |
| Under 5 Years | 0 (0.0%) | 0 (0.0%) |
| 5 to 17 Years | 63 (11.8%) | 10 (2.0%) |
| 18 to 34 Years | 38 (8.5%) | 41 (9.4%) |
| 35 to 64 Years | 169 (26.9%) | 149 (23.0%) |
| 65 to 74 Years | 42 (47.7%) | 53 (52.5%) |
| 75 Years and over | 30 (49.2%) | 31 (48.4%) |
Disability Class by Sex by Age in Sioux County
Disability Class: Hearing Difficulty
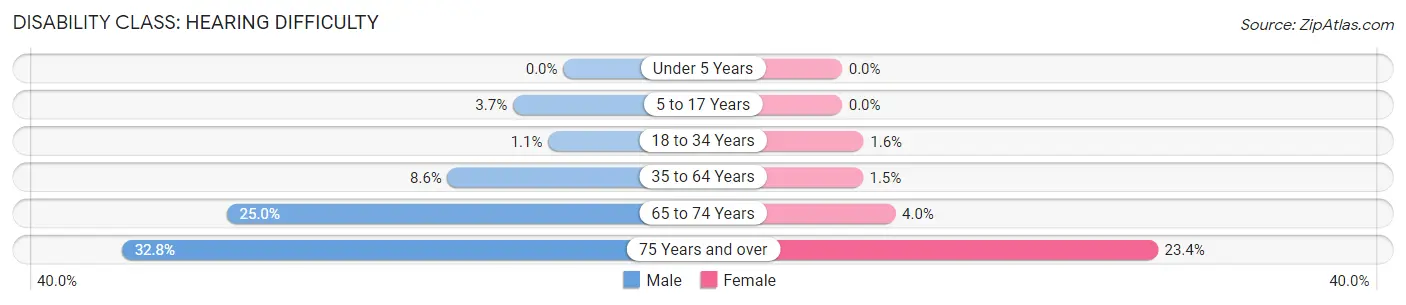
| Age Bracket | Male | Female |
| Under 5 Years | 0 (0.0%) | 0 (0.0%) |
| 5 to 17 Years | 20 (3.7%) | 0 (0.0%) |
| 18 to 34 Years | 5 (1.1%) | 7 (1.6%) |
| 35 to 64 Years | 54 (8.6%) | 10 (1.5%) |
| 65 to 74 Years | 22 (25.0%) | 4 (4.0%) |
| 75 Years and over | 20 (32.8%) | 15 (23.4%) |
Disability Class: Vision Difficulty
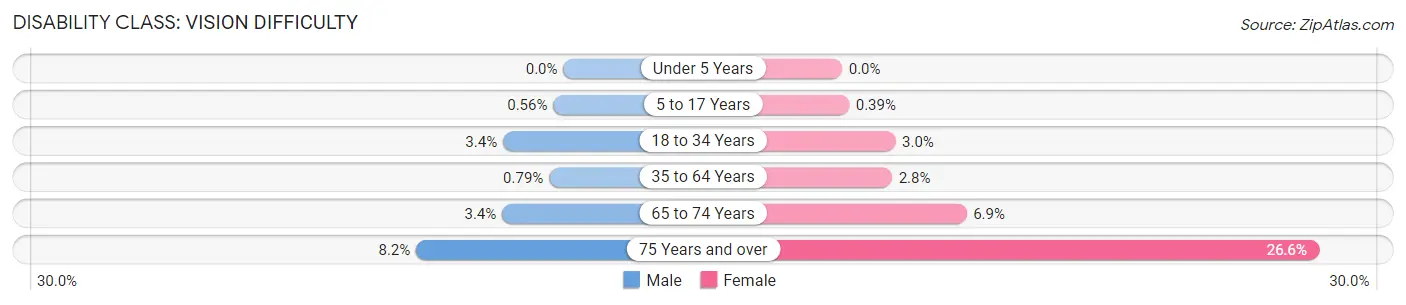
| Age Bracket | Male | Female |
| Under 5 Years | 0 (0.0%) | 0 (0.0%) |
| 5 to 17 Years | 3 (0.6%) | 2 (0.4%) |
| 18 to 34 Years | 15 (3.4%) | 13 (3.0%) |
| 35 to 64 Years | 5 (0.8%) | 18 (2.8%) |
| 65 to 74 Years | 3 (3.4%) | 7 (6.9%) |
| 75 Years and over | 5 (8.2%) | 17 (26.6%) |
Disability Class: Cognitive Difficulty
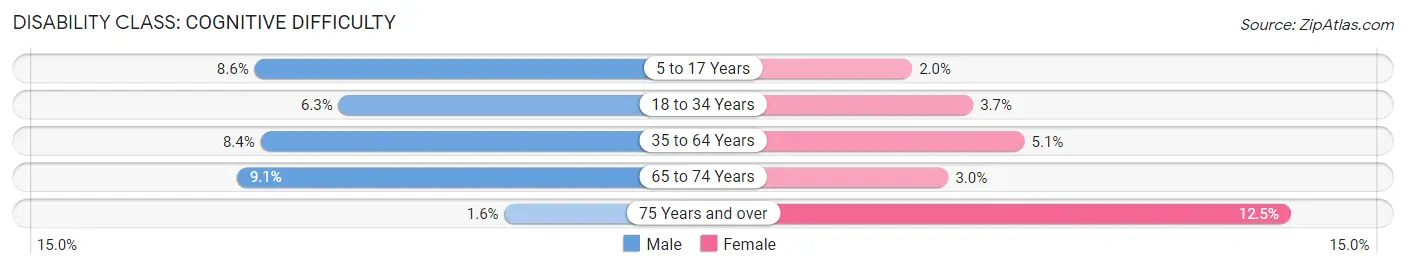
| Age Bracket | Male | Female |
| 5 to 17 Years | 46 (8.6%) | 10 (2.0%) |
| 18 to 34 Years | 28 (6.3%) | 16 (3.7%) |
| 35 to 64 Years | 53 (8.4%) | 33 (5.1%) |
| 65 to 74 Years | 8 (9.1%) | 3 (3.0%) |
| 75 Years and over | 1 (1.6%) | 8 (12.5%) |
Disability Class: Ambulatory Difficulty
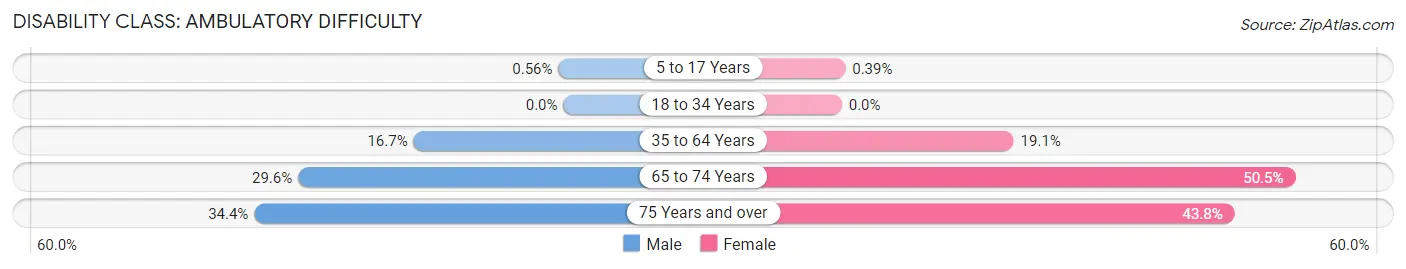
| Age Bracket | Male | Female |
| 5 to 17 Years | 3 (0.6%) | 2 (0.4%) |
| 18 to 34 Years | 0 (0.0%) | 0 (0.0%) |
| 35 to 64 Years | 105 (16.7%) | 124 (19.1%) |
| 65 to 74 Years | 26 (29.5%) | 51 (50.5%) |
| 75 Years and over | 21 (34.4%) | 28 (43.8%) |
Disability Class: Self-Care Difficulty
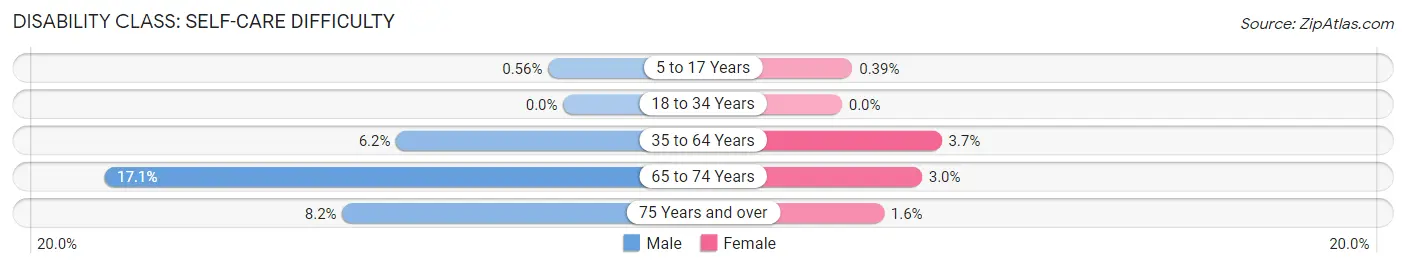
| Age Bracket | Male | Female |
| 5 to 17 Years | 3 (0.6%) | 2 (0.4%) |
| 18 to 34 Years | 0 (0.0%) | 0 (0.0%) |
| 35 to 64 Years | 39 (6.2%) | 24 (3.7%) |
| 65 to 74 Years | 15 (17.1%) | 3 (3.0%) |
| 75 Years and over | 5 (8.2%) | 1 (1.6%) |
Technology Access in Sioux County
Computing Device Access in Sioux County
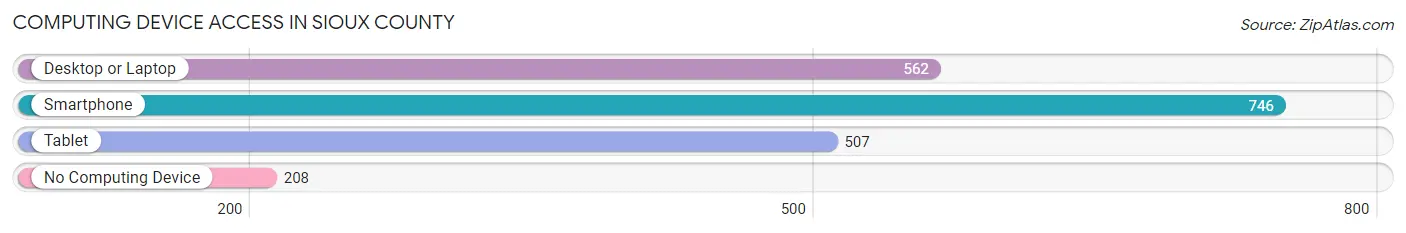
| Device Type | # Households | % Households |
| Desktop or Laptop | 562 | 53.7% |
| Smartphone | 746 | 71.3% |
| Tablet | 507 | 48.4% |
| No Computing Device | 208 | 19.9% |
| Total | 1,047 | 100.0% |
Internet Access in Sioux County
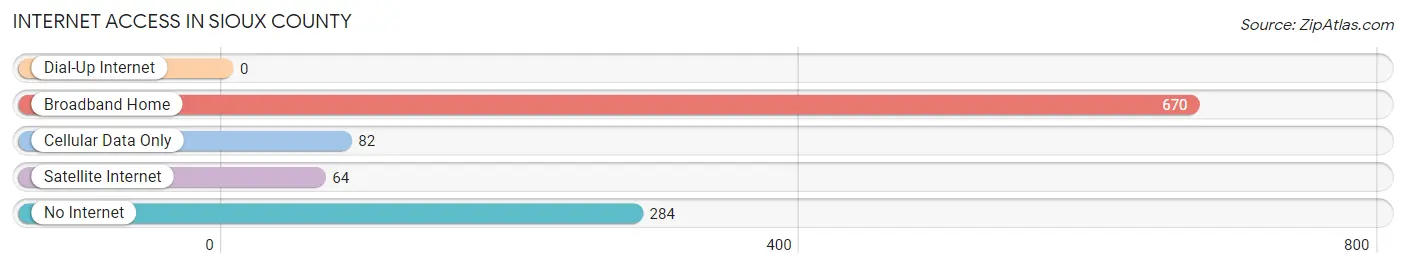
| Internet Type | # Households | % Households |
| Dial-Up Internet | 0 | 0.0% |
| Broadband Home | 670 | 64.0% |
| Cellular Data Only | 82 | 7.8% |
| Satellite Internet | 64 | 6.1% |
| No Internet | 284 | 27.1% |
| Total | 1,047 | 100.0% |
Sioux County Summary
Sioux County is located in the northwestern corner of North Dakota, and is bordered by Montana to the west and South Dakota to the south. It is part of the Great Plains region of the United States, and is one of the most sparsely populated counties in the state. The county seat is Watford City, and the county has a total area of 1,845 square miles.
History
Sioux County was established in 1883, and was named after the Sioux Native American tribe. The county was originally part of the Dakota Territory, and was later included in the state of North Dakota when it was admitted to the Union in 1889. The county was initially populated by ranchers and farmers, and the economy was largely based on agriculture.
Geography
Sioux County is located in the northwestern corner of North Dakota, and is bordered by Montana to the west and South Dakota to the south. It is part of the Great Plains region of the United States, and is one of the most sparsely populated counties in the state. The county seat is Watford City, and the county has a total area of 1,845 square miles. The terrain is mostly flat, with rolling hills in the east and south. The county is home to several rivers, including the Little Missouri River, the Cannonball River, and the Yellowstone River.
Economy
The economy of Sioux County is largely based on agriculture, with wheat, corn, and soybeans being the main crops. Cattle ranching is also an important part of the economy, and the county is home to several large ranches. Oil and gas production is also an important part of the economy, and the county is home to several oil and gas fields. Tourism is also an important part of the economy, with visitors coming to the county to enjoy its natural beauty and outdoor activities.
Demographics
As of the 2010 census, the population of Sioux County was 7,845. The population is largely rural, with most of the population living in small towns and rural areas. The racial makeup of the county is 94.3% White, 0.3% African American, 0.7% Native American, 0.2% Asian, 0.1% Pacific Islander, and 4.4% from other races. The median household income is $45,813, and the median family income is $51,945. The per capita income is $20,945. The unemployment rate is 3.2%.
Common Questions
What is the Total Population of Sioux County?
Total Population of Sioux County is 3,896.
What is the Total Male Population of Sioux County?
Total Male Population of Sioux County is 1,958.
What is the Total Female Population of Sioux County?
Total Female Population of Sioux County is 1,938.
What is the Ratio of Males per 100 Females in Sioux County?
There are 101.03 Males per 100 Females in Sioux County.
What is the Ratio of Females per 100 Males in Sioux County?
There are 98.98 Females per 100 Males in Sioux County.
What is the Median Population Age in Sioux County?
Median Population Age in Sioux County is 27.1 Years.
What is the Average Family Size in Sioux County
Average Family Size in Sioux County is 4.4 People.
What is the Average Household Size in Sioux County
Average Household Size in Sioux County is 3.7 People.
What is Per Capita Income in Sioux County?
Per Capita income in Sioux County is $17,185.
What is the Median Family Income in Sioux County?
Median Family Income in Sioux County is $46,719.
What is the Median Household income in Sioux County?
Median Household Income in Sioux County is $41,201.
What is Income or Wage Gap in Sioux County?
Income or Wage Gap in Sioux County is 10.7%.
Women in Sioux County earn 89.3 cents for every dollar earned by a man.
What is Family Income Deficit in Sioux County?
Family Income Deficit in Sioux County is $18,880.
Families that are below poverty line in Sioux County earn $18,880 less on average than the poverty threshold level.
What is Inequality or Gini Index in Sioux County?
Inequality or Gini Index in Sioux County is 0.52.
How Large is the Labor Force in Sioux County?
There are 1,345 People in the Labor Forcein in Sioux County.
What is the Percentage of People in the Labor Force in Sioux County?
50.1% of People are in the Labor Force in Sioux County.
What is the Unemployment Rate in Sioux County?
Unemployment Rate in Sioux County is 20.7%.