Rolette County, ND
Rolette County Map
Rolette County Overview
12,292
TOTAL POPULATION
6,058
MALE POPULATION
6,234
FEMALE POPULATION
97.18
MALES / 100 FEMALES
102.91
FEMALES / 100 MALES
31.1
MEDIAN AGE
3.8
AVG FAMILY SIZE
3.3
AVG HOUSEHOLD SIZE
$23,160
PER CAPITA INCOME
$59,853
AVG FAMILY INCOME
$53,806
AVG HOUSEHOLD INCOME
3.2%
WAGE / INCOME GAP [ % ]
96.8¢/ $1
WAGE / INCOME GAP [ $ ]
$16,405
FAMILY INCOME DEFICIT
0.44
INEQUALITY / GINI INDEX
4,809
LABOR FORCE [ PEOPLE ]
54.9%
PERCENT IN LABOR FORCE
6.4%
UNEMPLOYMENT RATE
Rolette County Area Codes
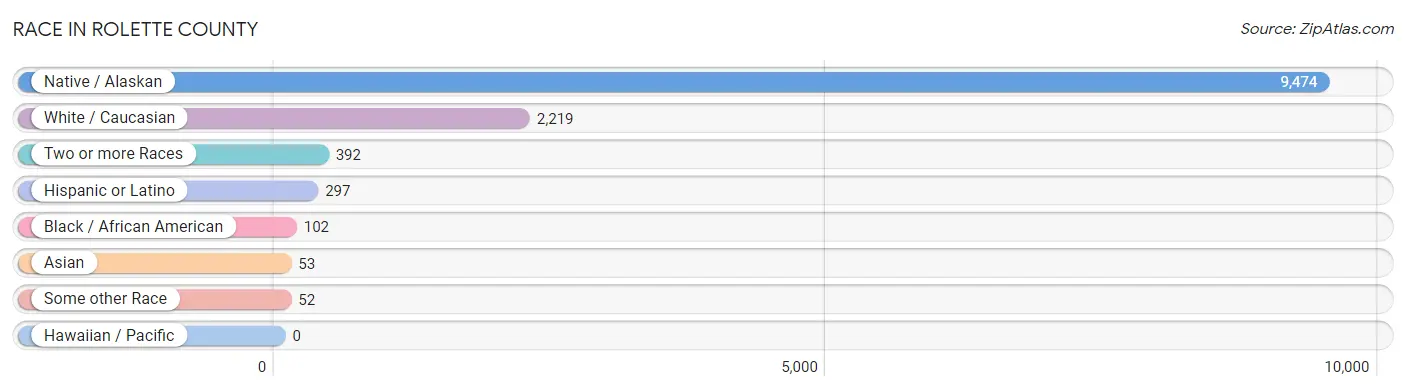
Race in Rolette County
The most populous races in Rolette County are Native / Alaskan (9,474 | 77.1%), White / Caucasian (2,219 | 18.0%), and Two or more Races (392 | 3.2%).
| Race | # Population | % Population |
| Asian | 53 | 0.4% |
| Black / African American | 102 | 0.8% |
| Hawaiian / Pacific | 0 | 0.0% |
| Hispanic or Latino | 297 | 2.4% |
| Native / Alaskan | 9,474 | 77.1% |
| White / Caucasian | 2,219 | 18.0% |
| Two or more Races | 392 | 3.2% |
| Some other Race | 52 | 0.4% |
| Total | 12,292 | 100.0% |
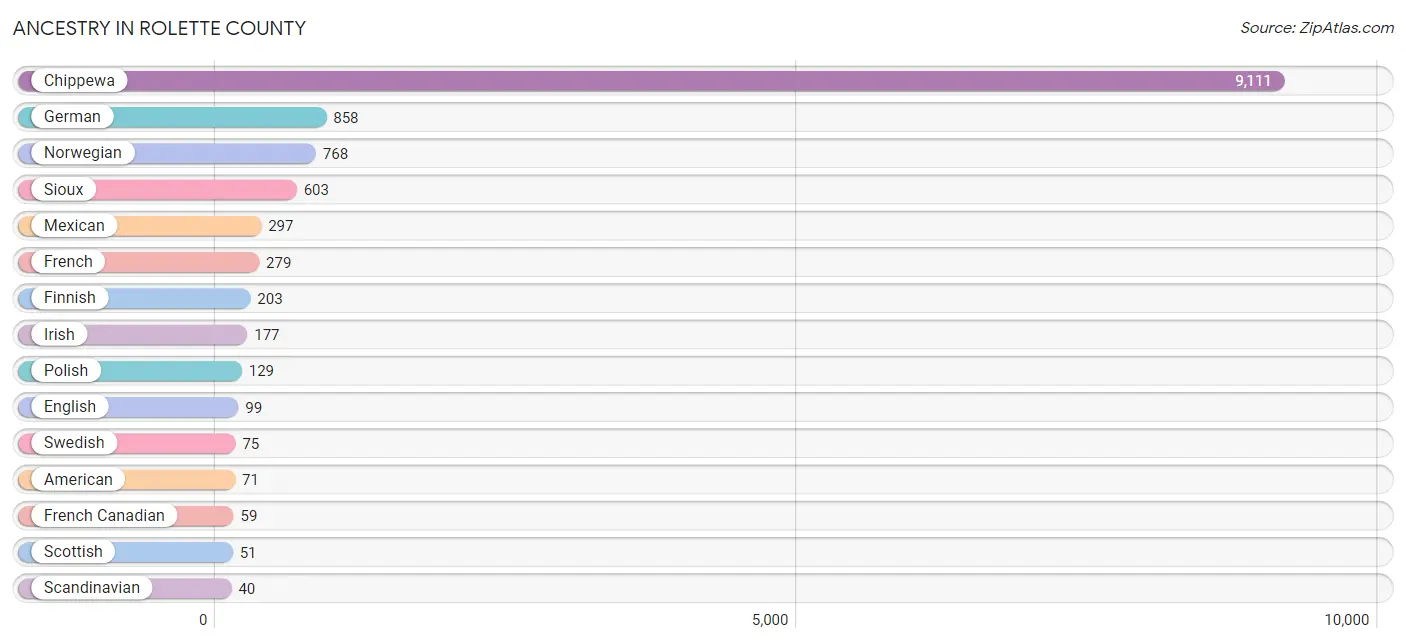
Ancestry in Rolette County
The most populous ancestries reported in Rolette County are Chippewa (9,111 | 74.1%), German (858 | 7.0%), Norwegian (768 | 6.2%), Sioux (603 | 4.9%), and Mexican (297 | 2.4%), together accounting for 94.7% of all Rolette County residents.
| Ancestry | # Population | % Population |
| American | 71 | 0.6% |
| Australian | 6 | 0.1% |
| Bangladeshi | 1 | 0.0% |
| Belgian | 1 | 0.0% |
| Canadian | 2 | 0.0% |
| Cherokee | 20 | 0.2% |
| Chippewa | 9,111 | 74.1% |
| Choctaw | 8 | 0.1% |
| Cree | 34 | 0.3% |
| Czech | 20 | 0.2% |
| Danish | 12 | 0.1% |
| Dutch | 38 | 0.3% |
| English | 99 | 0.8% |
| European | 5 | 0.0% |
| Finnish | 203 | 1.7% |
| French | 279 | 2.3% |
| French Canadian | 59 | 0.5% |
| German | 858 | 7.0% |
| Greek | 2 | 0.0% |
| Hungarian | 1 | 0.0% |
| Indian (Asian) | 29 | 0.2% |
| Irish | 177 | 1.4% |
| Italian | 30 | 0.2% |
| Korean | 9 | 0.1% |
| Luxembourger | 3 | 0.0% |
| Mexican | 297 | 2.4% |
| Northern European | 8 | 0.1% |
| Norwegian | 768 | 6.2% |
| Polish | 129 | 1.1% |
| Russian | 37 | 0.3% |
| Scandinavian | 40 | 0.3% |
| Scotch-Irish | 6 | 0.1% |
| Scottish | 51 | 0.4% |
| Sioux | 603 | 4.9% |
| South African | 1 | 0.0% |
| Subsaharan African | 1 | 0.0% |
| Swedish | 75 | 0.6% |
| Swiss | 15 | 0.1% |
| Thai | 14 | 0.1% |
| Ukrainian | 5 | 0.0% | View All 40 Rows |
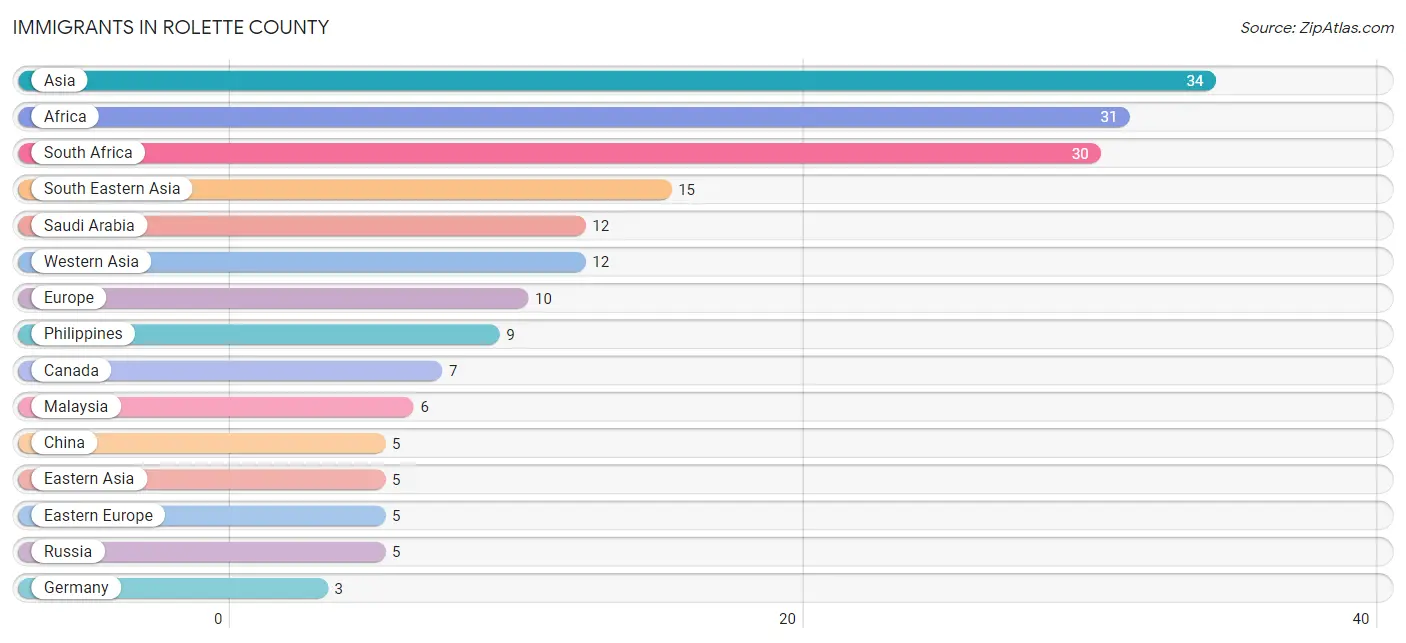
Immigrants in Rolette County
The most numerous immigrant groups reported in Rolette County came from Asia (34 | 0.3%), Africa (31 | 0.3%), South Africa (30 | 0.2%), South Eastern Asia (15 | 0.1%), and Saudi Arabia (12 | 0.1%), together accounting for 1.0% of all Rolette County residents.
| Immigration Origin | # Population | % Population |
| Africa | 31 | 0.3% |
| Asia | 34 | 0.3% |
| Canada | 7 | 0.1% |
| China | 5 | 0.0% |
| Eastern Asia | 5 | 0.0% |
| Eastern Europe | 5 | 0.0% |
| Europe | 10 | 0.1% |
| Germany | 3 | 0.0% |
| Ghana | 1 | 0.0% |
| India | 2 | 0.0% |
| Malaysia | 6 | 0.1% |
| Northern Europe | 2 | 0.0% |
| Norway | 2 | 0.0% |
| Philippines | 9 | 0.1% |
| Russia | 5 | 0.0% |
| Saudi Arabia | 12 | 0.1% |
| South Africa | 30 | 0.2% |
| South Central Asia | 2 | 0.0% |
| South Eastern Asia | 15 | 0.1% |
| Western Africa | 1 | 0.0% |
| Western Asia | 12 | 0.1% |
| Western Europe | 3 | 0.0% | View All 22 Rows |
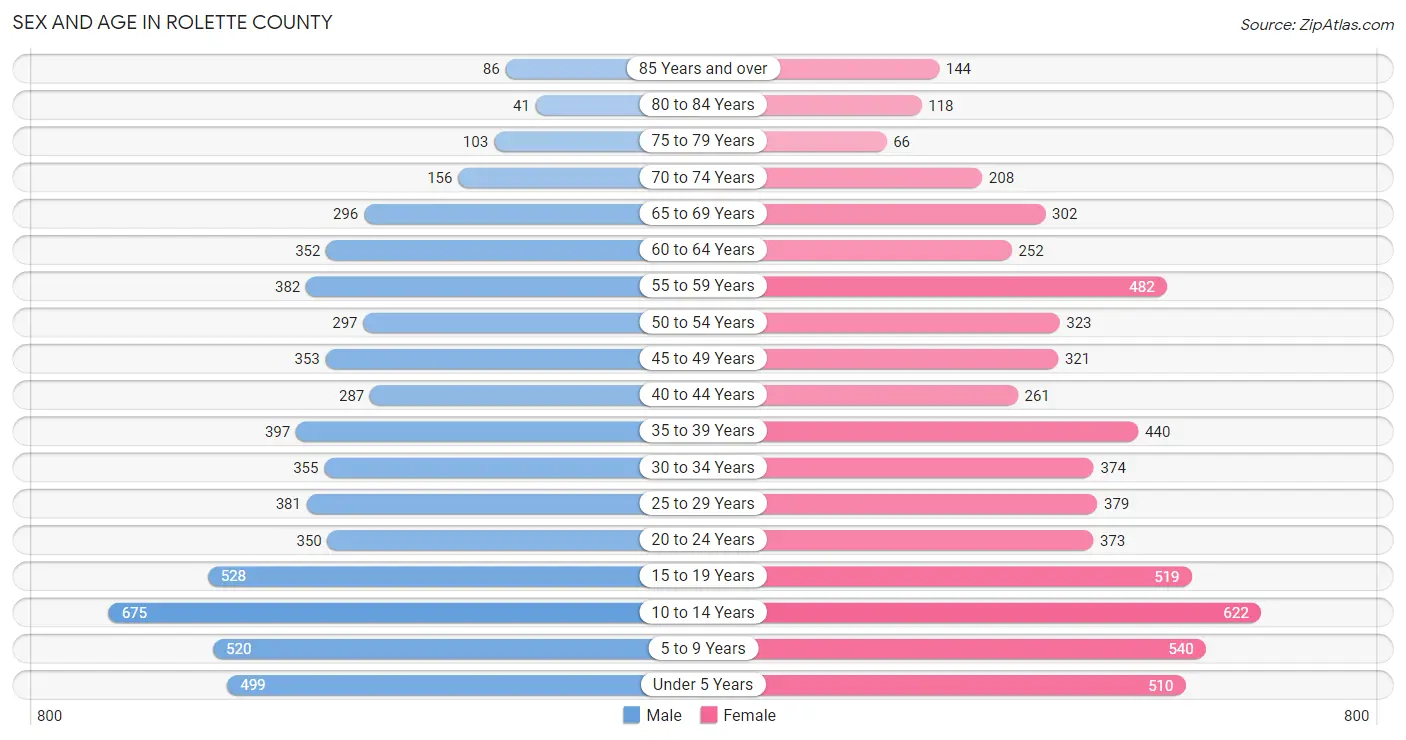
Sex and Age in Rolette County
Sex and Age in Rolette County
The most populous age groups in Rolette County are 10 to 14 Years (675 | 11.1%) for men and 10 to 14 Years (622 | 10.0%) for women.
| Age Bracket | Male | Female |
| Under 5 Years | 499 (8.2%) | 510 (8.2%) |
| 5 to 9 Years | 520 (8.6%) | 540 (8.7%) |
| 10 to 14 Years | 675 (11.1%) | 622 (10.0%) |
| 15 to 19 Years | 528 (8.7%) | 519 (8.3%) |
| 20 to 24 Years | 350 (5.8%) | 373 (6.0%) |
| 25 to 29 Years | 381 (6.3%) | 379 (6.1%) |
| 30 to 34 Years | 355 (5.9%) | 374 (6.0%) |
| 35 to 39 Years | 397 (6.6%) | 440 (7.1%) |
| 40 to 44 Years | 287 (4.7%) | 261 (4.2%) |
| 45 to 49 Years | 353 (5.8%) | 321 (5.1%) |
| 50 to 54 Years | 297 (4.9%) | 323 (5.2%) |
| 55 to 59 Years | 382 (6.3%) | 482 (7.7%) |
| 60 to 64 Years | 352 (5.8%) | 252 (4.0%) |
| 65 to 69 Years | 296 (4.9%) | 302 (4.8%) |
| 70 to 74 Years | 156 (2.6%) | 208 (3.3%) |
| 75 to 79 Years | 103 (1.7%) | 66 (1.1%) |
| 80 to 84 Years | 41 (0.7%) | 118 (1.9%) |
| 85 Years and over | 86 (1.4%) | 144 (2.3%) |
| Total | 6,058 (100.0%) | 6,234 (100.0%) |
Families and Households in Rolette County
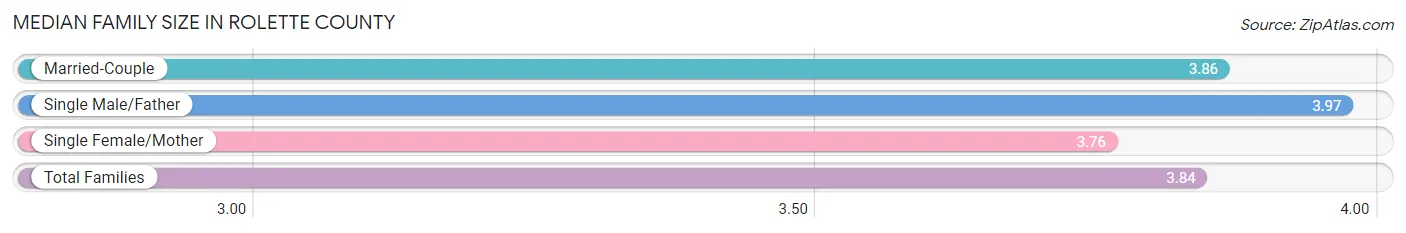
Median Family Size in Rolette County
The median family size in Rolette County is 3.84 persons per family, with single male/father families (276 | 10.3%) accounting for the largest median family size of 3.97 persons per family. On the other hand, single female/mother families (1,020 | 38.3%) represent the smallest median family size with 3.76 persons per family.
| Family Type | # Families | Family Size |
| Married-Couple | 1,370 (51.4%) | 3.86 |
| Single Male/Father | 276 (10.3%) | 3.97 |
| Single Female/Mother | 1,020 (38.3%) | 3.76 |
| Total Families | 2,666 (100.0%) | 3.84 |
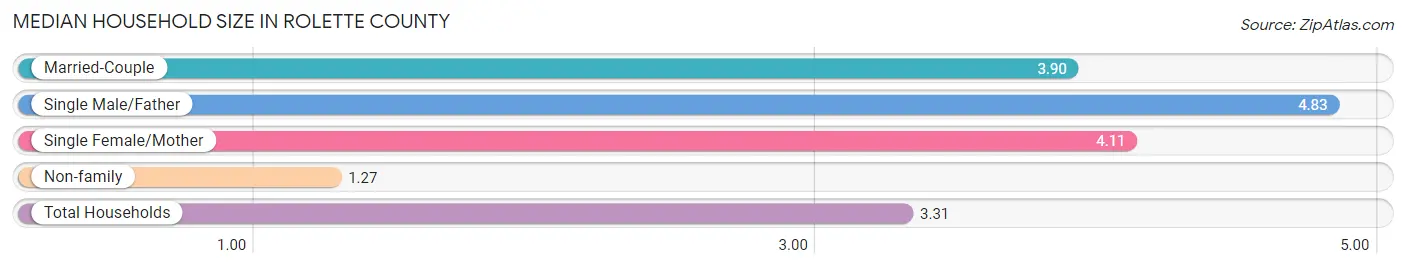
Median Household Size in Rolette County
The median household size in Rolette County is 3.31 persons per household, with single male/father households (276 | 7.5%) accounting for the largest median household size of 4.83 persons per household. non-family households (1,002 | 27.3%) represent the smallest median household size with 1.27 persons per household.
| Household Type | # Households | Household Size |
| Married-Couple | 1,370 (37.3%) | 3.90 |
| Single Male/Father | 276 (7.5%) | 4.83 |
| Single Female/Mother | 1,020 (27.8%) | 4.11 |
| Non-family | 1,002 (27.3%) | 1.27 |
| Total Households | 3,668 (100.0%) | 3.31 |
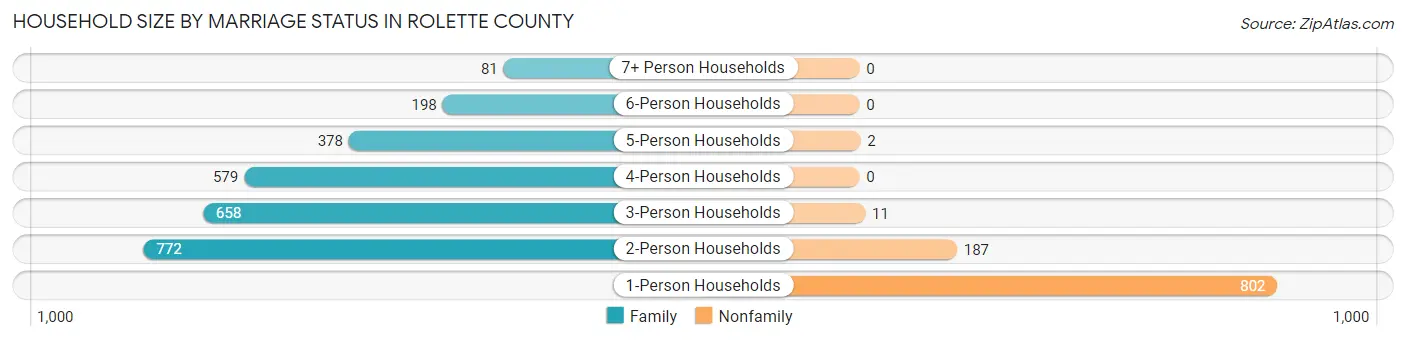
Household Size by Marriage Status in Rolette County
Out of a total of 3,668 households in Rolette County, 2,666 (72.7%) are family households, while 1,002 (27.3%) are nonfamily households. The most numerous type of family households are 2-person households, comprising 772, and the most common type of nonfamily households are 1-person households, comprising 802.
| Household Size | Family Households | Nonfamily Households |
| 1-Person Households | - | 802 (21.9%) |
| 2-Person Households | 772 (21.0%) | 187 (5.1%) |
| 3-Person Households | 658 (17.9%) | 11 (0.3%) |
| 4-Person Households | 579 (15.8%) | 0 (0.0%) |
| 5-Person Households | 378 (10.3%) | 2 (0.1%) |
| 6-Person Households | 198 (5.4%) | 0 (0.0%) |
| 7+ Person Households | 81 (2.2%) | 0 (0.0%) |
| Total | 2,666 (72.7%) | 1,002 (27.3%) |
Female Fertility in Rolette County
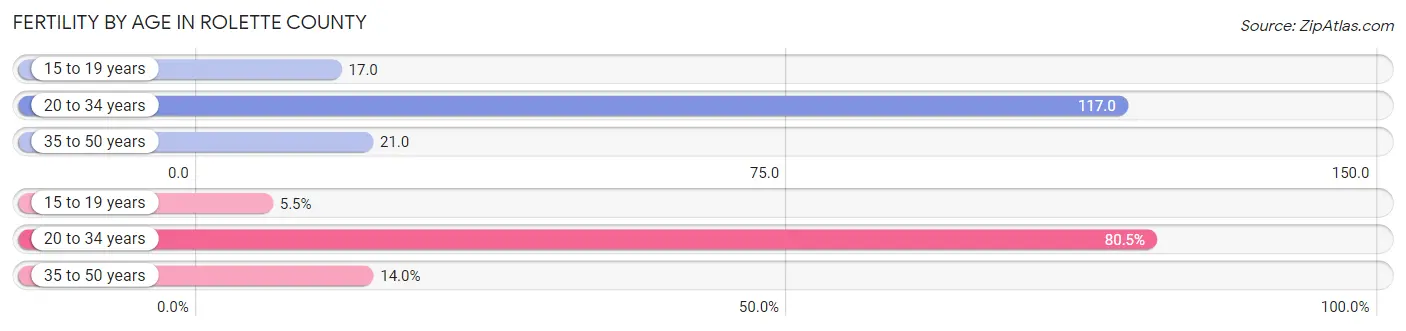
Fertility by Age in Rolette County
Average fertility rate in Rolette County is 60.0 births per 1,000 women. Women in the age bracket of 20 to 34 years have the highest fertility rate with 117.0 births per 1,000 women. Women in the age bracket of 20 to 34 years acount for 80.5% of all women with births.
| Age Bracket | Women with Births | Births / 1,000 Women |
| 15 to 19 years | 9 (5.5%) | 17.0 |
| 20 to 34 years | 132 (80.5%) | 117.0 |
| 35 to 50 years | 23 (14.0%) | 21.0 |
| Total | 164 (100.0%) | 60.0 |
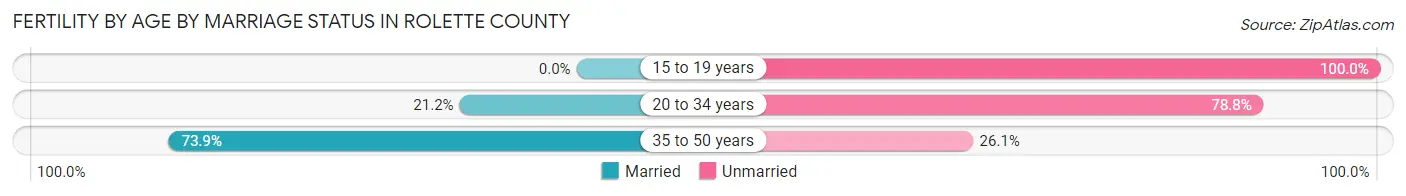
Fertility by Age by Marriage Status in Rolette County
27.4% of women with births (164) in Rolette County are married. The highest percentage of unmarried women with births falls into 15 to 19 years age bracket with 100.0% of them unmarried at the time of birth, while the lowest percentage of unmarried women with births belong to 35 to 50 years age bracket with 26.1% of them unmarried.
| Age Bracket | Married | Unmarried |
| 15 to 19 years | 0 (0.0%) | 9 (100.0%) |
| 20 to 34 years | 28 (21.2%) | 104 (78.8%) |
| 35 to 50 years | 17 (73.9%) | 6 (26.1%) |
| Total | 45 (27.4%) | 119 (72.6%) |
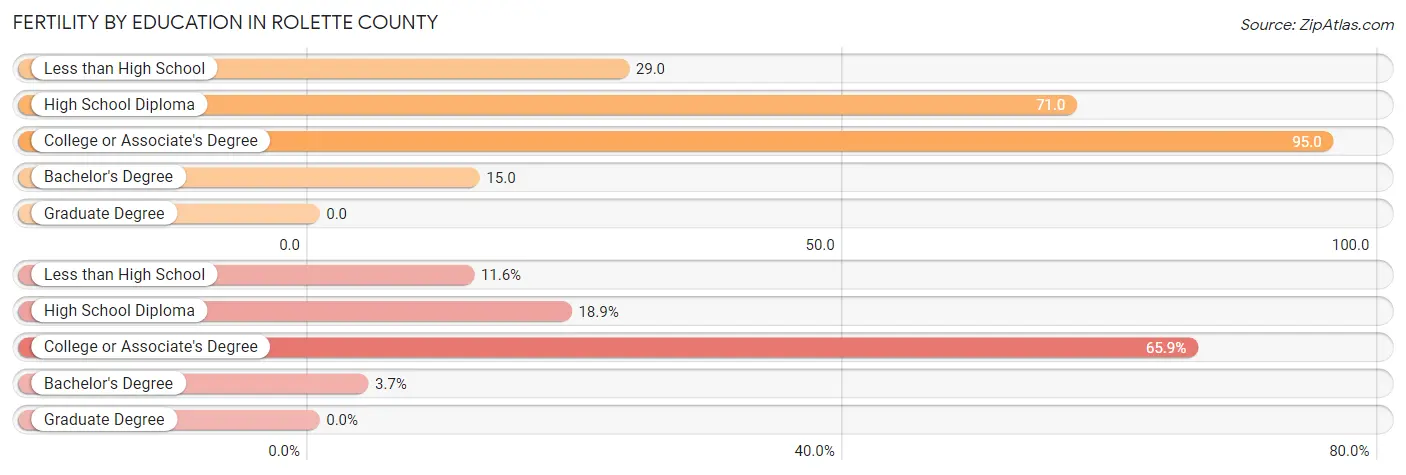
Fertility by Education in Rolette County
| Educational Attainment | Women with Births | Births / 1,000 Women |
| Less than High School | 19 (11.6%) | 29.0 |
| High School Diploma | 31 (18.9%) | 71.0 |
| College or Associate's Degree | 108 (65.8%) | 95.0 |
| Bachelor's Degree | 6 (3.7%) | 15.0 |
| Graduate Degree | 0 (0.0%) | 0.0 |
| Total | 164 (100.0%) | 60.0 |
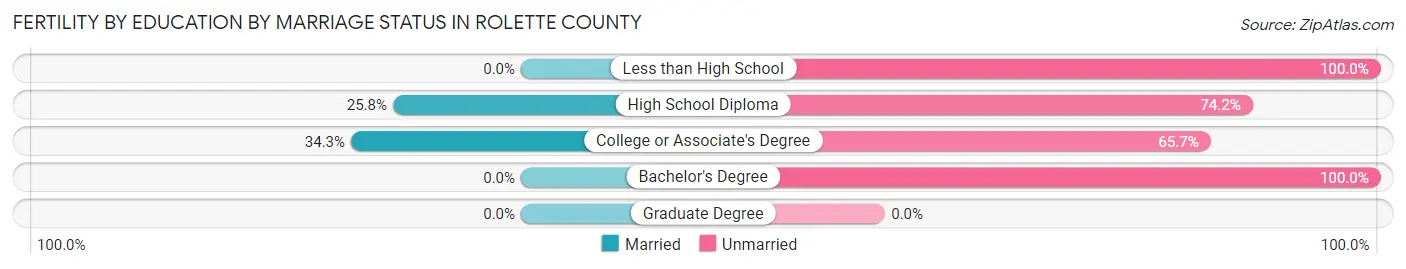
Fertility by Education by Marriage Status in Rolette County
72.6% of women with births in Rolette County are unmarried. Women with the educational attainment of college or associate's degree are most likely to be married with 34.3% of them married at childbirth, while women with the educational attainment of less than high school are least likely to be married with 100.0% of them unmarried at childbirth.
| Educational Attainment | Married | Unmarried |
| Less than High School | 0 (0.0%) | 19 (100.0%) |
| High School Diploma | 8 (25.8%) | 23 (74.2%) |
| College or Associate's Degree | 37 (34.3%) | 71 (65.7%) |
| Bachelor's Degree | 0 (0.0%) | 6 (100.0%) |
| Graduate Degree | 0 (0.0%) | 0 (0.0%) |
| Total | 45 (27.4%) | 119 (72.6%) |
Income in Rolette County
Income Overview in Rolette County
Per Capita Income in Rolette County is $23,160, while median incomes of families and households are $59,853 and $53,806 respectively.
| Characteristic | Number | Measure |
| Per Capita Income | 12,292 | $23,160 |
| Median Family Income | 2,666 | $59,853 |
| Mean Family Income | 2,666 | $76,631 |
| Median Household Income | 3,668 | $53,806 |
| Mean Household Income | 3,668 | $69,053 |
| Income Deficit | 2,666 | $16,405 |
| Wage / Income Gap (%) | 12,292 | 3.16% |
| Wage / Income Gap ($) | 12,292 | 96.84¢ per $1 |
| Gini / Inequality Index | 12,292 | 0.44 |
Earnings by Sex in Rolette County
Average Earnings in Rolette County are $39,246, $40,237 for men and $38,966 for women, a difference of 3.2%.
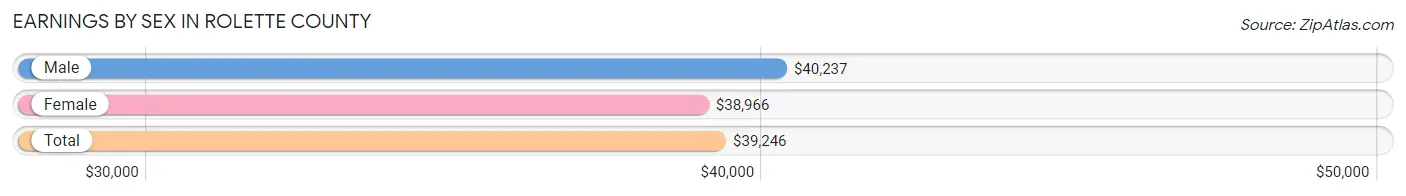
| Sex | Number | Average Earnings |
| Male | 2,367 (46.1%) | $40,237 |
| Female | 2,772 (53.9%) | $38,966 |
| Total | 5,139 (100.0%) | $39,246 |
Earnings by Sex by Income Bracket in Rolette County
The most common earnings brackets in Rolette County are $55,000 to $64,999 for men (256 | 10.8%) and $25,000 to $29,999 for women (309 | 11.2%).
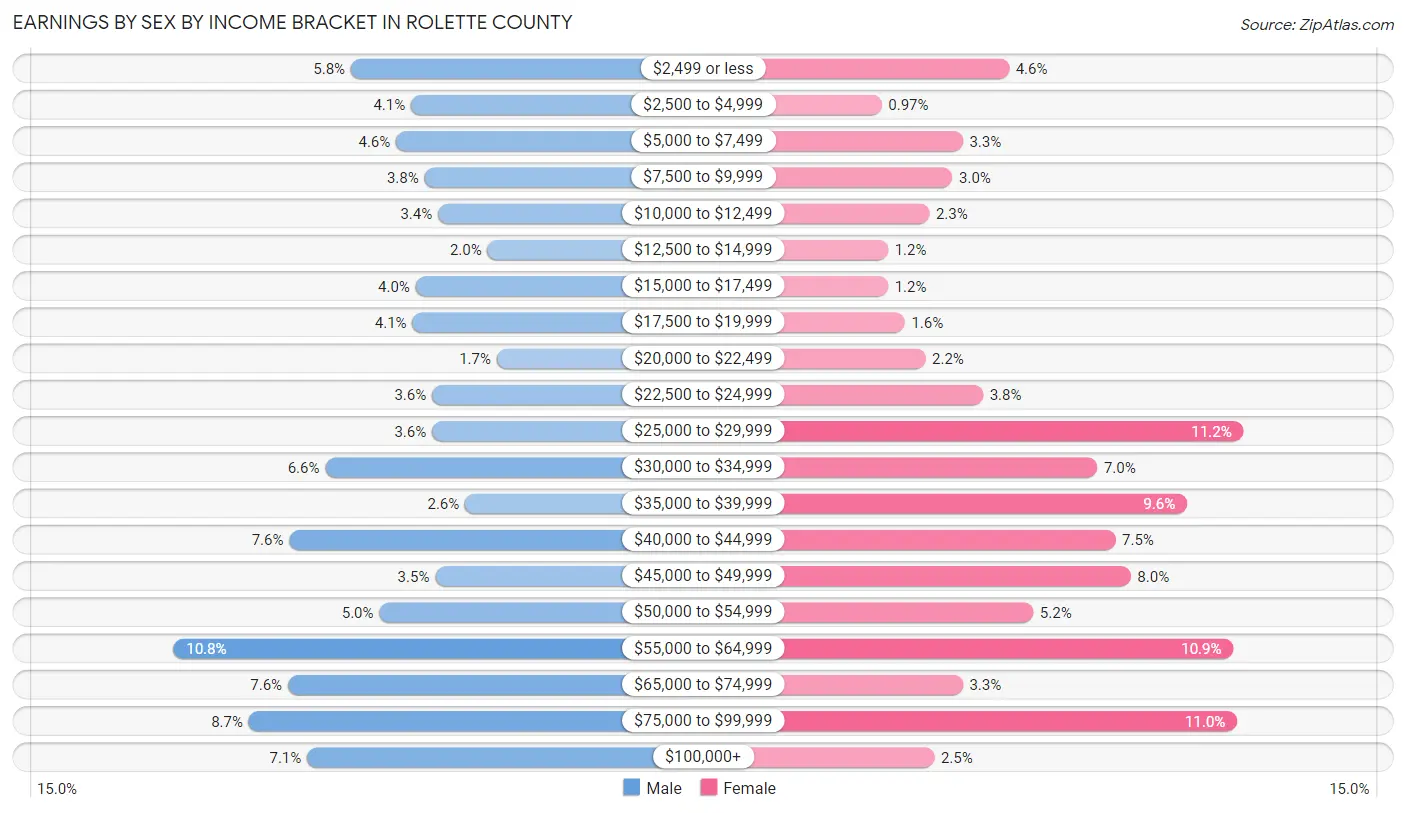
| Income | Male | Female |
| $2,499 or less | 138 (5.8%) | 126 (4.5%) |
| $2,500 to $4,999 | 98 (4.1%) | 27 (1.0%) |
| $5,000 to $7,499 | 108 (4.6%) | 90 (3.3%) |
| $7,500 to $9,999 | 89 (3.8%) | 82 (3.0%) |
| $10,000 to $12,499 | 80 (3.4%) | 64 (2.3%) |
| $12,500 to $14,999 | 47 (2.0%) | 32 (1.1%) |
| $15,000 to $17,499 | 95 (4.0%) | 32 (1.1%) |
| $17,500 to $19,999 | 97 (4.1%) | 45 (1.6%) |
| $20,000 to $22,499 | 41 (1.7%) | 61 (2.2%) |
| $22,500 to $24,999 | 84 (3.5%) | 106 (3.8%) |
| $25,000 to $29,999 | 84 (3.5%) | 309 (11.2%) |
| $30,000 to $34,999 | 155 (6.6%) | 195 (7.0%) |
| $35,000 to $39,999 | 62 (2.6%) | 265 (9.6%) |
| $40,000 to $44,999 | 179 (7.6%) | 209 (7.5%) |
| $45,000 to $49,999 | 82 (3.5%) | 221 (8.0%) |
| $50,000 to $54,999 | 119 (5.0%) | 145 (5.2%) |
| $55,000 to $64,999 | 256 (10.8%) | 301 (10.9%) |
| $65,000 to $74,999 | 180 (7.6%) | 90 (3.3%) |
| $75,000 to $99,999 | 206 (8.7%) | 304 (11.0%) |
| $100,000+ | 167 (7.1%) | 68 (2.5%) |
| Total | 2,367 (100.0%) | 2,772 (100.0%) |
Earnings by Sex by Educational Attainment in Rolette County
Average earnings in Rolette County are $44,590 for men and $42,086 for women, a difference of 5.6%. Men with an educational attainment of graduate degree enjoy the highest average annual earnings of $64,853, while those with less than high school education earn the least with $18,856. Women with an educational attainment of graduate degree earn the most with the average annual earnings of $58,500, while those with less than high school education have the smallest earnings of $13,281.
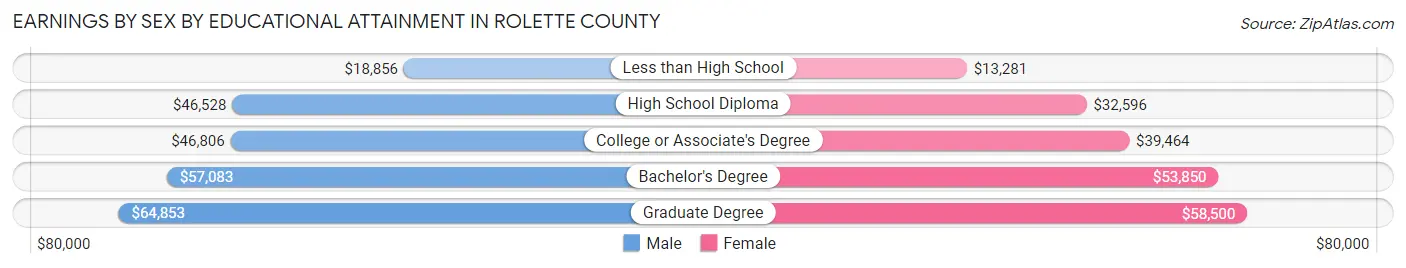
| Educational Attainment | Male Income | Female Income |
| Less than High School | $18,856 | $13,281 |
| High School Diploma | $46,528 | $32,596 |
| College or Associate's Degree | $46,806 | $39,464 |
| Bachelor's Degree | $57,083 | $53,850 |
| Graduate Degree | $64,853 | $58,500 |
| Total | $44,590 | $42,086 |
Family Income in Rolette County
Family Income Brackets in Rolette County
According to the Rolette County family income data, there are 461 families falling into the $35,000 to $49,999 income range, which is the most common income bracket and makes up 17.3% of all families. Conversely, the $200,000+ income bracket is the least frequent group with only 88 families (3.3%) belonging to this category.
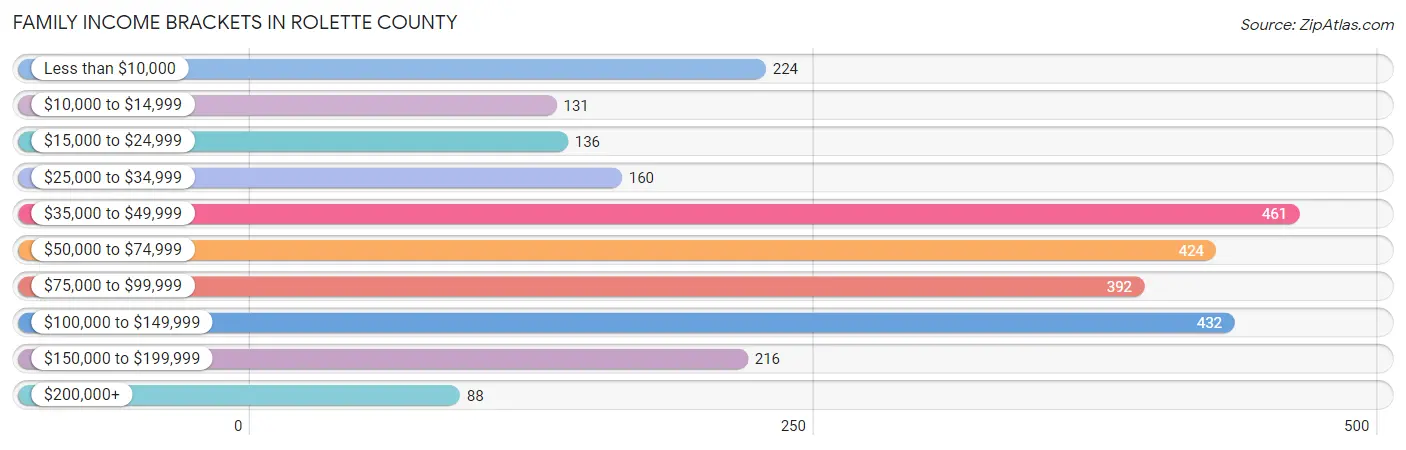
| Income Bracket | # Families | % Families |
| Less than $10,000 | 224 | 8.4% |
| $10,000 to $14,999 | 131 | 4.9% |
| $15,000 to $24,999 | 136 | 5.1% |
| $25,000 to $34,999 | 160 | 6.0% |
| $35,000 to $49,999 | 461 | 17.3% |
| $50,000 to $74,999 | 424 | 15.9% |
| $75,000 to $99,999 | 392 | 14.7% |
| $100,000 to $149,999 | 432 | 16.2% |
| $150,000 to $199,999 | 216 | 8.1% |
| $200,000+ | 88 | 3.3% |
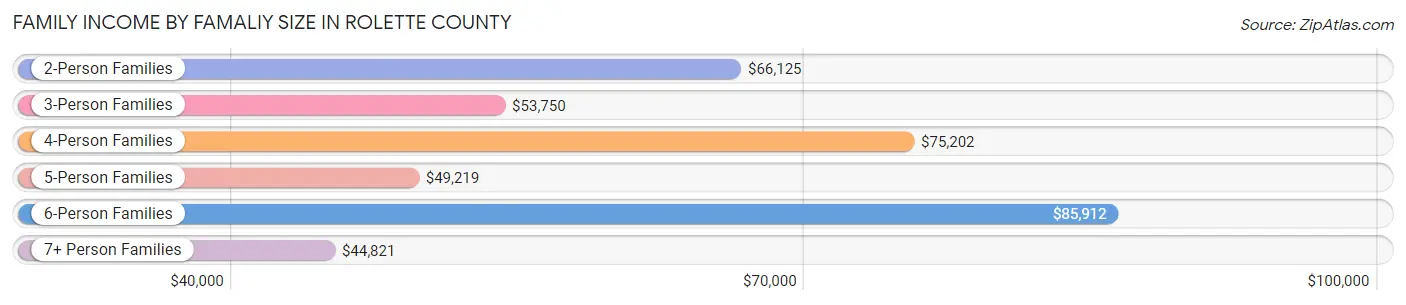
Family Income by Famaliy Size in Rolette County
6-person families (127 | 4.8%) account for the highest median family income in Rolette County with $85,912 per family, while 2-person families (966 | 36.2%) have the highest median income of $33,062 per family member.
| Income Bracket | # Families | Median Income |
| 2-Person Families | 966 (36.2%) | $66,125 |
| 3-Person Families | 681 (25.5%) | $53,750 |
| 4-Person Families | 513 (19.2%) | $75,202 |
| 5-Person Families | 312 (11.7%) | $49,219 |
| 6-Person Families | 127 (4.8%) | $85,912 |
| 7+ Person Families | 67 (2.5%) | $44,821 |
| Total | 2,666 (100.0%) | $59,853 |
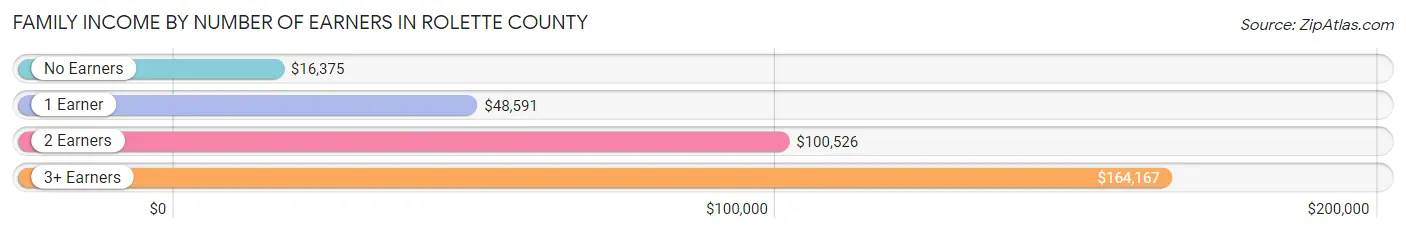
Family Income by Number of Earners in Rolette County
The median family income in Rolette County is $59,853, with families comprising 3+ earners (174) having the highest median family income of $164,167, while families with no earners (391) have the lowest median family income of $16,375, accounting for 6.5% and 14.7% of families, respectively.
| Number of Earners | # Families | Median Income |
| No Earners | 391 (14.7%) | $16,375 |
| 1 Earner | 1,125 (42.2%) | $48,591 |
| 2 Earners | 976 (36.6%) | $100,526 |
| 3+ Earners | 174 (6.5%) | $164,167 |
| Total | 2,666 (100.0%) | $59,853 |
Household Income in Rolette County
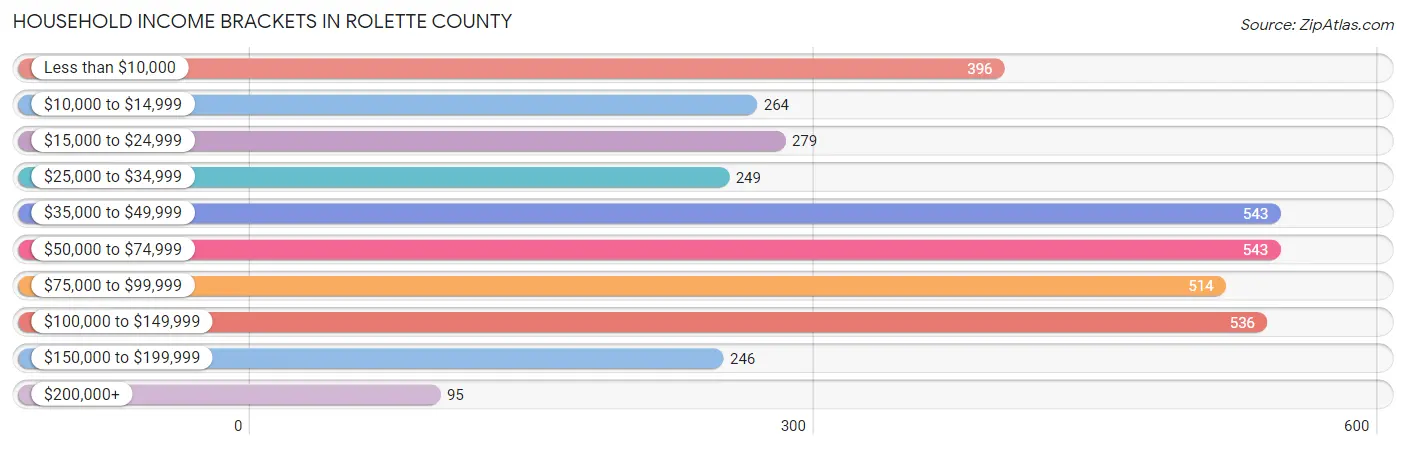
Household Income Brackets in Rolette County
With 543 households falling in the category, the $35,000 to $49,999 income range is the most frequent in Rolette County, accounting for 14.8% of all households. In contrast, only 95 households (2.6%) fall into the $200,000+ income bracket, making it the least populous group.
| Income Bracket | # Households | % Households |
| Less than $10,000 | 396 | 10.8% |
| $10,000 to $14,999 | 264 | 7.2% |
| $15,000 to $24,999 | 279 | 7.6% |
| $25,000 to $34,999 | 249 | 6.8% |
| $35,000 to $49,999 | 543 | 14.8% |
| $50,000 to $74,999 | 543 | 14.8% |
| $75,000 to $99,999 | 514 | 14.0% |
| $100,000 to $149,999 | 536 | 14.6% |
| $150,000 to $199,999 | 246 | 6.7% |
| $200,000+ | 95 | 2.6% |
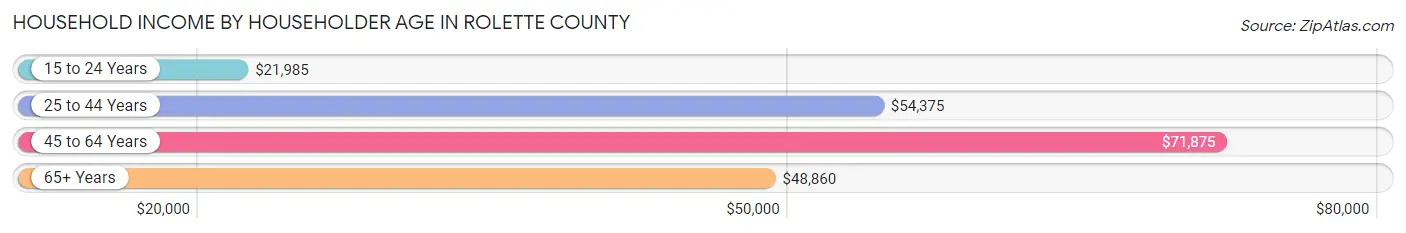
Household Income by Householder Age in Rolette County
The median household income in Rolette County is $53,806, with the highest median household income of $71,875 found in the 45 to 64 years age bracket for the primary householder. A total of 1,470 households (40.1%) fall into this category. Meanwhile, the 15 to 24 years age bracket for the primary householder has the lowest median household income of $21,985, with 105 households (2.9%) in this group.
| Income Bracket | # Households | Median Income |
| 15 to 24 Years | 105 (2.9%) | $21,985 |
| 25 to 44 Years | 1,150 (31.4%) | $54,375 |
| 45 to 64 Years | 1,470 (40.1%) | $71,875 |
| 65+ Years | 943 (25.7%) | $48,860 |
| Total | 3,668 (100.0%) | $53,806 |
Poverty in Rolette County
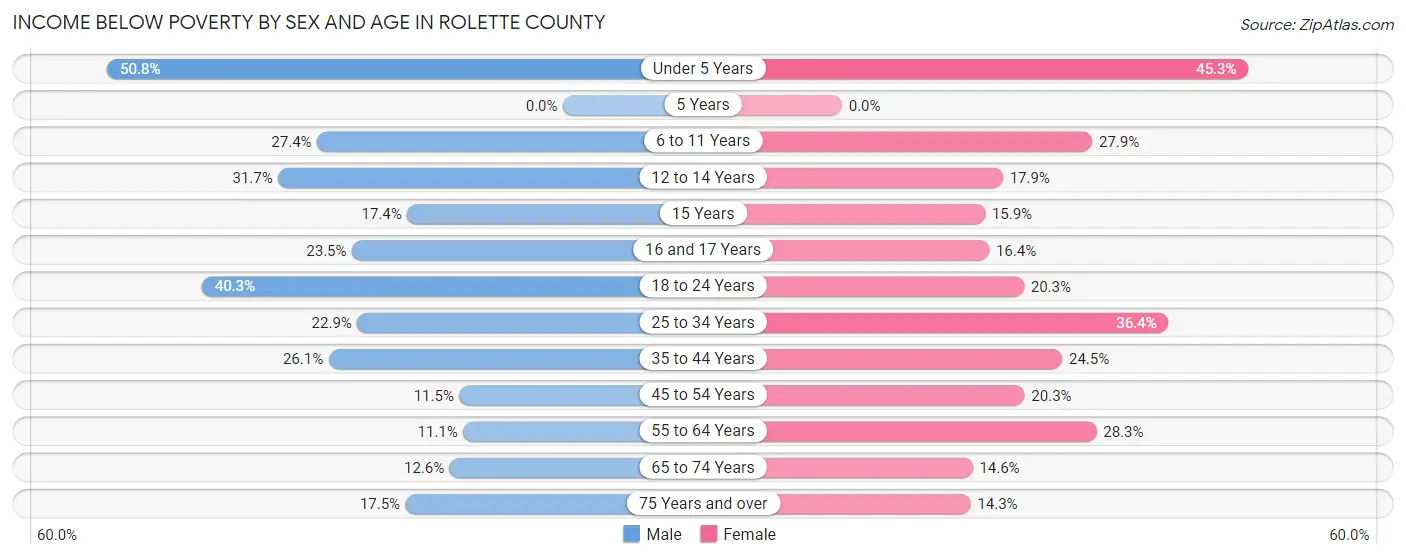
Income Below Poverty by Sex and Age in Rolette County
With 24.3% poverty level for males and 25.4% for females among the residents of Rolette County, under 5 year old males and under 5 year old females are the most vulnerable to poverty, with 251 males (50.8%) and 206 females (45.3%) in their respective age groups living below the poverty level.
| Age Bracket | Male | Female |
| Under 5 Years | 251 (50.8%) | 206 (45.3%) |
| 5 Years | 0 (0.0%) | 0 (0.0%) |
| 6 to 11 Years | 189 (27.4%) | 216 (27.9%) |
| 12 to 14 Years | 105 (31.7%) | 57 (17.9%) |
| 15 Years | 17 (17.3%) | 11 (15.9%) |
| 16 and 17 Years | 55 (23.5%) | 50 (16.4%) |
| 18 to 24 Years | 217 (40.3%) | 105 (20.3%) |
| 25 to 34 Years | 167 (22.9%) | 274 (36.4%) |
| 35 to 44 Years | 178 (26.1%) | 170 (24.5%) |
| 45 to 54 Years | 75 (11.5%) | 131 (20.3%) |
| 55 to 64 Years | 81 (11.1%) | 208 (28.3%) |
| 65 to 74 Years | 57 (12.6%) | 72 (14.5%) |
| 75 Years and over | 34 (17.5%) | 43 (14.3%) |
| Total | 1,426 (24.3%) | 1,543 (25.4%) |
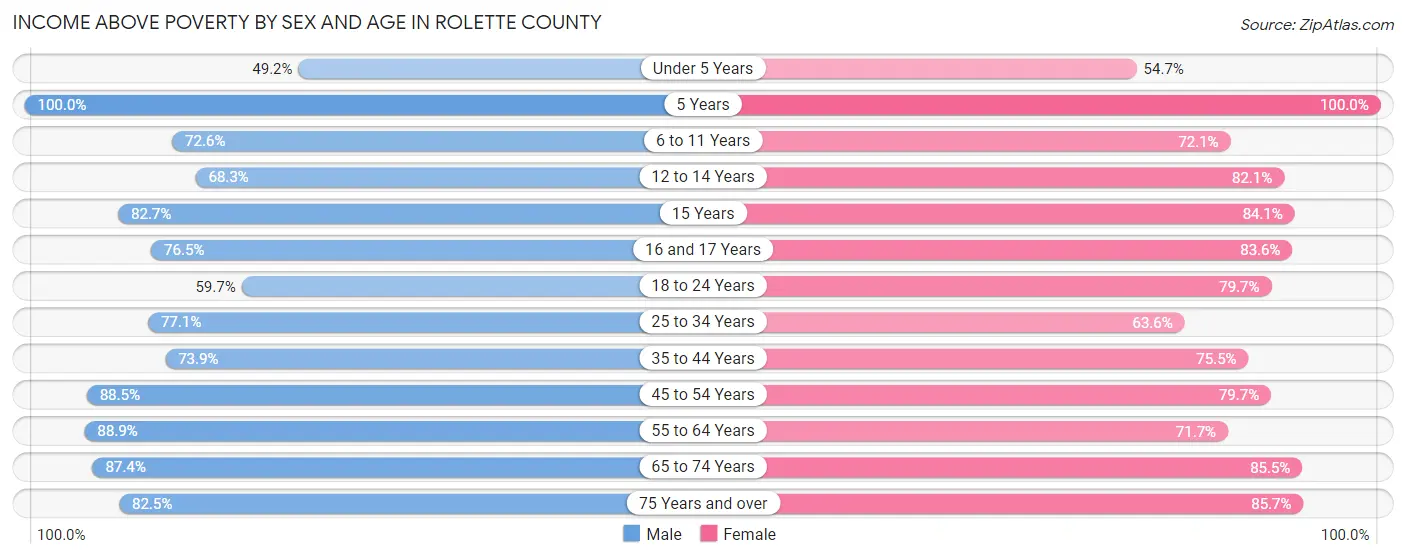
Income Above Poverty by Sex and Age in Rolette County
According to the poverty statistics in Rolette County, males aged 5 years and females aged 5 years are the age groups that are most secure financially, with 100.0% of males and 100.0% of females in these age groups living above the poverty line.
| Age Bracket | Male | Female |
| Under 5 Years | 243 (49.2%) | 249 (54.7%) |
| 5 Years | 39 (100.0%) | 27 (100.0%) |
| 6 to 11 Years | 501 (72.6%) | 559 (72.1%) |
| 12 to 14 Years | 226 (68.3%) | 261 (82.1%) |
| 15 Years | 81 (82.7%) | 58 (84.1%) |
| 16 and 17 Years | 179 (76.5%) | 255 (83.6%) |
| 18 to 24 Years | 322 (59.7%) | 413 (79.7%) |
| 25 to 34 Years | 562 (77.1%) | 479 (63.6%) |
| 35 to 44 Years | 504 (73.9%) | 523 (75.5%) |
| 45 to 54 Years | 575 (88.5%) | 513 (79.7%) |
| 55 to 64 Years | 648 (88.9%) | 526 (71.7%) |
| 65 to 74 Years | 395 (87.4%) | 423 (85.5%) |
| 75 Years and over | 160 (82.5%) | 257 (85.7%) |
| Total | 4,435 (75.7%) | 4,543 (74.7%) |
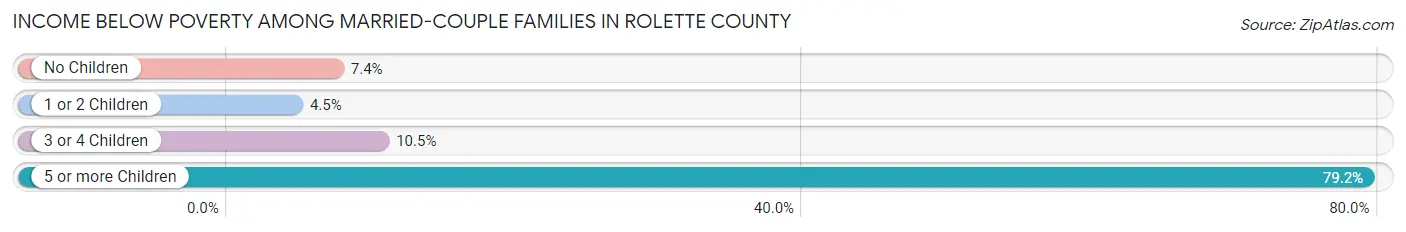
Income Below Poverty Among Married-Couple Families in Rolette County
The poverty statistics for married-couple families in Rolette County show that 8.1% or 111 of the total 1,370 families live below the poverty line. Families with 5 or more children have the highest poverty rate of 79.2%, comprising of 19 families. On the other hand, families with 1 or 2 children have the lowest poverty rate of 4.5%, which includes 20 families.
| Children | Above Poverty | Below Poverty |
| No Children | 679 (92.6%) | 54 (7.4%) |
| 1 or 2 Children | 422 (95.5%) | 20 (4.5%) |
| 3 or 4 Children | 153 (89.5%) | 18 (10.5%) |
| 5 or more Children | 5 (20.8%) | 19 (79.2%) |
| Total | 1,259 (91.9%) | 111 (8.1%) |
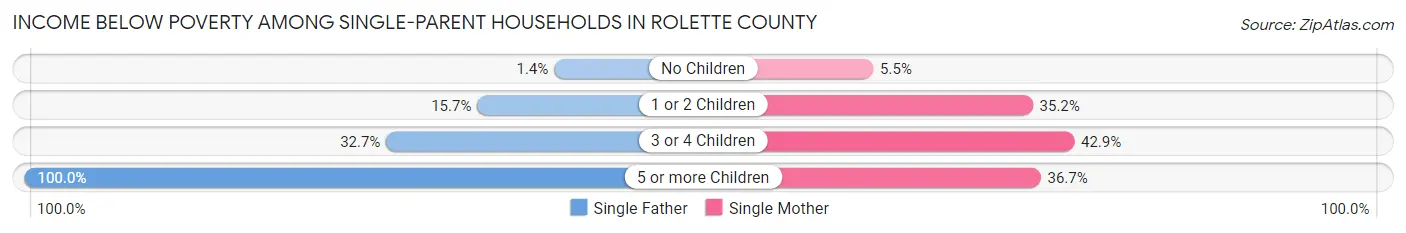
Income Below Poverty Among Single-Parent Households in Rolette County
According to the poverty data in Rolette County, 15.2% or 42 single-father households and 32.0% or 326 single-mother households are living below the poverty line. Among single-father households, those with 5 or more children have the highest poverty rate, with 1 households (100.0%) experiencing poverty. Likewise, among single-mother households, those with 3 or 4 children have the highest poverty rate, with 115 households (42.9%) falling below the poverty line.
| Children | Single Father | Single Mother |
| No Children | 1 (1.4%) | 10 (5.5%) |
| 1 or 2 Children | 24 (15.7%) | 190 (35.2%) |
| 3 or 4 Children | 16 (32.7%) | 115 (42.9%) |
| 5 or more Children | 1 (100.0%) | 11 (36.7%) |
| Total | 42 (15.2%) | 326 (32.0%) |
Income Below Poverty Among Married-Couple vs Single-Parent Households in Rolette County
The poverty data for Rolette County shows that 111 of the married-couple family households (8.1%) and 368 of the single-parent households (28.4%) are living below the poverty level. Within the married-couple family households, those with 5 or more children have the highest poverty rate, with 19 households (79.2%) falling below the poverty line. Among the single-parent households, those with 3 or 4 children have the highest poverty rate, with 131 household (41.3%) living below poverty.
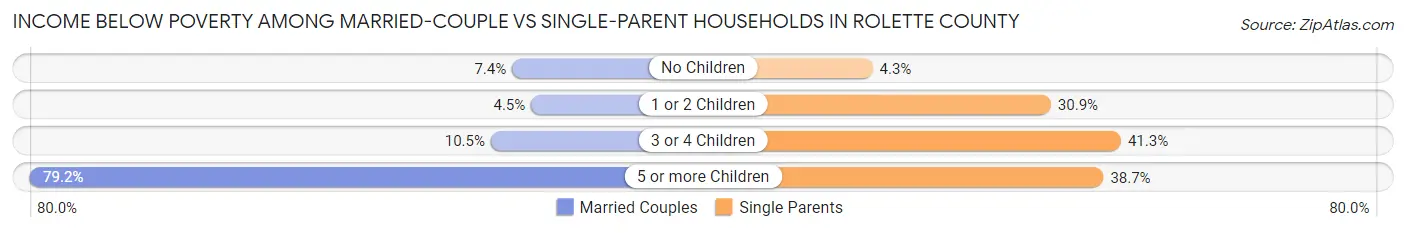
| Children | Married-Couple Families | Single-Parent Households |
| No Children | 54 (7.4%) | 11 (4.3%) |
| 1 or 2 Children | 20 (4.5%) | 214 (30.9%) |
| 3 or 4 Children | 18 (10.5%) | 131 (41.3%) |
| 5 or more Children | 19 (79.2%) | 12 (38.7%) |
| Total | 111 (8.1%) | 368 (28.4%) |
Employment Characteristics in Rolette County
Employment by Class of Employer in Rolette County
Among the 4,429 employed individuals in Rolette County, private company employees (1,722 | 38.9%), federal government employees (815 | 18.4%), and local government employees (751 | 17.0%) make up the most common classes of employment.
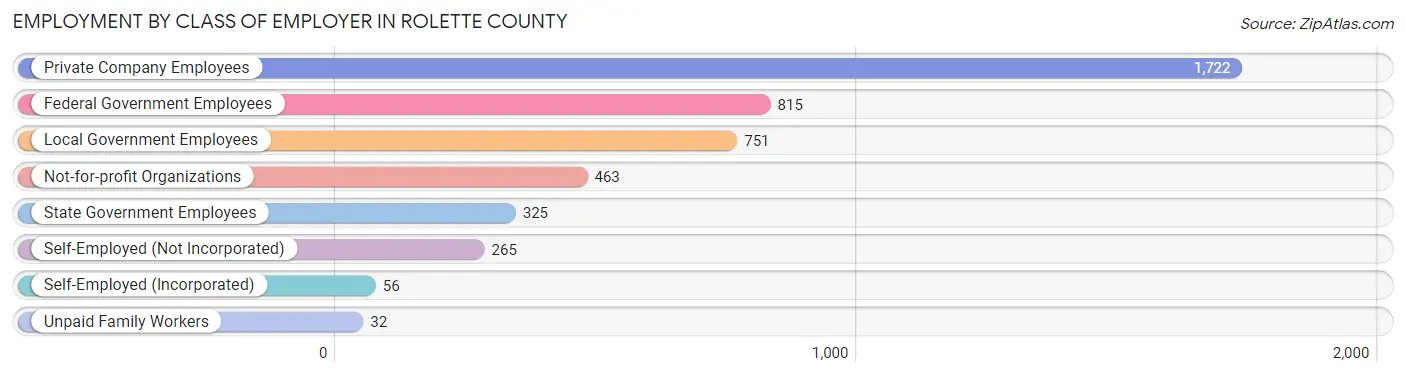
| Employer Class | # Employees | % Employees |
| Private Company Employees | 1,722 | 38.9% |
| Self-Employed (Incorporated) | 56 | 1.3% |
| Self-Employed (Not Incorporated) | 265 | 6.0% |
| Not-for-profit Organizations | 463 | 10.4% |
| Local Government Employees | 751 | 17.0% |
| State Government Employees | 325 | 7.3% |
| Federal Government Employees | 815 | 18.4% |
| Unpaid Family Workers | 32 | 0.7% |
| Total | 4,429 | 100.0% |
Employment Status by Age in Rolette County
According to the labor force statistics for Rolette County, out of the total population over 16 years of age (8,759), 54.9% or 4,809 individuals are in the labor force, with 6.4% or 308 of them unemployed. The age group with the highest labor force participation rate is 45 to 54 years, with 73.4% or 950 individuals in the labor force. Within the labor force, the 16 to 19 years age range has the highest percentage of unemployed individuals, with 24.8% or 55 of them being unemployed.
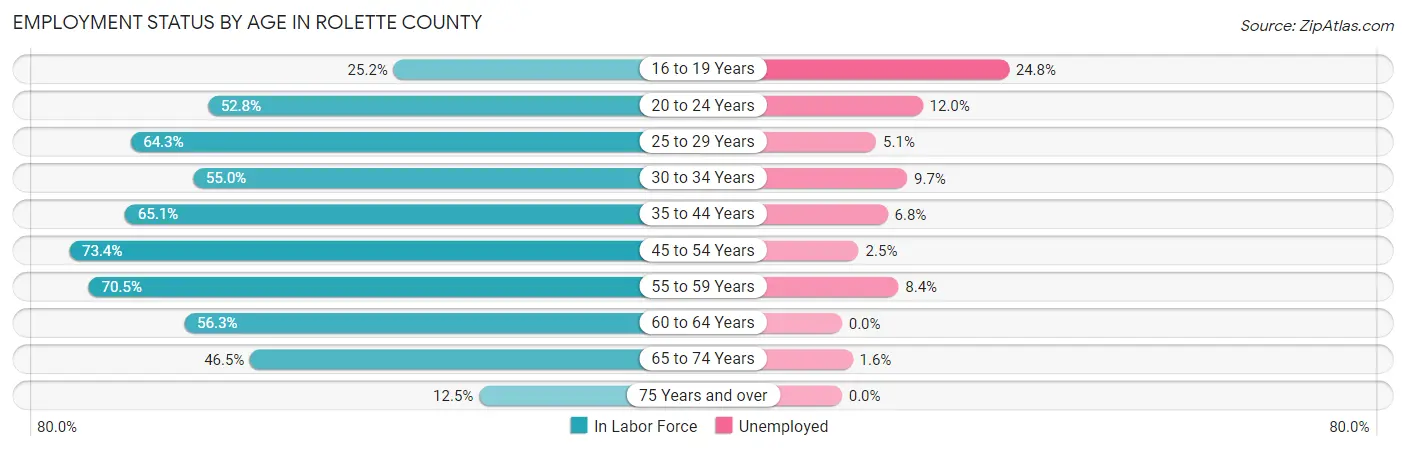
| Age Bracket | In Labor Force | Unemployed |
| 16 to 19 Years | 222 (25.2%) | 55 (24.8%) |
| 20 to 24 Years | 382 (52.8%) | 46 (12.0%) |
| 25 to 29 Years | 489 (64.3%) | 25 (5.1%) |
| 30 to 34 Years | 401 (55.0%) | 39 (9.7%) |
| 35 to 44 Years | 902 (65.1%) | 61 (6.8%) |
| 45 to 54 Years | 950 (73.4%) | 24 (2.5%) |
| 55 to 59 Years | 609 (70.5%) | 51 (8.4%) |
| 60 to 64 Years | 340 (56.3%) | 0 (0.0%) |
| 65 to 74 Years | 447 (46.5%) | 7 (1.6%) |
| 75 Years and over | 70 (12.5%) | 0 (0.0%) |
| Total | 4,809 (54.9%) | 308 (6.4%) |
Employment Status by Educational Attainment in Rolette County
According to labor force statistics for Rolette County, 65.5% of individuals (3,692) out of the total population between 25 and 64 years of age (5,636) are in the labor force, with 5.4% or 199 of them being unemployed. The group with the highest labor force participation rate are those with the educational attainment of bachelor's degree or higher, with 83.9% or 751 individuals in the labor force. Within the labor force, individuals with less than high school education have the highest percentage of unemployment, with 18.7% or 54 of them being unemployed.
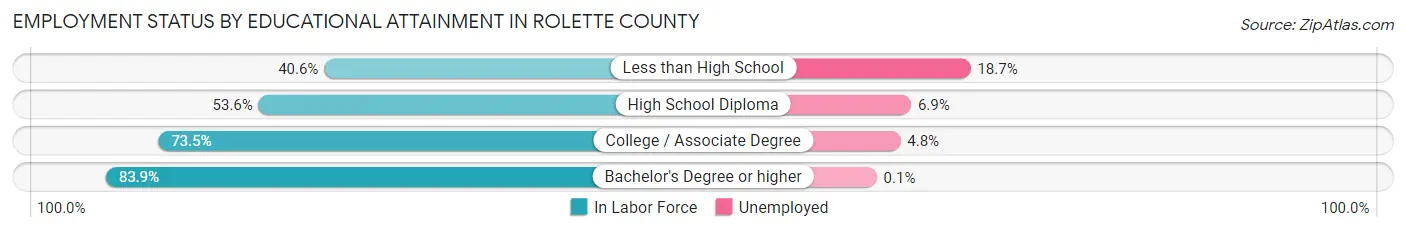
| Educational Attainment | In Labor Force | Unemployed |
| Less than High School | 289 (40.6%) | 133 (18.7%) |
| High School Diploma | 836 (53.6%) | 108 (6.9%) |
| College / Associate Degree | 1,815 (73.5%) | 119 (4.8%) |
| Bachelor's Degree or higher | 751 (83.9%) | 1 (0.1%) |
| Total | 3,692 (65.5%) | 304 (5.4%) |
Employment Occupations by Sex in Rolette County
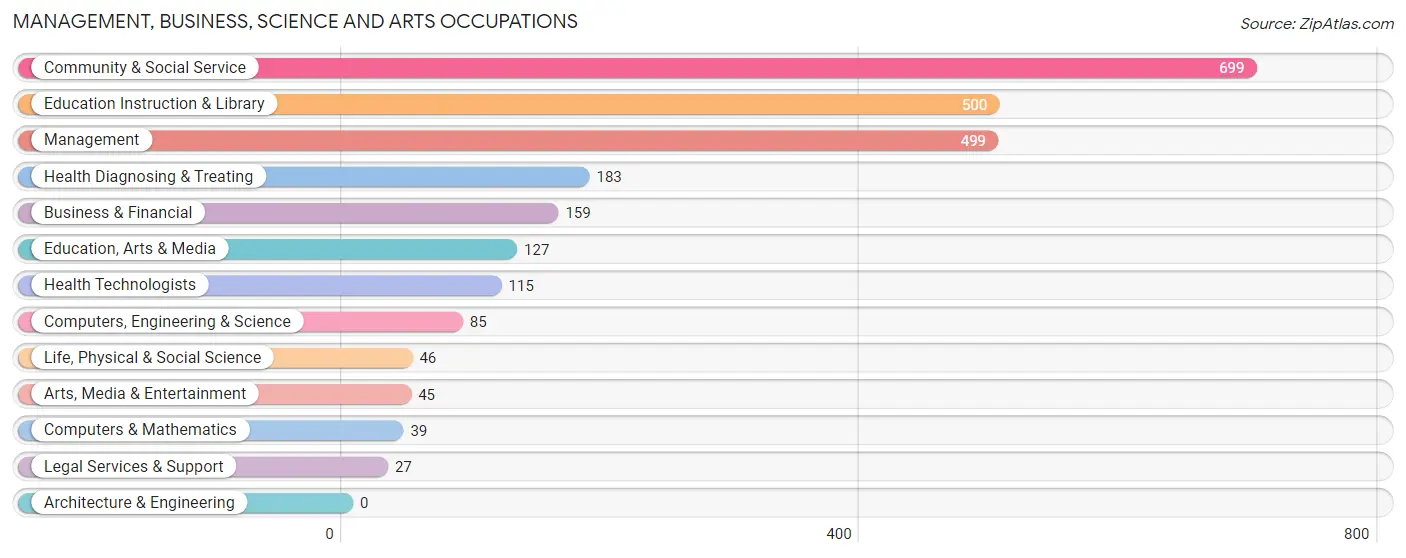
Management, Business, Science and Arts Occupations
The most common Management, Business, Science and Arts occupations in Rolette County are Community & Social Service (699 | 15.5%), Education Instruction & Library (500 | 11.1%), Management (499 | 11.1%), Health Diagnosing & Treating (183 | 4.1%), and Business & Financial (159 | 3.5%).
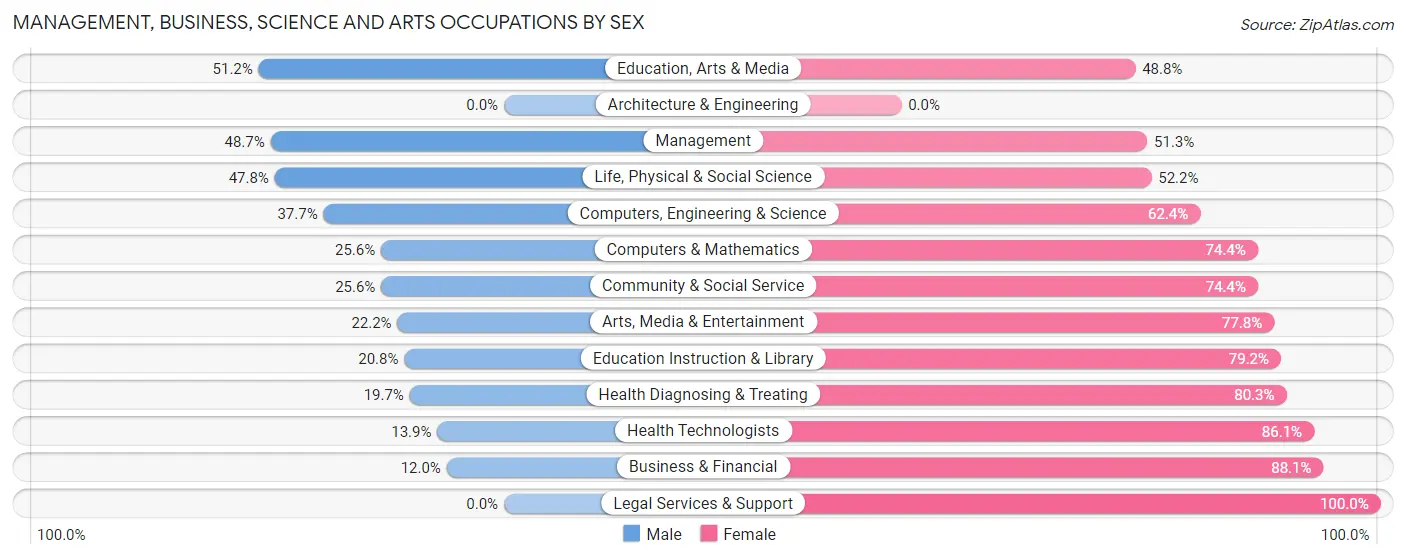
Management, Business, Science and Arts Occupations by Sex
Within the Management, Business, Science and Arts occupations in Rolette County, the most male-oriented occupations are Education, Arts & Media (51.2%), Management (48.7%), and Life, Physical & Social Science (47.8%), while the most female-oriented occupations are Legal Services & Support (100.0%), Business & Financial (88.0%), and Health Technologists (86.1%).
| Occupation | Male | Female |
| Management | 243 (48.7%) | 256 (51.3%) |
| Business & Financial | 19 (11.9%) | 140 (88.0%) |
| Computers, Engineering & Science | 32 (37.7%) | 53 (62.4%) |
| Computers & Mathematics | 10 (25.6%) | 29 (74.4%) |
| Architecture & Engineering | 0 (0.0%) | 0 (0.0%) |
| Life, Physical & Social Science | 22 (47.8%) | 24 (52.2%) |
| Community & Social Service | 179 (25.6%) | 520 (74.4%) |
| Education, Arts & Media | 65 (51.2%) | 62 (48.8%) |
| Legal Services & Support | 0 (0.0%) | 27 (100.0%) |
| Education Instruction & Library | 104 (20.8%) | 396 (79.2%) |
| Arts, Media & Entertainment | 10 (22.2%) | 35 (77.8%) |
| Health Diagnosing & Treating | 36 (19.7%) | 147 (80.3%) |
| Health Technologists | 16 (13.9%) | 99 (86.1%) |
| Total (Category) | 509 (31.3%) | 1,116 (68.7%) |
| Total (Overall) | 1,979 (43.9%) | 2,525 (56.1%) |
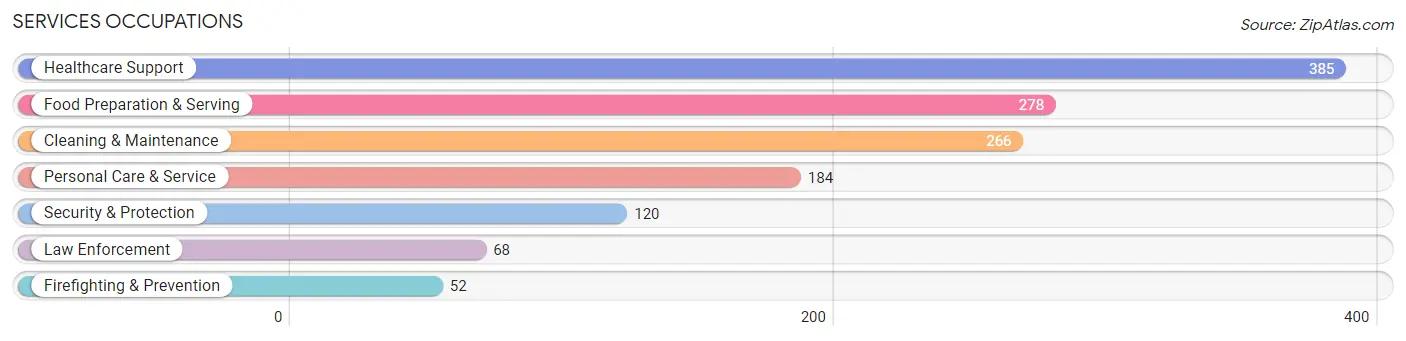
Services Occupations
The most common Services occupations in Rolette County are Healthcare Support (385 | 8.6%), Food Preparation & Serving (278 | 6.2%), Cleaning & Maintenance (266 | 5.9%), Personal Care & Service (184 | 4.1%), and Security & Protection (120 | 2.7%).
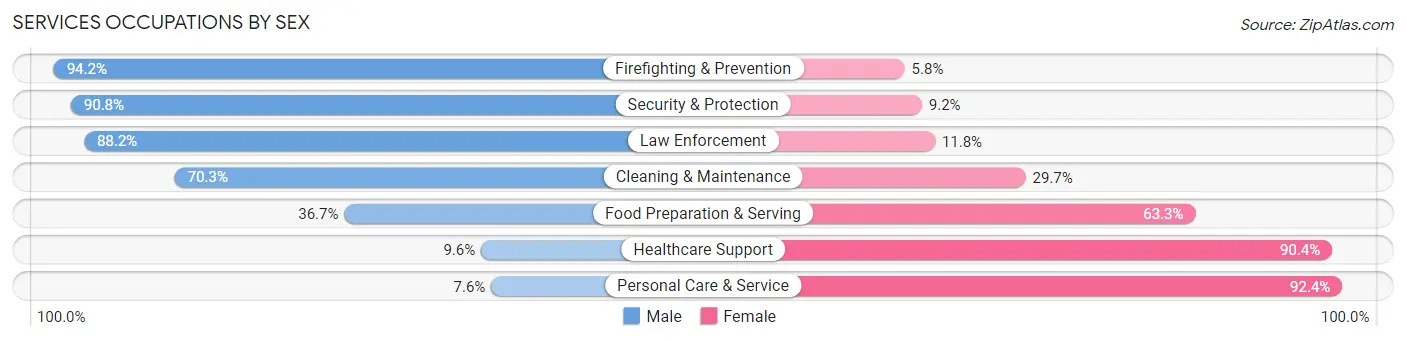
Services Occupations by Sex
Within the Services occupations in Rolette County, the most male-oriented occupations are Firefighting & Prevention (94.2%), Security & Protection (90.8%), and Law Enforcement (88.2%), while the most female-oriented occupations are Personal Care & Service (92.4%), Healthcare Support (90.4%), and Food Preparation & Serving (63.3%).
| Occupation | Male | Female |
| Healthcare Support | 37 (9.6%) | 348 (90.4%) |
| Security & Protection | 109 (90.8%) | 11 (9.2%) |
| Firefighting & Prevention | 49 (94.2%) | 3 (5.8%) |
| Law Enforcement | 60 (88.2%) | 8 (11.8%) |
| Food Preparation & Serving | 102 (36.7%) | 176 (63.3%) |
| Cleaning & Maintenance | 187 (70.3%) | 79 (29.7%) |
| Personal Care & Service | 14 (7.6%) | 170 (92.4%) |
| Total (Category) | 449 (36.4%) | 784 (63.6%) |
| Total (Overall) | 1,979 (43.9%) | 2,525 (56.1%) |
Sales and Office Occupations
The most common Sales and Office occupations in Rolette County are Office & Administration (407 | 9.0%), and Sales & Related (311 | 6.9%).
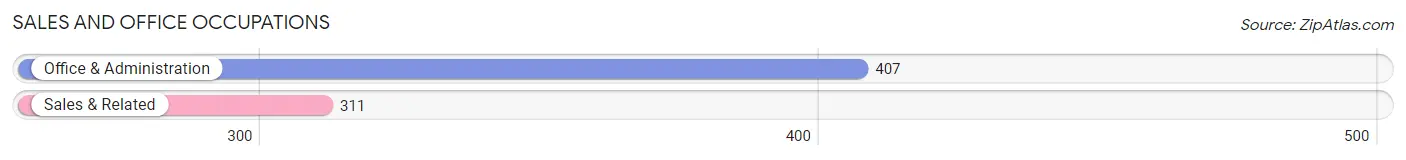
Sales and Office Occupations by Sex
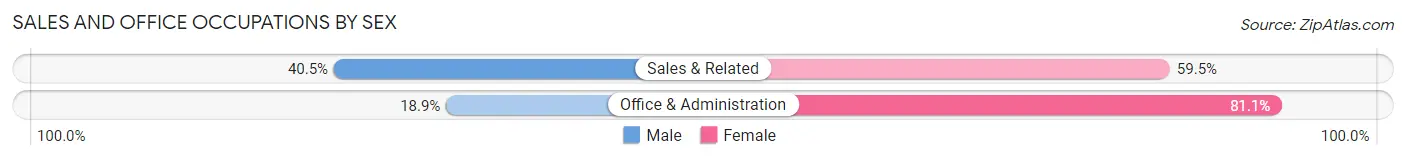
| Occupation | Male | Female |
| Sales & Related | 126 (40.5%) | 185 (59.5%) |
| Office & Administration | 77 (18.9%) | 330 (81.1%) |
| Total (Category) | 203 (28.3%) | 515 (71.7%) |
| Total (Overall) | 1,979 (43.9%) | 2,525 (56.1%) |
Natural Resources, Construction and Maintenance Occupations
The most common Natural Resources, Construction and Maintenance occupations in Rolette County are Construction & Extraction (265 | 5.9%), Farming, Fishing & Forestry (86 | 1.9%), and Installation, Maintenance & Repair (74 | 1.6%).
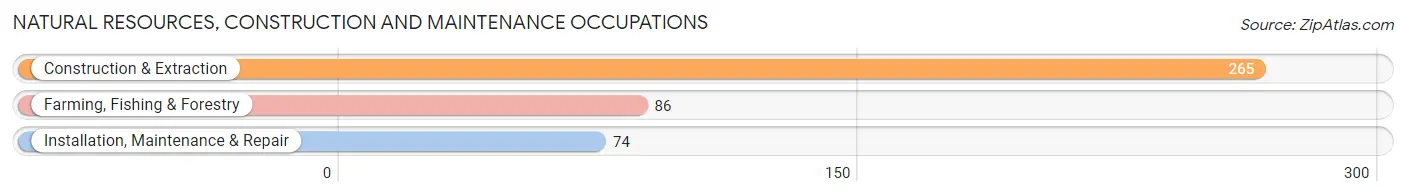
Natural Resources, Construction and Maintenance Occupations by Sex
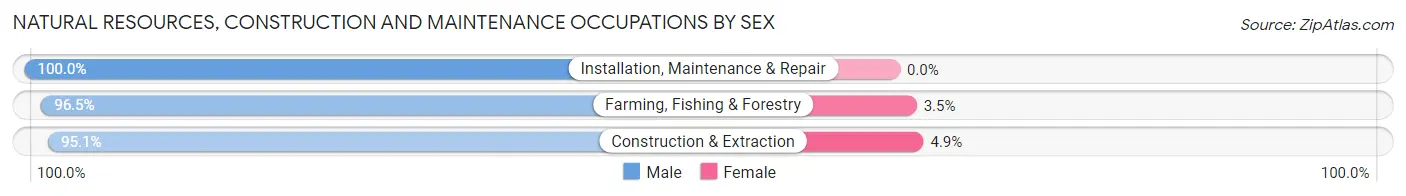
| Occupation | Male | Female |
| Farming, Fishing & Forestry | 83 (96.5%) | 3 (3.5%) |
| Construction & Extraction | 252 (95.1%) | 13 (4.9%) |
| Installation, Maintenance & Repair | 74 (100.0%) | 0 (0.0%) |
| Total (Category) | 409 (96.2%) | 16 (3.8%) |
| Total (Overall) | 1,979 (43.9%) | 2,525 (56.1%) |
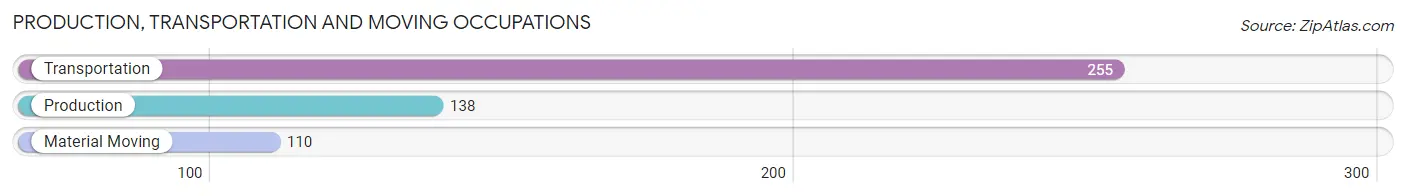
Production, Transportation and Moving Occupations
The most common Production, Transportation and Moving occupations in Rolette County are Transportation (255 | 5.7%), Production (138 | 3.1%), and Material Moving (110 | 2.4%).
Production, Transportation and Moving Occupations by Sex
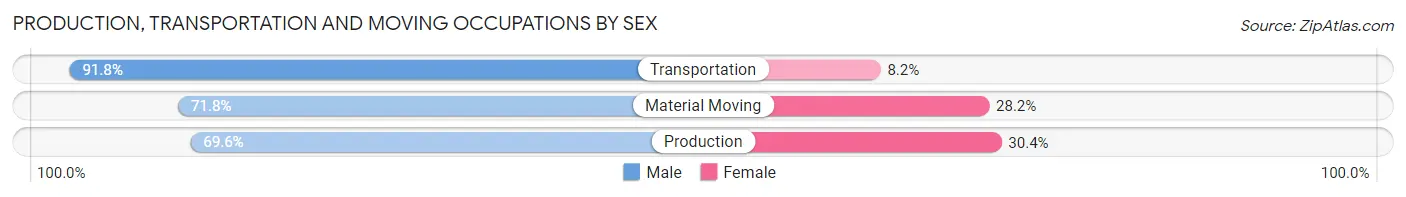
| Occupation | Male | Female |
| Production | 96 (69.6%) | 42 (30.4%) |
| Transportation | 234 (91.8%) | 21 (8.2%) |
| Material Moving | 79 (71.8%) | 31 (28.2%) |
| Total (Category) | 409 (81.3%) | 94 (18.7%) |
| Total (Overall) | 1,979 (43.9%) | 2,525 (56.1%) |
Employment Industries by Sex in Rolette County
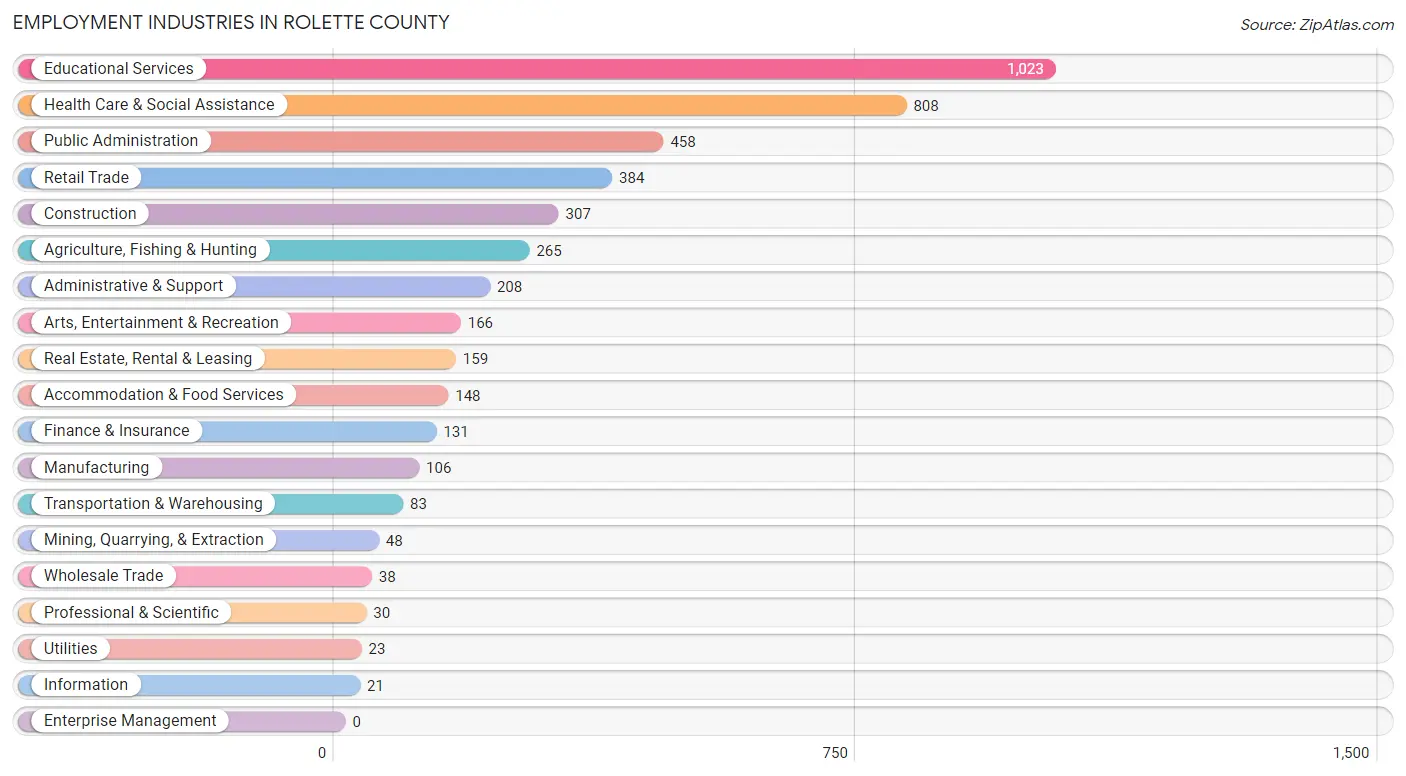
Employment Industries in Rolette County
The major employment industries in Rolette County include Educational Services (1,023 | 22.7%), Health Care & Social Assistance (808 | 17.9%), Public Administration (458 | 10.2%), Retail Trade (384 | 8.5%), and Construction (307 | 6.8%).
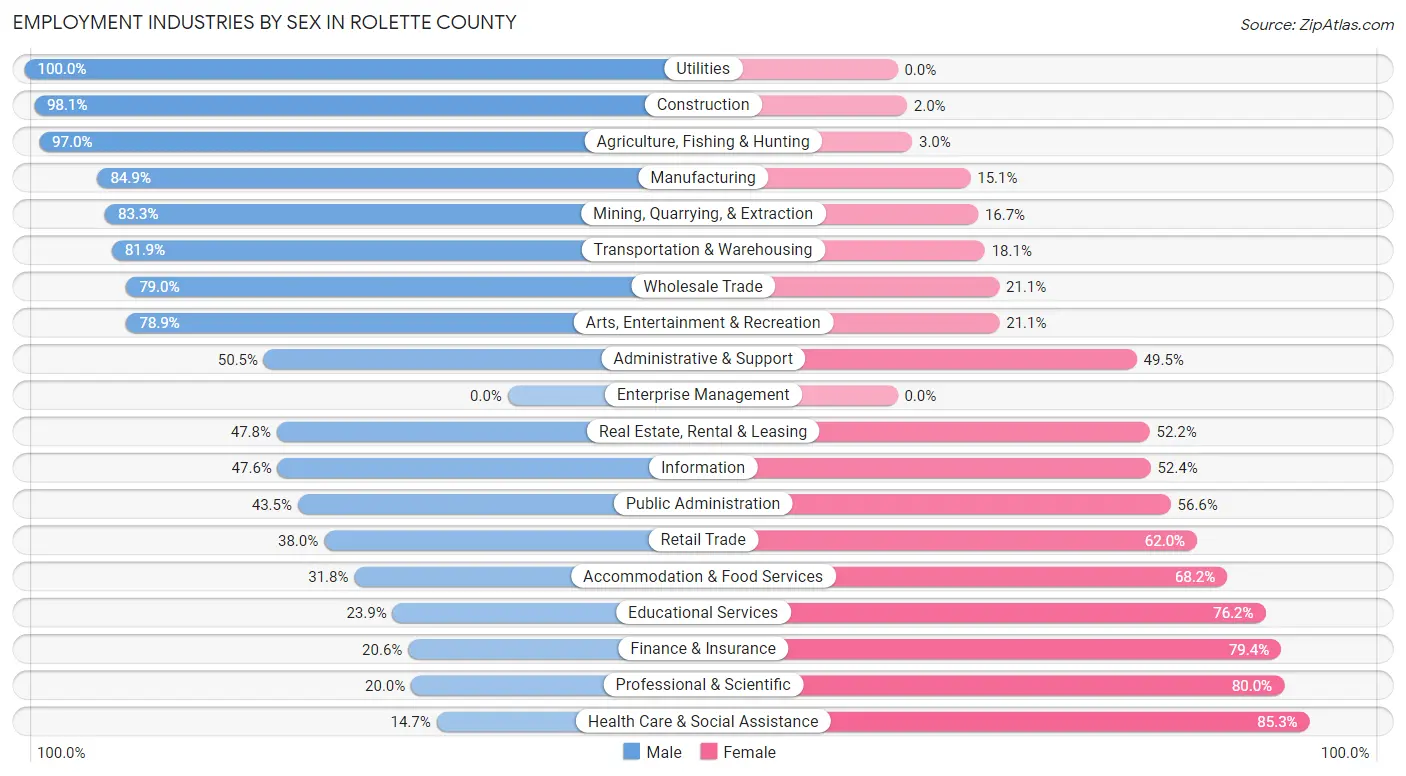
Employment Industries by Sex in Rolette County
The Rolette County industries that see more men than women are Utilities (100.0%), Construction (98.1%), and Agriculture, Fishing & Hunting (97.0%), whereas the industries that tend to have a higher number of women are Health Care & Social Assistance (85.3%), Professional & Scientific (80.0%), and Finance & Insurance (79.4%).
| Industry | Male | Female |
| Agriculture, Fishing & Hunting | 257 (97.0%) | 8 (3.0%) |
| Mining, Quarrying, & Extraction | 40 (83.3%) | 8 (16.7%) |
| Construction | 301 (98.1%) | 6 (1.9%) |
| Manufacturing | 90 (84.9%) | 16 (15.1%) |
| Wholesale Trade | 30 (78.9%) | 8 (21.0%) |
| Retail Trade | 146 (38.0%) | 238 (62.0%) |
| Transportation & Warehousing | 68 (81.9%) | 15 (18.1%) |
| Utilities | 23 (100.0%) | 0 (0.0%) |
| Information | 10 (47.6%) | 11 (52.4%) |
| Finance & Insurance | 27 (20.6%) | 104 (79.4%) |
| Real Estate, Rental & Leasing | 76 (47.8%) | 83 (52.2%) |
| Professional & Scientific | 6 (20.0%) | 24 (80.0%) |
| Enterprise Management | 0 (0.0%) | 0 (0.0%) |
| Administrative & Support | 105 (50.5%) | 103 (49.5%) |
| Educational Services | 244 (23.8%) | 779 (76.1%) |
| Health Care & Social Assistance | 119 (14.7%) | 689 (85.3%) |
| Arts, Entertainment & Recreation | 131 (78.9%) | 35 (21.1%) |
| Accommodation & Food Services | 47 (31.8%) | 101 (68.2%) |
| Public Administration | 199 (43.4%) | 259 (56.6%) |
| Total | 1,979 (43.9%) | 2,525 (56.1%) |
Education in Rolette County
School Enrollment in Rolette County
The most common levels of schooling among the 3,612 students in Rolette County are elementary school (1,031 | 28.5%), middle school (888 | 24.6%), and high school (874 | 24.2%).
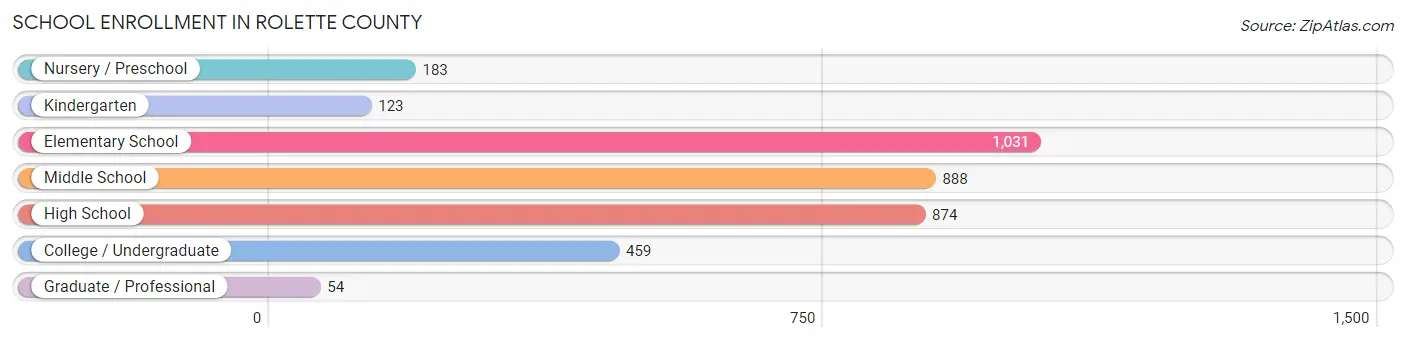
| School Level | # Students | % Students |
| Nursery / Preschool | 183 | 5.1% |
| Kindergarten | 123 | 3.4% |
| Elementary School | 1,031 | 28.5% |
| Middle School | 888 | 24.6% |
| High School | 874 | 24.2% |
| College / Undergraduate | 459 | 12.7% |
| Graduate / Professional | 54 | 1.5% |
| Total | 3,612 | 100.0% |
School Enrollment by Age by Funding Source in Rolette County
Out of a total of 3,612 students who are enrolled in schools in Rolette County, 101 (2.8%) attend a private institution, while the remaining 3,511 (97.2%) are enrolled in public schools. The age group of 35 years and over has the highest likelihood of being enrolled in private schools, with 10 (8.9% in the age bracket) enrolled. Conversely, the age group of 3 to 4 year olds has the lowest likelihood of being enrolled in a private school, with 188 (100.0% in the age bracket) attending a public institution.
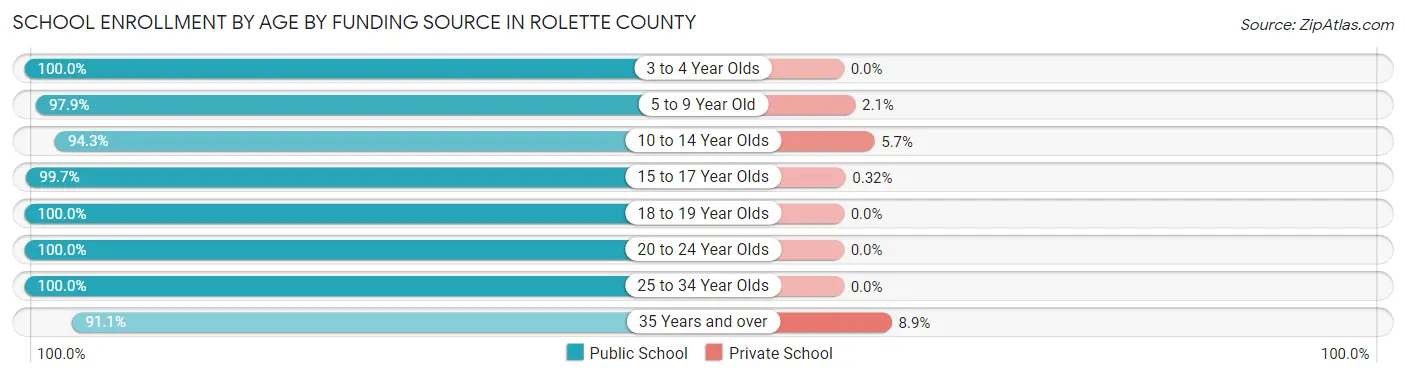
| Age Bracket | Public School | Private School |
| 3 to 4 Year Olds | 188 (100.0%) | 0 (0.0%) |
| 5 to 9 Year Old | 965 (97.9%) | 21 (2.1%) |
| 10 to 14 Year Olds | 1,126 (94.3%) | 68 (5.7%) |
| 15 to 17 Year Olds | 615 (99.7%) | 2 (0.3%) |
| 18 to 19 Year Olds | 175 (100.0%) | 0 (0.0%) |
| 20 to 24 Year Olds | 177 (100.0%) | 0 (0.0%) |
| 25 to 34 Year Olds | 163 (100.0%) | 0 (0.0%) |
| 35 Years and over | 102 (91.1%) | 10 (8.9%) |
| Total | 3,511 (97.2%) | 101 (2.8%) |
Educational Attainment by Field of Study in Rolette County
Education (484 | 40.9%), business (179 | 15.1%), science & technology (125 | 10.6%), arts & humanities (74 | 6.2%), and computers & mathematics (70 | 5.9%) are the most common fields of study among 1,184 individuals in Rolette County who have obtained a bachelor's degree or higher.
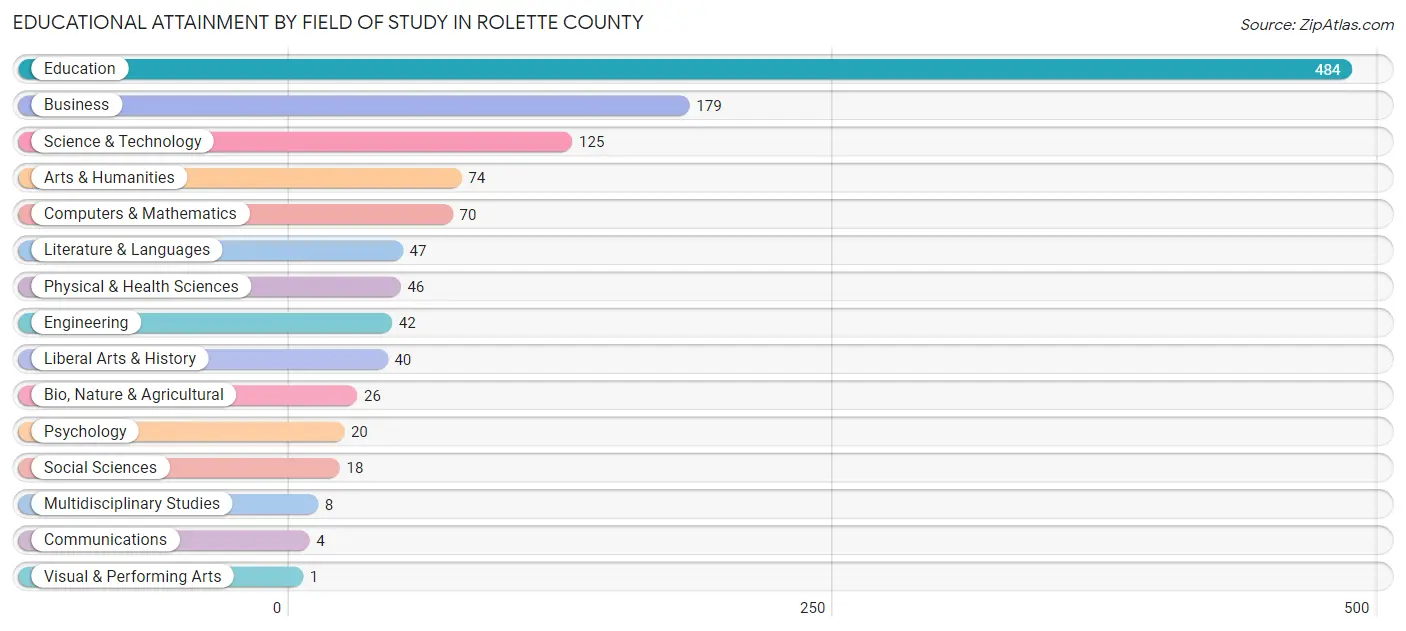
| Field of Study | # Graduates | % Graduates |
| Computers & Mathematics | 70 | 5.9% |
| Bio, Nature & Agricultural | 26 | 2.2% |
| Physical & Health Sciences | 46 | 3.9% |
| Psychology | 20 | 1.7% |
| Social Sciences | 18 | 1.5% |
| Engineering | 42 | 3.5% |
| Multidisciplinary Studies | 8 | 0.7% |
| Science & Technology | 125 | 10.6% |
| Business | 179 | 15.1% |
| Education | 484 | 40.9% |
| Literature & Languages | 47 | 4.0% |
| Liberal Arts & History | 40 | 3.4% |
| Visual & Performing Arts | 1 | 0.1% |
| Communications | 4 | 0.3% |
| Arts & Humanities | 74 | 6.2% |
| Total | 1,184 | 100.0% |
Transportation & Commute in Rolette County
Vehicle Availability by Sex in Rolette County
The most prevalent vehicle ownership categories in Rolette County are males with 2 vehicles (560, accounting for 29.5%) and females with 2 vehicles (728, making up 22.3%).
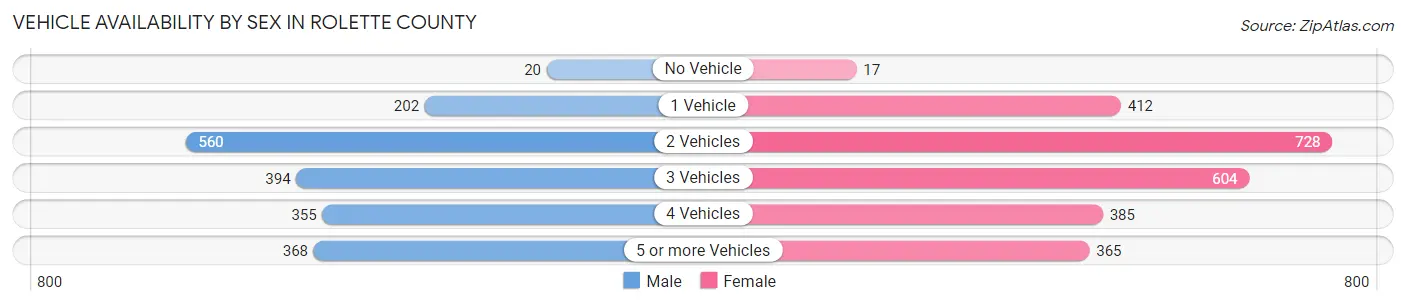
| Vehicles Available | Male | Female |
| No Vehicle | 20 (1.1%) | 17 (0.7%) |
| 1 Vehicle | 202 (10.6%) | 412 (16.4%) |
| 2 Vehicles | 560 (29.5%) | 728 (29.0%) |
| 3 Vehicles | 394 (20.7%) | 604 (24.0%) |
| 4 Vehicles | 355 (18.7%) | 385 (15.3%) |
| 5 or more Vehicles | 368 (19.4%) | 365 (14.5%) |
| Total | 1,899 (100.0%) | 2,511 (100.0%) |
Commute Time in Rolette County
The most frequently occuring commute durations in Rolette County are 10 to 14 minutes (948 commuters, 22.0%), 5 to 9 minutes (778 commuters, 18.1%), and 15 to 19 minutes (685 commuters, 15.9%).
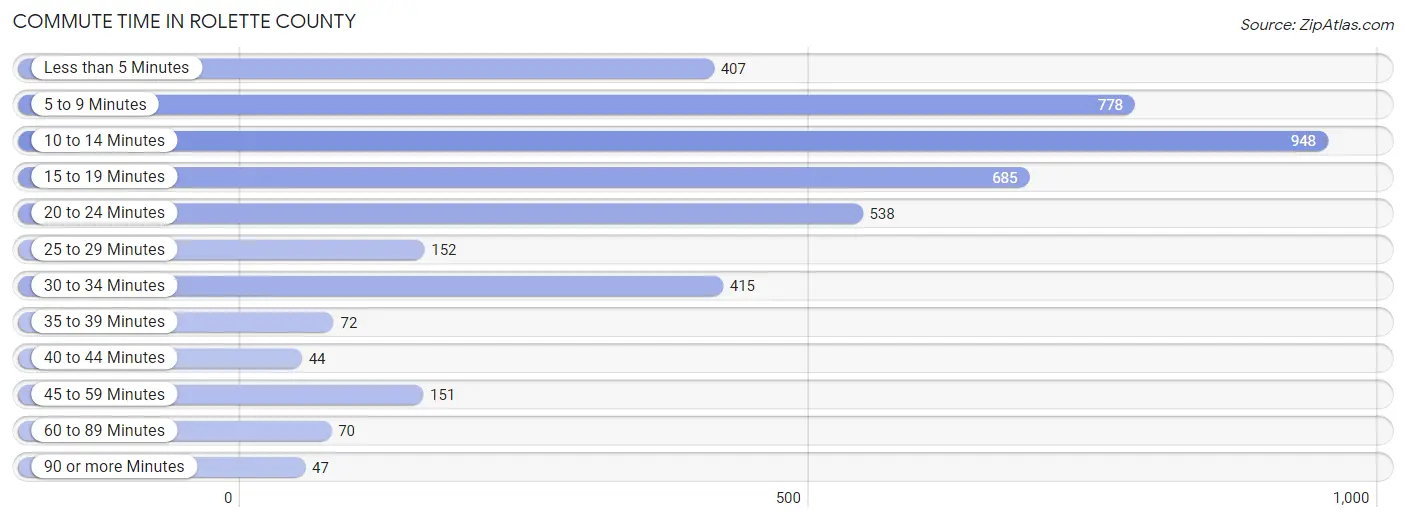
| Commute Time | # Commuters | % Commuters |
| Less than 5 Minutes | 407 | 9.5% |
| 5 to 9 Minutes | 778 | 18.1% |
| 10 to 14 Minutes | 948 | 22.0% |
| 15 to 19 Minutes | 685 | 15.9% |
| 20 to 24 Minutes | 538 | 12.5% |
| 25 to 29 Minutes | 152 | 3.5% |
| 30 to 34 Minutes | 415 | 9.6% |
| 35 to 39 Minutes | 72 | 1.7% |
| 40 to 44 Minutes | 44 | 1.0% |
| 45 to 59 Minutes | 151 | 3.5% |
| 60 to 89 Minutes | 70 | 1.6% |
| 90 or more Minutes | 47 | 1.1% |
Commute Time by Sex in Rolette County
The most common commute times in Rolette County are 15 to 19 minutes (337 commuters, 18.3%) for males and 10 to 14 minutes (631 commuters, 25.6%) for females.
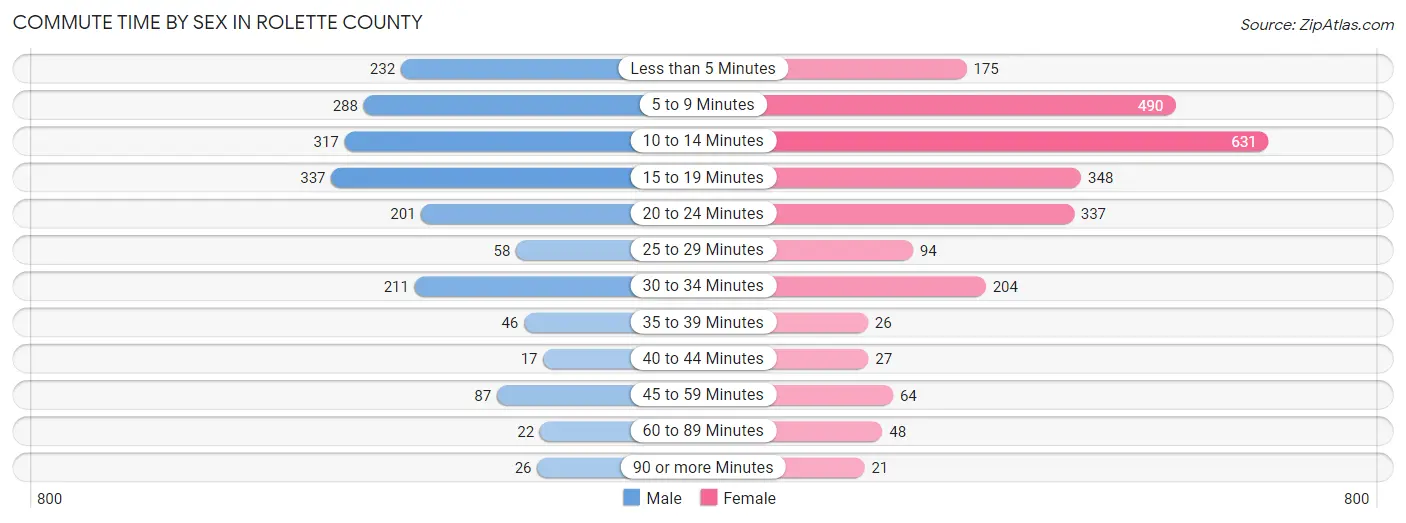
| Commute Time | Male | Female |
| Less than 5 Minutes | 232 (12.6%) | 175 (7.1%) |
| 5 to 9 Minutes | 288 (15.6%) | 490 (19.9%) |
| 10 to 14 Minutes | 317 (17.2%) | 631 (25.6%) |
| 15 to 19 Minutes | 337 (18.3%) | 348 (14.1%) |
| 20 to 24 Minutes | 201 (10.9%) | 337 (13.7%) |
| 25 to 29 Minutes | 58 (3.2%) | 94 (3.8%) |
| 30 to 34 Minutes | 211 (11.5%) | 204 (8.3%) |
| 35 to 39 Minutes | 46 (2.5%) | 26 (1.1%) |
| 40 to 44 Minutes | 17 (0.9%) | 27 (1.1%) |
| 45 to 59 Minutes | 87 (4.7%) | 64 (2.6%) |
| 60 to 89 Minutes | 22 (1.2%) | 48 (1.9%) |
| 90 or more Minutes | 26 (1.4%) | 21 (0.9%) |
Time of Departure to Work by Sex in Rolette County
The most frequent times of departure to work in Rolette County are 7:30 AM to 7:59 AM (624, 33.9%) for males and 7:30 AM to 7:59 AM (948, 38.5%) for females.
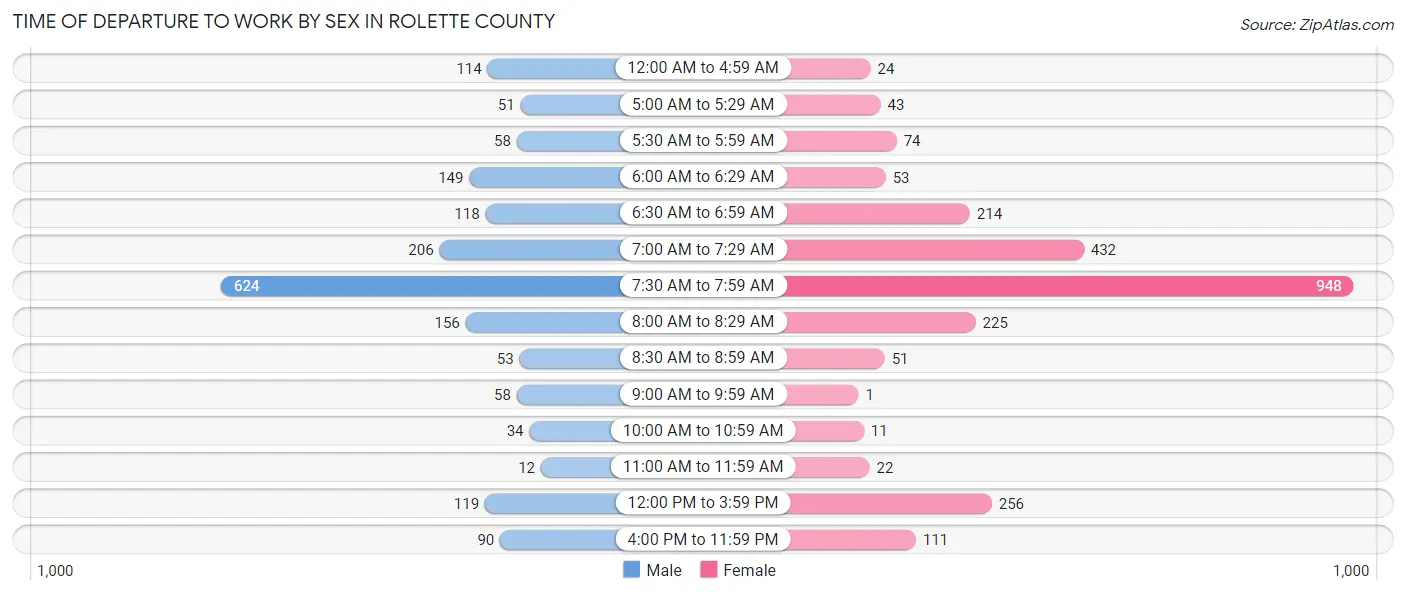
| Time of Departure | Male | Female |
| 12:00 AM to 4:59 AM | 114 (6.2%) | 24 (1.0%) |
| 5:00 AM to 5:29 AM | 51 (2.8%) | 43 (1.7%) |
| 5:30 AM to 5:59 AM | 58 (3.2%) | 74 (3.0%) |
| 6:00 AM to 6:29 AM | 149 (8.1%) | 53 (2.1%) |
| 6:30 AM to 6:59 AM | 118 (6.4%) | 214 (8.7%) |
| 7:00 AM to 7:29 AM | 206 (11.2%) | 432 (17.5%) |
| 7:30 AM to 7:59 AM | 624 (33.9%) | 948 (38.5%) |
| 8:00 AM to 8:29 AM | 156 (8.5%) | 225 (9.1%) |
| 8:30 AM to 8:59 AM | 53 (2.9%) | 51 (2.1%) |
| 9:00 AM to 9:59 AM | 58 (3.2%) | 1 (0.0%) |
| 10:00 AM to 10:59 AM | 34 (1.8%) | 11 (0.4%) |
| 11:00 AM to 11:59 AM | 12 (0.6%) | 22 (0.9%) |
| 12:00 PM to 3:59 PM | 119 (6.5%) | 256 (10.4%) |
| 4:00 PM to 11:59 PM | 90 (4.9%) | 111 (4.5%) |
| Total | 1,842 (100.0%) | 2,465 (100.0%) |
Housing Occupancy in Rolette County
Occupancy by Ownership in Rolette County
Of the total 3,668 dwellings in Rolette County, owner-occupied units account for 2,424 (66.1%), while renter-occupied units make up 1,244 (33.9%).
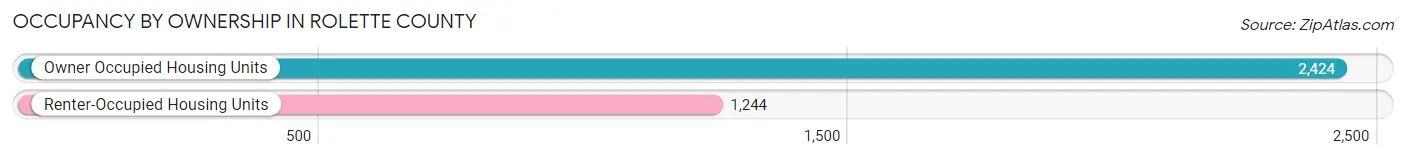
| Occupancy | # Housing Units | % Housing Units |
| Owner Occupied Housing Units | 2,424 | 66.1% |
| Renter-Occupied Housing Units | 1,244 | 33.9% |
| Total Occupied Housing Units | 3,668 | 100.0% |
Occupancy by Household Size in Rolette County
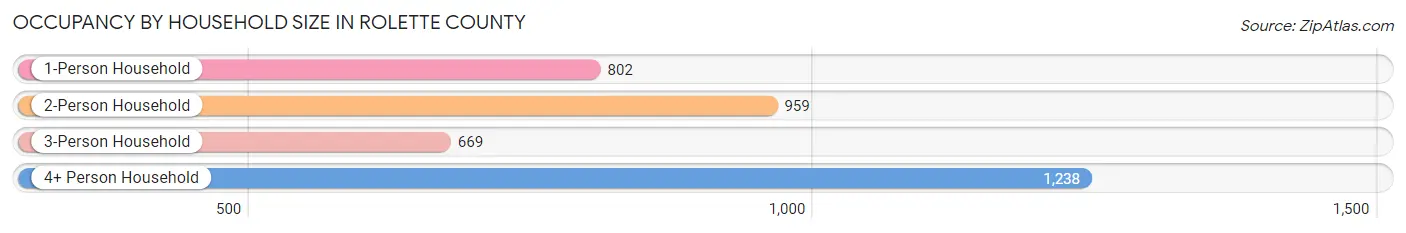
| Household Size | # Housing Units | % Housing Units |
| 1-Person Household | 802 | 21.9% |
| 2-Person Household | 959 | 26.2% |
| 3-Person Household | 669 | 18.2% |
| 4+ Person Household | 1,238 | 33.8% |
| Total Housing Units | 3,668 | 100.0% |
Occupancy by Ownership by Household Size in Rolette County
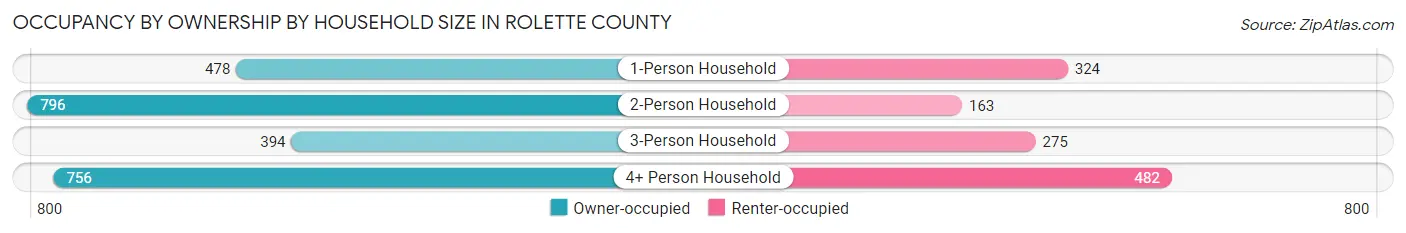
| Household Size | Owner-occupied | Renter-occupied |
| 1-Person Household | 478 (59.6%) | 324 (40.4%) |
| 2-Person Household | 796 (83.0%) | 163 (17.0%) |
| 3-Person Household | 394 (58.9%) | 275 (41.1%) |
| 4+ Person Household | 756 (61.1%) | 482 (38.9%) |
| Total Housing Units | 2,424 (66.1%) | 1,244 (33.9%) |
Occupancy by Educational Attainment in Rolette County
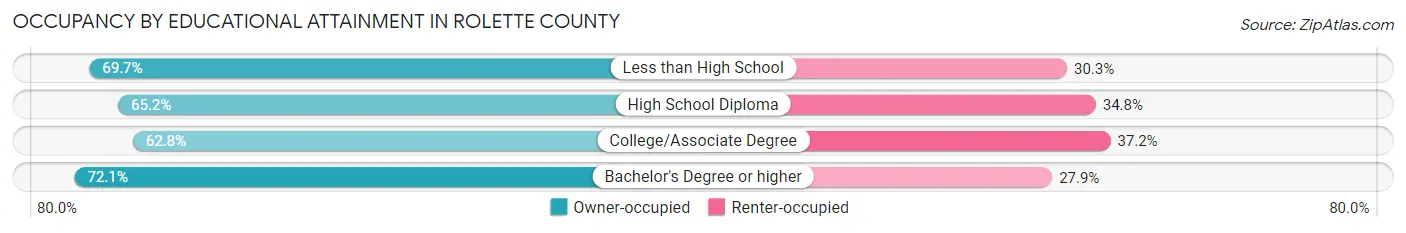
| Household Size | Owner-occupied | Renter-occupied |
| Less than High School | 343 (69.7%) | 149 (30.3%) |
| High School Diploma | 460 (65.2%) | 246 (34.8%) |
| College/Associate Degree | 1,084 (62.8%) | 641 (37.2%) |
| Bachelor's Degree or higher | 537 (72.1%) | 208 (27.9%) |
Occupancy by Age of Householder in Rolette County
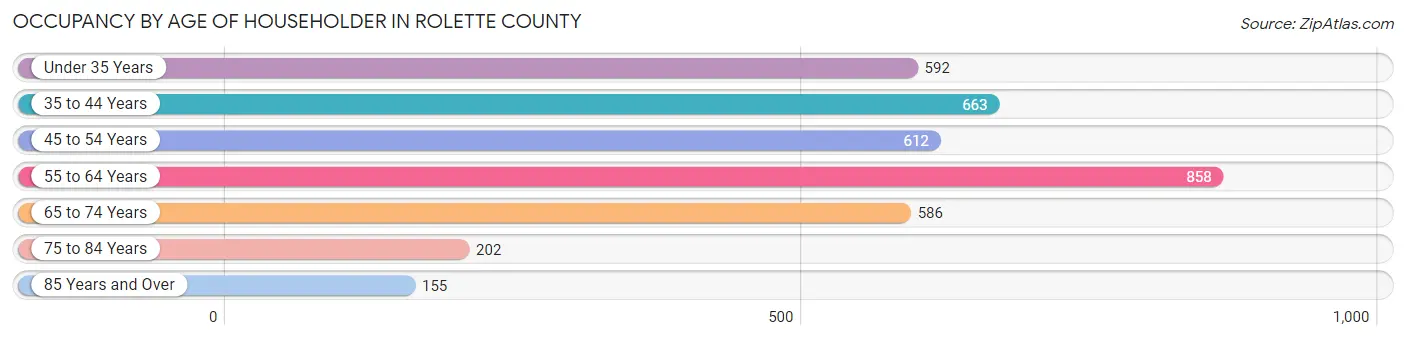
| Age Bracket | # Households | % Households |
| Under 35 Years | 592 | 16.1% |
| 35 to 44 Years | 663 | 18.1% |
| 45 to 54 Years | 612 | 16.7% |
| 55 to 64 Years | 858 | 23.4% |
| 65 to 74 Years | 586 | 16.0% |
| 75 to 84 Years | 202 | 5.5% |
| 85 Years and Over | 155 | 4.2% |
| Total | 3,668 | 100.0% |
Housing Finances in Rolette County
Median Income by Occupancy in Rolette County
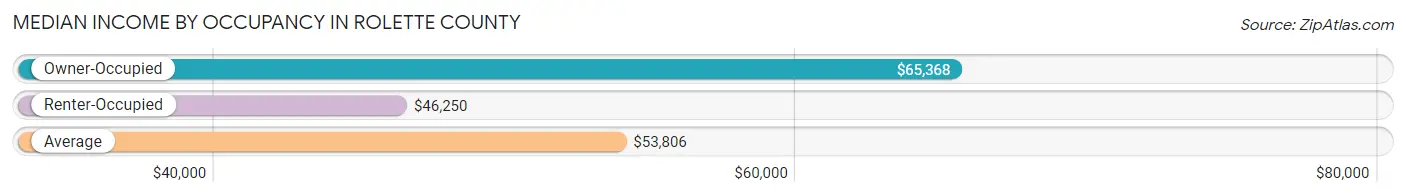
| Occupancy Type | # Households | Median Income |
| Owner-Occupied | 2,424 (66.1%) | $65,368 |
| Renter-Occupied | 1,244 (33.9%) | $46,250 |
| Average | 3,668 (100.0%) | $53,806 |
Occupancy by Householder Income Bracket in Rolette County
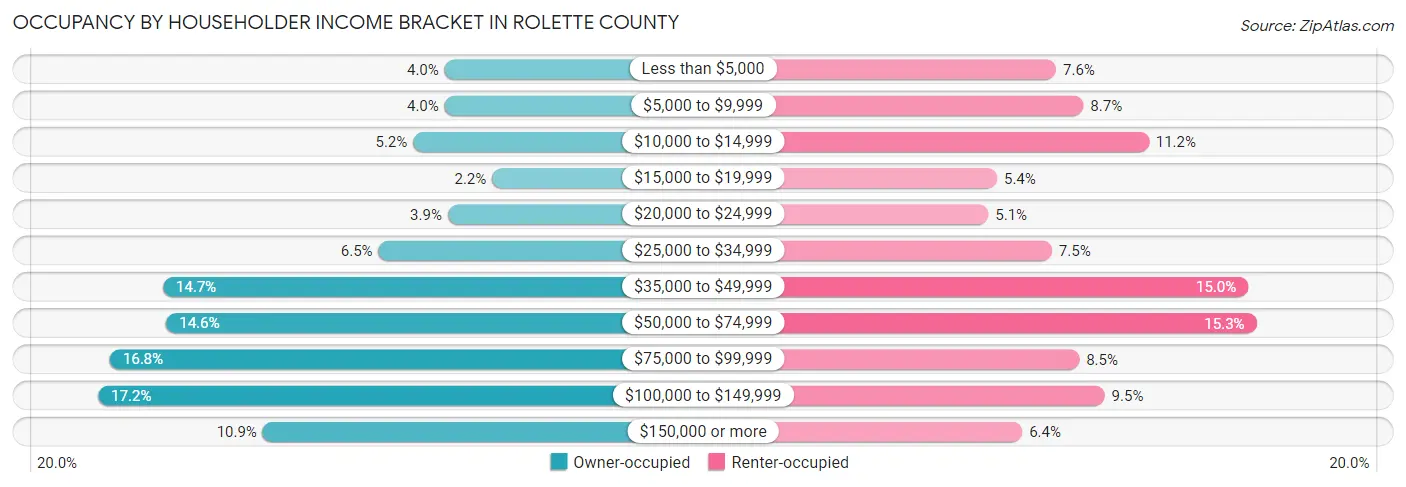
| Income Bracket | Owner-occupied | Renter-occupied |
| Less than $5,000 | 97 (4.0%) | 95 (7.6%) |
| $5,000 to $9,999 | 97 (4.0%) | 108 (8.7%) |
| $10,000 to $14,999 | 126 (5.2%) | 139 (11.2%) |
| $15,000 to $19,999 | 53 (2.2%) | 67 (5.4%) |
| $20,000 to $24,999 | 94 (3.9%) | 63 (5.1%) |
| $25,000 to $34,999 | 158 (6.5%) | 93 (7.5%) |
| $35,000 to $49,999 | 357 (14.7%) | 186 (14.9%) |
| $50,000 to $74,999 | 354 (14.6%) | 190 (15.3%) |
| $75,000 to $99,999 | 406 (16.8%) | 106 (8.5%) |
| $100,000 to $149,999 | 417 (17.2%) | 118 (9.5%) |
| $150,000 or more | 265 (10.9%) | 79 (6.4%) |
| Total | 2,424 (100.0%) | 1,244 (100.0%) |
Monthly Housing Cost Tiers in Rolette County
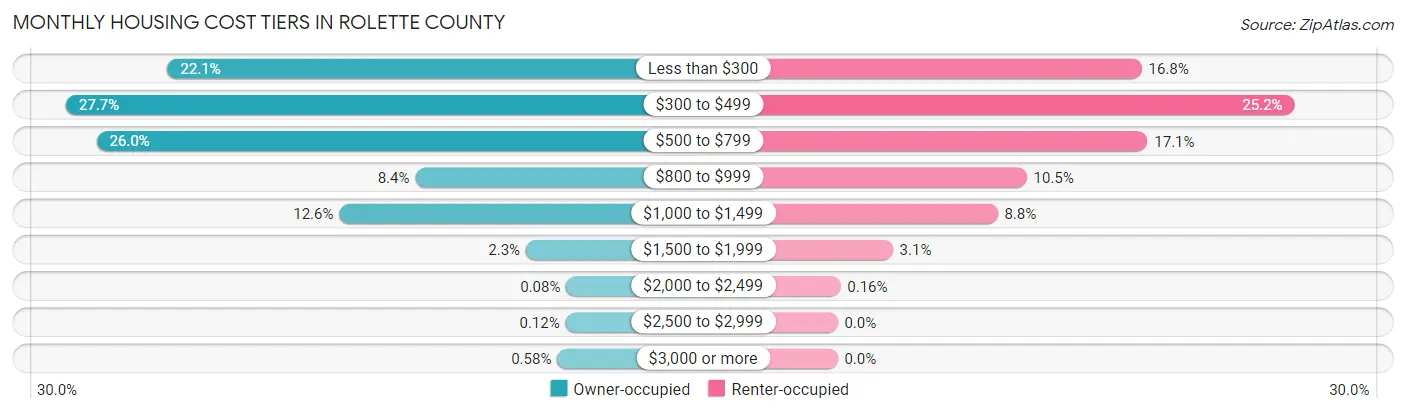
| Monthly Cost | Owner-occupied | Renter-occupied |
| Less than $300 | 536 (22.1%) | 209 (16.8%) |
| $300 to $499 | 672 (27.7%) | 314 (25.2%) |
| $500 to $799 | 631 (26.0%) | 213 (17.1%) |
| $800 to $999 | 204 (8.4%) | 130 (10.4%) |
| $1,000 to $1,499 | 306 (12.6%) | 110 (8.8%) |
| $1,500 to $1,999 | 56 (2.3%) | 38 (3.0%) |
| $2,000 to $2,499 | 2 (0.1%) | 2 (0.2%) |
| $2,500 to $2,999 | 3 (0.1%) | 0 (0.0%) |
| $3,000 or more | 14 (0.6%) | 0 (0.0%) |
| Total | 2,424 (100.0%) | 1,244 (100.0%) |
Physical Housing Characteristics in Rolette County
Housing Structures in Rolette County
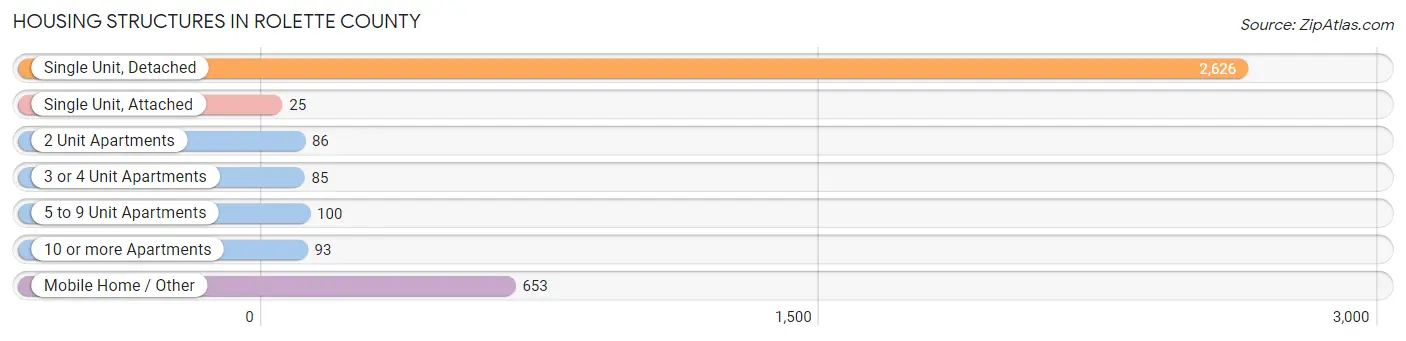
| Structure Type | # Housing Units | % Housing Units |
| Single Unit, Detached | 2,626 | 71.6% |
| Single Unit, Attached | 25 | 0.7% |
| 2 Unit Apartments | 86 | 2.3% |
| 3 or 4 Unit Apartments | 85 | 2.3% |
| 5 to 9 Unit Apartments | 100 | 2.7% |
| 10 or more Apartments | 93 | 2.5% |
| Mobile Home / Other | 653 | 17.8% |
| Total | 3,668 | 100.0% |
Housing Structures by Occupancy in Rolette County
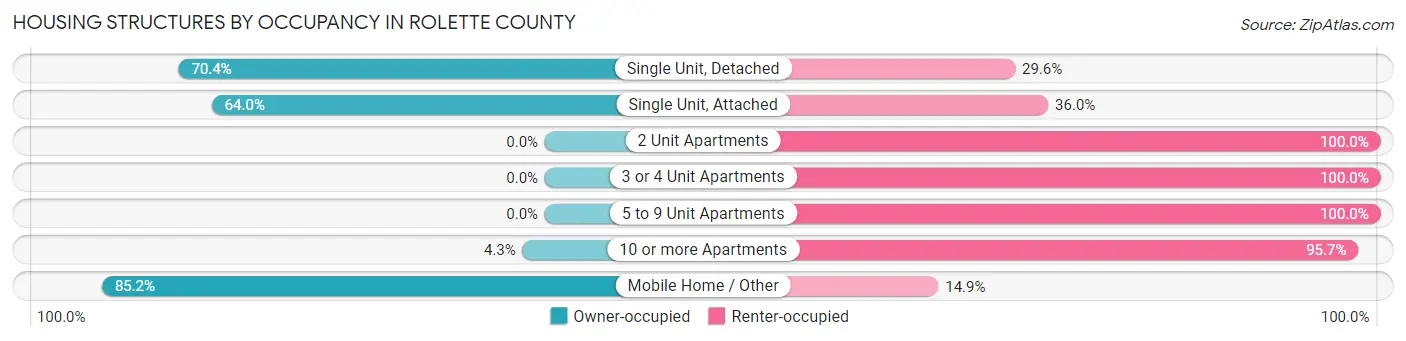
| Structure Type | Owner-occupied | Renter-occupied |
| Single Unit, Detached | 1,848 (70.4%) | 778 (29.6%) |
| Single Unit, Attached | 16 (64.0%) | 9 (36.0%) |
| 2 Unit Apartments | 0 (0.0%) | 86 (100.0%) |
| 3 or 4 Unit Apartments | 0 (0.0%) | 85 (100.0%) |
| 5 to 9 Unit Apartments | 0 (0.0%) | 100 (100.0%) |
| 10 or more Apartments | 4 (4.3%) | 89 (95.7%) |
| Mobile Home / Other | 556 (85.2%) | 97 (14.8%) |
| Total | 2,424 (66.1%) | 1,244 (33.9%) |
Housing Structures by Number of Rooms in Rolette County
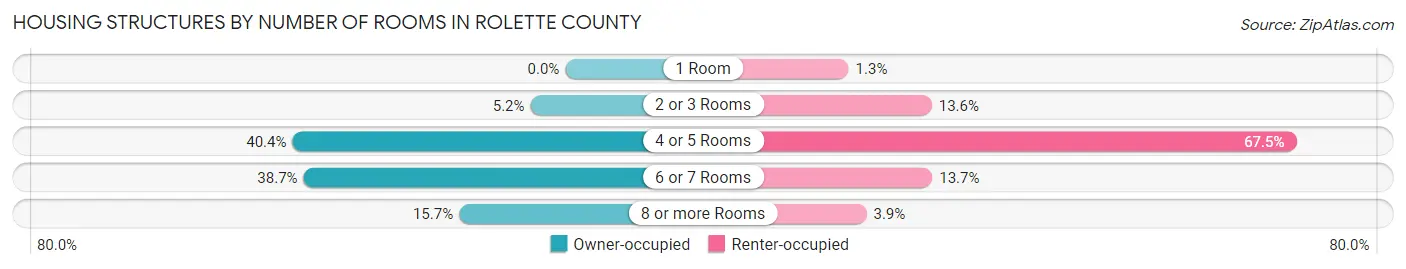
| Number of Rooms | Owner-occupied | Renter-occupied |
| 1 Room | 0 (0.0%) | 16 (1.3%) |
| 2 or 3 Rooms | 125 (5.2%) | 169 (13.6%) |
| 4 or 5 Rooms | 979 (40.4%) | 840 (67.5%) |
| 6 or 7 Rooms | 939 (38.7%) | 170 (13.7%) |
| 8 or more Rooms | 381 (15.7%) | 49 (3.9%) |
| Total | 2,424 (100.0%) | 1,244 (100.0%) |
Housing Structure by Heating Type in Rolette County
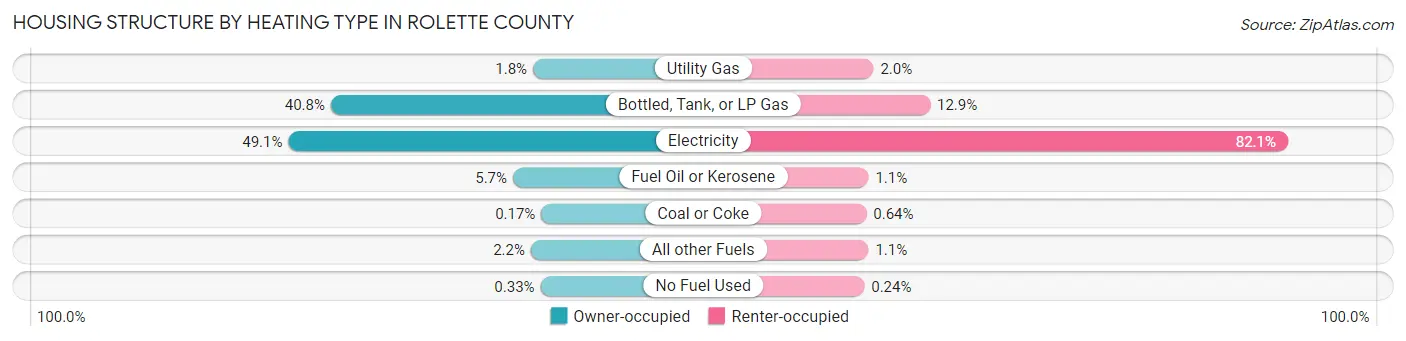
| Heating Type | Owner-occupied | Renter-occupied |
| Utility Gas | 43 (1.8%) | 25 (2.0%) |
| Bottled, Tank, or LP Gas | 990 (40.8%) | 161 (12.9%) |
| Electricity | 1,189 (49.0%) | 1,021 (82.1%) |
| Fuel Oil or Kerosene | 137 (5.7%) | 13 (1.1%) |
| Coal or Coke | 4 (0.2%) | 8 (0.6%) |
| All other Fuels | 53 (2.2%) | 13 (1.1%) |
| No Fuel Used | 8 (0.3%) | 3 (0.2%) |
| Total | 2,424 (100.0%) | 1,244 (100.0%) |
Household Vehicle Usage in Rolette County
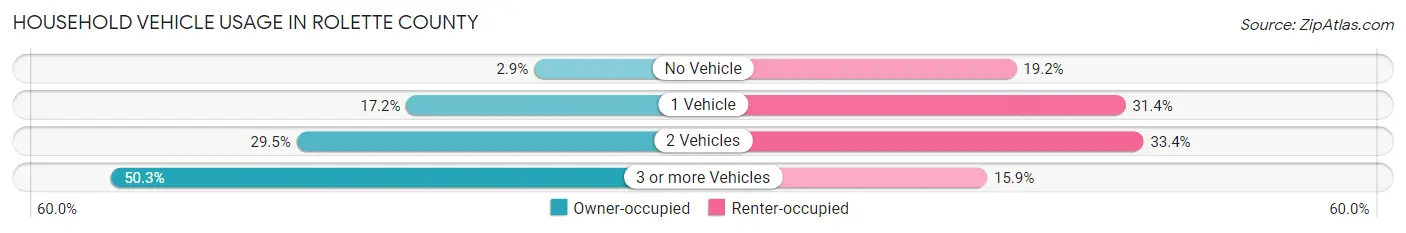
| Vehicles per Household | Owner-occupied | Renter-occupied |
| No Vehicle | 71 (2.9%) | 239 (19.2%) |
| 1 Vehicle | 418 (17.2%) | 391 (31.4%) |
| 2 Vehicles | 716 (29.5%) | 416 (33.4%) |
| 3 or more Vehicles | 1,219 (50.3%) | 198 (15.9%) |
| Total | 2,424 (100.0%) | 1,244 (100.0%) |
Real Estate & Mortgages in Rolette County
Real Estate and Mortgage Overview in Rolette County
| Characteristic | Without Mortgage | With Mortgage |
| Housing Units | 1,960 | 464 |
| Median Property Value | $87,800 | $110,300 |
| Median Household Income | $56,310 | $64 |
| Monthly Housing Costs | $423 | $14 |
| Real Estate Taxes | $917 | $176 |
Property Value by Mortgage Status in Rolette County
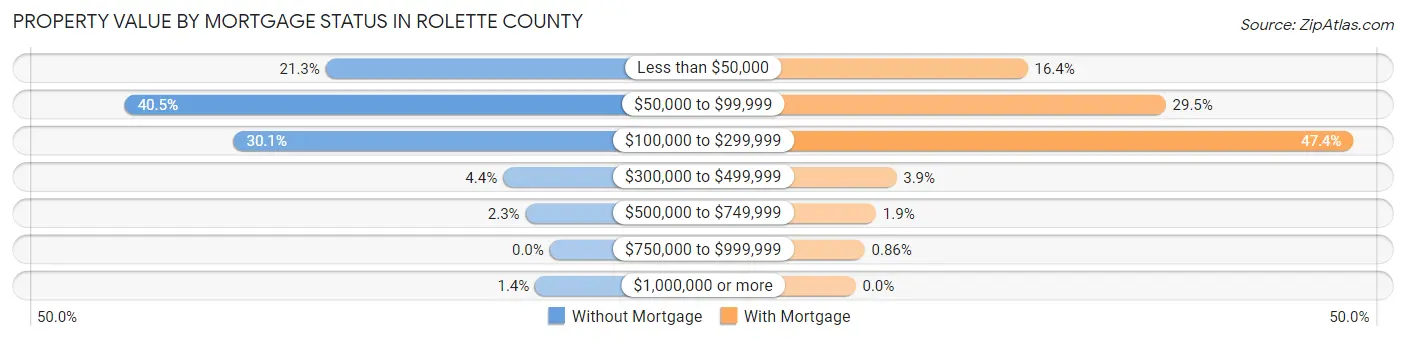
| Property Value | Without Mortgage | With Mortgage |
| Less than $50,000 | 418 (21.3%) | 76 (16.4%) |
| $50,000 to $99,999 | 793 (40.5%) | 137 (29.5%) |
| $100,000 to $299,999 | 590 (30.1%) | 220 (47.4%) |
| $300,000 to $499,999 | 87 (4.4%) | 18 (3.9%) |
| $500,000 to $749,999 | 45 (2.3%) | 9 (1.9%) |
| $750,000 to $999,999 | 0 (0.0%) | 4 (0.9%) |
| $1,000,000 or more | 27 (1.4%) | 0 (0.0%) |
| Total | 1,960 (100.0%) | 464 (100.0%) |
Household Income by Mortgage Status in Rolette County
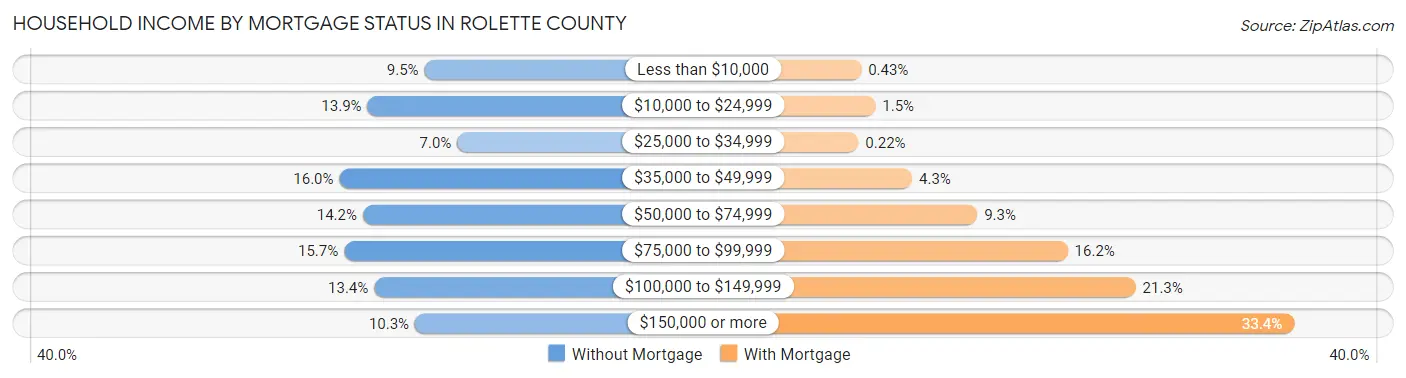
| Household Income | Without Mortgage | With Mortgage |
| Less than $10,000 | 187 (9.5%) | 2 (0.4%) |
| $10,000 to $24,999 | 272 (13.9%) | 7 (1.5%) |
| $25,000 to $34,999 | 138 (7.0%) | 1 (0.2%) |
| $35,000 to $49,999 | 314 (16.0%) | 20 (4.3%) |
| $50,000 to $74,999 | 279 (14.2%) | 43 (9.3%) |
| $75,000 to $99,999 | 307 (15.7%) | 75 (16.2%) |
| $100,000 to $149,999 | 262 (13.4%) | 99 (21.3%) |
| $150,000 or more | 201 (10.3%) | 155 (33.4%) |
| Total | 1,960 (100.0%) | 464 (100.0%) |
Property Value to Household Income Ratio in Rolette County
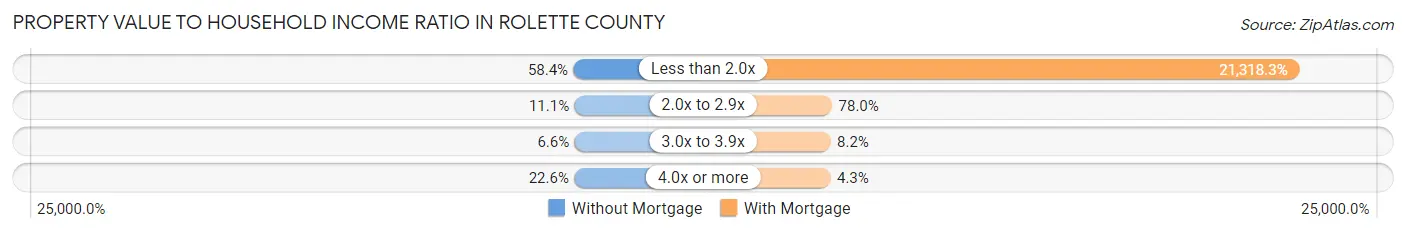
| Value-to-Income Ratio | Without Mortgage | With Mortgage |
| Less than 2.0x | 1,144 (58.4%) | 98,917 (21,318.3%) |
| 2.0x to 2.9x | 218 (11.1%) | 362 (78.0%) |
| 3.0x to 3.9x | 129 (6.6%) | 38 (8.2%) |
| 4.0x or more | 443 (22.6%) | 20 (4.3%) |
| Total | 1,960 (100.0%) | 464 (100.0%) |
Real Estate Taxes by Mortgage Status in Rolette County
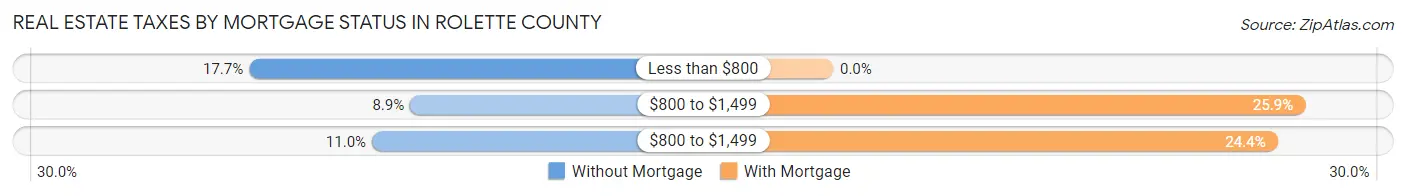
| Property Taxes | Without Mortgage | With Mortgage |
| Less than $800 | 347 (17.7%) | 0 (0.0%) |
| $800 to $1,499 | 174 (8.9%) | 120 (25.9%) |
| $800 to $1,499 | 215 (11.0%) | 113 (24.3%) |
| Total | 1,960 (100.0%) | 464 (100.0%) |
Health & Disability in Rolette County
Health Insurance Coverage by Age in Rolette County
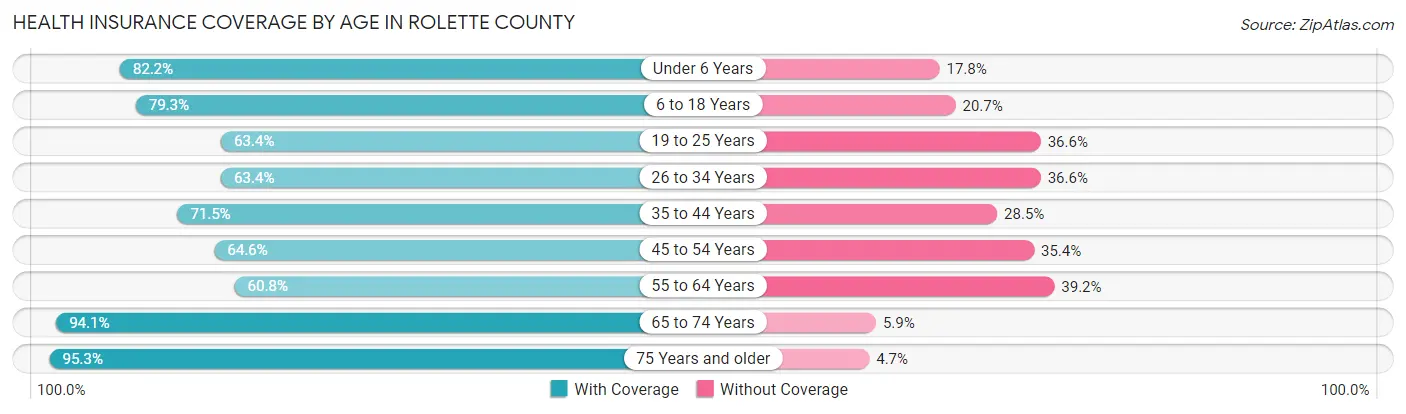
| Age Bracket | With Coverage | Without Coverage |
| Under 6 Years | 884 (82.2%) | 191 (17.8%) |
| 6 to 18 Years | 2,542 (79.3%) | 665 (20.7%) |
| 19 to 25 Years | 692 (63.4%) | 400 (36.6%) |
| 26 to 34 Years | 782 (63.4%) | 452 (36.6%) |
| 35 to 44 Years | 983 (71.5%) | 392 (28.5%) |
| 45 to 54 Years | 836 (64.6%) | 458 (35.4%) |
| 55 to 64 Years | 890 (60.8%) | 573 (39.2%) |
| 65 to 74 Years | 891 (94.1%) | 56 (5.9%) |
| 75 Years and older | 471 (95.3%) | 23 (4.7%) |
| Total | 8,971 (73.7%) | 3,210 (26.4%) |
Health Insurance Coverage by Citizenship Status in Rolette County
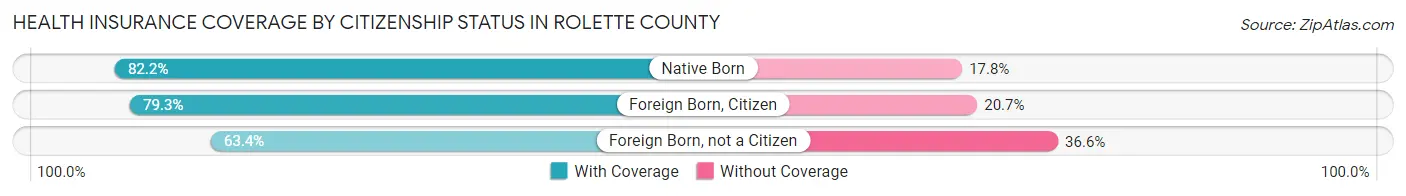
| Citizenship Status | With Coverage | Without Coverage |
| Native Born | 884 (82.2%) | 191 (17.8%) |
| Foreign Born, Citizen | 2,542 (79.3%) | 665 (20.7%) |
| Foreign Born, not a Citizen | 692 (63.4%) | 400 (36.6%) |
Health Insurance Coverage by Household Income in Rolette County
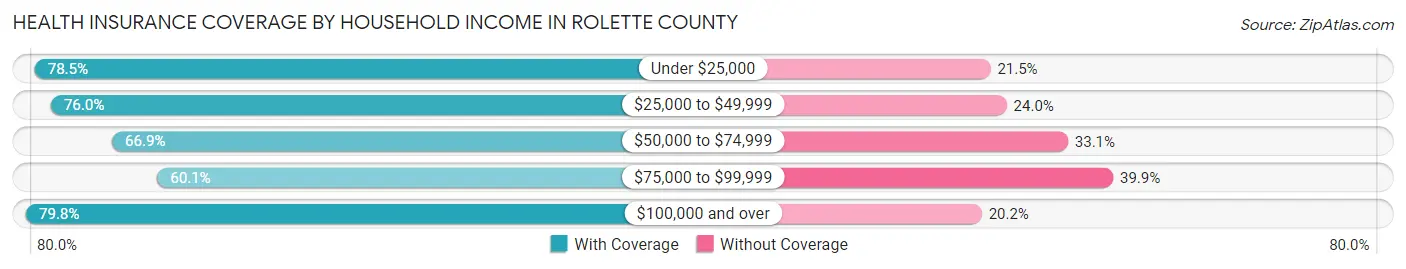
| Household Income | With Coverage | Without Coverage |
| Under $25,000 | 2,056 (78.5%) | 564 (21.5%) |
| $25,000 to $49,999 | 1,838 (76.0%) | 579 (24.0%) |
| $50,000 to $74,999 | 1,338 (66.9%) | 663 (33.1%) |
| $75,000 to $99,999 | 1,048 (60.1%) | 696 (39.9%) |
| $100,000 and over | 2,671 (79.8%) | 677 (20.2%) |
Public vs Private Health Insurance Coverage by Age in Rolette County
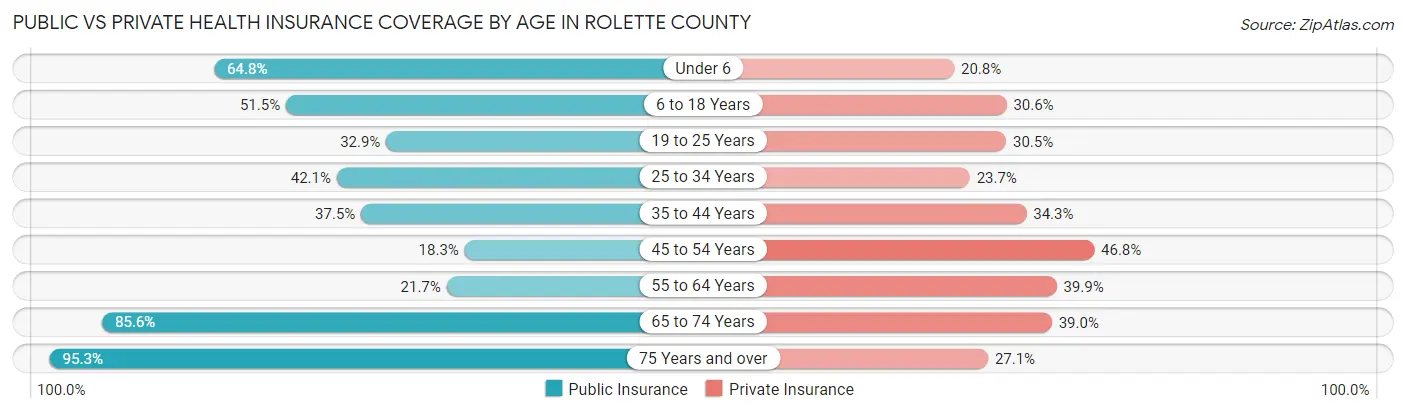
| Age Bracket | Public Insurance | Private Insurance |
| Under 6 | 697 (64.8%) | 224 (20.8%) |
| 6 to 18 Years | 1,651 (51.5%) | 980 (30.6%) |
| 19 to 25 Years | 359 (32.9%) | 333 (30.5%) |
| 25 to 34 Years | 519 (42.1%) | 293 (23.7%) |
| 35 to 44 Years | 516 (37.5%) | 471 (34.3%) |
| 45 to 54 Years | 237 (18.3%) | 606 (46.8%) |
| 55 to 64 Years | 317 (21.7%) | 583 (39.9%) |
| 65 to 74 Years | 811 (85.6%) | 369 (39.0%) |
| 75 Years and over | 471 (95.3%) | 134 (27.1%) |
| Total | 5,578 (45.8%) | 3,993 (32.8%) |
Disability Status by Sex by Age in Rolette County
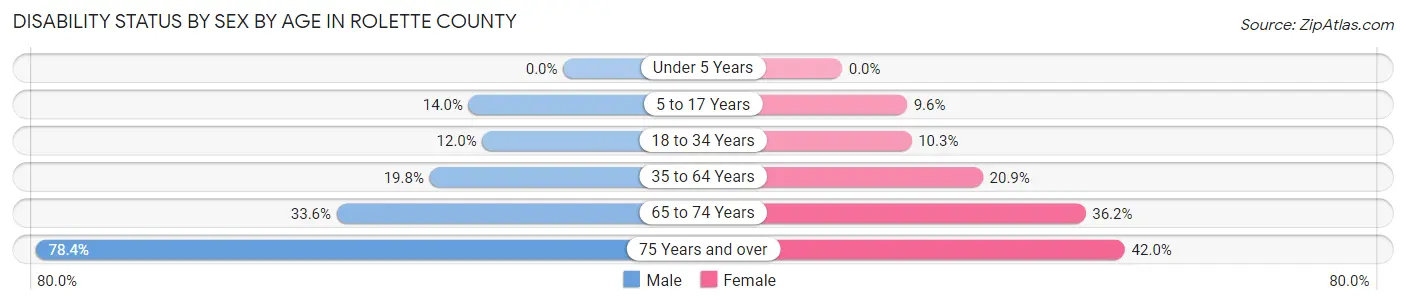
| Age Bracket | Male | Female |
| Under 5 Years | 0 (0.0%) | 0 (0.0%) |
| 5 to 17 Years | 214 (14.0%) | 148 (9.6%) |
| 18 to 34 Years | 152 (12.0%) | 131 (10.3%) |
| 35 to 64 Years | 409 (19.8%) | 433 (20.9%) |
| 65 to 74 Years | 152 (33.6%) | 179 (36.2%) |
| 75 Years and over | 152 (78.3%) | 126 (42.0%) |
Disability Class by Sex by Age in Rolette County
Disability Class: Hearing Difficulty
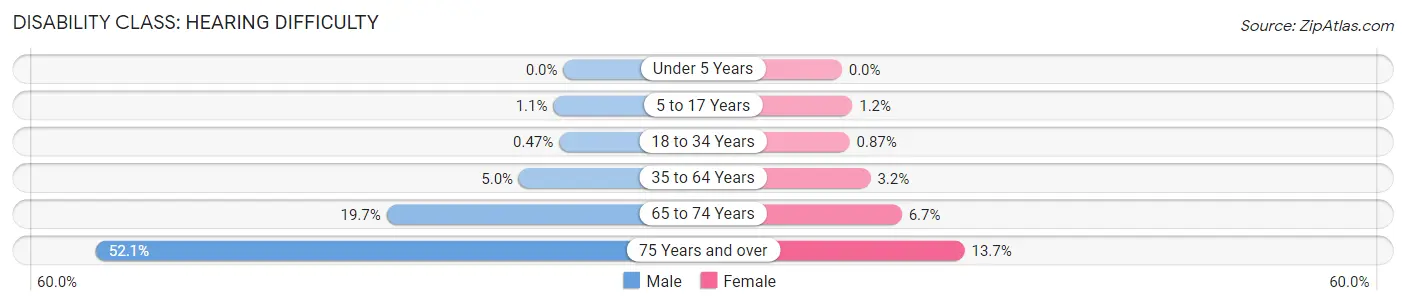
| Age Bracket | Male | Female |
| Under 5 Years | 0 (0.0%) | 0 (0.0%) |
| 5 to 17 Years | 17 (1.1%) | 18 (1.2%) |
| 18 to 34 Years | 6 (0.5%) | 11 (0.9%) |
| 35 to 64 Years | 102 (5.0%) | 66 (3.2%) |
| 65 to 74 Years | 89 (19.7%) | 33 (6.7%) |
| 75 Years and over | 101 (52.1%) | 41 (13.7%) |
Disability Class: Vision Difficulty
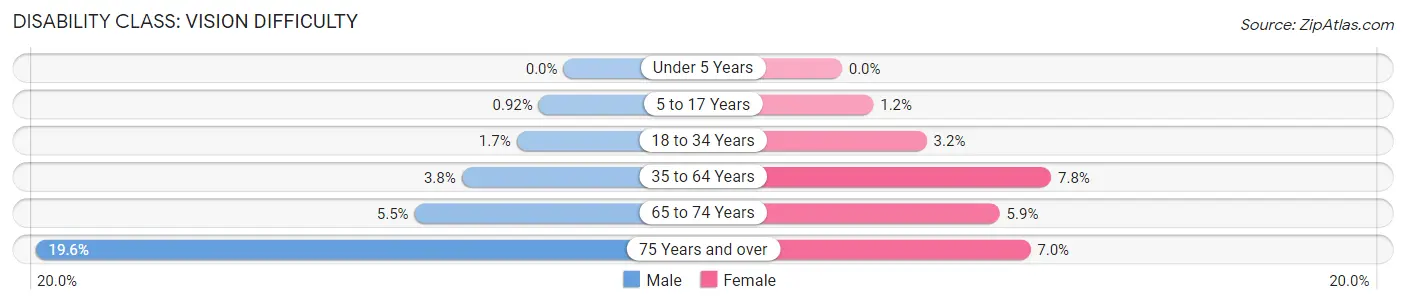
| Age Bracket | Male | Female |
| Under 5 Years | 0 (0.0%) | 0 (0.0%) |
| 5 to 17 Years | 14 (0.9%) | 18 (1.2%) |
| 18 to 34 Years | 22 (1.7%) | 40 (3.2%) |
| 35 to 64 Years | 78 (3.8%) | 161 (7.8%) |
| 65 to 74 Years | 25 (5.5%) | 29 (5.9%) |
| 75 Years and over | 38 (19.6%) | 21 (7.0%) |
Disability Class: Cognitive Difficulty
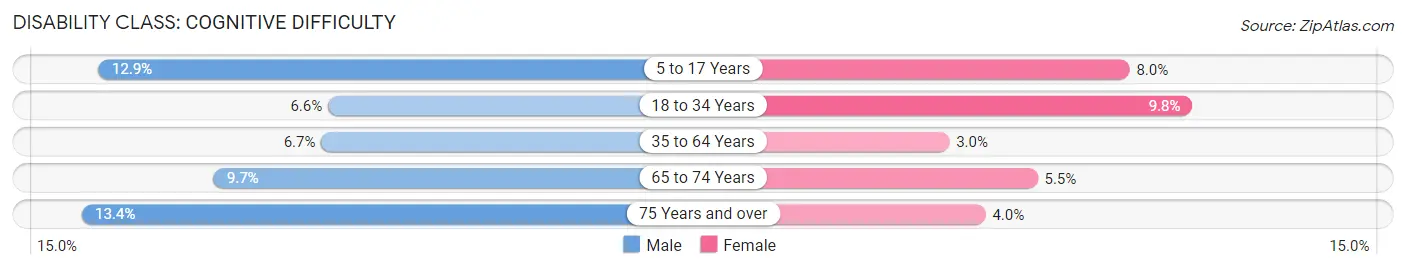
| Age Bracket | Male | Female |
| 5 to 17 Years | 197 (12.9%) | 123 (8.0%) |
| 18 to 34 Years | 83 (6.6%) | 124 (9.8%) |
| 35 to 64 Years | 139 (6.7%) | 62 (3.0%) |
| 65 to 74 Years | 44 (9.7%) | 27 (5.4%) |
| 75 Years and over | 26 (13.4%) | 12 (4.0%) |
Disability Class: Ambulatory Difficulty
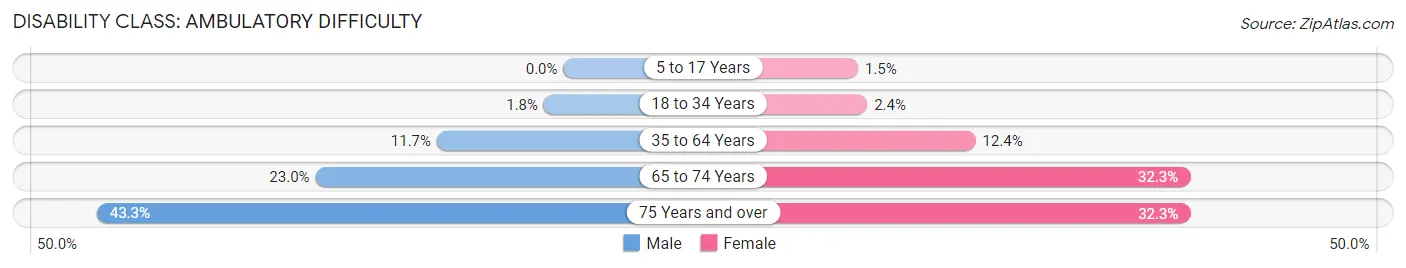
| Age Bracket | Male | Female |
| 5 to 17 Years | 0 (0.0%) | 23 (1.5%) |
| 18 to 34 Years | 23 (1.8%) | 30 (2.4%) |
| 35 to 64 Years | 242 (11.7%) | 257 (12.4%) |
| 65 to 74 Years | 104 (23.0%) | 160 (32.3%) |
| 75 Years and over | 84 (43.3%) | 97 (32.3%) |
Disability Class: Self-Care Difficulty
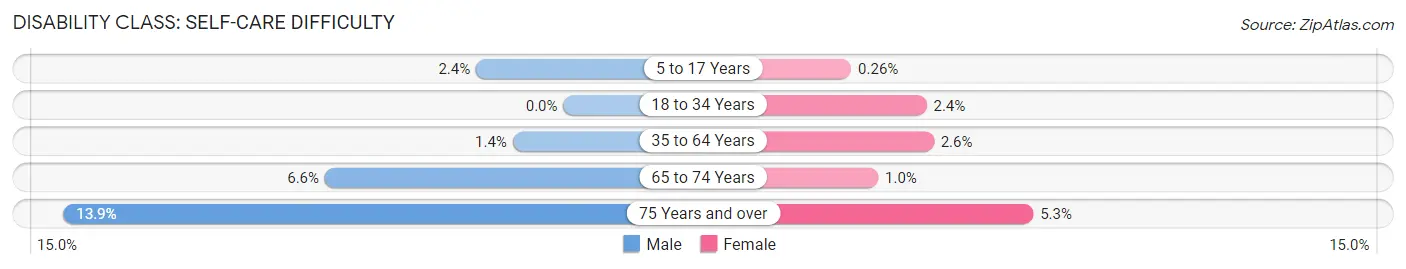
| Age Bracket | Male | Female |
| 5 to 17 Years | 37 (2.4%) | 4 (0.3%) |
| 18 to 34 Years | 0 (0.0%) | 30 (2.4%) |
| 35 to 64 Years | 29 (1.4%) | 53 (2.6%) |
| 65 to 74 Years | 30 (6.6%) | 5 (1.0%) |
| 75 Years and over | 27 (13.9%) | 16 (5.3%) |
Technology Access in Rolette County
Computing Device Access in Rolette County
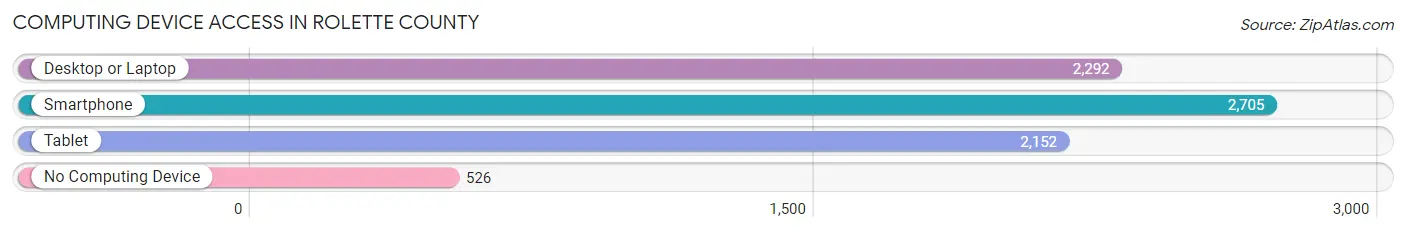
| Device Type | # Households | % Households |
| Desktop or Laptop | 2,292 | 62.5% |
| Smartphone | 2,705 | 73.8% |
| Tablet | 2,152 | 58.7% |
| No Computing Device | 526 | 14.3% |
| Total | 3,668 | 100.0% |
Internet Access in Rolette County
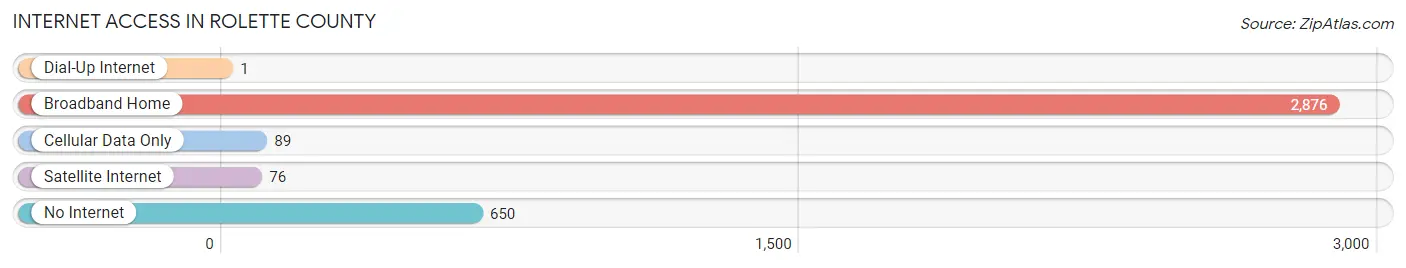
| Internet Type | # Households | % Households |
| Dial-Up Internet | 1 | 0.0% |
| Broadband Home | 2,876 | 78.4% |
| Cellular Data Only | 89 | 2.4% |
| Satellite Internet | 76 | 2.1% |
| No Internet | 650 | 17.7% |
| Total | 3,668 | 100.0% |
Rolette County Summary
Rolette County is located in the north-central region of North Dakota, and is the largest county in the state. It is bordered by the Canadian provinces of Saskatchewan and Manitoba to the north, and by the U.S. states of Montana and South Dakota to the west and south, respectively. The county seat is Rolla, and the largest city is Belcourt.
History
The area that is now Rolette County was first inhabited by the Mandan and Hidatsa Native American tribes. The first Europeans to explore the area were French fur traders, who arrived in the late 1700s. The area was part of the Dakota Territory until 1889, when it became part of the newly formed state of North Dakota.
Rolette County was officially established in 1884, and was named after Pierre-Jean de Smet, a Belgian-born Jesuit missionary who worked with the Native American tribes in the area. The county was initially populated by European immigrants, primarily from Germany, Norway, and Sweden.
Geography
Rolette County covers an area of 2,845 square miles, making it the largest county in North Dakota. It is located in the north-central region of the state, and is bordered by the Canadian provinces of Saskatchewan and Manitoba to the north, and by the U.S. states of Montana and South Dakota to the west and south, respectively.
The county is mostly flat, with rolling hills in the east and south. The Turtle Mountains are located in the northwest corner of the county, and the Souris River runs through the center of the county. The county is home to several lakes, including Lake Metigoshe, Lake Sakakawea, and Lake Audubon.
Economy
The economy of Rolette County is largely based on agriculture. The county is home to a variety of crops, including wheat, corn, soybeans, and sunflowers. Livestock production is also important, with cattle, hogs, and sheep being raised in the area.
The county is also home to several industries, including manufacturing, energy production, and tourism. The county is home to several wind farms, and is also a major producer of oil and natural gas. Tourism is also important to the local economy, with the county being home to several state parks and recreational areas.
Demographics
As of the 2010 census, the population of Rolette County was 13,529. The population is largely of European descent, with the largest ethnic groups being German (37.3%), Norwegian (25.2%), and Swedish (14.2%). The county also has a significant Native American population, with the largest tribes being the Turtle Mountain Band of Chippewa (14.2%) and the Spirit Lake Tribe (3.2%).
The median household income in the county is $41,945, and the median home value is $90,400. The unemployment rate is 4.2%, and the poverty rate is 16.2%.
Rolette County is served by several school districts, including the Rolla Public School District, the Belcourt Public School District, and the Turtle Mountain Community School District. The county is also home to Turtle Mountain Community College, a two-year college that offers associate degrees and certificate programs.
Common Questions
What is the Total Population of Rolette County?
Total Population of Rolette County is 12,292.
What is the Total Male Population of Rolette County?
Total Male Population of Rolette County is 6,058.
What is the Total Female Population of Rolette County?
Total Female Population of Rolette County is 6,234.
What is the Ratio of Males per 100 Females in Rolette County?
There are 97.18 Males per 100 Females in Rolette County.
What is the Ratio of Females per 100 Males in Rolette County?
There are 102.91 Females per 100 Males in Rolette County.
What is the Median Population Age in Rolette County?
Median Population Age in Rolette County is 31.1 Years.
What is the Average Family Size in Rolette County
Average Family Size in Rolette County is 3.8 People.
What is the Average Household Size in Rolette County
Average Household Size in Rolette County is 3.3 People.
What is Per Capita Income in Rolette County?
Per Capita income in Rolette County is $23,160.
What is the Median Family Income in Rolette County?
Median Family Income in Rolette County is $59,853.
What is the Median Household income in Rolette County?
Median Household Income in Rolette County is $53,806.
What is Income or Wage Gap in Rolette County?
Income or Wage Gap in Rolette County is 3.2%.
Women in Rolette County earn 96.8 cents for every dollar earned by a man.
What is Family Income Deficit in Rolette County?
Family Income Deficit in Rolette County is $16,405.
Families that are below poverty line in Rolette County earn $16,405 less on average than the poverty threshold level.
What is Inequality or Gini Index in Rolette County?
Inequality or Gini Index in Rolette County is 0.44.
How Large is the Labor Force in Rolette County?
There are 4,809 People in the Labor Forcein in Rolette County.
What is the Percentage of People in the Labor Force in Rolette County?
54.9% of People are in the Labor Force in Rolette County.
What is the Unemployment Rate in Rolette County?
Unemployment Rate in Rolette County is 6.4%.