Renville County, ND
Renville County Map

Renville County Overview
2,282
TOTAL POPULATION
1,205
MALE POPULATION
1,077
FEMALE POPULATION
111.88
MALES / 100 FEMALES
89.38
FEMALES / 100 MALES
38.2
MEDIAN AGE
3.1
AVG FAMILY SIZE
2.6
AVG HOUSEHOLD SIZE
$37,370
PER CAPITA INCOME
$94,167
AVG FAMILY INCOME
$77,067
AVG HOUSEHOLD INCOME
49.8%
WAGE / INCOME GAP [ % ]
50.2¢/ $1
WAGE / INCOME GAP [ $ ]
0.36
INEQUALITY / GINI INDEX
1,198
LABOR FORCE [ PEOPLE ]
66.5%
PERCENT IN LABOR FORCE
2.3%
UNEMPLOYMENT RATE
Renville County Area Codes
Race in Renville County
The most populous races in Renville County are White / Caucasian (2,227 | 97.6%), Hispanic or Latino (58 | 2.5%), and Two or more Races (43 | 1.9%).

| Race | # Population | % Population |
| Asian | 4 | 0.2% |
| Black / African American | 0 | 0.0% |
| Hawaiian / Pacific | 0 | 0.0% |
| Hispanic or Latino | 58 | 2.5% |
| Native / Alaskan | 0 | 0.0% |
| White / Caucasian | 2,227 | 97.6% |
| Two or more Races | 43 | 1.9% |
| Some other Race | 8 | 0.4% |
| Total | 2,282 | 100.0% |
Ancestry in Renville County
The most populous ancestries reported in Renville County are German (834 | 36.5%), Norwegian (717 | 31.4%), Irish (174 | 7.6%), English (167 | 7.3%), and American (68 | 3.0%), together accounting for 85.9% of all Renville County residents.

| Ancestry | # Population | % Population |
| American | 68 | 3.0% |
| British | 37 | 1.6% |
| Canadian | 3 | 0.1% |
| Cherokee | 4 | 0.2% |
| Cheyenne | 2 | 0.1% |
| Chippewa | 2 | 0.1% |
| Croatian | 4 | 0.2% |
| Czech | 7 | 0.3% |
| Danish | 43 | 1.9% |
| Dutch | 14 | 0.6% |
| English | 167 | 7.3% |
| European | 2 | 0.1% |
| Finnish | 2 | 0.1% |
| French | 53 | 2.3% |
| French Canadian | 26 | 1.1% |
| German | 834 | 36.5% |
| German Russian | 2 | 0.1% |
| Hungarian | 2 | 0.1% |
| Icelander | 4 | 0.2% |
| Irish | 174 | 7.6% |
| Italian | 51 | 2.2% |
| Korean | 4 | 0.2% |
| Lithuanian | 3 | 0.1% |
| Mexican | 50 | 2.2% |
| Norwegian | 717 | 31.4% |
| Polish | 8 | 0.4% |
| Portuguese | 2 | 0.1% |
| Puerto Rican | 8 | 0.4% |
| Russian | 24 | 1.1% |
| Scandinavian | 12 | 0.5% |
| Scotch-Irish | 37 | 1.6% |
| Scottish | 21 | 0.9% |
| South African | 22 | 1.0% |
| Subsaharan African | 22 | 1.0% |
| Swedish | 61 | 2.7% |
| Swiss | 7 | 0.3% |
| Thai | 4 | 0.2% |
| Ukrainian | 49 | 2.1% |
| Welsh | 3 | 0.1% | View All 39 Rows |
Immigrants in Renville County
The most numerous immigrant groups reported in Renville County came from Africa (22 | 1.0%), South Africa (22 | 1.0%), Canada (17 | 0.7%), Asia (2 | 0.1%), and Philippines (2 | 0.1%), together accounting for 2.8% of all Renville County residents.

| Immigration Origin | # Population | % Population |
| Africa | 22 | 1.0% |
| Asia | 2 | 0.1% |
| Canada | 17 | 0.7% |
| Philippines | 2 | 0.1% |
| South Africa | 22 | 1.0% |
| South Eastern Asia | 2 | 0.1% | View All 6 Rows |
Sex and Age in Renville County
Sex and Age in Renville County
The most populous age groups in Renville County are 55 to 59 Years (106 | 8.8%) for men and 5 to 9 Years (98 | 9.1%) for women.

| Age Bracket | Male | Female |
| Under 5 Years | 96 (8.0%) | 34 (3.2%) |
| 5 to 9 Years | 84 (7.0%) | 98 (9.1%) |
| 10 to 14 Years | 84 (7.0%) | 52 (4.8%) |
| 15 to 19 Years | 70 (5.8%) | 88 (8.2%) |
| 20 to 24 Years | 76 (6.3%) | 80 (7.4%) |
| 25 to 29 Years | 66 (5.5%) | 59 (5.5%) |
| 30 to 34 Years | 99 (8.2%) | 65 (6.0%) |
| 35 to 39 Years | 70 (5.8%) | 68 (6.3%) |
| 40 to 44 Years | 43 (3.6%) | 44 (4.1%) |
| 45 to 49 Years | 41 (3.4%) | 63 (5.9%) |
| 50 to 54 Years | 77 (6.4%) | 65 (6.0%) |
| 55 to 59 Years | 106 (8.8%) | 57 (5.3%) |
| 60 to 64 Years | 79 (6.6%) | 80 (7.4%) |
| 65 to 69 Years | 97 (8.1%) | 76 (7.1%) |
| 70 to 74 Years | 50 (4.2%) | 57 (5.3%) |
| 75 to 79 Years | 27 (2.2%) | 28 (2.6%) |
| 80 to 84 Years | 17 (1.4%) | 21 (1.9%) |
| 85 Years and over | 23 (1.9%) | 42 (3.9%) |
| Total | 1,205 (100.0%) | 1,077 (100.0%) |
Families and Households in Renville County
Median Family Size in Renville County
The median family size in Renville County is 3.15 persons per family, with single male/father families (46 | 7.8%) accounting for the largest median family size of 3.61 persons per family. On the other hand, single female/mother families (56 | 9.5%) represent the smallest median family size with 3.07 persons per family.

| Family Type | # Families | Family Size |
| Married-Couple | 488 (82.7%) | 3.11 |
| Single Male/Father | 46 (7.8%) | 3.61 |
| Single Female/Mother | 56 (9.5%) | 3.07 |
| Total Families | 590 (100.0%) | 3.15 |
Median Household Size in Renville County
The median household size in Renville County is 2.59 persons per household, with single male/father households (46 | 5.4%) accounting for the largest median household size of 4.17 persons per household. non-family households (269 | 31.3%) represent the smallest median household size with 1.25 persons per household.
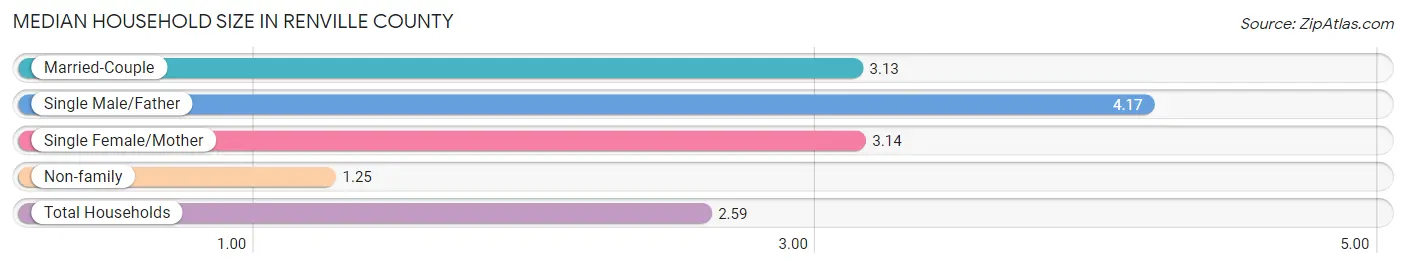
| Household Type | # Households | Household Size |
| Married-Couple | 488 (56.8%) | 3.13 |
| Single Male/Father | 46 (5.4%) | 4.17 |
| Single Female/Mother | 56 (6.5%) | 3.14 |
| Non-family | 269 (31.3%) | 1.25 |
| Total Households | 859 (100.0%) | 2.59 |
Household Size by Marriage Status in Renville County
Out of a total of 859 households in Renville County, 590 (68.7%) are family households, while 269 (31.3%) are nonfamily households. The most numerous type of family households are 2-person households, comprising 342, and the most common type of nonfamily households are 1-person households, comprising 225.
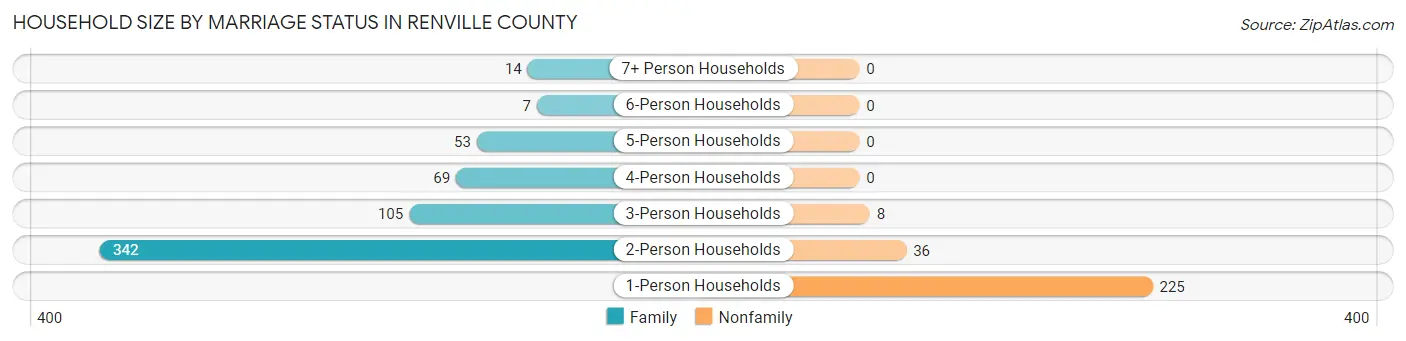
| Household Size | Family Households | Nonfamily Households |
| 1-Person Households | - | 225 (26.2%) |
| 2-Person Households | 342 (39.8%) | 36 (4.2%) |
| 3-Person Households | 105 (12.2%) | 8 (0.9%) |
| 4-Person Households | 69 (8.0%) | 0 (0.0%) |
| 5-Person Households | 53 (6.2%) | 0 (0.0%) |
| 6-Person Households | 7 (0.8%) | 0 (0.0%) |
| 7+ Person Households | 14 (1.6%) | 0 (0.0%) |
| Total | 590 (68.7%) | 269 (31.3%) |
Female Fertility in Renville County
Fertility by Age in Renville County
Average fertility rate in Renville County is 31.0 births per 1,000 women. Women in the age bracket of 20 to 34 years have the highest fertility rate with 78.0 births per 1,000 women. Women in the age bracket of 20 to 34 years acount for 100.0% of all women with births.

| Age Bracket | Women with Births | Births / 1,000 Women |
| 15 to 19 years | 0 (0.0%) | 0.0 |
| 20 to 34 years | 16 (100.0%) | 78.0 |
| 35 to 50 years | 0 (0.0%) | 0.0 |
| Total | 16 (100.0%) | 31.0 |
Fertility by Age by Marriage Status in Renville County
56.2% of women with births (16) in Renville County are married. The highest percentage of unmarried women with births falls into 20 to 34 years age bracket with 43.8% of them unmarried at the time of birth, while the lowest percentage of unmarried women with births belong to 20 to 34 years age bracket with 43.8% of them unmarried.

| Age Bracket | Married | Unmarried |
| 15 to 19 years | 0 (0.0%) | 0 (0.0%) |
| 20 to 34 years | 9 (56.2%) | 7 (43.8%) |
| 35 to 50 years | 0 (0.0%) | 0 (0.0%) |
| Total | 9 (56.2%) | 7 (43.8%) |
Fertility by Education in Renville County

| Educational Attainment | Women with Births | Births / 1,000 Women |
| Less than High School | 0 (0.0%) | 0.0 |
| High School Diploma | 0 (0.0%) | 0.0 |
| College or Associate's Degree | 11 (68.8%) | 73.0 |
| Bachelor's Degree | 1 (6.2%) | 8.0 |
| Graduate Degree | 4 (25.0%) | 222.0 |
| Total | 16 (100.0%) | 31.0 |
Fertility by Education by Marriage Status in Renville County
43.8% of women with births in Renville County are unmarried. Women with the educational attainment of bachelor's degree are most likely to be married with 100.0% of them married at childbirth, while women with the educational attainment of college or associate's degree are least likely to be married with 63.6% of them unmarried at childbirth.

| Educational Attainment | Married | Unmarried |
| Less than High School | 0 (0.0%) | 0 (0.0%) |
| High School Diploma | 0 (0.0%) | 0 (0.0%) |
| College or Associate's Degree | 4 (36.4%) | 7 (63.6%) |
| Bachelor's Degree | 1 (100.0%) | 0 (0.0%) |
| Graduate Degree | 4 (100.0%) | 0 (0.0%) |
| Total | 9 (56.2%) | 7 (43.8%) |
Income in Renville County
Income Overview in Renville County
Per Capita Income in Renville County is $37,370, while median incomes of families and households are $94,167 and $77,067 respectively.
| Characteristic | Number | Measure |
| Per Capita Income | 2,282 | $37,370 |
| Median Family Income | 590 | $94,167 |
| Mean Family Income | 590 | $106,341 |
| Median Household Income | 859 | $77,067 |
| Mean Household Income | 859 | $92,560 |
| Income Deficit | 590 | $0 |
| Wage / Income Gap (%) | 2,282 | 49.81% |
| Wage / Income Gap ($) | 2,282 | 50.19¢ per $1 |
| Gini / Inequality Index | 2,282 | 0.36 |
Earnings by Sex in Renville County
Average Earnings in Renville County are $41,280, $53,686 for men and $26,944 for women, a difference of 49.8%.

| Sex | Number | Average Earnings |
| Male | 742 (55.2%) | $53,686 |
| Female | 602 (44.8%) | $26,944 |
| Total | 1,344 (100.0%) | $41,280 |
Earnings by Sex by Income Bracket in Renville County
The most common earnings brackets in Renville County are $100,000+ for men (139 | 18.7%) and $55,000 to $64,999 for women (71 | 11.8%).
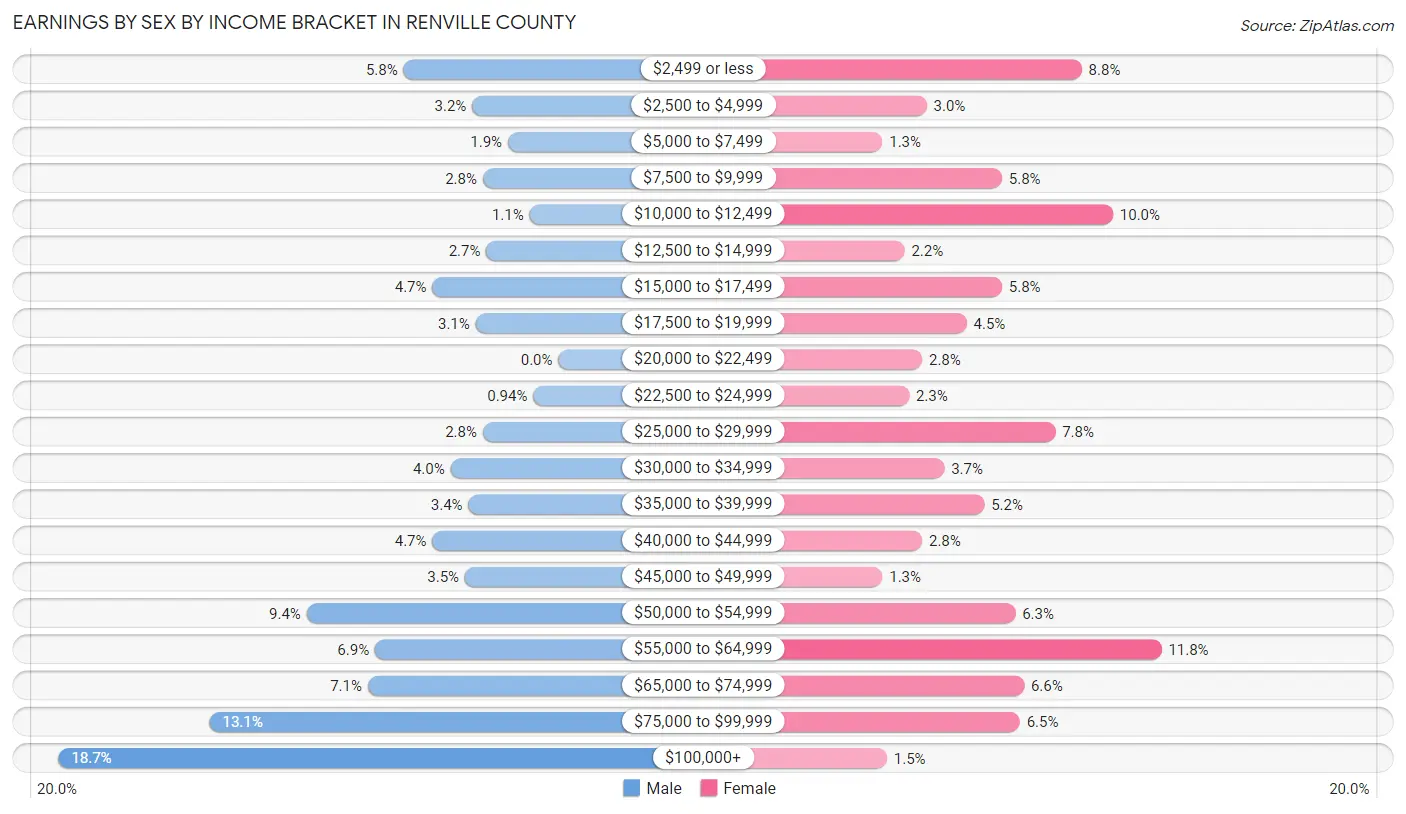
| Income | Male | Female |
| $2,499 or less | 43 (5.8%) | 53 (8.8%) |
| $2,500 to $4,999 | 24 (3.2%) | 18 (3.0%) |
| $5,000 to $7,499 | 14 (1.9%) | 8 (1.3%) |
| $7,500 to $9,999 | 21 (2.8%) | 35 (5.8%) |
| $10,000 to $12,499 | 8 (1.1%) | 60 (10.0%) |
| $12,500 to $14,999 | 20 (2.7%) | 13 (2.2%) |
| $15,000 to $17,499 | 35 (4.7%) | 35 (5.8%) |
| $17,500 to $19,999 | 23 (3.1%) | 27 (4.5%) |
| $20,000 to $22,499 | 0 (0.0%) | 17 (2.8%) |
| $22,500 to $24,999 | 7 (0.9%) | 14 (2.3%) |
| $25,000 to $29,999 | 21 (2.8%) | 47 (7.8%) |
| $30,000 to $34,999 | 30 (4.0%) | 22 (3.6%) |
| $35,000 to $39,999 | 25 (3.4%) | 31 (5.1%) |
| $40,000 to $44,999 | 35 (4.7%) | 17 (2.8%) |
| $45,000 to $49,999 | 26 (3.5%) | 8 (1.3%) |
| $50,000 to $54,999 | 70 (9.4%) | 38 (6.3%) |
| $55,000 to $64,999 | 51 (6.9%) | 71 (11.8%) |
| $65,000 to $74,999 | 53 (7.1%) | 40 (6.6%) |
| $75,000 to $99,999 | 97 (13.1%) | 39 (6.5%) |
| $100,000+ | 139 (18.7%) | 9 (1.5%) |
| Total | 742 (100.0%) | 602 (100.0%) |
Earnings by Sex by Educational Attainment in Renville County
Average earnings in Renville County are $59,539 for men and $34,583 for women, a difference of 41.9%. Men with an educational attainment of graduate degree enjoy the highest average annual earnings of $75,625, while those with college or associate's degree education earn the least with $56,250. Women with an educational attainment of bachelor's degree earn the most with the average annual earnings of $40,000, while those with less than high school education have the smallest earnings of $2,499.

| Educational Attainment | Male Income | Female Income |
| Less than High School | $62,083 | $2,499 |
| High School Diploma | $69,063 | $33,854 |
| College or Associate's Degree | $56,250 | $38,194 |
| Bachelor's Degree | - | - |
| Graduate Degree | $75,625 | $0 |
| Total | $59,539 | $34,583 |
Family Income in Renville County
Family Income Brackets in Renville County
According to the Renville County family income data, there are 159 families falling into the $100,000 to $149,999 income range, which is the most common income bracket and makes up 27.0% of all families. Conversely, the $10,000 to $14,999 income bracket is the least frequent group with only 3 families (0.5%) belonging to this category.

| Income Bracket | # Families | % Families |
| Less than $10,000 | 15 | 2.5% |
| $10,000 to $14,999 | 3 | 0.5% |
| $15,000 to $24,999 | 12 | 2.0% |
| $25,000 to $34,999 | 16 | 2.7% |
| $35,000 to $49,999 | 52 | 8.8% |
| $50,000 to $74,999 | 123 | 20.8% |
| $75,000 to $99,999 | 90 | 15.3% |
| $100,000 to $149,999 | 159 | 26.9% |
| $150,000 to $199,999 | 68 | 11.5% |
| $200,000+ | 52 | 8.8% |
Family Income by Famaliy Size in Renville County
6-person families (7 | 1.2%) account for the highest median family income in Renville County with $148,750 per family, while 3-person families (92 | 15.6%) have the highest median income of $42,500 per family member.

| Income Bracket | # Families | Median Income |
| 2-Person Families | 358 (60.7%) | $77,361 |
| 3-Person Families | 92 (15.6%) | $127,500 |
| 4-Person Families | 71 (12.0%) | $86,250 |
| 5-Person Families | 48 (8.1%) | $132,250 |
| 6-Person Families | 7 (1.2%) | $148,750 |
| 7+ Person Families | 14 (2.4%) | $91,944 |
| Total | 590 (100.0%) | $94,167 |
Family Income by Number of Earners in Renville County
The median family income in Renville County is $94,167, with families comprising 3+ earners (79) having the highest median family income of $134,688, while families with no earners (59) have the lowest median family income of $42,188, accounting for 13.4% and 10.0% of families, respectively.

| Number of Earners | # Families | Median Income |
| No Earners | 59 (10.0%) | $42,188 |
| 1 Earner | 150 (25.4%) | $75,278 |
| 2 Earners | 302 (51.2%) | $111,389 |
| 3+ Earners | 79 (13.4%) | $134,688 |
| Total | 590 (100.0%) | $94,167 |
Household Income in Renville County
Household Income Brackets in Renville County
With 212 households falling in the category, the $100,000 to $149,999 income range is the most frequent in Renville County, accounting for 24.7% of all households. In contrast, only 16 households (1.9%) fall into the $10,000 to $14,999 income bracket, making it the least populous group.

| Income Bracket | # Households | % Households |
| Less than $10,000 | 23 | 2.7% |
| $10,000 to $14,999 | 16 | 1.9% |
| $15,000 to $24,999 | 60 | 7.0% |
| $25,000 to $34,999 | 49 | 5.7% |
| $35,000 to $49,999 | 83 | 9.7% |
| $50,000 to $74,999 | 177 | 20.6% |
| $75,000 to $99,999 | 108 | 12.6% |
| $100,000 to $149,999 | 212 | 24.7% |
| $150,000 to $199,999 | 78 | 9.1% |
| $200,000+ | 53 | 6.2% |
Household Income by Householder Age in Renville County
The median household income in Renville County is $77,067, with the highest median household income of $102,798 found in the 45 to 64 years age bracket for the primary householder. A total of 329 households (38.3%) fall into this category. Meanwhile, the 15 to 24 years age bracket for the primary householder has the lowest median household income of $48,125, with 12 households (1.4%) in this group.

| Income Bracket | # Households | Median Income |
| 15 to 24 Years | 12 (1.4%) | $48,125 |
| 25 to 44 Years | 271 (31.6%) | $91,250 |
| 45 to 64 Years | 329 (38.3%) | $102,798 |
| 65+ Years | 247 (28.7%) | $66,705 |
| Total | 859 (100.0%) | $77,067 |
Poverty in Renville County
Income Below Poverty by Sex and Age in Renville County
With 5.6% poverty level for males and 7.3% for females among the residents of Renville County, 25 to 34 year old males and under 5 year old females are the most vulnerable to poverty, with 29 males (17.6%) and 8 females (23.5%) in their respective age groups living below the poverty level.

| Age Bracket | Male | Female |
| Under 5 Years | 2 (2.2%) | 8 (23.5%) |
| 5 Years | 0 (0.0%) | 0 (0.0%) |
| 6 to 11 Years | 0 (0.0%) | 13 (12.5%) |
| 12 to 14 Years | 0 (0.0%) | 1 (3.5%) |
| 15 Years | 2 (15.4%) | 0 (0.0%) |
| 16 and 17 Years | 0 (0.0%) | 2 (4.2%) |
| 18 to 24 Years | 10 (8.8%) | 2 (2.0%) |
| 25 to 34 Years | 29 (17.6%) | 3 (2.4%) |
| 35 to 44 Years | 10 (8.8%) | 21 (18.8%) |
| 45 to 54 Years | 3 (2.5%) | 10 (7.8%) |
| 55 to 64 Years | 9 (4.9%) | 4 (2.9%) |
| 65 to 74 Years | 1 (0.7%) | 3 (2.4%) |
| 75 Years and over | 0 (0.0%) | 9 (14.5%) |
| Total | 66 (5.6%) | 76 (7.3%) |
Income Above Poverty by Sex and Age in Renville County
According to the poverty statistics in Renville County, males aged 5 years and females aged 5 years are the age groups that are most secure financially, with 100.0% of males and 100.0% of females in these age groups living above the poverty line.

| Age Bracket | Male | Female |
| Under 5 Years | 89 (97.8%) | 26 (76.5%) |
| 5 Years | 13 (100.0%) | 14 (100.0%) |
| 6 to 11 Years | 79 (100.0%) | 91 (87.5%) |
| 12 to 14 Years | 68 (100.0%) | 28 (96.6%) |
| 15 Years | 11 (84.6%) | 20 (100.0%) |
| 16 and 17 Years | 20 (100.0%) | 46 (95.8%) |
| 18 to 24 Years | 103 (91.1%) | 98 (98.0%) |
| 25 to 34 Years | 136 (82.4%) | 121 (97.6%) |
| 35 to 44 Years | 103 (91.1%) | 91 (81.2%) |
| 45 to 54 Years | 115 (97.5%) | 118 (92.2%) |
| 55 to 64 Years | 176 (95.1%) | 133 (97.1%) |
| 65 to 74 Years | 141 (99.3%) | 124 (97.6%) |
| 75 Years and over | 53 (100.0%) | 53 (85.5%) |
| Total | 1,107 (94.4%) | 963 (92.7%) |
Income Below Poverty Among Married-Couple Families in Renville County
The poverty statistics for married-couple families in Renville County show that 2.1% or 10 of the total 488 families live below the poverty line. Families with 1 or 2 children have the highest poverty rate of 8.7%, comprising of 9 families. On the other hand, families with 3 or 4 children have the lowest poverty rate of 0.0%, which includes 0 families.
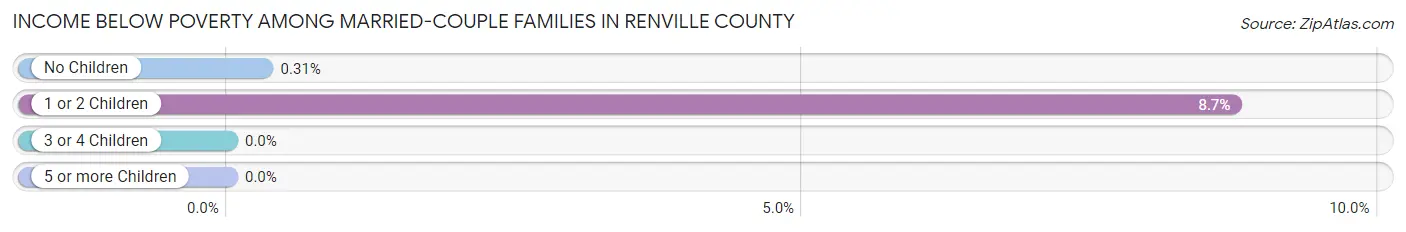
| Children | Above Poverty | Below Poverty |
| No Children | 321 (99.7%) | 1 (0.3%) |
| 1 or 2 Children | 94 (91.3%) | 9 (8.7%) |
| 3 or 4 Children | 51 (100.0%) | 0 (0.0%) |
| 5 or more Children | 12 (100.0%) | 0 (0.0%) |
| Total | 478 (98.0%) | 10 (2.1%) |
Income Below Poverty Among Single-Parent Households in Renville County
According to the poverty data in Renville County, 15.2% or 7 single-father households and 19.6% or 11 single-mother households are living below the poverty line. Among single-father households, those with no children have the highest poverty rate, with 6 households (22.2%) experiencing poverty. Likewise, among single-mother households, those with 1 or 2 children have the highest poverty rate, with 8 households (36.4%) falling below the poverty line.
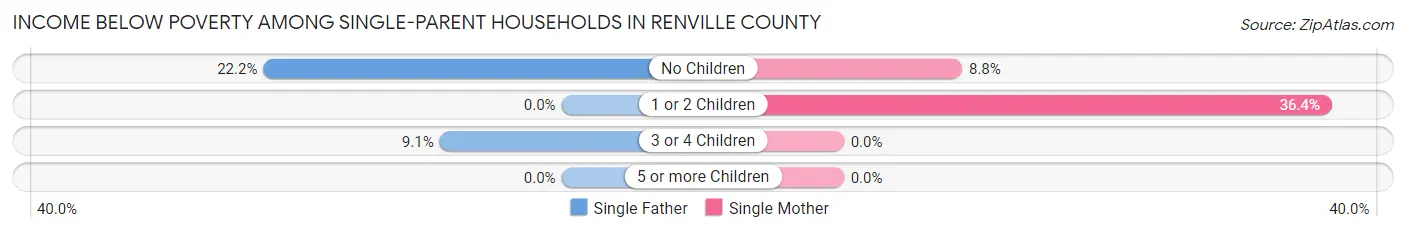
| Children | Single Father | Single Mother |
| No Children | 6 (22.2%) | 3 (8.8%) |
| 1 or 2 Children | 0 (0.0%) | 8 (36.4%) |
| 3 or 4 Children | 1 (9.1%) | 0 (0.0%) |
| 5 or more Children | 0 (0.0%) | 0 (0.0%) |
| Total | 7 (15.2%) | 11 (19.6%) |
Income Below Poverty Among Married-Couple vs Single-Parent Households in Renville County
The poverty data for Renville County shows that 10 of the married-couple family households (2.1%) and 18 of the single-parent households (17.6%) are living below the poverty level. Within the married-couple family households, those with 1 or 2 children have the highest poverty rate, with 9 households (8.7%) falling below the poverty line. Among the single-parent households, those with 1 or 2 children have the highest poverty rate, with 8 household (26.7%) living below poverty.

| Children | Married-Couple Families | Single-Parent Households |
| No Children | 1 (0.3%) | 9 (14.7%) |
| 1 or 2 Children | 9 (8.7%) | 8 (26.7%) |
| 3 or 4 Children | 0 (0.0%) | 1 (9.1%) |
| 5 or more Children | 0 (0.0%) | 0 (0.0%) |
| Total | 10 (2.1%) | 18 (17.6%) |
Employment Characteristics in Renville County
Employment by Class of Employer in Renville County
Among the 1,156 employed individuals in Renville County, private company employees (559 | 48.4%), self-employed (not incorporated) (198 | 17.1%), and federal government employees (133 | 11.5%) make up the most common classes of employment.
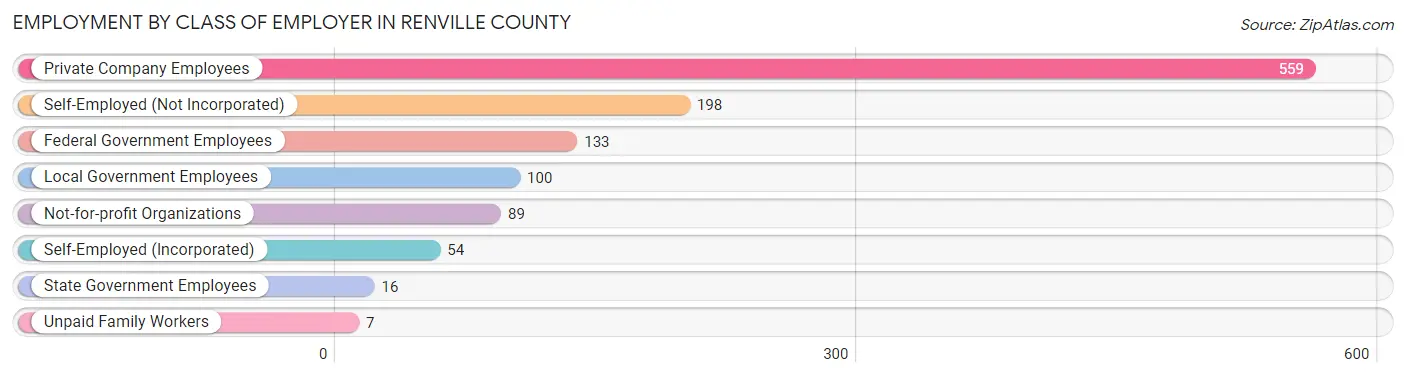
| Employer Class | # Employees | % Employees |
| Private Company Employees | 559 | 48.4% |
| Self-Employed (Incorporated) | 54 | 4.7% |
| Self-Employed (Not Incorporated) | 198 | 17.1% |
| Not-for-profit Organizations | 89 | 7.7% |
| Local Government Employees | 100 | 8.6% |
| State Government Employees | 16 | 1.4% |
| Federal Government Employees | 133 | 11.5% |
| Unpaid Family Workers | 7 | 0.6% |
| Total | 1,156 | 100.0% |
Employment Status by Age in Renville County
According to the labor force statistics for Renville County, out of the total population over 16 years of age (1,801), 66.5% or 1,198 individuals are in the labor force, with 2.3% or 28 of them unemployed. The age group with the highest labor force participation rate is 45 to 54 years, with 95.5% or 235 individuals in the labor force. Within the labor force, the 30 to 34 years age range has the highest percentage of unemployed individuals, with 9.5% or 14 of them being unemployed.

| Age Bracket | In Labor Force | Unemployed |
| 16 to 19 Years | 57 (45.6%) | 3 (5.3%) |
| 20 to 24 Years | 134 (85.9%) | 0 (0.0%) |
| 25 to 29 Years | 106 (84.8%) | 0 (0.0%) |
| 30 to 34 Years | 145 (88.4%) | 14 (9.5%) |
| 35 to 44 Years | 185 (82.2%) | 0 (0.0%) |
| 45 to 54 Years | 235 (95.5%) | 5 (2.1%) |
| 55 to 59 Years | 98 (60.1%) | 0 (0.0%) |
| 60 to 64 Years | 111 (69.8%) | 6 (5.4%) |
| 65 to 74 Years | 110 (39.3%) | 0 (0.0%) |
| 75 Years and over | 17 (10.8%) | 0 (0.0%) |
| Total | 1,198 (66.5%) | 28 (2.3%) |
Employment Status by Educational Attainment in Renville County
According to labor force statistics for Renville County, 81.3% of individuals (880) out of the total population between 25 and 64 years of age (1,082) are in the labor force, with 2.8% or 25 of them being unemployed. The group with the highest labor force participation rate are those with the educational attainment of high school diploma, with 90.1% or 299 individuals in the labor force. Within the labor force, individuals with less than high school education have the highest percentage of unemployment, with 28.3% or 13 of them being unemployed.

| Educational Attainment | In Labor Force | Unemployed |
| Less than High School | 46 (50.0%) | 26 (28.3%) |
| High School Diploma | 299 (90.1%) | 0 (0.0%) |
| College / Associate Degree | 326 (79.1%) | 11 (2.6%) |
| Bachelor's Degree or higher | 209 (85.0%) | 4 (1.6%) |
| Total | 880 (81.3%) | 30 (2.8%) |
Employment Occupations by Sex in Renville County
Management, Business, Science and Arts Occupations
The most common Management, Business, Science and Arts occupations in Renville County are Management (168 | 15.0%), Community & Social Service (59 | 5.3%), Education Instruction & Library (53 | 4.7%), Health Diagnosing & Treating (34 | 3.0%), and Health Technologists (34 | 3.0%).

Management, Business, Science and Arts Occupations by Sex
Within the Management, Business, Science and Arts occupations in Renville County, the most male-oriented occupations are Architecture & Engineering (100.0%), Life, Physical & Social Science (100.0%), and Education, Arts & Media (100.0%), while the most female-oriented occupations are Computers & Mathematics (100.0%), Arts, Media & Entertainment (100.0%), and Community & Social Service (78.0%).
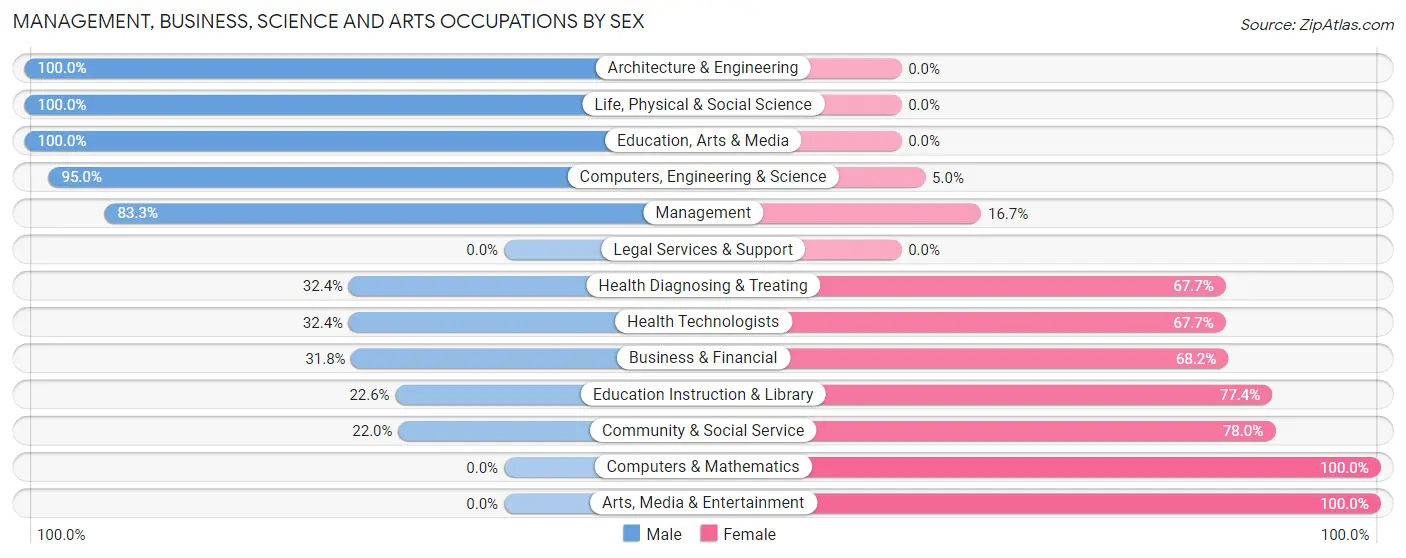
| Occupation | Male | Female |
| Management | 140 (83.3%) | 28 (16.7%) |
| Business & Financial | 7 (31.8%) | 15 (68.2%) |
| Computers, Engineering & Science | 19 (95.0%) | 1 (5.0%) |
| Computers & Mathematics | 0 (0.0%) | 1 (100.0%) |
| Architecture & Engineering | 5 (100.0%) | 0 (0.0%) |
| Life, Physical & Social Science | 14 (100.0%) | 0 (0.0%) |
| Community & Social Service | 13 (22.0%) | 46 (78.0%) |
| Education, Arts & Media | 1 (100.0%) | 0 (0.0%) |
| Legal Services & Support | 0 (0.0%) | 0 (0.0%) |
| Education Instruction & Library | 12 (22.6%) | 41 (77.4%) |
| Arts, Media & Entertainment | 0 (0.0%) | 5 (100.0%) |
| Health Diagnosing & Treating | 11 (32.4%) | 23 (67.6%) |
| Health Technologists | 11 (32.4%) | 23 (67.6%) |
| Total (Category) | 190 (62.7%) | 113 (37.3%) |
| Total (Overall) | 615 (54.8%) | 507 (45.2%) |
Services Occupations
The most common Services occupations in Renville County are Food Preparation & Serving (50 | 4.5%), Healthcare Support (28 | 2.5%), Security & Protection (25 | 2.2%), Personal Care & Service (22 | 2.0%), and Law Enforcement (20 | 1.8%).

Services Occupations by Sex
Within the Services occupations in Renville County, the most male-oriented occupations are Firefighting & Prevention (100.0%), Security & Protection (72.0%), and Law Enforcement (65.0%), while the most female-oriented occupations are Healthcare Support (100.0%), Personal Care & Service (100.0%), and Food Preparation & Serving (98.0%).

| Occupation | Male | Female |
| Healthcare Support | 0 (0.0%) | 28 (100.0%) |
| Security & Protection | 18 (72.0%) | 7 (28.0%) |
| Firefighting & Prevention | 5 (100.0%) | 0 (0.0%) |
| Law Enforcement | 13 (65.0%) | 7 (35.0%) |
| Food Preparation & Serving | 1 (2.0%) | 49 (98.0%) |
| Cleaning & Maintenance | 5 (26.3%) | 14 (73.7%) |
| Personal Care & Service | 0 (0.0%) | 22 (100.0%) |
| Total (Category) | 24 (16.7%) | 120 (83.3%) |
| Total (Overall) | 615 (54.8%) | 507 (45.2%) |
Sales and Office Occupations
The most common Sales and Office occupations in Renville County are Office & Administration (162 | 14.4%), and Sales & Related (109 | 9.7%).

Sales and Office Occupations by Sex

| Occupation | Male | Female |
| Sales & Related | 45 (41.3%) | 64 (58.7%) |
| Office & Administration | 13 (8.0%) | 149 (92.0%) |
| Total (Category) | 58 (21.4%) | 213 (78.6%) |
| Total (Overall) | 615 (54.8%) | 507 (45.2%) |
Natural Resources, Construction and Maintenance Occupations
The most common Natural Resources, Construction and Maintenance occupations in Renville County are Construction & Extraction (115 | 10.2%), Installation, Maintenance & Repair (76 | 6.8%), and Farming, Fishing & Forestry (24 | 2.1%).

Natural Resources, Construction and Maintenance Occupations by Sex

| Occupation | Male | Female |
| Farming, Fishing & Forestry | 22 (91.7%) | 2 (8.3%) |
| Construction & Extraction | 115 (100.0%) | 0 (0.0%) |
| Installation, Maintenance & Repair | 76 (100.0%) | 0 (0.0%) |
| Total (Category) | 213 (99.1%) | 2 (0.9%) |
| Total (Overall) | 615 (54.8%) | 507 (45.2%) |
Production, Transportation and Moving Occupations
The most common Production, Transportation and Moving occupations in Renville County are Production (75 | 6.7%), Transportation (68 | 6.1%), and Material Moving (46 | 4.1%).

Production, Transportation and Moving Occupations by Sex
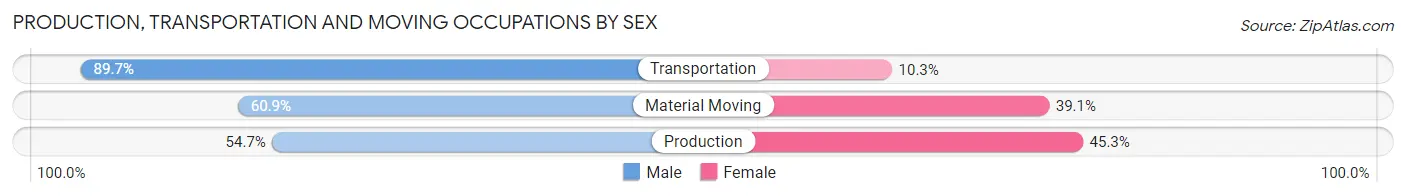
| Occupation | Male | Female |
| Production | 41 (54.7%) | 34 (45.3%) |
| Transportation | 61 (89.7%) | 7 (10.3%) |
| Material Moving | 28 (60.9%) | 18 (39.1%) |
| Total (Category) | 130 (68.8%) | 59 (31.2%) |
| Total (Overall) | 615 (54.8%) | 507 (45.2%) |
Employment Industries by Sex in Renville County
Employment Industries in Renville County
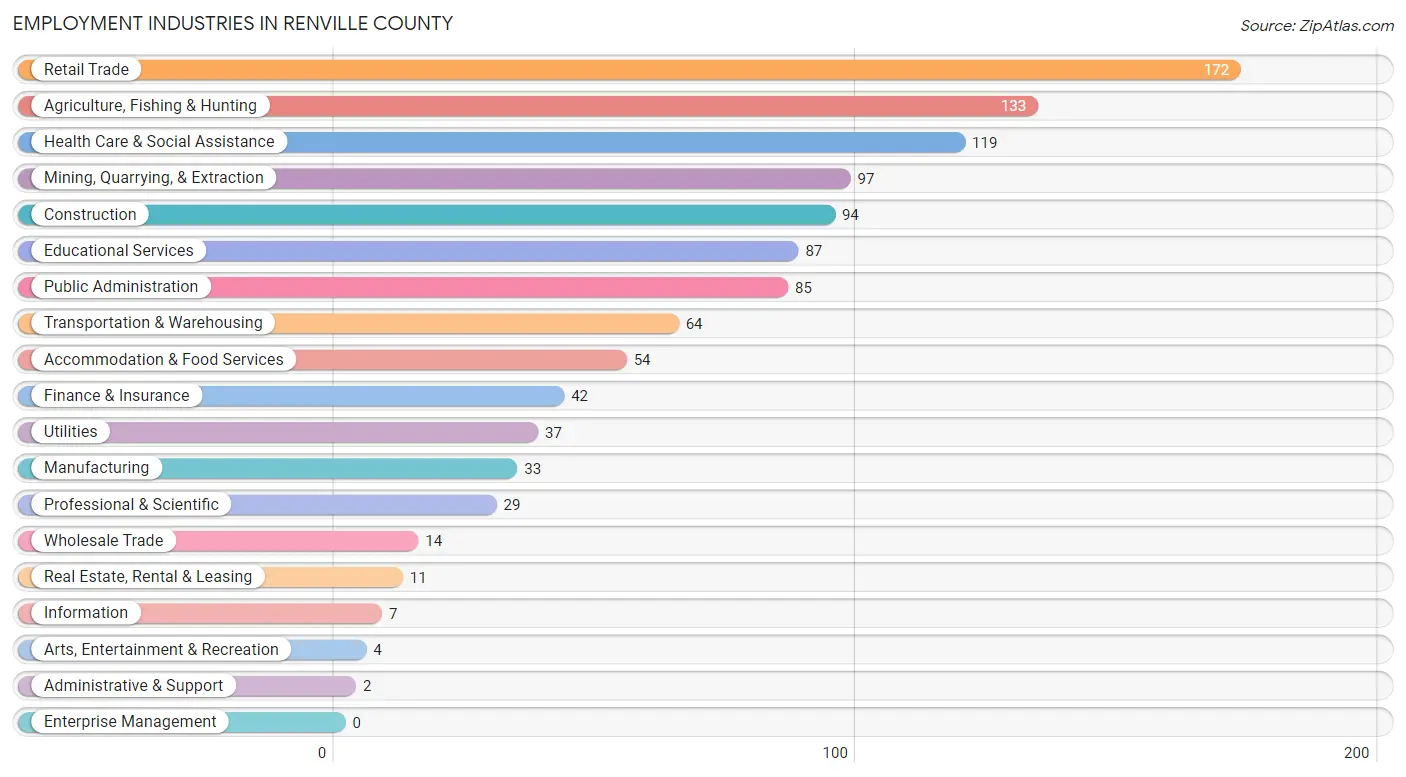
The major employment industries in Renville County include Retail Trade (172 | 15.3%), Agriculture, Fishing & Hunting (133 | 11.8%), Health Care & Social Assistance (119 | 10.6%), Mining, Quarrying, & Extraction (97 | 8.6%), and Construction (94 | 8.4%).
Employment Industries by Sex in Renville County
The Renville County industries that see more men than women are Agriculture, Fishing & Hunting (100.0%), Mining, Quarrying, & Extraction (100.0%), and Administrative & Support (100.0%), whereas the industries that tend to have a higher number of women are Information (100.0%), Arts, Entertainment & Recreation (100.0%), and Accommodation & Food Services (98.2%).

| Industry | Male | Female |
| Agriculture, Fishing & Hunting | 133 (100.0%) | 0 (0.0%) |
| Mining, Quarrying, & Extraction | 97 (100.0%) | 0 (0.0%) |
| Construction | 83 (88.3%) | 11 (11.7%) |
| Manufacturing | 8 (24.2%) | 25 (75.8%) |
| Wholesale Trade | 8 (57.1%) | 6 (42.9%) |
| Retail Trade | 84 (48.8%) | 88 (51.2%) |
| Transportation & Warehousing | 49 (76.6%) | 15 (23.4%) |
| Utilities | 21 (56.8%) | 16 (43.2%) |
| Information | 0 (0.0%) | 7 (100.0%) |
| Finance & Insurance | 8 (19.1%) | 34 (80.9%) |
| Real Estate, Rental & Leasing | 9 (81.8%) | 2 (18.2%) |
| Professional & Scientific | 18 (62.1%) | 11 (37.9%) |
| Enterprise Management | 0 (0.0%) | 0 (0.0%) |
| Administrative & Support | 2 (100.0%) | 0 (0.0%) |
| Educational Services | 35 (40.2%) | 52 (59.8%) |
| Health Care & Social Assistance | 3 (2.5%) | 116 (97.5%) |
| Arts, Entertainment & Recreation | 0 (0.0%) | 4 (100.0%) |
| Accommodation & Food Services | 1 (1.8%) | 53 (98.2%) |
| Public Administration | 35 (41.2%) | 50 (58.8%) |
| Total | 615 (54.8%) | 507 (45.2%) |
Education in Renville County
School Enrollment in Renville County
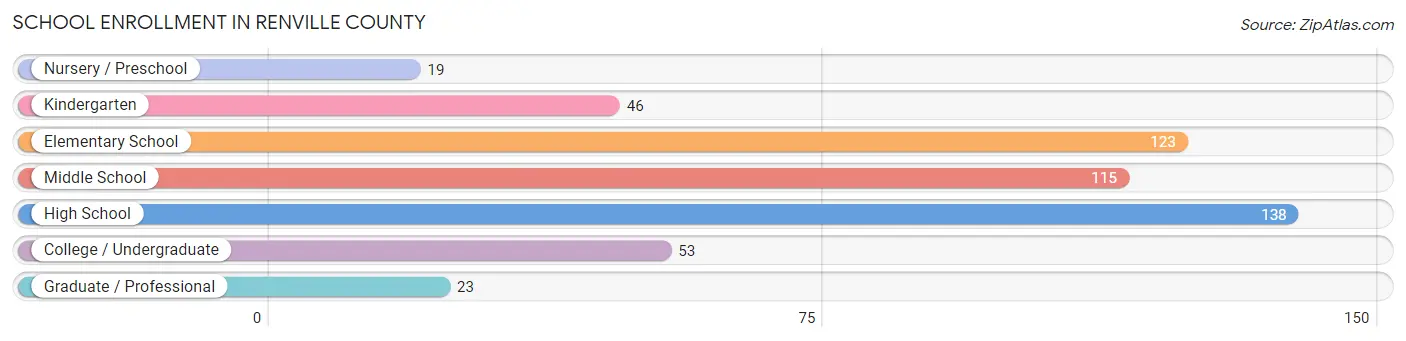
The most common levels of schooling among the 517 students in Renville County are high school (138 | 26.7%), elementary school (123 | 23.8%), and middle school (115 | 22.2%).
| School Level | # Students | % Students |
| Nursery / Preschool | 19 | 3.7% |
| Kindergarten | 46 | 8.9% |
| Elementary School | 123 | 23.8% |
| Middle School | 115 | 22.2% |
| High School | 138 | 26.7% |
| College / Undergraduate | 53 | 10.2% |
| Graduate / Professional | 23 | 4.4% |
| Total | 517 | 100.0% |
School Enrollment by Age by Funding Source in Renville County
Out of a total of 517 students who are enrolled in schools in Renville County, 54 (10.4%) attend a private institution, while the remaining 463 (89.6%) are enrolled in public schools. The age group of 35 years and over has the highest likelihood of being enrolled in private schools, with 16 (61.5% in the age bracket) enrolled. Conversely, the age group of 3 to 4 year olds has the lowest likelihood of being enrolled in a private school, with 2 (100.0% in the age bracket) attending a public institution.

| Age Bracket | Public School | Private School |
| 3 to 4 Year Olds | 2 (100.0%) | 0 (0.0%) |
| 5 to 9 Year Old | 164 (93.2%) | 12 (6.8%) |
| 10 to 14 Year Olds | 129 (100.0%) | 0 (0.0%) |
| 15 to 17 Year Olds | 92 (92.0%) | 8 (8.0%) |
| 18 to 19 Year Olds | 33 (89.2%) | 4 (10.8%) |
| 20 to 24 Year Olds | 14 (100.0%) | 0 (0.0%) |
| 25 to 34 Year Olds | 19 (57.6%) | 14 (42.4%) |
| 35 Years and over | 10 (38.5%) | 16 (61.5%) |
| Total | 463 (89.6%) | 54 (10.4%) |
Educational Attainment by Field of Study in Renville County
Education (100 | 27.3%), business (56 | 15.3%), bio, nature & agricultural (55 | 15.0%), science & technology (44 | 12.0%), and psychology (21 | 5.7%) are the most common fields of study among 366 individuals in Renville County who have obtained a bachelor's degree or higher.

| Field of Study | # Graduates | % Graduates |
| Computers & Mathematics | 19 | 5.2% |
| Bio, Nature & Agricultural | 55 | 15.0% |
| Physical & Health Sciences | 6 | 1.6% |
| Psychology | 21 | 5.7% |
| Social Sciences | 10 | 2.7% |
| Engineering | 4 | 1.1% |
| Multidisciplinary Studies | 3 | 0.8% |
| Science & Technology | 44 | 12.0% |
| Business | 56 | 15.3% |
| Education | 100 | 27.3% |
| Literature & Languages | 8 | 2.2% |
| Liberal Arts & History | 10 | 2.7% |
| Visual & Performing Arts | 0 | 0.0% |
| Communications | 9 | 2.5% |
| Arts & Humanities | 21 | 5.7% |
| Total | 366 | 100.0% |
Transportation & Commute in Renville County
Vehicle Availability by Sex in Renville County
The most prevalent vehicle ownership categories in Renville County are males with 3 vehicles (239, accounting for 36.8%) and females with 3 vehicles (171, making up 47.2%).

| Vehicles Available | Male | Female |
| No Vehicle | 5 (0.8%) | 5 (1.0%) |
| 1 Vehicle | 107 (16.5%) | 93 (18.4%) |
| 2 Vehicles | 160 (24.6%) | 124 (24.5%) |
| 3 Vehicles | 239 (36.8%) | 171 (33.8%) |
| 4 Vehicles | 75 (11.5%) | 78 (15.4%) |
| 5 or more Vehicles | 64 (9.9%) | 35 (6.9%) |
| Total | 650 (100.0%) | 506 (100.0%) |
Commute Time in Renville County
The most frequently occuring commute durations in Renville County are 30 to 34 minutes (167 commuters, 15.3%), less than 5 minutes (144 commuters, 13.2%), and 20 to 24 minutes (129 commuters, 11.8%).

| Commute Time | # Commuters | % Commuters |
| Less than 5 Minutes | 144 | 13.2% |
| 5 to 9 Minutes | 98 | 9.0% |
| 10 to 14 Minutes | 99 | 9.1% |
| 15 to 19 Minutes | 58 | 5.3% |
| 20 to 24 Minutes | 129 | 11.8% |
| 25 to 29 Minutes | 57 | 5.2% |
| 30 to 34 Minutes | 167 | 15.3% |
| 35 to 39 Minutes | 32 | 2.9% |
| 40 to 44 Minutes | 35 | 3.2% |
| 45 to 59 Minutes | 93 | 8.5% |
| 60 to 89 Minutes | 108 | 9.9% |
| 90 or more Minutes | 69 | 6.3% |
Commute Time by Sex in Renville County
The most common commute times in Renville County are 30 to 34 minutes (84 commuters, 13.6%) for males and 30 to 34 minutes (83 commuters, 17.7%) for females.

| Commute Time | Male | Female |
| Less than 5 Minutes | 66 (10.7%) | 78 (16.6%) |
| 5 to 9 Minutes | 61 (9.9%) | 37 (7.9%) |
| 10 to 14 Minutes | 71 (11.5%) | 28 (6.0%) |
| 15 to 19 Minutes | 36 (5.8%) | 22 (4.7%) |
| 20 to 24 Minutes | 74 (11.9%) | 55 (11.7%) |
| 25 to 29 Minutes | 34 (5.5%) | 23 (4.9%) |
| 30 to 34 Minutes | 84 (13.6%) | 83 (17.7%) |
| 35 to 39 Minutes | 31 (5.0%) | 1 (0.2%) |
| 40 to 44 Minutes | 26 (4.2%) | 9 (1.9%) |
| 45 to 59 Minutes | 63 (10.2%) | 30 (6.4%) |
| 60 to 89 Minutes | 42 (6.8%) | 66 (14.0%) |
| 90 or more Minutes | 31 (5.0%) | 38 (8.1%) |
Time of Departure to Work by Sex in Renville County
The most frequent times of departure to work in Renville County are 6:30 AM to 6:59 AM (106, 17.1%) for males and 7:30 AM to 7:59 AM (104, 22.1%) for females.

| Time of Departure | Male | Female |
| 12:00 AM to 4:59 AM | 28 (4.5%) | 5 (1.1%) |
| 5:00 AM to 5:29 AM | 36 (5.8%) | 16 (3.4%) |
| 5:30 AM to 5:59 AM | 29 (4.7%) | 3 (0.6%) |
| 6:00 AM to 6:29 AM | 97 (15.7%) | 17 (3.6%) |
| 6:30 AM to 6:59 AM | 106 (17.1%) | 63 (13.4%) |
| 7:00 AM to 7:29 AM | 45 (7.3%) | 76 (16.2%) |
| 7:30 AM to 7:59 AM | 79 (12.8%) | 104 (22.1%) |
| 8:00 AM to 8:29 AM | 99 (16.0%) | 81 (17.2%) |
| 8:30 AM to 8:59 AM | 16 (2.6%) | 14 (3.0%) |
| 9:00 AM to 9:59 AM | 9 (1.5%) | 31 (6.6%) |
| 10:00 AM to 10:59 AM | 6 (1.0%) | 11 (2.3%) |
| 11:00 AM to 11:59 AM | 0 (0.0%) | 2 (0.4%) |
| 12:00 PM to 3:59 PM | 21 (3.4%) | 17 (3.6%) |
| 4:00 PM to 11:59 PM | 48 (7.7%) | 30 (6.4%) |
| Total | 619 (100.0%) | 470 (100.0%) |
Housing Occupancy in Renville County
Occupancy by Ownership in Renville County
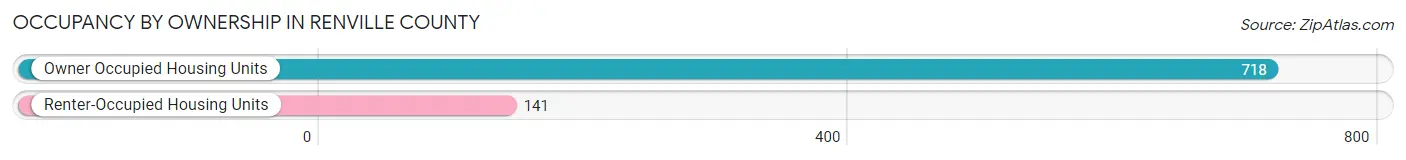
Of the total 859 dwellings in Renville County, owner-occupied units account for 718 (83.6%), while renter-occupied units make up 141 (16.4%).
| Occupancy | # Housing Units | % Housing Units |
| Owner Occupied Housing Units | 718 | 83.6% |
| Renter-Occupied Housing Units | 141 | 16.4% |
| Total Occupied Housing Units | 859 | 100.0% |
Occupancy by Household Size in Renville County

| Household Size | # Housing Units | % Housing Units |
| 1-Person Household | 225 | 26.2% |
| 2-Person Household | 378 | 44.0% |
| 3-Person Household | 113 | 13.2% |
| 4+ Person Household | 143 | 16.7% |
| Total Housing Units | 859 | 100.0% |
Occupancy by Ownership by Household Size in Renville County
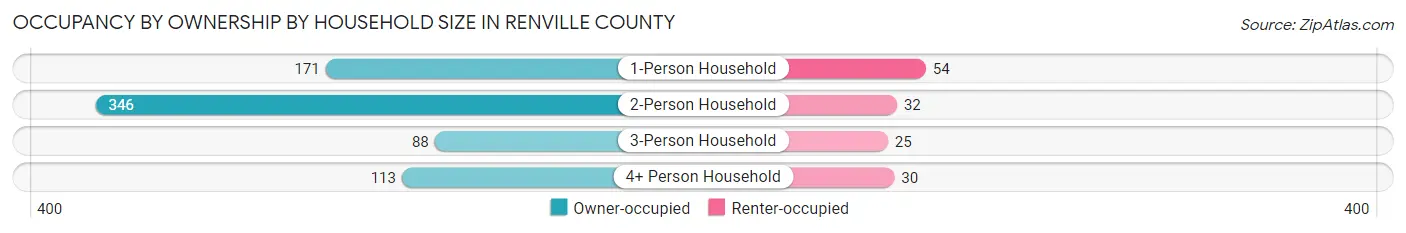
| Household Size | Owner-occupied | Renter-occupied |
| 1-Person Household | 171 (76.0%) | 54 (24.0%) |
| 2-Person Household | 346 (91.5%) | 32 (8.5%) |
| 3-Person Household | 88 (77.9%) | 25 (22.1%) |
| 4+ Person Household | 113 (79.0%) | 30 (21.0%) |
| Total Housing Units | 718 (83.6%) | 141 (16.4%) |
Occupancy by Educational Attainment in Renville County

| Household Size | Owner-occupied | Renter-occupied |
| Less than High School | 28 (93.3%) | 2 (6.7%) |
| High School Diploma | 160 (73.4%) | 58 (26.6%) |
| College/Associate Degree | 331 (88.3%) | 44 (11.7%) |
| Bachelor's Degree or higher | 199 (84.3%) | 37 (15.7%) |
Occupancy by Age of Householder in Renville County

| Age Bracket | # Households | % Households |
| Under 35 Years | 161 | 18.7% |
| 35 to 44 Years | 122 | 14.2% |
| 45 to 54 Years | 156 | 18.2% |
| 55 to 64 Years | 173 | 20.1% |
| 65 to 74 Years | 161 | 18.7% |
| 75 to 84 Years | 62 | 7.2% |
| 85 Years and Over | 24 | 2.8% |
| Total | 859 | 100.0% |
Housing Finances in Renville County
Median Income by Occupancy in Renville County

| Occupancy Type | # Households | Median Income |
| Owner-Occupied | 718 (83.6%) | $88,889 |
| Renter-Occupied | 141 (16.4%) | $45,125 |
| Average | 859 (100.0%) | $77,067 |
Occupancy by Householder Income Bracket in Renville County

| Income Bracket | Owner-occupied | Renter-occupied |
| Less than $5,000 | 9 (1.3%) | 6 (4.3%) |
| $5,000 to $9,999 | 8 (1.1%) | 0 (0.0%) |
| $10,000 to $14,999 | 6 (0.8%) | 10 (7.1%) |
| $15,000 to $19,999 | 25 (3.5%) | 17 (12.1%) |
| $20,000 to $24,999 | 14 (1.9%) | 4 (2.8%) |
| $25,000 to $34,999 | 26 (3.6%) | 23 (16.3%) |
| $35,000 to $49,999 | 58 (8.1%) | 25 (17.7%) |
| $50,000 to $74,999 | 155 (21.6%) | 22 (15.6%) |
| $75,000 to $99,999 | 103 (14.3%) | 5 (3.5%) |
| $100,000 to $149,999 | 201 (28.0%) | 11 (7.8%) |
| $150,000 or more | 113 (15.7%) | 18 (12.8%) |
| Total | 718 (100.0%) | 141 (100.0%) |
Monthly Housing Cost Tiers in Renville County
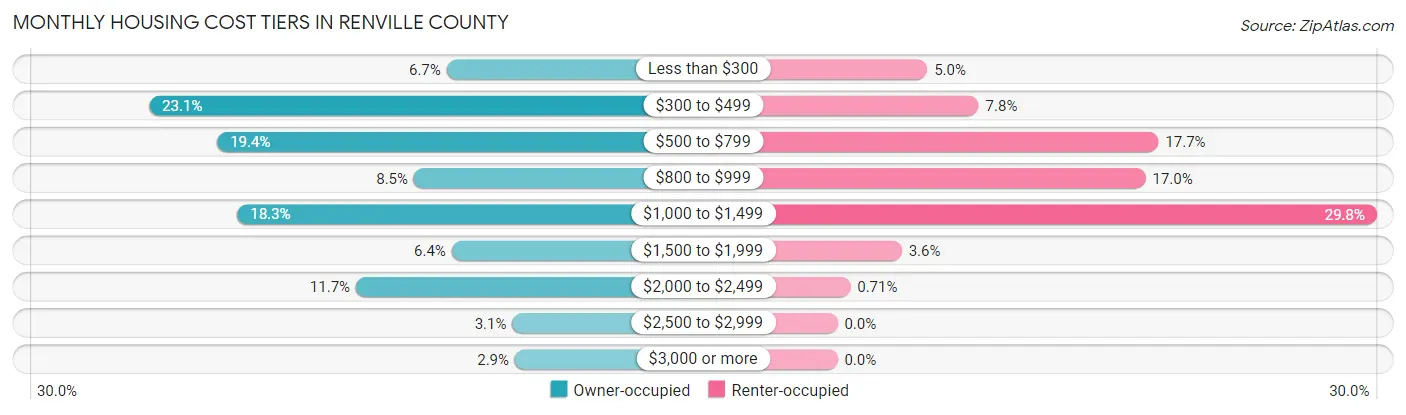
| Monthly Cost | Owner-occupied | Renter-occupied |
| Less than $300 | 48 (6.7%) | 7 (5.0%) |
| $300 to $499 | 166 (23.1%) | 11 (7.8%) |
| $500 to $799 | 139 (19.4%) | 25 (17.7%) |
| $800 to $999 | 61 (8.5%) | 24 (17.0%) |
| $1,000 to $1,499 | 131 (18.2%) | 42 (29.8%) |
| $1,500 to $1,999 | 46 (6.4%) | 5 (3.5%) |
| $2,000 to $2,499 | 84 (11.7%) | 1 (0.7%) |
| $2,500 to $2,999 | 22 (3.1%) | 0 (0.0%) |
| $3,000 or more | 21 (2.9%) | 0 (0.0%) |
| Total | 718 (100.0%) | 141 (100.0%) |
Physical Housing Characteristics in Renville County
Housing Structures in Renville County
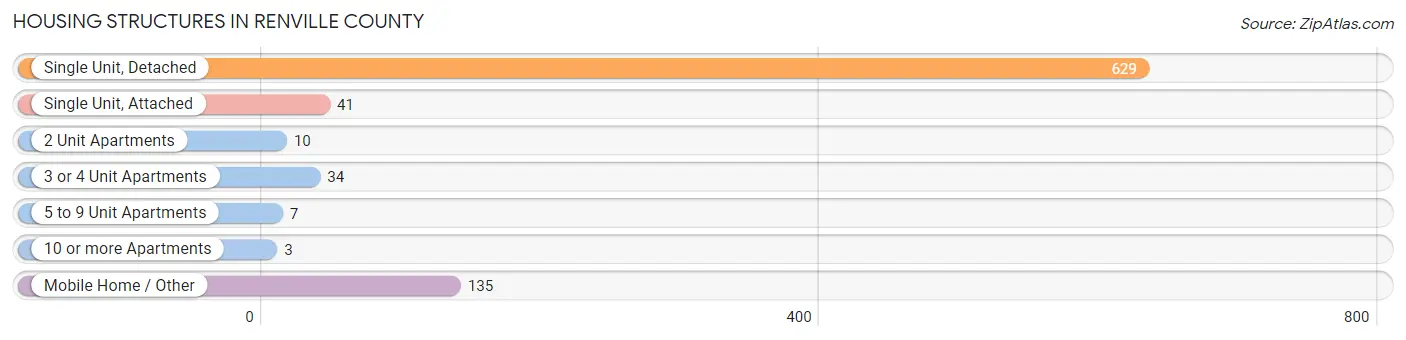
| Structure Type | # Housing Units | % Housing Units |
| Single Unit, Detached | 629 | 73.2% |
| Single Unit, Attached | 41 | 4.8% |
| 2 Unit Apartments | 10 | 1.2% |
| 3 or 4 Unit Apartments | 34 | 4.0% |
| 5 to 9 Unit Apartments | 7 | 0.8% |
| 10 or more Apartments | 3 | 0.4% |
| Mobile Home / Other | 135 | 15.7% |
| Total | 859 | 100.0% |
Housing Structures by Occupancy in Renville County

| Structure Type | Owner-occupied | Renter-occupied |
| Single Unit, Detached | 570 (90.6%) | 59 (9.4%) |
| Single Unit, Attached | 22 (53.7%) | 19 (46.3%) |
| 2 Unit Apartments | 0 (0.0%) | 10 (100.0%) |
| 3 or 4 Unit Apartments | 0 (0.0%) | 34 (100.0%) |
| 5 to 9 Unit Apartments | 0 (0.0%) | 7 (100.0%) |
| 10 or more Apartments | 0 (0.0%) | 3 (100.0%) |
| Mobile Home / Other | 126 (93.3%) | 9 (6.7%) |
| Total | 718 (83.6%) | 141 (16.4%) |
Housing Structures by Number of Rooms in Renville County

| Number of Rooms | Owner-occupied | Renter-occupied |
| 1 Room | 0 (0.0%) | 2 (1.4%) |
| 2 or 3 Rooms | 11 (1.5%) | 26 (18.4%) |
| 4 or 5 Rooms | 161 (22.4%) | 50 (35.5%) |
| 6 or 7 Rooms | 251 (35.0%) | 40 (28.4%) |
| 8 or more Rooms | 295 (41.1%) | 23 (16.3%) |
| Total | 718 (100.0%) | 141 (100.0%) |
Housing Structure by Heating Type in Renville County
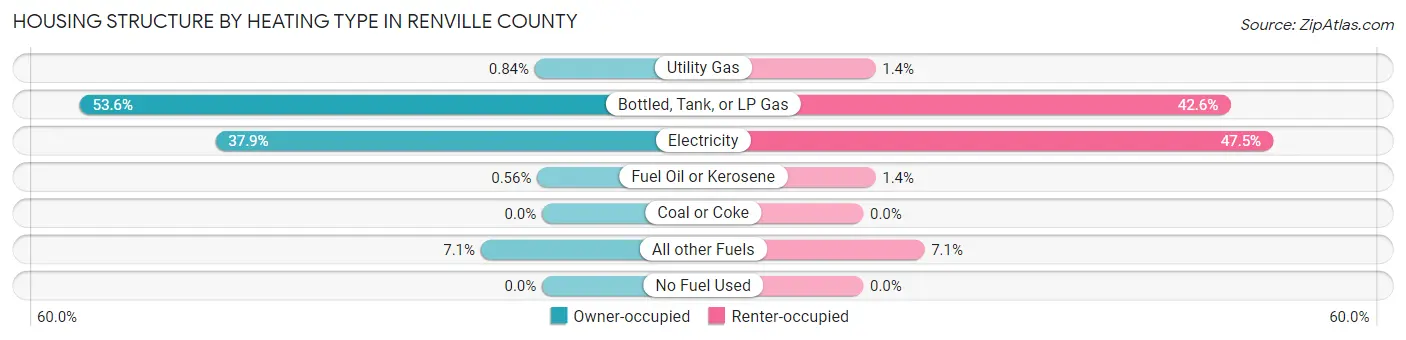
| Heating Type | Owner-occupied | Renter-occupied |
| Utility Gas | 6 (0.8%) | 2 (1.4%) |
| Bottled, Tank, or LP Gas | 385 (53.6%) | 60 (42.5%) |
| Electricity | 272 (37.9%) | 67 (47.5%) |
| Fuel Oil or Kerosene | 4 (0.6%) | 2 (1.4%) |
| Coal or Coke | 0 (0.0%) | 0 (0.0%) |
| All other Fuels | 51 (7.1%) | 10 (7.1%) |
| No Fuel Used | 0 (0.0%) | 0 (0.0%) |
| Total | 718 (100.0%) | 141 (100.0%) |
Household Vehicle Usage in Renville County
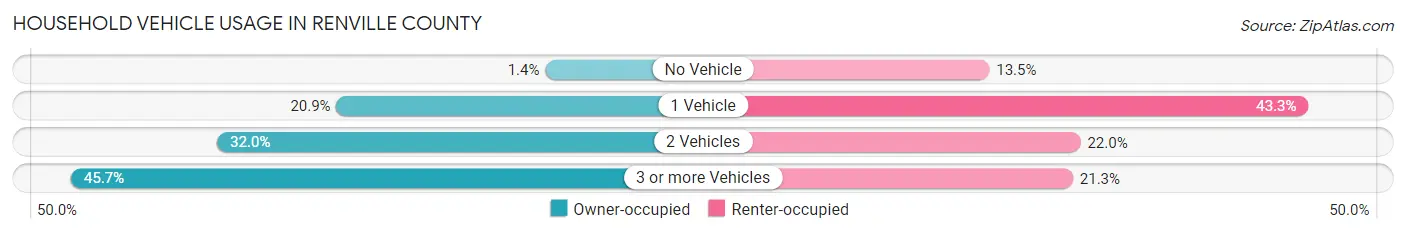
| Vehicles per Household | Owner-occupied | Renter-occupied |
| No Vehicle | 10 (1.4%) | 19 (13.5%) |
| 1 Vehicle | 150 (20.9%) | 61 (43.3%) |
| 2 Vehicles | 230 (32.0%) | 31 (22.0%) |
| 3 or more Vehicles | 328 (45.7%) | 30 (21.3%) |
| Total | 718 (100.0%) | 141 (100.0%) |
Real Estate & Mortgages in Renville County
Real Estate and Mortgage Overview in Renville County
| Characteristic | Without Mortgage | With Mortgage |
| Housing Units | 361 | 357 |
| Median Property Value | $131,600 | $186,800 |
| Median Household Income | $73,674 | $71 |
| Monthly Housing Costs | $488 | $21 |
| Real Estate Taxes | $931 | $15 |
Property Value by Mortgage Status in Renville County

| Property Value | Without Mortgage | With Mortgage |
| Less than $50,000 | 88 (24.4%) | 33 (9.2%) |
| $50,000 to $99,999 | 51 (14.1%) | 29 (8.1%) |
| $100,000 to $299,999 | 170 (47.1%) | 204 (57.1%) |
| $300,000 to $499,999 | 42 (11.6%) | 91 (25.5%) |
| $500,000 to $749,999 | 10 (2.8%) | 0 (0.0%) |
| $750,000 to $999,999 | 0 (0.0%) | 0 (0.0%) |
| $1,000,000 or more | 0 (0.0%) | 0 (0.0%) |
| Total | 361 (100.0%) | 357 (100.0%) |
Household Income by Mortgage Status in Renville County

| Household Income | Without Mortgage | With Mortgage |
| Less than $10,000 | 9 (2.5%) | 0 (0.0%) |
| $10,000 to $24,999 | 19 (5.3%) | 8 (2.2%) |
| $25,000 to $34,999 | 20 (5.5%) | 26 (7.3%) |
| $35,000 to $49,999 | 45 (12.5%) | 6 (1.7%) |
| $50,000 to $74,999 | 105 (29.1%) | 13 (3.6%) |
| $75,000 to $99,999 | 53 (14.7%) | 50 (14.0%) |
| $100,000 to $149,999 | 68 (18.8%) | 50 (14.0%) |
| $150,000 or more | 42 (11.6%) | 133 (37.2%) |
| Total | 361 (100.0%) | 357 (100.0%) |
Property Value to Household Income Ratio in Renville County

| Value-to-Income Ratio | Without Mortgage | With Mortgage |
| Less than 2.0x | 217 (60.1%) | 110,179 (30,862.5%) |
| 2.0x to 2.9x | 42 (11.6%) | 196 (54.9%) |
| 3.0x to 3.9x | 17 (4.7%) | 73 (20.4%) |
| 4.0x or more | 85 (23.5%) | 39 (10.9%) |
| Total | 361 (100.0%) | 357 (100.0%) |
Real Estate Taxes by Mortgage Status in Renville County

| Property Taxes | Without Mortgage | With Mortgage |
| Less than $800 | 126 (34.9%) | 1 (0.3%) |
| $800 to $1,499 | 113 (31.3%) | 119 (33.3%) |
| $800 to $1,499 | 93 (25.8%) | 83 (23.3%) |
| Total | 361 (100.0%) | 357 (100.0%) |
Health & Disability in Renville County
Health Insurance Coverage by Age in Renville County
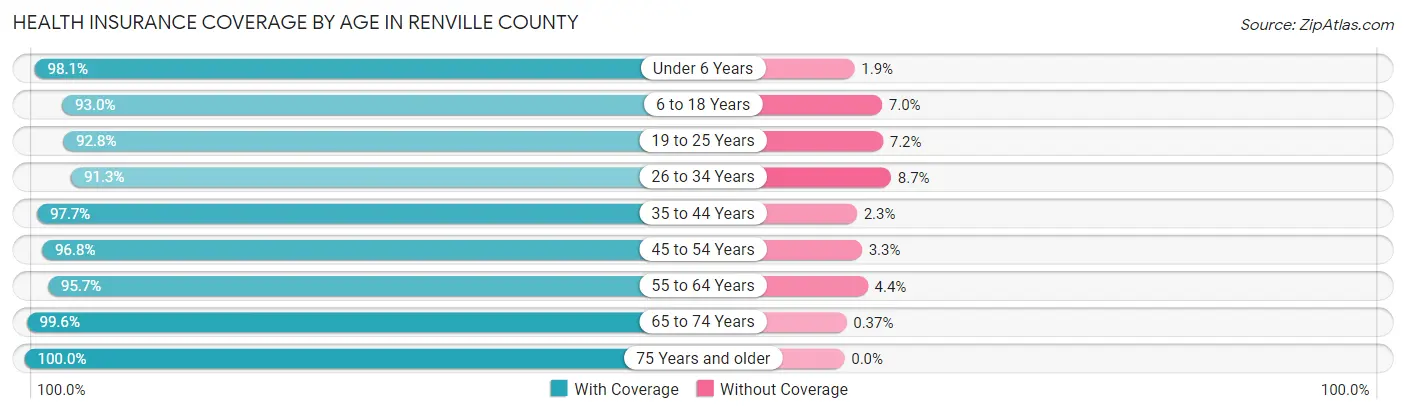
| Age Bracket | With Coverage | Without Coverage |
| Under 6 Years | 157 (98.1%) | 3 (1.9%) |
| 6 to 18 Years | 398 (93.0%) | 30 (7.0%) |
| 19 to 25 Years | 168 (92.8%) | 13 (7.2%) |
| 26 to 34 Years | 221 (91.3%) | 21 (8.7%) |
| 35 to 44 Years | 211 (97.7%) | 5 (2.3%) |
| 45 to 54 Years | 238 (96.8%) | 8 (3.3%) |
| 55 to 64 Years | 308 (95.7%) | 14 (4.3%) |
| 65 to 74 Years | 268 (99.6%) | 1 (0.4%) |
| 75 Years and older | 115 (100.0%) | 0 (0.0%) |
| Total | 2,084 (95.6%) | 95 (4.4%) |
Health Insurance Coverage by Citizenship Status in Renville County

| Citizenship Status | With Coverage | Without Coverage |
| Native Born | 157 (98.1%) | 3 (1.9%) |
| Foreign Born, Citizen | 398 (93.0%) | 30 (7.0%) |
| Foreign Born, not a Citizen | 168 (92.8%) | 13 (7.2%) |
Health Insurance Coverage by Household Income in Renville County

| Household Income | With Coverage | Without Coverage |
| Under $25,000 | 119 (74.8%) | 40 (25.2%) |
| $25,000 to $49,999 | 243 (91.0%) | 24 (9.0%) |
| $50,000 to $74,999 | 376 (99.5%) | 2 (0.5%) |
| $75,000 to $99,999 | 313 (97.2%) | 9 (2.8%) |
| $100,000 and over | 1,033 (98.1%) | 20 (1.9%) |
Public vs Private Health Insurance Coverage by Age in Renville County

| Age Bracket | Public Insurance | Private Insurance |
| Under 6 | 55 (34.4%) | 102 (63.7%) |
| 6 to 18 Years | 48 (11.2%) | 357 (83.4%) |
| 19 to 25 Years | 24 (13.3%) | 144 (79.6%) |
| 25 to 34 Years | 22 (9.1%) | 211 (87.2%) |
| 35 to 44 Years | 45 (20.8%) | 179 (82.9%) |
| 45 to 54 Years | 26 (10.6%) | 226 (91.9%) |
| 55 to 64 Years | 72 (22.4%) | 252 (78.3%) |
| 65 to 74 Years | 245 (91.1%) | 181 (67.3%) |
| 75 Years and over | 113 (98.3%) | 72 (62.6%) |
| Total | 650 (29.8%) | 1,724 (79.1%) |
Disability Status by Sex by Age in Renville County

| Age Bracket | Male | Female |
| Under 5 Years | 0 (0.0%) | 0 (0.0%) |
| 5 to 17 Years | 20 (10.0%) | 1 (0.5%) |
| 18 to 34 Years | 30 (11.9%) | 13 (6.2%) |
| 35 to 64 Years | 38 (9.3%) | 30 (8.0%) |
| 65 to 74 Years | 34 (23.9%) | 16 (12.6%) |
| 75 Years and over | 17 (32.1%) | 24 (38.7%) |
Disability Class by Sex by Age in Renville County
Disability Class: Hearing Difficulty
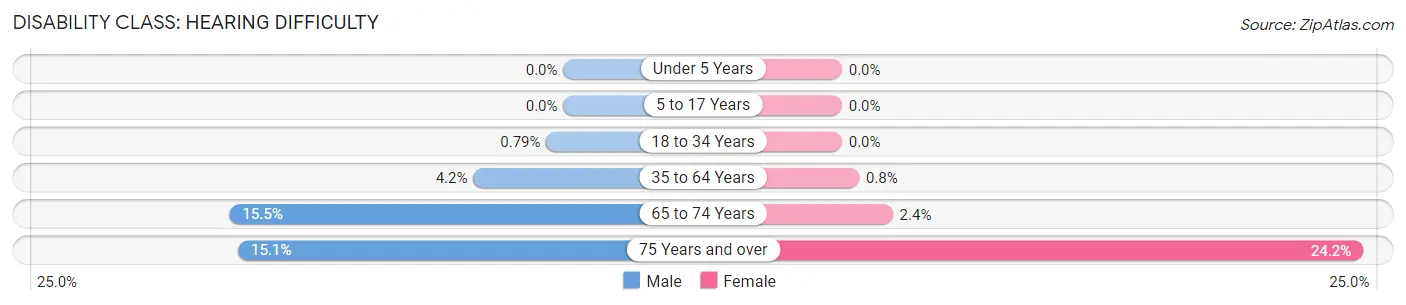
| Age Bracket | Male | Female |
| Under 5 Years | 0 (0.0%) | 0 (0.0%) |
| 5 to 17 Years | 0 (0.0%) | 0 (0.0%) |
| 18 to 34 Years | 2 (0.8%) | 0 (0.0%) |
| 35 to 64 Years | 17 (4.2%) | 3 (0.8%) |
| 65 to 74 Years | 22 (15.5%) | 3 (2.4%) |
| 75 Years and over | 8 (15.1%) | 15 (24.2%) |
Disability Class: Vision Difficulty
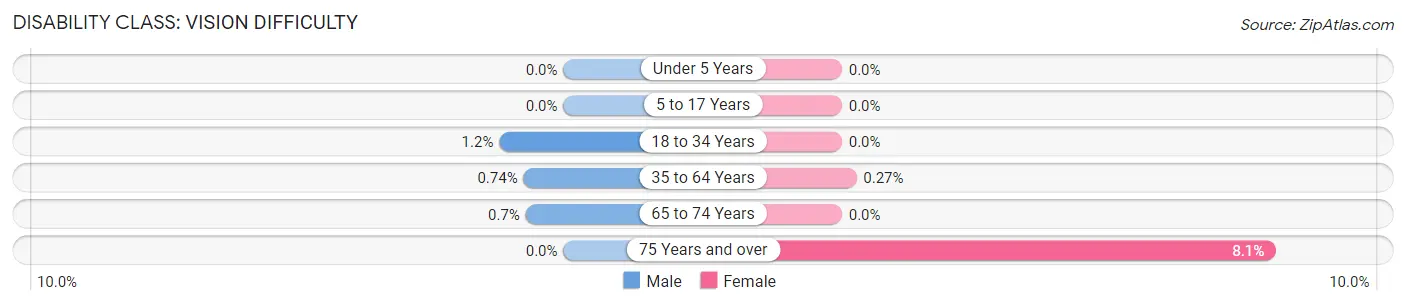
| Age Bracket | Male | Female |
| Under 5 Years | 0 (0.0%) | 0 (0.0%) |
| 5 to 17 Years | 0 (0.0%) | 0 (0.0%) |
| 18 to 34 Years | 3 (1.2%) | 0 (0.0%) |
| 35 to 64 Years | 3 (0.7%) | 1 (0.3%) |
| 65 to 74 Years | 1 (0.7%) | 0 (0.0%) |
| 75 Years and over | 0 (0.0%) | 5 (8.1%) |
Disability Class: Cognitive Difficulty

| Age Bracket | Male | Female |
| 5 to 17 Years | 20 (10.0%) | 1 (0.5%) |
| 18 to 34 Years | 25 (9.9%) | 13 (6.2%) |
| 35 to 64 Years | 9 (2.2%) | 12 (3.2%) |
| 65 to 74 Years | 2 (1.4%) | 6 (4.7%) |
| 75 Years and over | 8 (15.1%) | 15 (24.2%) |
Disability Class: Ambulatory Difficulty
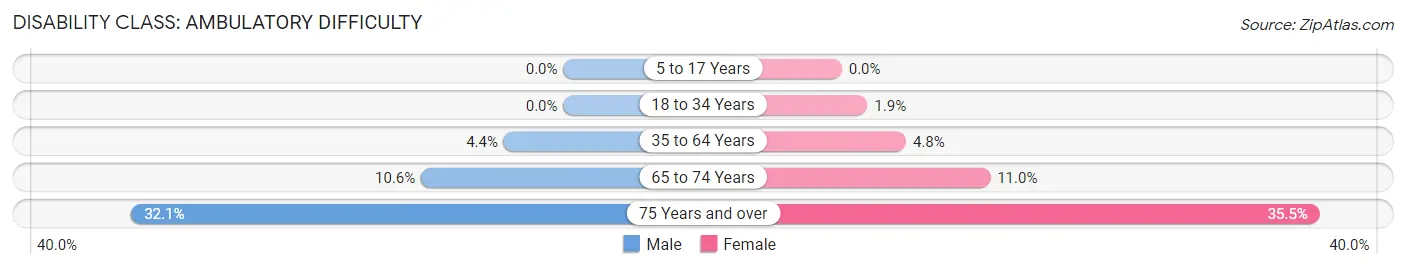
| Age Bracket | Male | Female |
| 5 to 17 Years | 0 (0.0%) | 0 (0.0%) |
| 18 to 34 Years | 0 (0.0%) | 4 (1.9%) |
| 35 to 64 Years | 18 (4.4%) | 18 (4.8%) |
| 65 to 74 Years | 15 (10.6%) | 14 (11.0%) |
| 75 Years and over | 17 (32.1%) | 22 (35.5%) |
Disability Class: Self-Care Difficulty

| Age Bracket | Male | Female |
| 5 to 17 Years | 0 (0.0%) | 0 (0.0%) |
| 18 to 34 Years | 0 (0.0%) | 0 (0.0%) |
| 35 to 64 Years | 4 (1.0%) | 4 (1.1%) |
| 65 to 74 Years | 5 (3.5%) | 6 (4.7%) |
| 75 Years and over | 8 (15.1%) | 5 (8.1%) |
Technology Access in Renville County
Computing Device Access in Renville County

| Device Type | # Households | % Households |
| Desktop or Laptop | 744 | 86.6% |
| Smartphone | 782 | 91.0% |
| Tablet | 589 | 68.6% |
| No Computing Device | 13 | 1.5% |
| Total | 859 | 100.0% |
Internet Access in Renville County

| Internet Type | # Households | % Households |
| Dial-Up Internet | 2 | 0.2% |
| Broadband Home | 703 | 81.8% |
| Cellular Data Only | 63 | 7.3% |
| Satellite Internet | 74 | 8.6% |
| No Internet | 55 | 6.4% |
| Total | 859 | 100.0% |
Renville County Summary
Renville County is located in the north-central region of North Dakota, United States. It is bordered by McHenry County to the north, Ward County to the east, Mountrail County to the south, and Burke County to the west. The county seat is Mohall, and the largest city is Sherwood. The county was created in 1873 and named for Joseph Renville, a French-Canadian fur trader and interpreter.
Geography
Renville County covers an area of 1,845 square miles, making it the fourth-largest county in North Dakota. The terrain is mostly flat, with rolling hills in the east and south. The county is drained by the Souris River, which flows through the county from east to west. The county is also home to several small lakes, including Lake Darling, Lake Audubon, and Lake Sakakawea.
Climate
Renville County has a humid continental climate, with cold winters and hot summers. The average annual temperature is 45°F, and the average annual precipitation is 17 inches.
Demographics
As of the 2010 census, there were 4,719 people, 1,945 households, and 1,323 families living in Renville County. The population density was 2.5 people per square mile. The racial makeup of the county was 97.2% White, 0.3% African American, 0.5% Native American, 0.2% Asian, 0.1% Pacific Islander, 0.7% from other races, and 0.9% from two or more races. Hispanic or Latino of any race were 1.7% of the population.
Economy
Renville County's economy is largely based on agriculture. The county is home to several large farms, and the main crops grown are wheat, barley, oats, and hay. The county is also home to several oil and gas fields, and the oil and gas industry is a major employer in the area. Other industries in the county include manufacturing, retail, and tourism.
History
Renville County was created in 1873 and named for Joseph Renville, a French-Canadian fur trader and interpreter. The county was originally part of Ward County, but was split off in 1873. The county seat was originally located in the town of Renville, but was moved to Mohall in 1883.
In the early 1900s, the county experienced a population boom due to the discovery of oil and gas in the area. The population peaked in 1930, when it reached 10,000. The population has since declined, and as of the 2010 census, it was 4,719.
Renville County has a long history of agriculture, and the county is still home to several large farms. The county is also home to several oil and gas fields, and the oil and gas industry is a major employer in the area. Other industries in the county include manufacturing, retail, and tourism.
Common Questions
What is the Total Population of Renville County?
Total Population of Renville County is 2,282.
What is the Total Male Population of Renville County?
Total Male Population of Renville County is 1,205.
What is the Total Female Population of Renville County?
Total Female Population of Renville County is 1,077.
What is the Ratio of Males per 100 Females in Renville County?
There are 111.88 Males per 100 Females in Renville County.
What is the Ratio of Females per 100 Males in Renville County?
There are 89.38 Females per 100 Males in Renville County.
What is the Median Population Age in Renville County?
Median Population Age in Renville County is 38.2 Years.
What is the Average Family Size in Renville County
Average Family Size in Renville County is 3.1 People.
What is the Average Household Size in Renville County
Average Household Size in Renville County is 2.6 People.
What is Per Capita Income in Renville County?
Per Capita income in Renville County is $37,370.
What is the Median Family Income in Renville County?
Median Family Income in Renville County is $94,167.
What is the Median Household income in Renville County?
Median Household Income in Renville County is $77,067.
What is Income or Wage Gap in Renville County?
Income or Wage Gap in Renville County is 49.8%.
Women in Renville County earn 50.2 cents for every dollar earned by a man.
What is Inequality or Gini Index in Renville County?
Inequality or Gini Index in Renville County is 0.36.
How Large is the Labor Force in Renville County?
There are 1,198 People in the Labor Forcein in Renville County.
What is the Percentage of People in the Labor Force in Renville County?
66.5% of People are in the Labor Force in Renville County.
What is the Unemployment Rate in Renville County?
Unemployment Rate in Renville County is 2.3%.