Ransom County, ND
Ransom County Map
Ransom County Overview
5,663
TOTAL POPULATION
2,912
MALE POPULATION
2,751
FEMALE POPULATION
105.85
MALES / 100 FEMALES
94.47
FEMALES / 100 MALES
42.7
MEDIAN AGE
3.0
AVG FAMILY SIZE
2.3
AVG HOUSEHOLD SIZE
$36,706
PER CAPITA INCOME
$89,663
AVG FAMILY INCOME
$71,462
AVG HOUSEHOLD INCOME
37.6%
WAGE / INCOME GAP [ % ]
62.4¢/ $1
WAGE / INCOME GAP [ $ ]
0.41
INEQUALITY / GINI INDEX
2,784
LABOR FORCE [ PEOPLE ]
61.2%
PERCENT IN LABOR FORCE
2.9%
UNEMPLOYMENT RATE
Ransom County Area Codes
Race in Ransom County
The most populous races in Ransom County are White / Caucasian (5,117 | 90.4%), Two or more Races (280 | 4.9%), and Black / African American (125 | 2.2%).
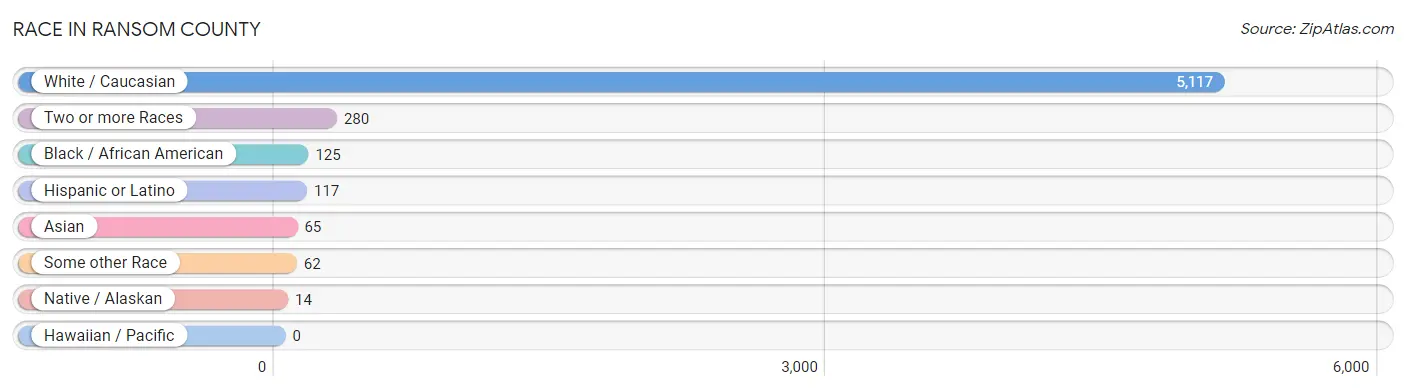
| Race | # Population | % Population |
| Asian | 65 | 1.1% |
| Black / African American | 125 | 2.2% |
| Hawaiian / Pacific | 0 | 0.0% |
| Hispanic or Latino | 117 | 2.1% |
| Native / Alaskan | 14 | 0.3% |
| White / Caucasian | 5,117 | 90.4% |
| Two or more Races | 280 | 4.9% |
| Some other Race | 62 | 1.1% |
| Total | 5,663 | 100.0% |
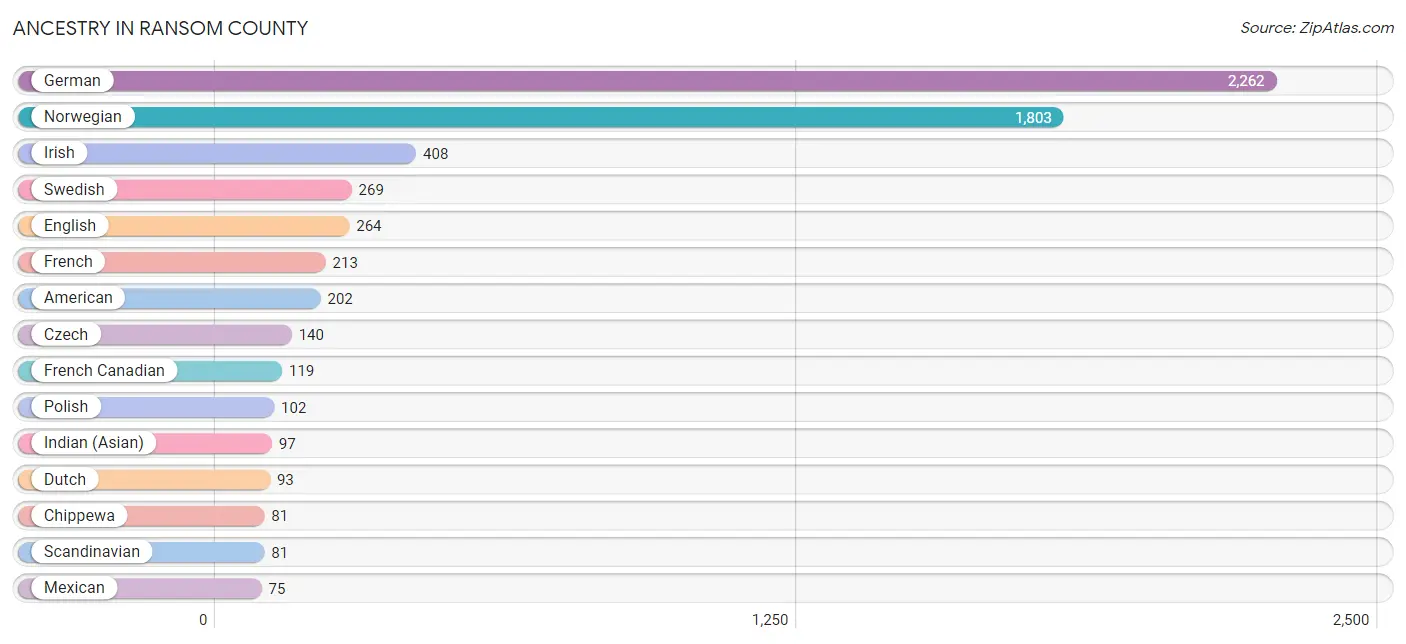
Ancestry in Ransom County
The most populous ancestries reported in Ransom County are German (2,262 | 39.9%), Norwegian (1,803 | 31.8%), Irish (408 | 7.2%), Swedish (269 | 4.8%), and English (264 | 4.7%), together accounting for 88.4% of all Ransom County residents.
| Ancestry | # Population | % Population |
| African | 8 | 0.1% |
| American | 202 | 3.6% |
| Australian | 7 | 0.1% |
| Austrian | 10 | 0.2% |
| Belgian | 3 | 0.1% |
| Blackfeet | 4 | 0.1% |
| British | 7 | 0.1% |
| Burmese | 29 | 0.5% |
| Canadian | 4 | 0.1% |
| Cherokee | 2 | 0.0% |
| Cheyenne | 1 | 0.0% |
| Chippewa | 81 | 1.4% |
| Colombian | 6 | 0.1% |
| Cuban | 12 | 0.2% |
| Czech | 140 | 2.5% |
| Czechoslovakian | 3 | 0.1% |
| Danish | 58 | 1.0% |
| Dutch | 93 | 1.6% |
| English | 264 | 4.7% |
| European | 16 | 0.3% |
| French | 213 | 3.8% |
| French American Indian | 4 | 0.1% |
| French Canadian | 119 | 2.1% |
| German | 2,262 | 39.9% |
| German Russian | 1 | 0.0% |
| Greek | 4 | 0.1% |
| Hungarian | 6 | 0.1% |
| Icelander | 29 | 0.5% |
| Indian (Asian) | 97 | 1.7% |
| Iranian | 8 | 0.1% |
| Irish | 408 | 7.2% |
| Italian | 23 | 0.4% |
| Kiowa | 5 | 0.1% |
| Korean | 29 | 0.5% |
| Mexican | 75 | 1.3% |
| Norwegian | 1,803 | 31.8% |
| Pakistani | 9 | 0.2% |
| Polish | 102 | 1.8% |
| Russian | 33 | 0.6% |
| Scandinavian | 81 | 1.4% |
| Scotch-Irish | 54 | 0.9% |
| Scottish | 29 | 0.5% |
| South American | 6 | 0.1% |
| Subsaharan African | 8 | 0.1% |
| Swedish | 269 | 4.8% |
| Swiss | 5 | 0.1% |
| Ukrainian | 2 | 0.0% |
| Welsh | 2 | 0.0% |
| Yugoslavian | 38 | 0.7% | View All 49 Rows |
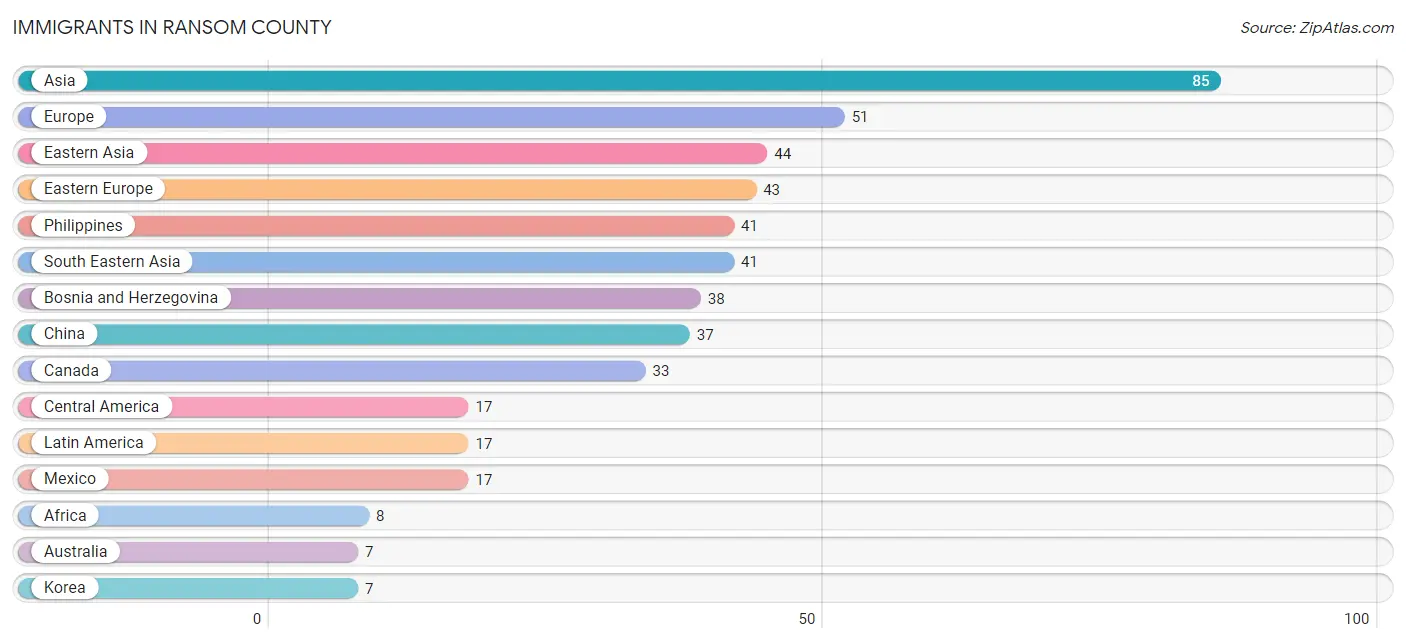
Immigrants in Ransom County
The most numerous immigrant groups reported in Ransom County came from Asia (85 | 1.5%), Europe (51 | 0.9%), Eastern Asia (44 | 0.8%), Eastern Europe (43 | 0.8%), and Philippines (41 | 0.7%), together accounting for 4.7% of all Ransom County residents.
| Immigration Origin | # Population | % Population |
| Africa | 8 | 0.1% |
| Asia | 85 | 1.5% |
| Australia | 7 | 0.1% |
| Bosnia and Herzegovina | 38 | 0.7% |
| Canada | 33 | 0.6% |
| Central America | 17 | 0.3% |
| China | 37 | 0.6% |
| Eastern Asia | 44 | 0.8% |
| Eastern Europe | 43 | 0.8% |
| England | 2 | 0.0% |
| Europe | 51 | 0.9% |
| Italy | 6 | 0.1% |
| Korea | 7 | 0.1% |
| Latin America | 17 | 0.3% |
| Latvia | 5 | 0.1% |
| Mexico | 17 | 0.3% |
| Northern Europe | 2 | 0.0% |
| Oceania | 7 | 0.1% |
| Philippines | 41 | 0.7% |
| South Eastern Asia | 41 | 0.7% |
| Southern Europe | 6 | 0.1% | View All 21 Rows |
Sex and Age in Ransom County
Sex and Age in Ransom County
The most populous age groups in Ransom County are 15 to 19 Years (251 | 8.6%) for men and 60 to 64 Years (264 | 9.6%) for women.
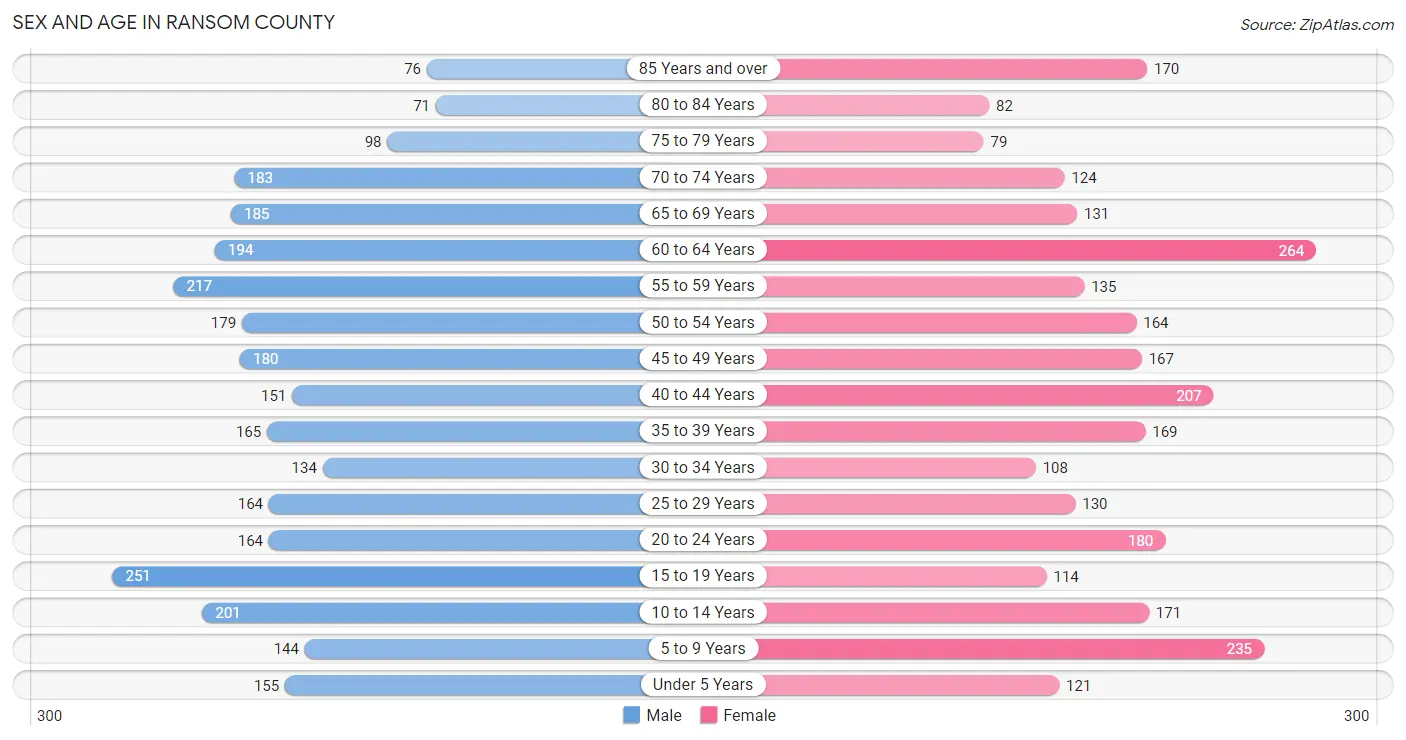
| Age Bracket | Male | Female |
| Under 5 Years | 155 (5.3%) | 121 (4.4%) |
| 5 to 9 Years | 144 (5.0%) | 235 (8.5%) |
| 10 to 14 Years | 201 (6.9%) | 171 (6.2%) |
| 15 to 19 Years | 251 (8.6%) | 114 (4.1%) |
| 20 to 24 Years | 164 (5.6%) | 180 (6.5%) |
| 25 to 29 Years | 164 (5.6%) | 130 (4.7%) |
| 30 to 34 Years | 134 (4.6%) | 108 (3.9%) |
| 35 to 39 Years | 165 (5.7%) | 169 (6.1%) |
| 40 to 44 Years | 151 (5.2%) | 207 (7.5%) |
| 45 to 49 Years | 180 (6.2%) | 167 (6.1%) |
| 50 to 54 Years | 179 (6.1%) | 164 (6.0%) |
| 55 to 59 Years | 217 (7.4%) | 135 (4.9%) |
| 60 to 64 Years | 194 (6.7%) | 264 (9.6%) |
| 65 to 69 Years | 185 (6.4%) | 131 (4.8%) |
| 70 to 74 Years | 183 (6.3%) | 124 (4.5%) |
| 75 to 79 Years | 98 (3.4%) | 79 (2.9%) |
| 80 to 84 Years | 71 (2.4%) | 82 (3.0%) |
| 85 Years and over | 76 (2.6%) | 170 (6.2%) |
| Total | 2,912 (100.0%) | 2,751 (100.0%) |
Families and Households in Ransom County
Median Family Size in Ransom County
The median family size in Ransom County is 2.98 persons per family, with single female/mother families (138 | 9.6%) accounting for the largest median family size of 3.13 persons per family. On the other hand, single male/father families (59 | 4.1%) represent the smallest median family size with 2.88 persons per family.
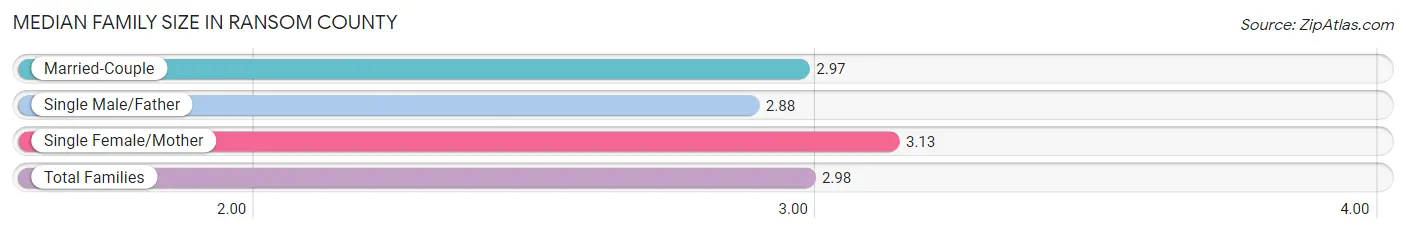
| Family Type | # Families | Family Size |
| Married-Couple | 1,242 (86.3%) | 2.97 |
| Single Male/Father | 59 (4.1%) | 2.88 |
| Single Female/Mother | 138 (9.6%) | 3.13 |
| Total Families | 1,439 (100.0%) | 2.98 |
Median Household Size in Ransom County
The median household size in Ransom County is 2.30 persons per household, with single female/mother households (138 | 5.9%) accounting for the largest median household size of 3.55 persons per household. non-family households (908 | 38.7%) represent the smallest median household size with 1.11 persons per household.
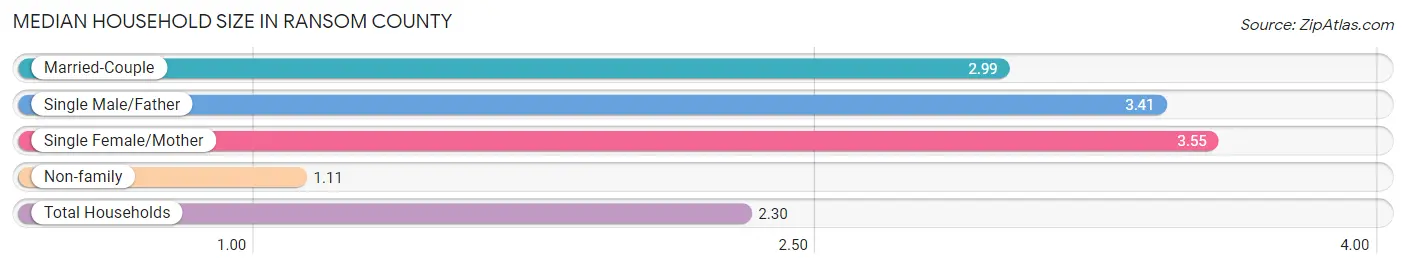
| Household Type | # Households | Household Size |
| Married-Couple | 1,242 (52.9%) | 2.99 |
| Single Male/Father | 59 (2.5%) | 3.41 |
| Single Female/Mother | 138 (5.9%) | 3.55 |
| Non-family | 908 (38.7%) | 1.11 |
| Total Households | 2,347 (100.0%) | 2.30 |
Household Size by Marriage Status in Ransom County
Out of a total of 2,347 households in Ransom County, 1,439 (61.3%) are family households, while 908 (38.7%) are nonfamily households. The most numerous type of family households are 2-person households, comprising 677, and the most common type of nonfamily households are 1-person households, comprising 819.
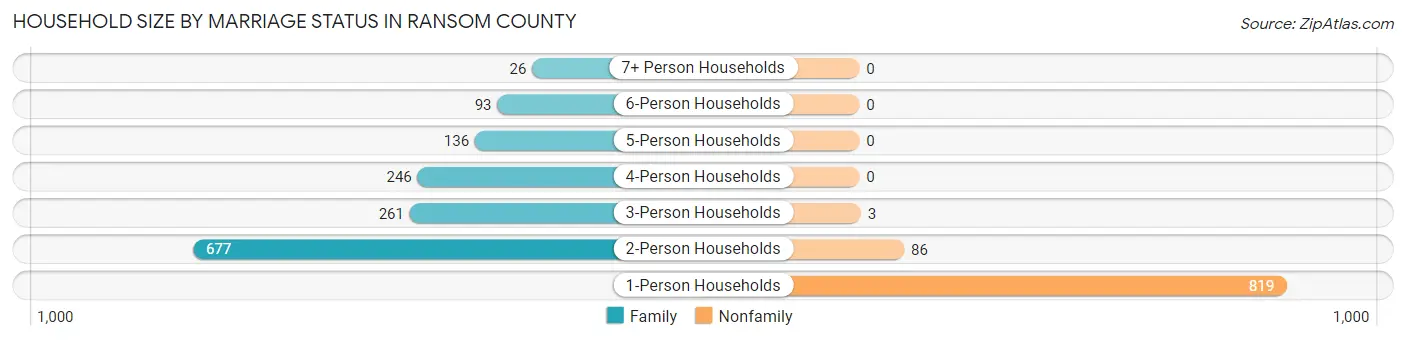
| Household Size | Family Households | Nonfamily Households |
| 1-Person Households | - | 819 (34.9%) |
| 2-Person Households | 677 (28.8%) | 86 (3.7%) |
| 3-Person Households | 261 (11.1%) | 3 (0.1%) |
| 4-Person Households | 246 (10.5%) | 0 (0.0%) |
| 5-Person Households | 136 (5.8%) | 0 (0.0%) |
| 6-Person Households | 93 (4.0%) | 0 (0.0%) |
| 7+ Person Households | 26 (1.1%) | 0 (0.0%) |
| Total | 1,439 (61.3%) | 908 (38.7%) |
Female Fertility in Ransom County
Fertility by Age in Ransom County
Average fertility rate in Ransom County is 34.0 births per 1,000 women. Women in the age bracket of 20 to 34 years have the highest fertility rate with 89.0 births per 1,000 women. Women in the age bracket of 20 to 34 years acount for 100.0% of all women with births.
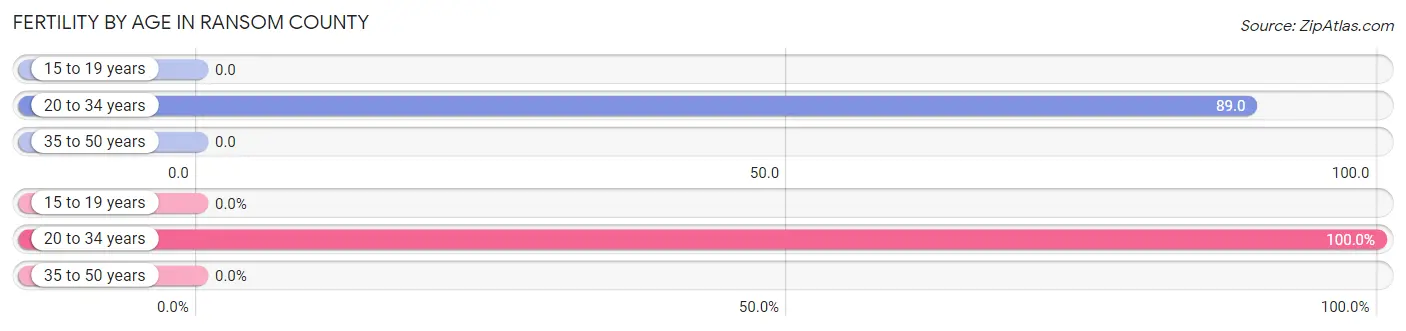
| Age Bracket | Women with Births | Births / 1,000 Women |
| 15 to 19 years | 0 (0.0%) | 0.0 |
| 20 to 34 years | 37 (100.0%) | 89.0 |
| 35 to 50 years | 0 (0.0%) | 0.0 |
| Total | 37 (100.0%) | 34.0 |
Fertility by Age by Marriage Status in Ransom County
67.6% of women with births (37) in Ransom County are married. The highest percentage of unmarried women with births falls into 20 to 34 years age bracket with 32.4% of them unmarried at the time of birth, while the lowest percentage of unmarried women with births belong to 20 to 34 years age bracket with 32.4% of them unmarried.
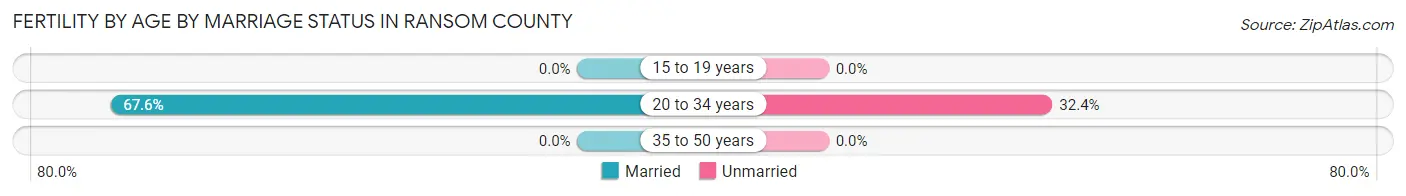
| Age Bracket | Married | Unmarried |
| 15 to 19 years | 0 (0.0%) | 0 (0.0%) |
| 20 to 34 years | 25 (67.6%) | 12 (32.4%) |
| 35 to 50 years | 0 (0.0%) | 0 (0.0%) |
| Total | 25 (67.6%) | 12 (32.4%) |
Fertility by Education in Ransom County
Average fertility rate in Ransom County is 34.0 births per 1,000 women. Women with the education attainment of graduate degree have the highest fertility rate of 81.0 births per 1,000 women, while women with the education attainment of less than high school have the lowest fertility at 13.0 births per 1,000 women. Women with the education attainment of college or associate's degree represent 37.8% of all women with births.
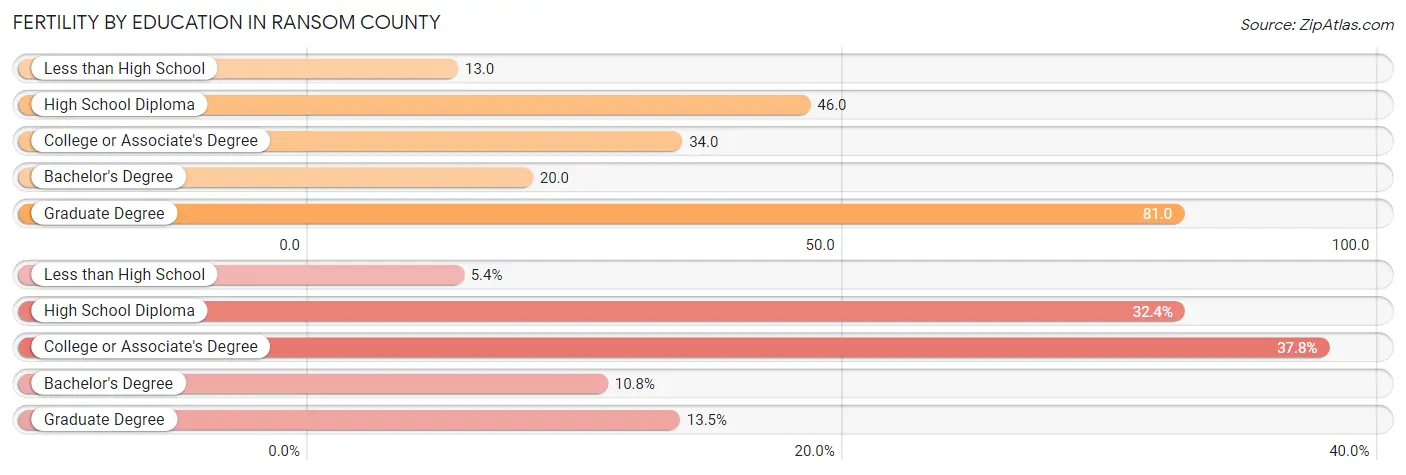
| Educational Attainment | Women with Births | Births / 1,000 Women |
| Less than High School | 2 (5.4%) | 13.0 |
| High School Diploma | 12 (32.4%) | 46.0 |
| College or Associate's Degree | 14 (37.8%) | 34.0 |
| Bachelor's Degree | 4 (10.8%) | 20.0 |
| Graduate Degree | 5 (13.5%) | 81.0 |
| Total | 37 (100.0%) | 34.0 |
Fertility by Education by Marriage Status in Ransom County
32.4% of women with births in Ransom County are unmarried. Women with the educational attainment of less than high school are most likely to be married with 100.0% of them married at childbirth, while women with the educational attainment of high school diploma are least likely to be married with 100.0% of them unmarried at childbirth.
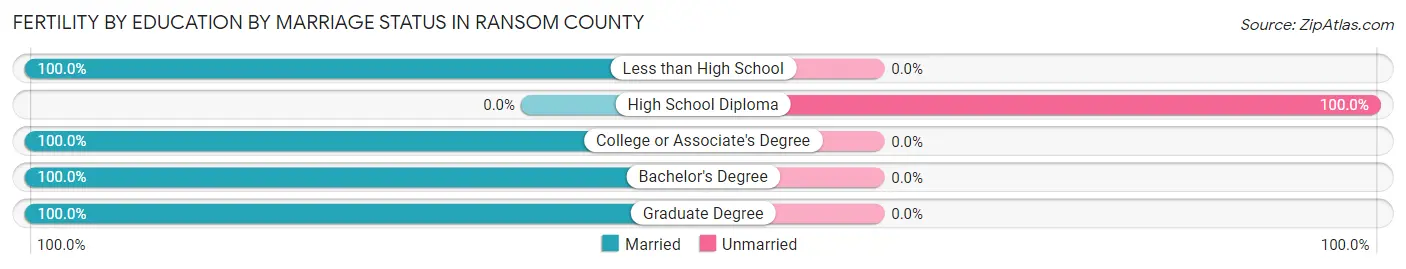
| Educational Attainment | Married | Unmarried |
| Less than High School | 2 (100.0%) | 0 (0.0%) |
| High School Diploma | 0 (0.0%) | 12 (100.0%) |
| College or Associate's Degree | 14 (100.0%) | 0 (0.0%) |
| Bachelor's Degree | 4 (100.0%) | 0 (0.0%) |
| Graduate Degree | 5 (100.0%) | 0 (0.0%) |
| Total | 25 (67.6%) | 12 (32.4%) |
Income in Ransom County
Income Overview in Ransom County
Per Capita Income in Ransom County is $36,706, while median incomes of families and households are $89,663 and $71,462 respectively.
| Characteristic | Number | Measure |
| Per Capita Income | 5,663 | $36,706 |
| Median Family Income | 1,439 | $89,663 |
| Mean Family Income | 1,439 | $100,859 |
| Median Household Income | 2,347 | $71,462 |
| Mean Household Income | 2,347 | $85,458 |
| Income Deficit | 1,439 | $0 |
| Wage / Income Gap (%) | 5,663 | 37.58% |
| Wage / Income Gap ($) | 5,663 | 62.42¢ per $1 |
| Gini / Inequality Index | 5,663 | 0.41 |
Earnings by Sex in Ransom County
Average Earnings in Ransom County are $39,500, $48,375 for men and $30,197 for women, a difference of 37.6%.
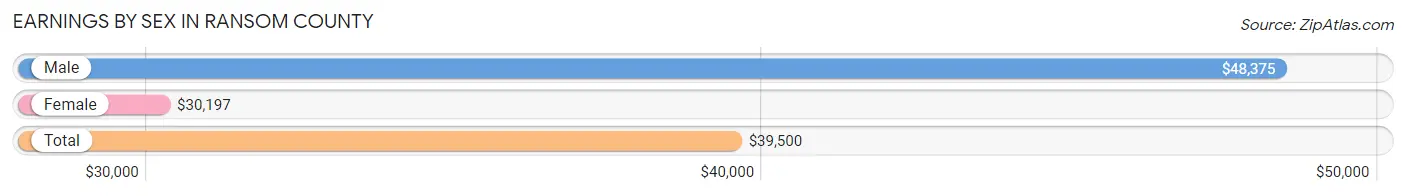
| Sex | Number | Average Earnings |
| Male | 1,631 (54.7%) | $48,375 |
| Female | 1,349 (45.3%) | $30,197 |
| Total | 2,980 (100.0%) | $39,500 |
Earnings by Sex by Income Bracket in Ransom County
The most common earnings brackets in Ransom County are $100,000+ for men (205 | 12.6%) and $25,000 to $29,999 for women (131 | 9.7%).
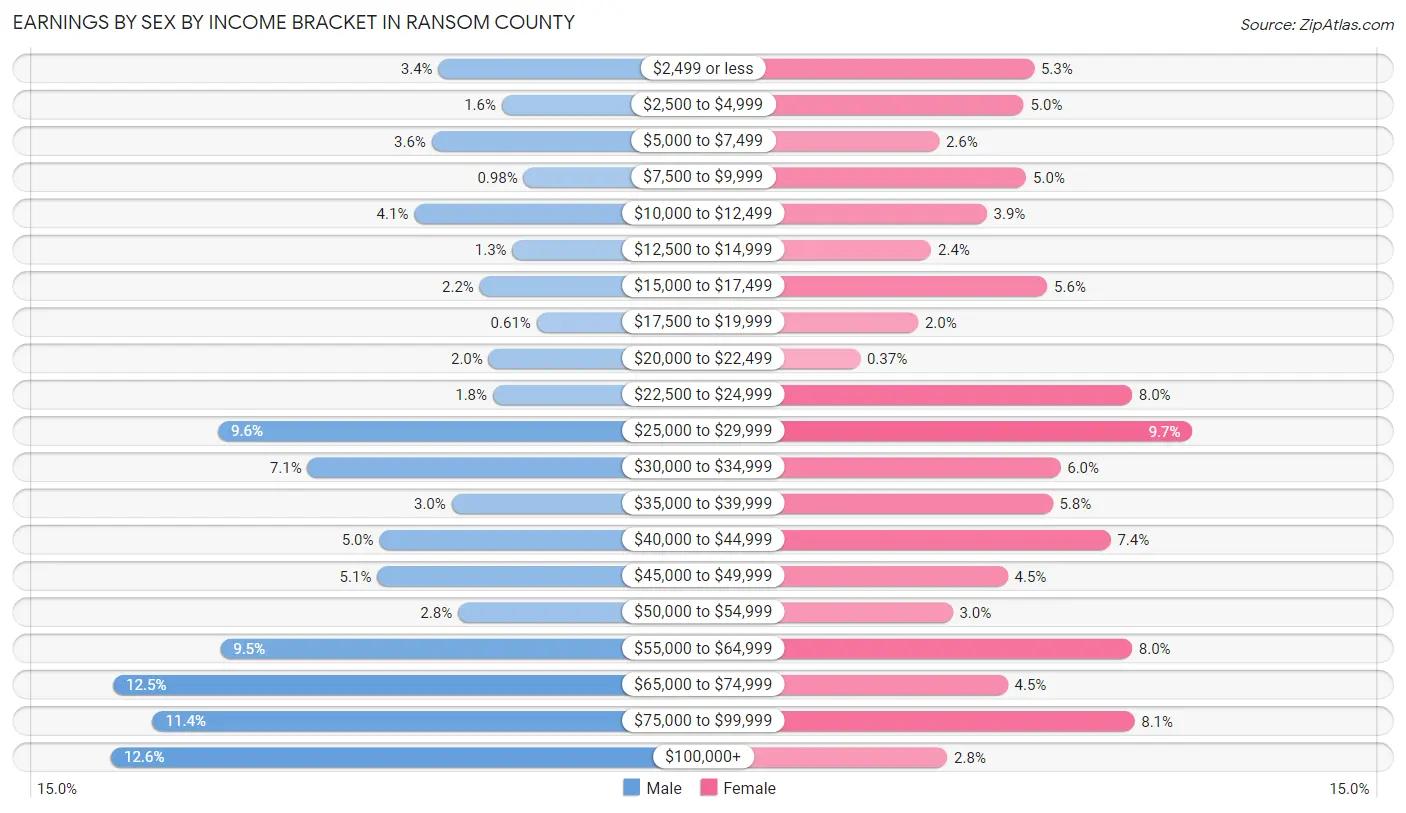
| Income | Male | Female |
| $2,499 or less | 55 (3.4%) | 71 (5.3%) |
| $2,500 to $4,999 | 26 (1.6%) | 67 (5.0%) |
| $5,000 to $7,499 | 58 (3.6%) | 35 (2.6%) |
| $7,500 to $9,999 | 16 (1.0%) | 68 (5.0%) |
| $10,000 to $12,499 | 66 (4.1%) | 53 (3.9%) |
| $12,500 to $14,999 | 21 (1.3%) | 32 (2.4%) |
| $15,000 to $17,499 | 36 (2.2%) | 76 (5.6%) |
| $17,500 to $19,999 | 10 (0.6%) | 27 (2.0%) |
| $20,000 to $22,499 | 32 (2.0%) | 5 (0.4%) |
| $22,500 to $24,999 | 30 (1.8%) | 108 (8.0%) |
| $25,000 to $29,999 | 156 (9.6%) | 131 (9.7%) |
| $30,000 to $34,999 | 115 (7.0%) | 81 (6.0%) |
| $35,000 to $39,999 | 49 (3.0%) | 78 (5.8%) |
| $40,000 to $44,999 | 82 (5.0%) | 100 (7.4%) |
| $45,000 to $49,999 | 83 (5.1%) | 61 (4.5%) |
| $50,000 to $54,999 | 46 (2.8%) | 40 (3.0%) |
| $55,000 to $64,999 | 155 (9.5%) | 108 (8.0%) |
| $65,000 to $74,999 | 204 (12.5%) | 61 (4.5%) |
| $75,000 to $99,999 | 186 (11.4%) | 109 (8.1%) |
| $100,000+ | 205 (12.6%) | 38 (2.8%) |
| Total | 1,631 (100.0%) | 1,349 (100.0%) |
Earnings by Sex by Educational Attainment in Ransom County
Average earnings in Ransom County are $57,949 for men and $35,255 for women, a difference of 39.2%. Men with an educational attainment of bachelor's degree enjoy the highest average annual earnings of $87,383, while those with less than high school education earn the least with $31,447. Women with an educational attainment of graduate degree earn the most with the average annual earnings of $58,068, while those with less than high school education have the smallest earnings of $22,569.
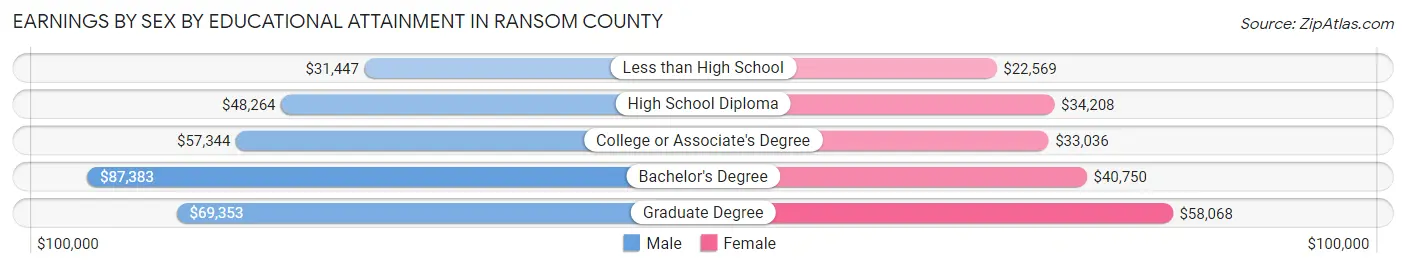
| Educational Attainment | Male Income | Female Income |
| Less than High School | $31,447 | $22,569 |
| High School Diploma | $48,264 | $34,208 |
| College or Associate's Degree | $57,344 | $33,036 |
| Bachelor's Degree | $87,383 | $40,750 |
| Graduate Degree | $69,353 | $58,068 |
| Total | $57,949 | $35,255 |
Family Income in Ransom County
Family Income Brackets in Ransom County
According to the Ransom County family income data, there are 368 families falling into the $100,000 to $149,999 income range, which is the most common income bracket and makes up 25.6% of all families. Conversely, the $15,000 to $24,999 income bracket is the least frequent group with only 12 families (0.8%) belonging to this category.
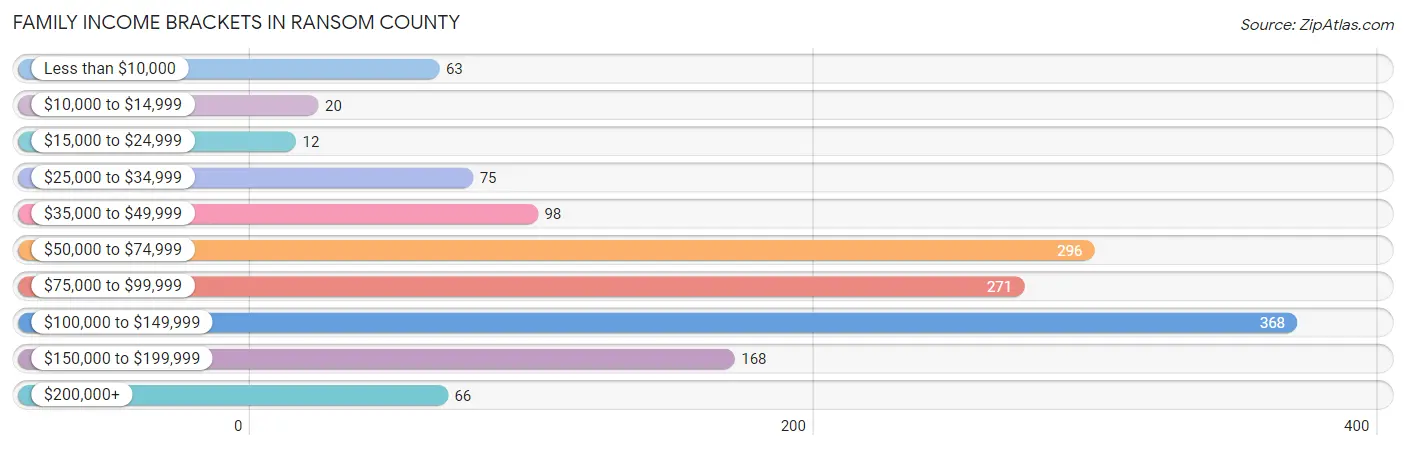
| Income Bracket | # Families | % Families |
| Less than $10,000 | 63 | 4.4% |
| $10,000 to $14,999 | 20 | 1.4% |
| $15,000 to $24,999 | 12 | 0.8% |
| $25,000 to $34,999 | 75 | 5.2% |
| $35,000 to $49,999 | 98 | 6.8% |
| $50,000 to $74,999 | 296 | 20.6% |
| $75,000 to $99,999 | 271 | 18.8% |
| $100,000 to $149,999 | 368 | 25.6% |
| $150,000 to $199,999 | 168 | 11.7% |
| $200,000+ | 66 | 4.6% |
Family Income by Famaliy Size in Ransom County
7+ person families (10 | 0.7%) account for the highest median family income in Ransom County with $164,000 per family, while 2-person families (719 | 50.0%) have the highest median income of $41,010 per family member.
| Income Bracket | # Families | Median Income |
| 2-Person Families | 719 (50.0%) | $82,019 |
| 3-Person Families | 240 (16.7%) | $99,688 |
| 4-Person Families | 235 (16.3%) | $103,958 |
| 5-Person Families | 133 (9.2%) | $92,054 |
| 6-Person Families | 102 (7.1%) | $2,499 |
| 7+ Person Families | 10 (0.7%) | $164,000 |
| Total | 1,439 (100.0%) | $89,663 |
Family Income by Number of Earners in Ransom County
The median family income in Ransom County is $89,663, with families comprising 3+ earners (172) having the highest median family income of $147,857, while families with no earners (245) have the lowest median family income of $47,228, accounting for 11.9% and 17.0% of families, respectively.
| Number of Earners | # Families | Median Income |
| No Earners | 245 (17.0%) | $47,228 |
| 1 Earner | 379 (26.3%) | $60,096 |
| 2 Earners | 643 (44.7%) | $101,838 |
| 3+ Earners | 172 (11.9%) | $147,857 |
| Total | 1,439 (100.0%) | $89,663 |
Household Income in Ransom County
Household Income Brackets in Ransom County
With 512 households falling in the category, the $50,000 to $74,999 income range is the most frequent in Ransom County, accounting for 21.8% of all households. In contrast, only 47 households (2.0%) fall into the $10,000 to $14,999 income bracket, making it the least populous group.
| Income Bracket | # Households | % Households |
| Less than $10,000 | 108 | 4.6% |
| $10,000 to $14,999 | 47 | 2.0% |
| $15,000 to $24,999 | 214 | 9.1% |
| $25,000 to $34,999 | 157 | 6.7% |
| $35,000 to $49,999 | 232 | 9.9% |
| $50,000 to $74,999 | 512 | 21.8% |
| $75,000 to $99,999 | 338 | 14.4% |
| $100,000 to $149,999 | 458 | 19.5% |
| $150,000 to $199,999 | 195 | 8.3% |
| $200,000+ | 84 | 3.6% |
Household Income by Householder Age in Ransom County
The median household income in Ransom County is $71,462, with the highest median household income of $89,632 found in the 45 to 64 years age bracket for the primary householder. A total of 785 households (33.5%) fall into this category. Meanwhile, the 15 to 24 years age bracket for the primary householder has the lowest median household income of $0, with 159 households (6.8%) in this group.
| Income Bracket | # Households | Median Income |
| 15 to 24 Years | 159 (6.8%) | $0 |
| 25 to 44 Years | 660 (28.1%) | $83,857 |
| 45 to 64 Years | 785 (33.5%) | $89,632 |
| 65+ Years | 743 (31.7%) | $51,490 |
| Total | 2,347 (100.0%) | $71,462 |
Poverty in Ransom County
Income Below Poverty by Sex and Age in Ransom County
With 7.7% poverty level for males and 12.3% for females among the residents of Ransom County, under 5 year old males and 5 year old females are the most vulnerable to poverty, with 41 males (26.8%) and 13 females (44.8%) in their respective age groups living below the poverty level.
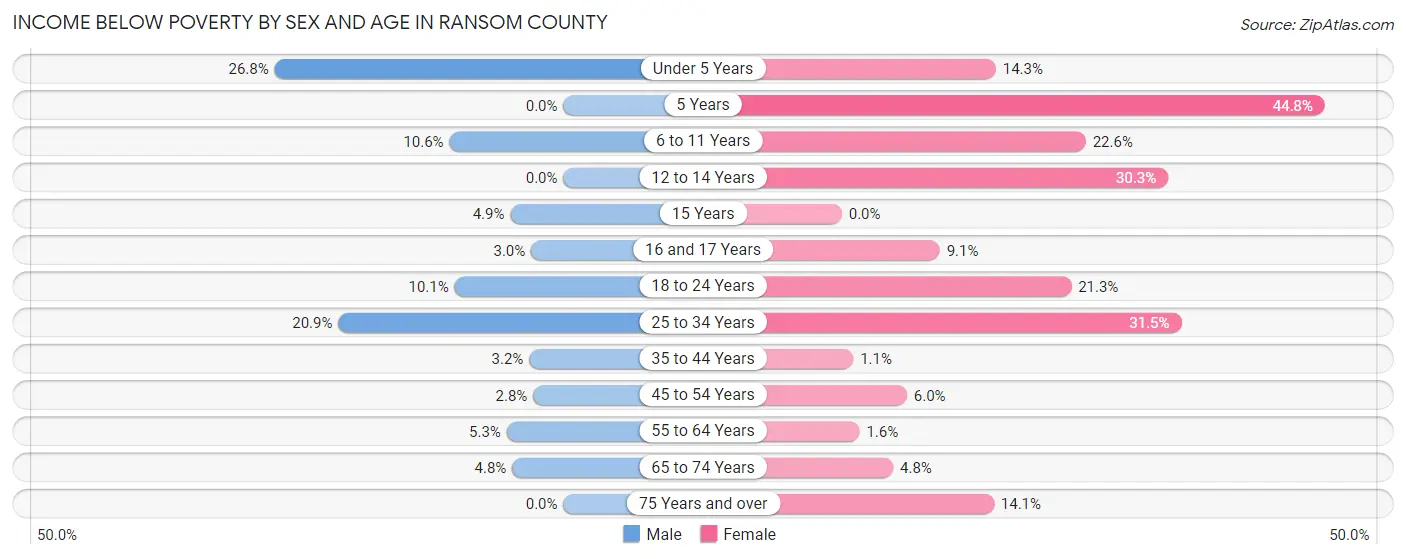
| Age Bracket | Male | Female |
| Under 5 Years | 41 (26.8%) | 17 (14.3%) |
| 5 Years | 0 (0.0%) | 13 (44.8%) |
| 6 to 11 Years | 24 (10.6%) | 60 (22.6%) |
| 12 to 14 Years | 0 (0.0%) | 33 (30.3%) |
| 15 Years | 3 (4.9%) | 0 (0.0%) |
| 16 and 17 Years | 2 (3.0%) | 6 (9.1%) |
| 18 to 24 Years | 29 (10.1%) | 43 (21.3%) |
| 25 to 34 Years | 61 (20.9%) | 75 (31.5%) |
| 35 to 44 Years | 10 (3.2%) | 4 (1.1%) |
| 45 to 54 Years | 10 (2.8%) | 20 (6.0%) |
| 55 to 64 Years | 21 (5.3%) | 6 (1.6%) |
| 65 to 74 Years | 17 (4.8%) | 12 (4.8%) |
| 75 Years and over | 0 (0.0%) | 35 (14.1%) |
| Total | 218 (7.7%) | 324 (12.3%) |
Income Above Poverty by Sex and Age in Ransom County
According to the poverty statistics in Ransom County, males aged 5 years and females aged 15 years are the age groups that are most secure financially, with 100.0% of males and 100.0% of females in these age groups living above the poverty line.
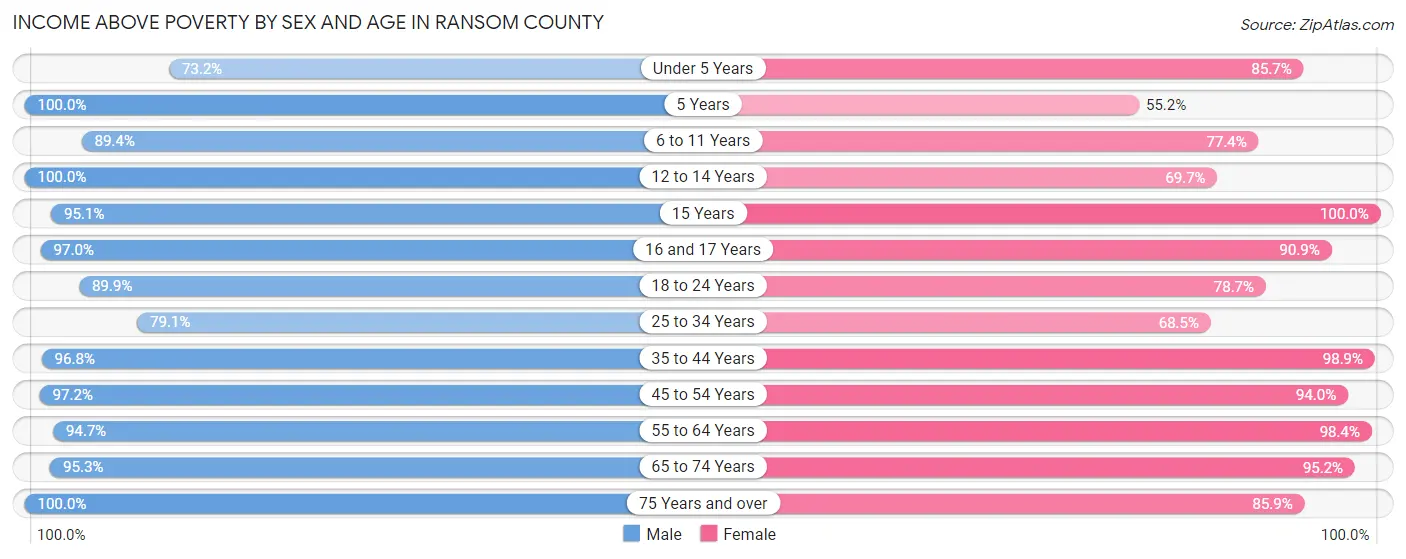
| Age Bracket | Male | Female |
| Under 5 Years | 112 (73.2%) | 102 (85.7%) |
| 5 Years | 20 (100.0%) | 16 (55.2%) |
| 6 to 11 Years | 203 (89.4%) | 205 (77.4%) |
| 12 to 14 Years | 96 (100.0%) | 76 (69.7%) |
| 15 Years | 58 (95.1%) | 26 (100.0%) |
| 16 and 17 Years | 65 (97.0%) | 60 (90.9%) |
| 18 to 24 Years | 258 (89.9%) | 159 (78.7%) |
| 25 to 34 Years | 231 (79.1%) | 163 (68.5%) |
| 35 to 44 Years | 305 (96.8%) | 372 (98.9%) |
| 45 to 54 Years | 347 (97.2%) | 311 (94.0%) |
| 55 to 64 Years | 378 (94.7%) | 360 (98.4%) |
| 65 to 74 Years | 341 (95.3%) | 240 (95.2%) |
| 75 Years and over | 204 (100.0%) | 213 (85.9%) |
| Total | 2,618 (92.3%) | 2,303 (87.7%) |
Income Below Poverty Among Married-Couple Families in Ransom County
The poverty statistics for married-couple families in Ransom County show that 5.6% or 69 of the total 1,242 families live below the poverty line. Families with 3 or 4 children have the highest poverty rate of 32.1%, comprising of 52 families. On the other hand, families with 5 or more children have the lowest poverty rate of 0.0%, which includes 0 families.
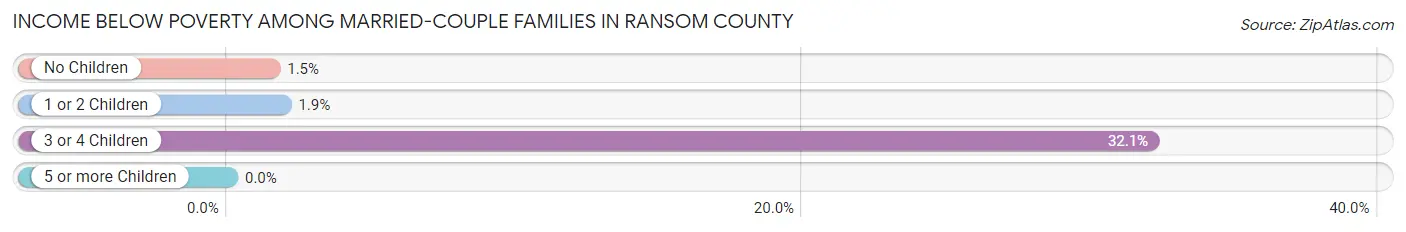
| Children | Above Poverty | Below Poverty |
| No Children | 739 (98.5%) | 11 (1.5%) |
| 1 or 2 Children | 317 (98.1%) | 6 (1.9%) |
| 3 or 4 Children | 110 (67.9%) | 52 (32.1%) |
| 5 or more Children | 7 (100.0%) | 0 (0.0%) |
| Total | 1,173 (94.4%) | 69 (5.6%) |
Income Below Poverty Among Single-Parent Households in Ransom County
According to the poverty data in Ransom County, 3.4% or 2 single-father households and 21.0% or 29 single-mother households are living below the poverty line. Among single-father households, those with no children have the highest poverty rate, with 2 households (20.0%) experiencing poverty. Likewise, among single-mother households, those with 3 or 4 children have the highest poverty rate, with 16 households (39.0%) falling below the poverty line.
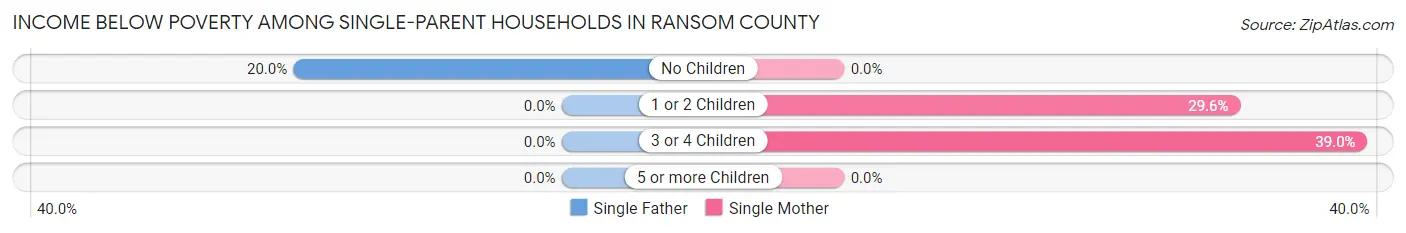
| Children | Single Father | Single Mother |
| No Children | 2 (20.0%) | 0 (0.0%) |
| 1 or 2 Children | 0 (0.0%) | 13 (29.5%) |
| 3 or 4 Children | 0 (0.0%) | 16 (39.0%) |
| 5 or more Children | 0 (0.0%) | 0 (0.0%) |
| Total | 2 (3.4%) | 29 (21.0%) |
Income Below Poverty Among Married-Couple vs Single-Parent Households in Ransom County
The poverty data for Ransom County shows that 69 of the married-couple family households (5.6%) and 31 of the single-parent households (15.7%) are living below the poverty level. Within the married-couple family households, those with 3 or 4 children have the highest poverty rate, with 52 households (32.1%) falling below the poverty line. Among the single-parent households, those with 3 or 4 children have the highest poverty rate, with 16 household (31.4%) living below poverty.
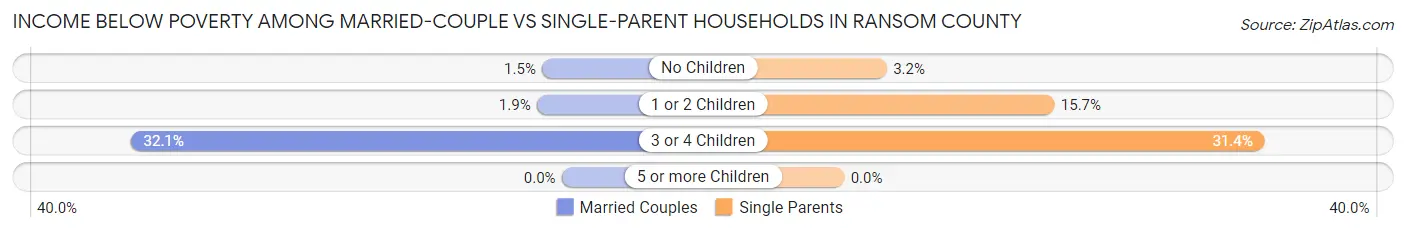
| Children | Married-Couple Families | Single-Parent Households |
| No Children | 11 (1.5%) | 2 (3.2%) |
| 1 or 2 Children | 6 (1.9%) | 13 (15.7%) |
| 3 or 4 Children | 52 (32.1%) | 16 (31.4%) |
| 5 or more Children | 0 (0.0%) | 0 (0.0%) |
| Total | 69 (5.6%) | 31 (15.7%) |
Employment Characteristics in Ransom County
Employment by Class of Employer in Ransom County
Among the 2,688 employed individuals in Ransom County, private company employees (1,606 | 59.8%), self-employed (not incorporated) (271 | 10.1%), and local government employees (220 | 8.2%) make up the most common classes of employment.
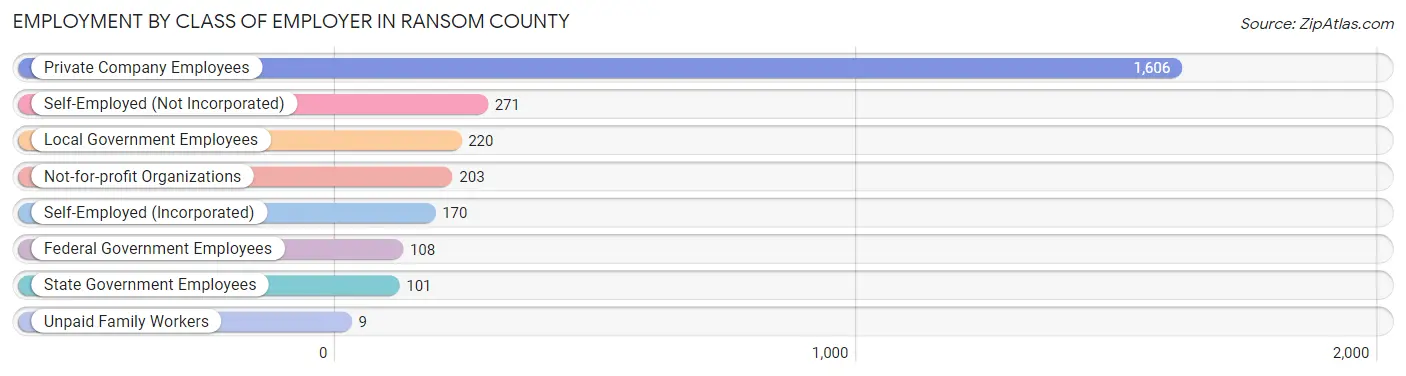
| Employer Class | # Employees | % Employees |
| Private Company Employees | 1,606 | 59.8% |
| Self-Employed (Incorporated) | 170 | 6.3% |
| Self-Employed (Not Incorporated) | 271 | 10.1% |
| Not-for-profit Organizations | 203 | 7.5% |
| Local Government Employees | 220 | 8.2% |
| State Government Employees | 101 | 3.8% |
| Federal Government Employees | 108 | 4.0% |
| Unpaid Family Workers | 9 | 0.3% |
| Total | 2,688 | 100.0% |
Employment Status by Age in Ransom County
According to the labor force statistics for Ransom County, out of the total population over 16 years of age (4,549), 61.2% or 2,784 individuals are in the labor force, with 2.9% or 81 of them unemployed. The age group with the highest labor force participation rate is 20 to 24 years, with 96.2% or 331 individuals in the labor force. Within the labor force, the 25 to 29 years age range has the highest percentage of unemployed individuals, with 19.0% or 48 of them being unemployed.
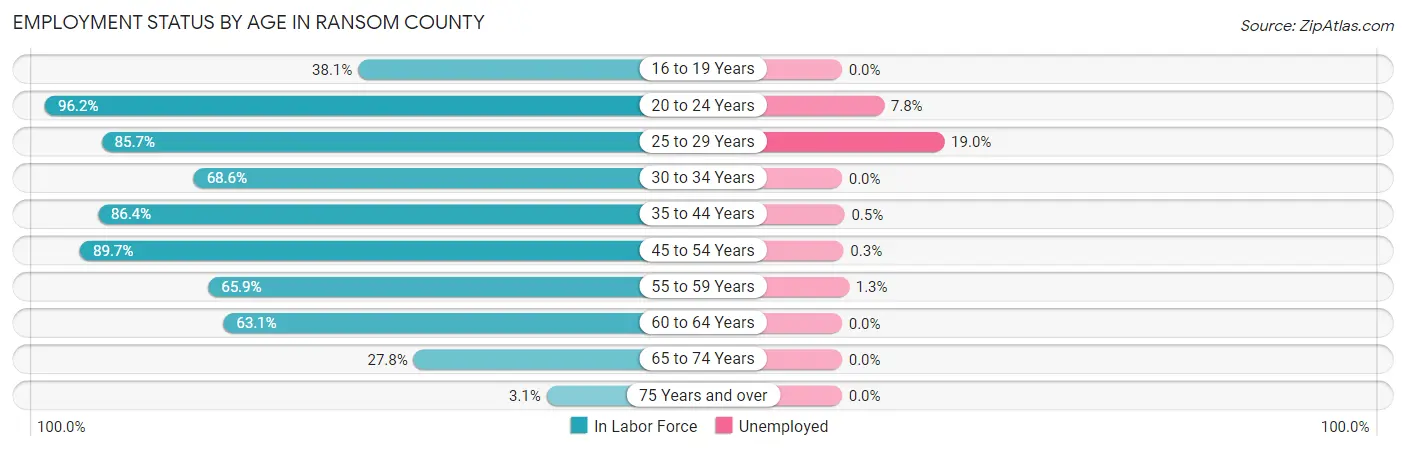
| Age Bracket | In Labor Force | Unemployed |
| 16 to 19 Years | 106 (38.1%) | 0 (0.0%) |
| 20 to 24 Years | 331 (96.2%) | 26 (7.8%) |
| 25 to 29 Years | 252 (85.7%) | 48 (19.0%) |
| 30 to 34 Years | 166 (68.6%) | 0 (0.0%) |
| 35 to 44 Years | 598 (86.4%) | 3 (0.5%) |
| 45 to 54 Years | 619 (89.7%) | 2 (0.3%) |
| 55 to 59 Years | 232 (65.9%) | 3 (1.3%) |
| 60 to 64 Years | 289 (63.1%) | 0 (0.0%) |
| 65 to 74 Years | 173 (27.8%) | 0 (0.0%) |
| 75 Years and over | 18 (3.1%) | 0 (0.0%) |
| Total | 2,784 (61.2%) | 81 (2.9%) |
Employment Status by Educational Attainment in Ransom County
According to labor force statistics for Ransom County, 79.0% of individuals (2,155) out of the total population between 25 and 64 years of age (2,728) are in the labor force, with 2.6% or 56 of them being unemployed. The group with the highest labor force participation rate are those with the educational attainment of bachelor's degree or higher, with 86.5% or 533 individuals in the labor force. Within the labor force, individuals with high school diploma education have the highest percentage of unemployment, with 8.1% or 52 of them being unemployed.
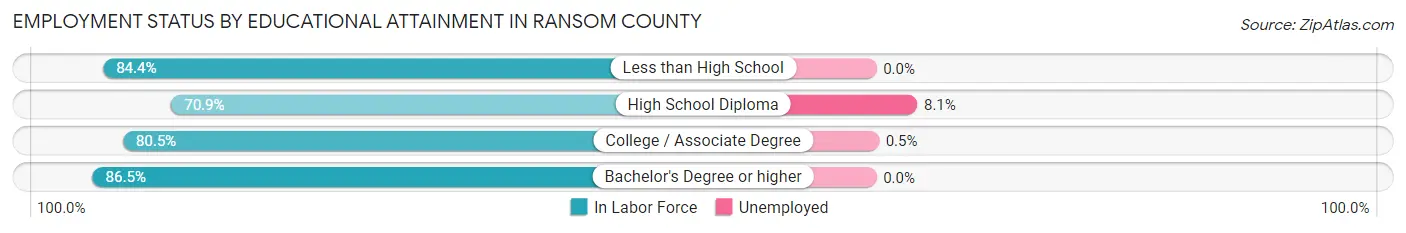
| Educational Attainment | In Labor Force | Unemployed |
| Less than High School | 205 (84.4%) | 0 (0.0%) |
| High School Diploma | 644 (70.9%) | 74 (8.1%) |
| College / Associate Degree | 774 (80.5%) | 5 (0.5%) |
| Bachelor's Degree or higher | 533 (86.5%) | 0 (0.0%) |
| Total | 2,155 (79.0%) | 71 (2.6%) |
Employment Occupations by Sex in Ransom County
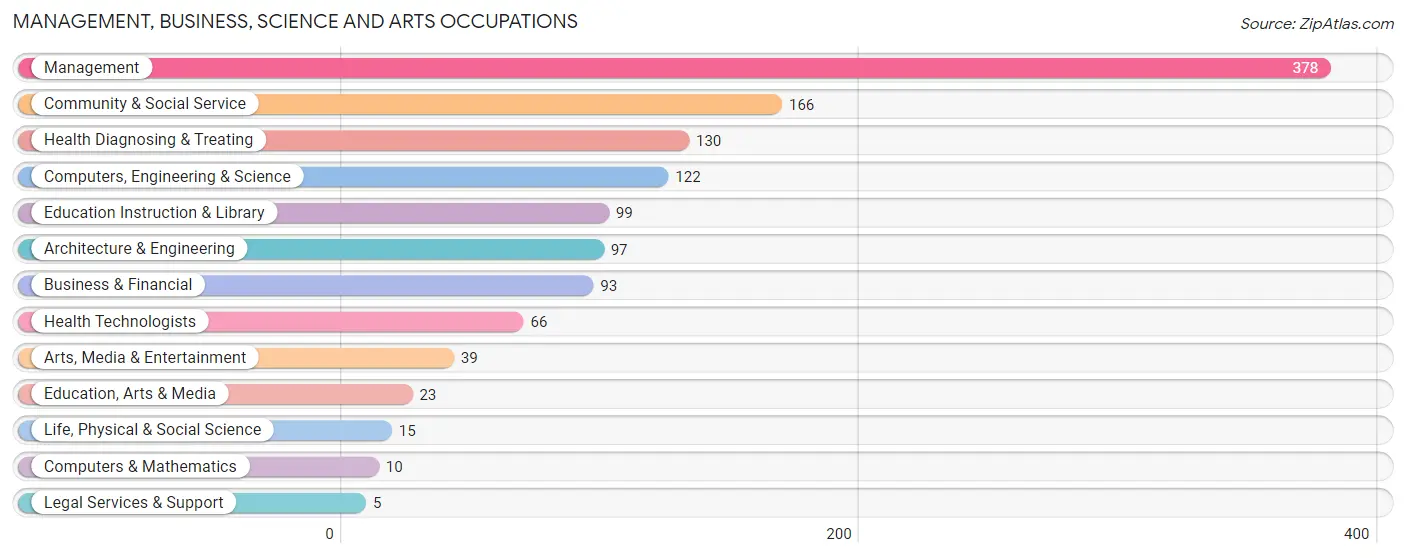
Management, Business, Science and Arts Occupations
The most common Management, Business, Science and Arts occupations in Ransom County are Management (378 | 14.1%), Community & Social Service (166 | 6.2%), Health Diagnosing & Treating (130 | 4.9%), Computers, Engineering & Science (122 | 4.5%), and Education Instruction & Library (99 | 3.7%).
Management, Business, Science and Arts Occupations by Sex
Within the Management, Business, Science and Arts occupations in Ransom County, the most male-oriented occupations are Computers & Mathematics (100.0%), Arts, Media & Entertainment (94.9%), and Legal Services & Support (80.0%), while the most female-oriented occupations are Health Diagnosing & Treating (92.3%), Education, Arts & Media (91.3%), and Health Technologists (84.9%).
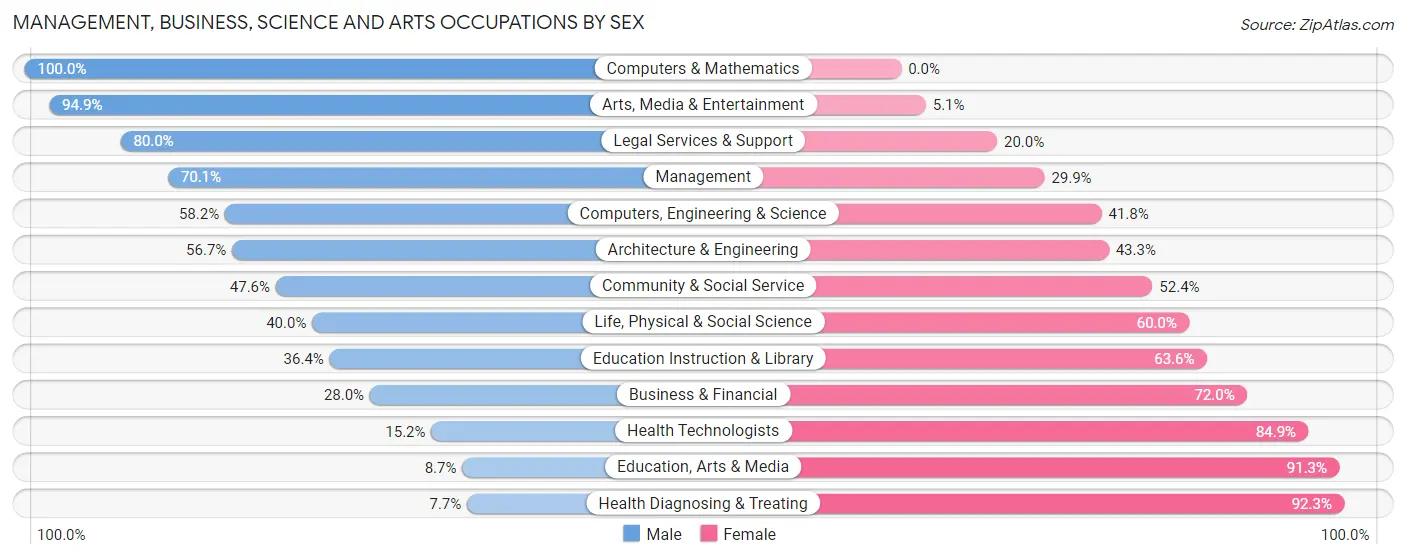
| Occupation | Male | Female |
| Management | 265 (70.1%) | 113 (29.9%) |
| Business & Financial | 26 (28.0%) | 67 (72.0%) |
| Computers, Engineering & Science | 71 (58.2%) | 51 (41.8%) |
| Computers & Mathematics | 10 (100.0%) | 0 (0.0%) |
| Architecture & Engineering | 55 (56.7%) | 42 (43.3%) |
| Life, Physical & Social Science | 6 (40.0%) | 9 (60.0%) |
| Community & Social Service | 79 (47.6%) | 87 (52.4%) |
| Education, Arts & Media | 2 (8.7%) | 21 (91.3%) |
| Legal Services & Support | 4 (80.0%) | 1 (20.0%) |
| Education Instruction & Library | 36 (36.4%) | 63 (63.6%) |
| Arts, Media & Entertainment | 37 (94.9%) | 2 (5.1%) |
| Health Diagnosing & Treating | 10 (7.7%) | 120 (92.3%) |
| Health Technologists | 10 (15.1%) | 56 (84.9%) |
| Total (Category) | 451 (50.7%) | 438 (49.3%) |
| Total (Overall) | 1,434 (53.5%) | 1,245 (46.5%) |
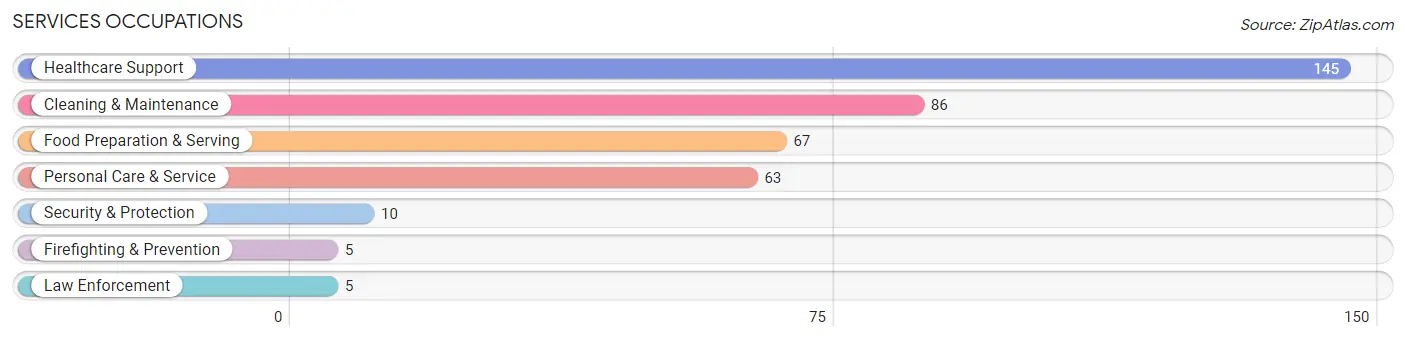
Services Occupations
The most common Services occupations in Ransom County are Healthcare Support (145 | 5.4%), Cleaning & Maintenance (86 | 3.2%), Food Preparation & Serving (67 | 2.5%), Personal Care & Service (63 | 2.4%), and Security & Protection (10 | 0.4%).
Services Occupations by Sex
Within the Services occupations in Ransom County, the most male-oriented occupations are Law Enforcement (100.0%), Security & Protection (50.0%), and Food Preparation & Serving (34.3%), while the most female-oriented occupations are Firefighting & Prevention (100.0%), Personal Care & Service (100.0%), and Healthcare Support (80.0%).
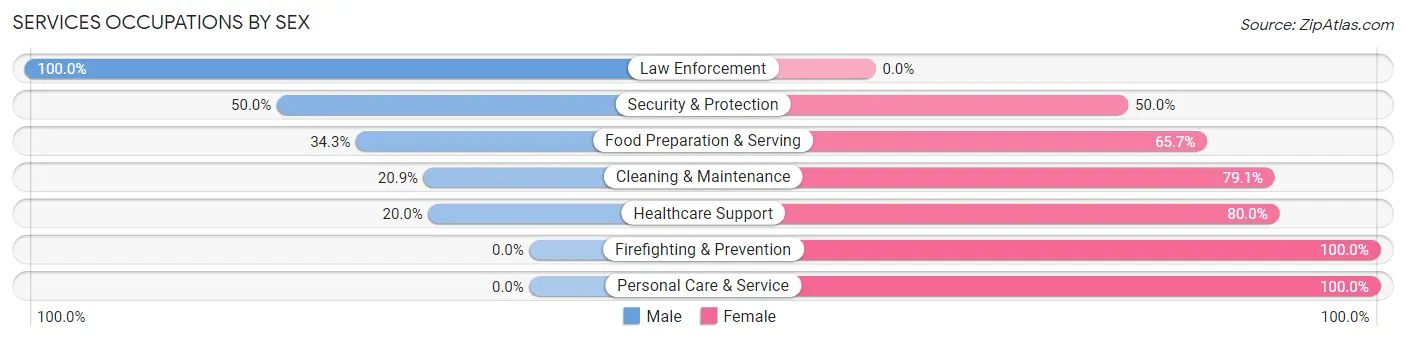
| Occupation | Male | Female |
| Healthcare Support | 29 (20.0%) | 116 (80.0%) |
| Security & Protection | 5 (50.0%) | 5 (50.0%) |
| Firefighting & Prevention | 0 (0.0%) | 5 (100.0%) |
| Law Enforcement | 5 (100.0%) | 0 (0.0%) |
| Food Preparation & Serving | 23 (34.3%) | 44 (65.7%) |
| Cleaning & Maintenance | 18 (20.9%) | 68 (79.1%) |
| Personal Care & Service | 0 (0.0%) | 63 (100.0%) |
| Total (Category) | 75 (20.2%) | 296 (79.8%) |
| Total (Overall) | 1,434 (53.5%) | 1,245 (46.5%) |
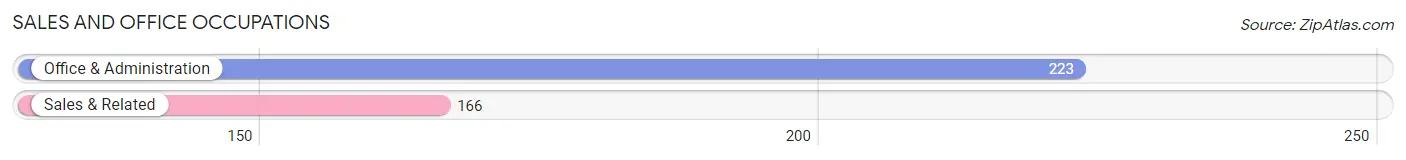
Sales and Office Occupations
The most common Sales and Office occupations in Ransom County are Office & Administration (223 | 8.3%), and Sales & Related (166 | 6.2%).
Sales and Office Occupations by Sex
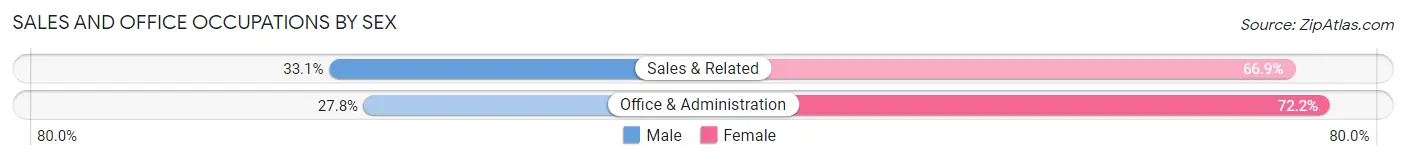
| Occupation | Male | Female |
| Sales & Related | 55 (33.1%) | 111 (66.9%) |
| Office & Administration | 62 (27.8%) | 161 (72.2%) |
| Total (Category) | 117 (30.1%) | 272 (69.9%) |
| Total (Overall) | 1,434 (53.5%) | 1,245 (46.5%) |
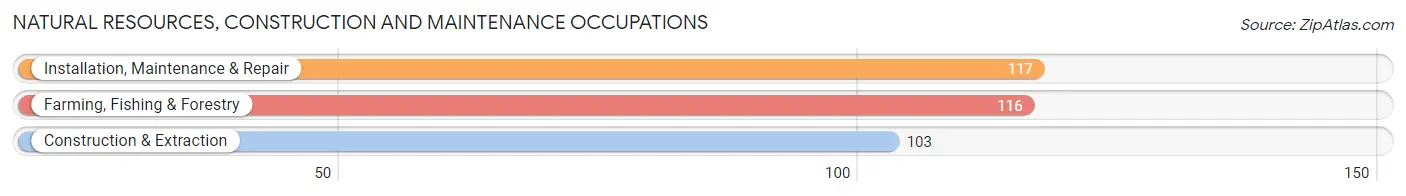
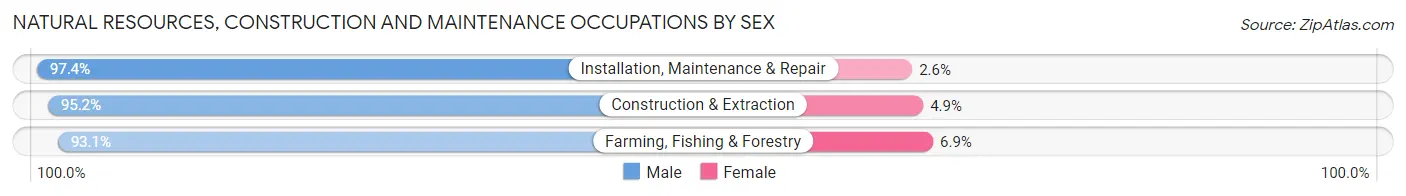
Natural Resources, Construction and Maintenance Occupations
The most common Natural Resources, Construction and Maintenance occupations in Ransom County are Installation, Maintenance & Repair (117 | 4.4%), Farming, Fishing & Forestry (116 | 4.3%), and Construction & Extraction (103 | 3.8%).
Natural Resources, Construction and Maintenance Occupations by Sex
| Occupation | Male | Female |
| Farming, Fishing & Forestry | 108 (93.1%) | 8 (6.9%) |
| Construction & Extraction | 98 (95.2%) | 5 (4.9%) |
| Installation, Maintenance & Repair | 114 (97.4%) | 3 (2.6%) |
| Total (Category) | 320 (95.2%) | 16 (4.8%) |
| Total (Overall) | 1,434 (53.5%) | 1,245 (46.5%) |
Production, Transportation and Moving Occupations
The most common Production, Transportation and Moving occupations in Ransom County are Production (498 | 18.6%), Transportation (132 | 4.9%), and Material Moving (64 | 2.4%).
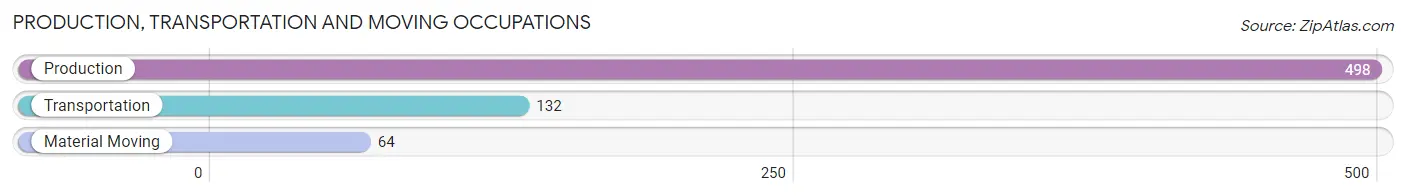
Production, Transportation and Moving Occupations by Sex
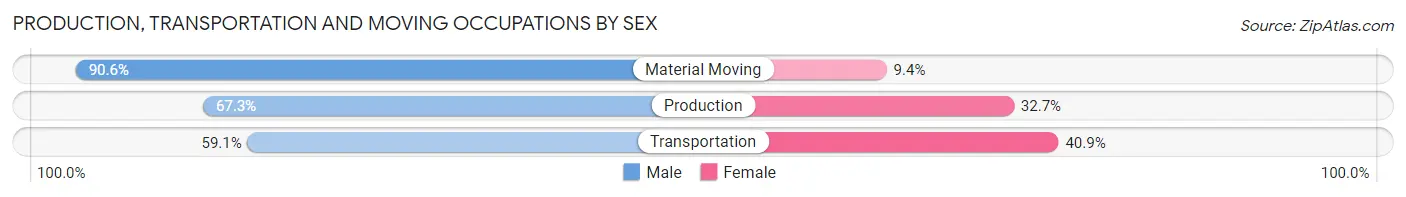
| Occupation | Male | Female |
| Production | 335 (67.3%) | 163 (32.7%) |
| Transportation | 78 (59.1%) | 54 (40.9%) |
| Material Moving | 58 (90.6%) | 6 (9.4%) |
| Total (Category) | 471 (67.9%) | 223 (32.1%) |
| Total (Overall) | 1,434 (53.5%) | 1,245 (46.5%) |
Employment Industries by Sex in Ransom County
Employment Industries in Ransom County
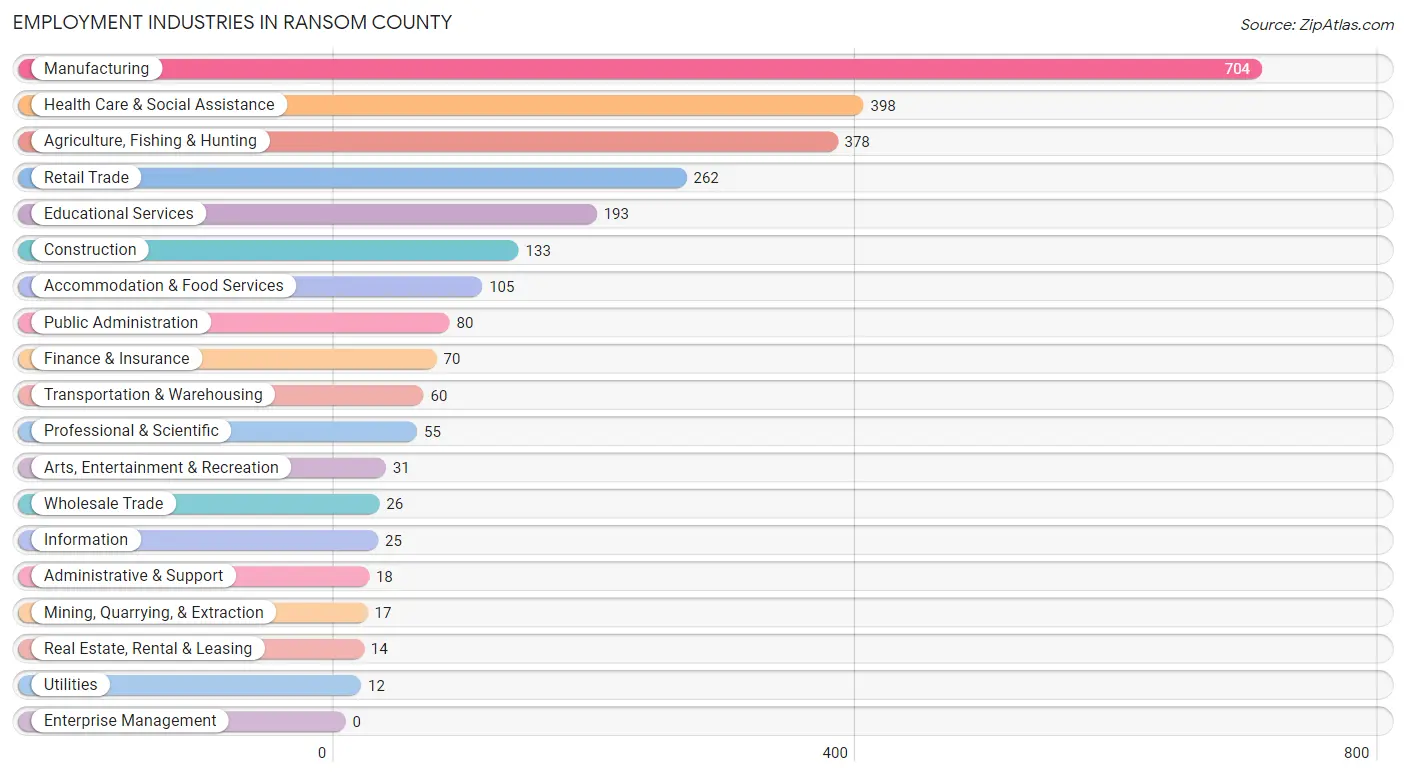
The major employment industries in Ransom County include Manufacturing (704 | 26.3%), Health Care & Social Assistance (398 | 14.9%), Agriculture, Fishing & Hunting (378 | 14.1%), Retail Trade (262 | 9.8%), and Educational Services (193 | 7.2%).
Employment Industries by Sex in Ransom County
The Ransom County industries that see more men than women are Mining, Quarrying, & Extraction (100.0%), Utilities (100.0%), and Real Estate, Rental & Leasing (100.0%), whereas the industries that tend to have a higher number of women are Health Care & Social Assistance (87.9%), Educational Services (72.5%), and Retail Trade (65.3%).
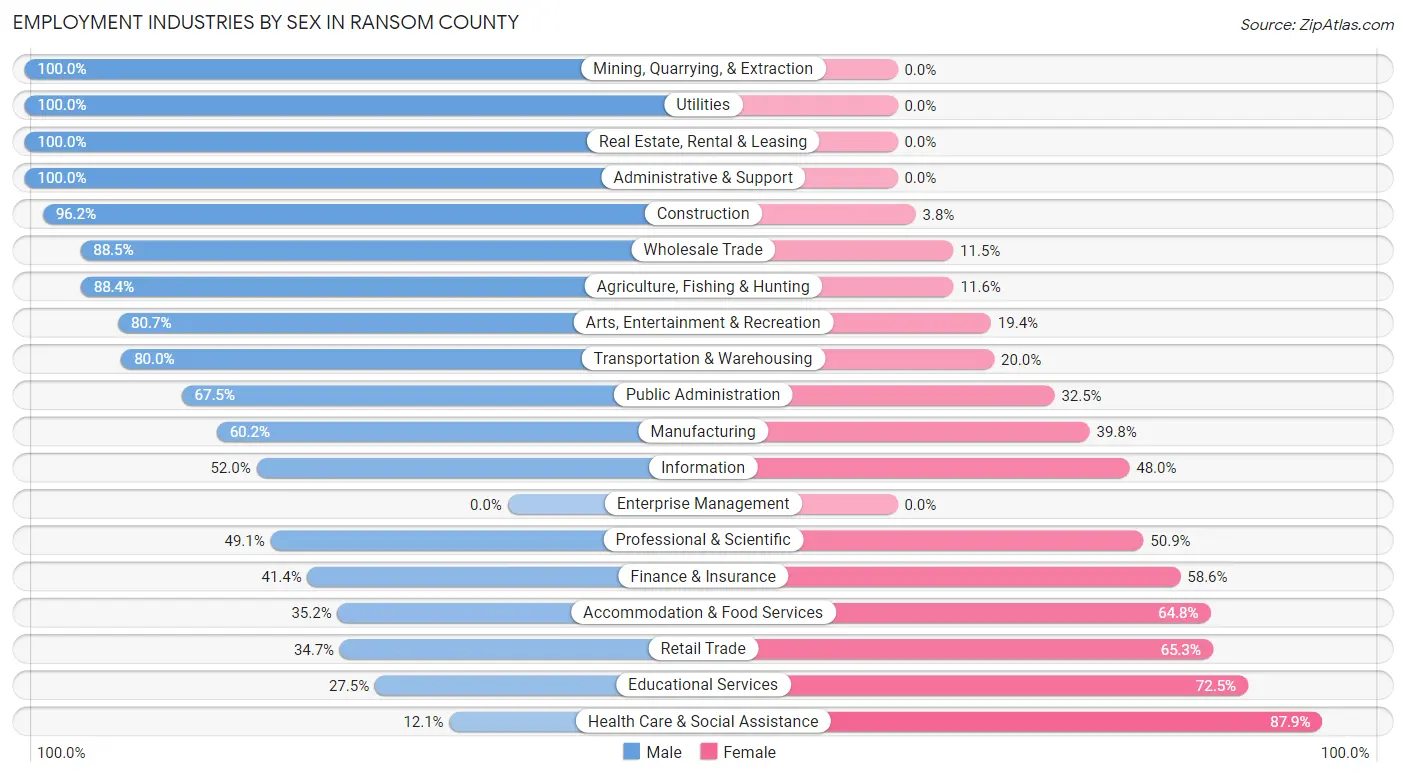
| Industry | Male | Female |
| Agriculture, Fishing & Hunting | 334 (88.4%) | 44 (11.6%) |
| Mining, Quarrying, & Extraction | 17 (100.0%) | 0 (0.0%) |
| Construction | 128 (96.2%) | 5 (3.8%) |
| Manufacturing | 424 (60.2%) | 280 (39.8%) |
| Wholesale Trade | 23 (88.5%) | 3 (11.5%) |
| Retail Trade | 91 (34.7%) | 171 (65.3%) |
| Transportation & Warehousing | 48 (80.0%) | 12 (20.0%) |
| Utilities | 12 (100.0%) | 0 (0.0%) |
| Information | 13 (52.0%) | 12 (48.0%) |
| Finance & Insurance | 29 (41.4%) | 41 (58.6%) |
| Real Estate, Rental & Leasing | 14 (100.0%) | 0 (0.0%) |
| Professional & Scientific | 27 (49.1%) | 28 (50.9%) |
| Enterprise Management | 0 (0.0%) | 0 (0.0%) |
| Administrative & Support | 18 (100.0%) | 0 (0.0%) |
| Educational Services | 53 (27.5%) | 140 (72.5%) |
| Health Care & Social Assistance | 48 (12.1%) | 350 (87.9%) |
| Arts, Entertainment & Recreation | 25 (80.6%) | 6 (19.4%) |
| Accommodation & Food Services | 37 (35.2%) | 68 (64.8%) |
| Public Administration | 54 (67.5%) | 26 (32.5%) |
| Total | 1,434 (53.5%) | 1,245 (46.5%) |
Education in Ransom County
School Enrollment in Ransom County
The most common levels of schooling among the 1,215 students in Ransom County are high school (330 | 27.2%), middle school (318 | 26.2%), and elementary school (316 | 26.0%).
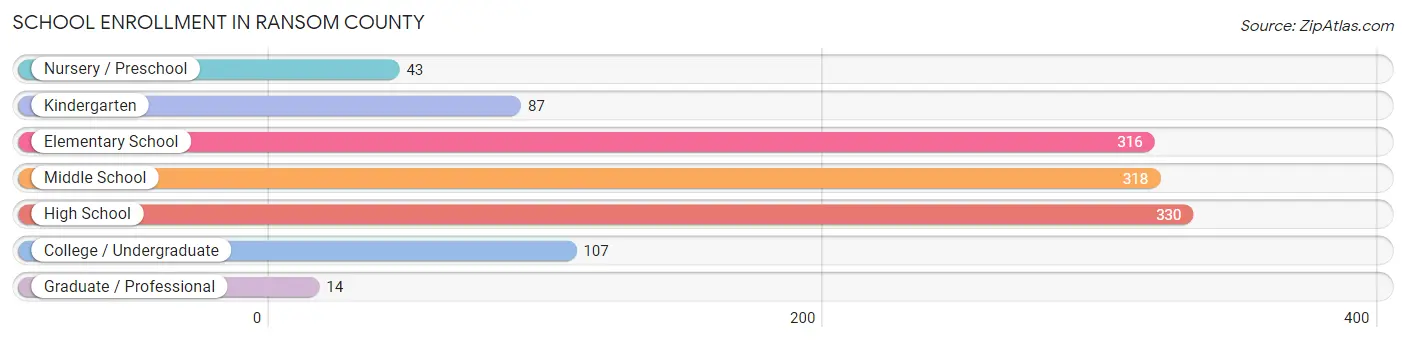
| School Level | # Students | % Students |
| Nursery / Preschool | 43 | 3.5% |
| Kindergarten | 87 | 7.2% |
| Elementary School | 316 | 26.0% |
| Middle School | 318 | 26.2% |
| High School | 330 | 27.2% |
| College / Undergraduate | 107 | 8.8% |
| Graduate / Professional | 14 | 1.1% |
| Total | 1,215 | 100.0% |
School Enrollment by Age by Funding Source in Ransom County
Out of a total of 1,215 students who are enrolled in schools in Ransom County, 68 (5.6%) attend a private institution, while the remaining 1,147 (94.4%) are enrolled in public schools. The age group of 20 to 24 year olds has the highest likelihood of being enrolled in private schools, with 17 (25.4% in the age bracket) enrolled. Conversely, the age group of 3 to 4 year olds has the lowest likelihood of being enrolled in a private school, with 24 (100.0% in the age bracket) attending a public institution.
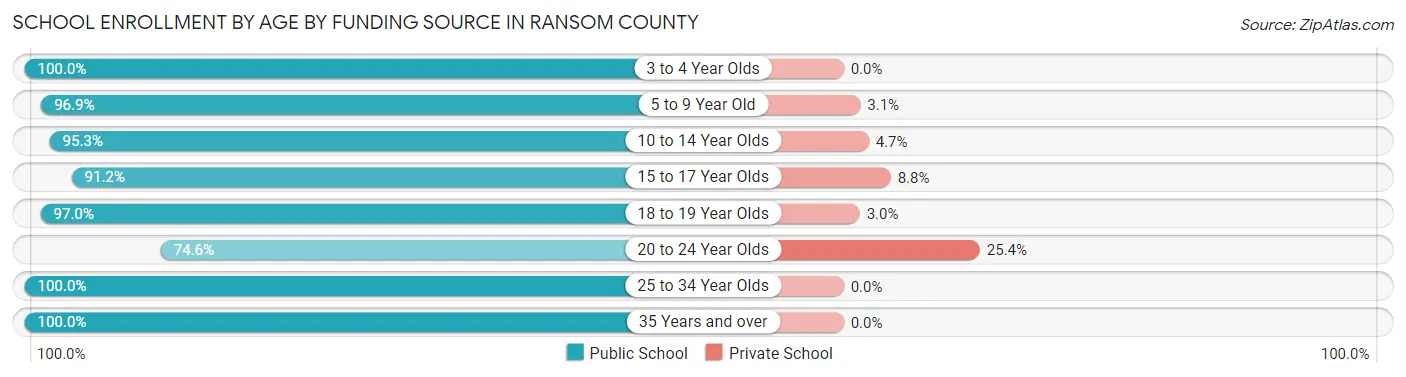
| Age Bracket | Public School | Private School |
| 3 to 4 Year Olds | 24 (100.0%) | 0 (0.0%) |
| 5 to 9 Year Old | 344 (96.9%) | 11 (3.1%) |
| 10 to 14 Year Olds | 347 (95.3%) | 17 (4.7%) |
| 15 to 17 Year Olds | 198 (91.2%) | 19 (8.8%) |
| 18 to 19 Year Olds | 130 (97.0%) | 4 (3.0%) |
| 20 to 24 Year Olds | 50 (74.6%) | 17 (25.4%) |
| 25 to 34 Year Olds | 5 (100.0%) | 0 (0.0%) |
| 35 Years and over | 49 (100.0%) | 0 (0.0%) |
| Total | 1,147 (94.4%) | 68 (5.6%) |
Educational Attainment by Field of Study in Ransom County
Education (267 | 29.2%), science & technology (121 | 13.2%), business (114 | 12.5%), bio, nature & agricultural (102 | 11.2%), and literature & languages (85 | 9.3%) are the most common fields of study among 914 individuals in Ransom County who have obtained a bachelor's degree or higher.
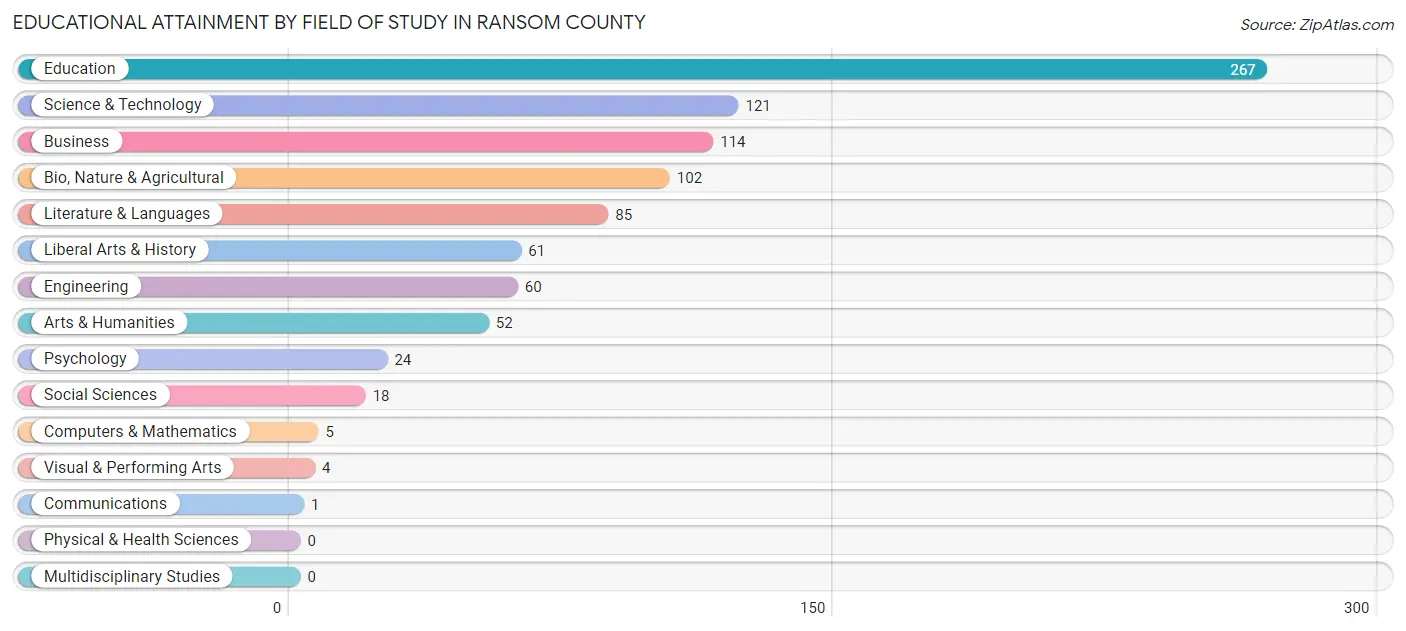
| Field of Study | # Graduates | % Graduates |
| Computers & Mathematics | 5 | 0.5% |
| Bio, Nature & Agricultural | 102 | 11.2% |
| Physical & Health Sciences | 0 | 0.0% |
| Psychology | 24 | 2.6% |
| Social Sciences | 18 | 2.0% |
| Engineering | 60 | 6.6% |
| Multidisciplinary Studies | 0 | 0.0% |
| Science & Technology | 121 | 13.2% |
| Business | 114 | 12.5% |
| Education | 267 | 29.2% |
| Literature & Languages | 85 | 9.3% |
| Liberal Arts & History | 61 | 6.7% |
| Visual & Performing Arts | 4 | 0.4% |
| Communications | 1 | 0.1% |
| Arts & Humanities | 52 | 5.7% |
| Total | 914 | 100.0% |
Transportation & Commute in Ransom County
Vehicle Availability by Sex in Ransom County
The most prevalent vehicle ownership categories in Ransom County are males with 2 vehicles (394, accounting for 28.2%) and females with 2 vehicles (271, making up 31.9%).
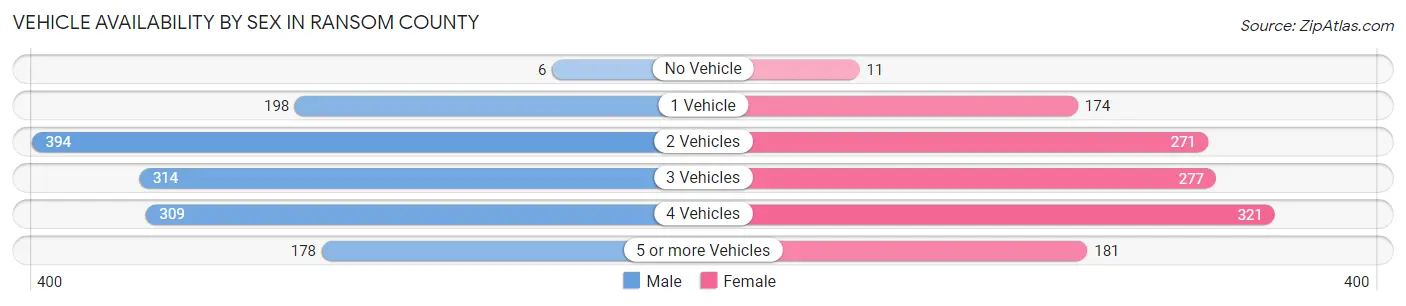
| Vehicles Available | Male | Female |
| No Vehicle | 6 (0.4%) | 11 (0.9%) |
| 1 Vehicle | 198 (14.1%) | 174 (14.1%) |
| 2 Vehicles | 394 (28.2%) | 271 (21.9%) |
| 3 Vehicles | 314 (22.4%) | 277 (22.4%) |
| 4 Vehicles | 309 (22.1%) | 321 (26.0%) |
| 5 or more Vehicles | 178 (12.7%) | 181 (14.7%) |
| Total | 1,399 (100.0%) | 1,235 (100.0%) |
Commute Time in Ransom County
The most frequently occuring commute durations in Ransom County are 5 to 9 minutes (554 commuters, 22.3%), 15 to 19 minutes (456 commuters, 18.4%), and less than 5 minutes (305 commuters, 12.3%).
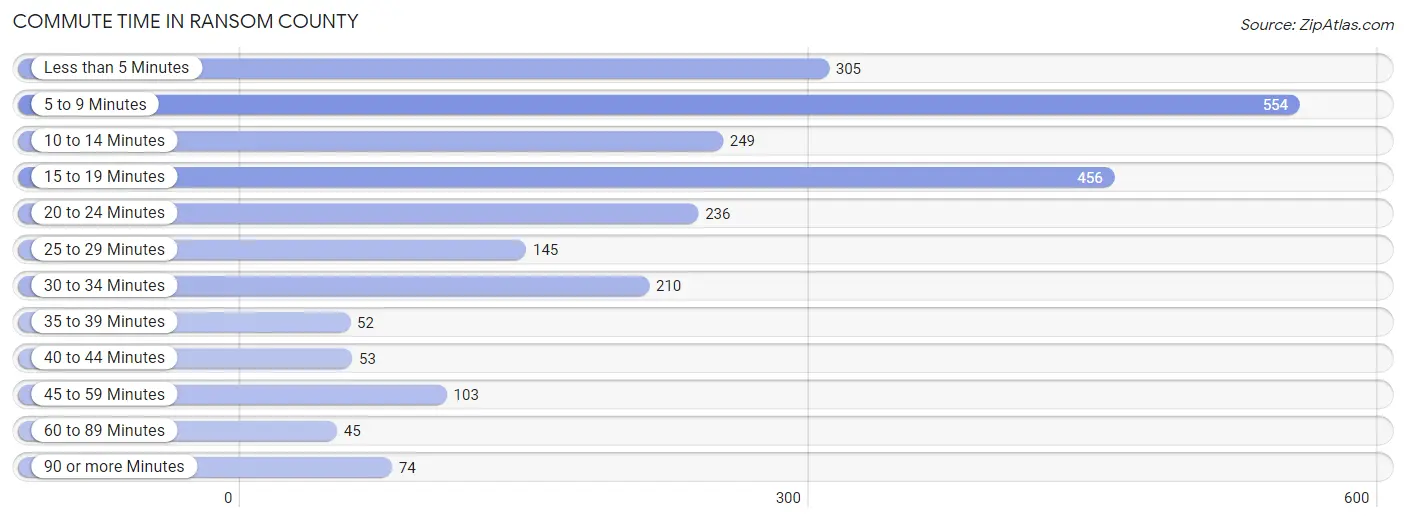
| Commute Time | # Commuters | % Commuters |
| Less than 5 Minutes | 305 | 12.3% |
| 5 to 9 Minutes | 554 | 22.3% |
| 10 to 14 Minutes | 249 | 10.0% |
| 15 to 19 Minutes | 456 | 18.4% |
| 20 to 24 Minutes | 236 | 9.5% |
| 25 to 29 Minutes | 145 | 5.8% |
| 30 to 34 Minutes | 210 | 8.5% |
| 35 to 39 Minutes | 52 | 2.1% |
| 40 to 44 Minutes | 53 | 2.1% |
| 45 to 59 Minutes | 103 | 4.2% |
| 60 to 89 Minutes | 45 | 1.8% |
| 90 or more Minutes | 74 | 3.0% |
Commute Time by Sex in Ransom County
The most common commute times in Ransom County are 5 to 9 minutes (299 commuters, 22.1%) for males and 5 to 9 minutes (255 commuters, 22.6%) for females.
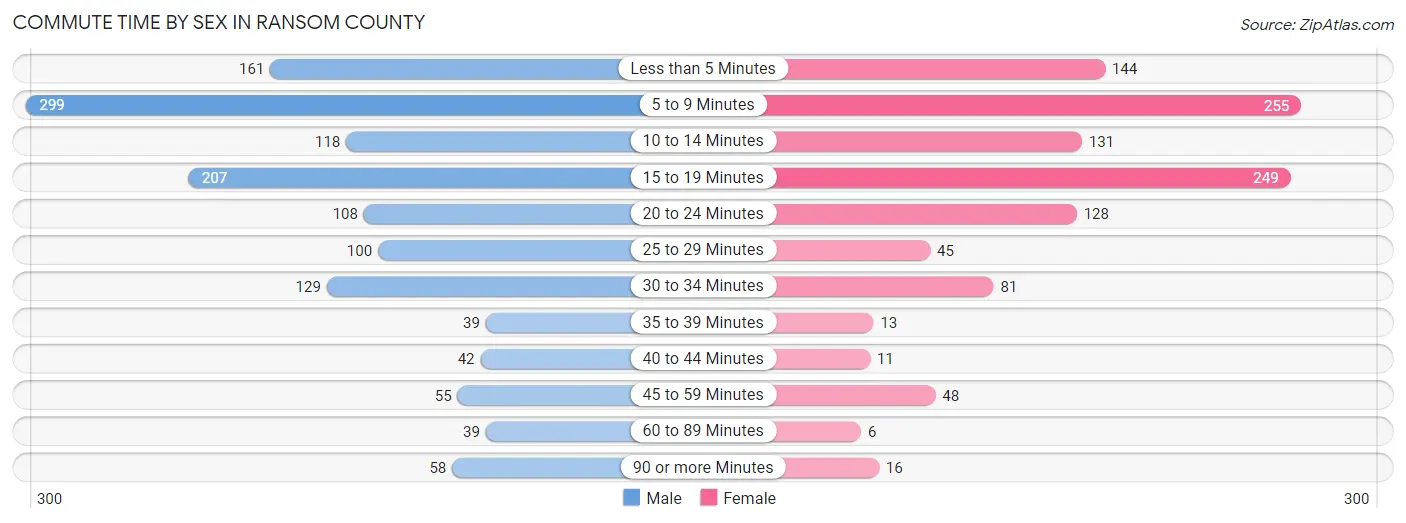
| Commute Time | Male | Female |
| Less than 5 Minutes | 161 (11.9%) | 144 (12.8%) |
| 5 to 9 Minutes | 299 (22.1%) | 255 (22.6%) |
| 10 to 14 Minutes | 118 (8.7%) | 131 (11.6%) |
| 15 to 19 Minutes | 207 (15.3%) | 249 (22.1%) |
| 20 to 24 Minutes | 108 (8.0%) | 128 (11.4%) |
| 25 to 29 Minutes | 100 (7.4%) | 45 (4.0%) |
| 30 to 34 Minutes | 129 (9.5%) | 81 (7.2%) |
| 35 to 39 Minutes | 39 (2.9%) | 13 (1.1%) |
| 40 to 44 Minutes | 42 (3.1%) | 11 (1.0%) |
| 45 to 59 Minutes | 55 (4.1%) | 48 (4.3%) |
| 60 to 89 Minutes | 39 (2.9%) | 6 (0.5%) |
| 90 or more Minutes | 58 (4.3%) | 16 (1.4%) |
Time of Departure to Work by Sex in Ransom County
The most frequent times of departure to work in Ransom County are 7:00 AM to 7:29 AM (212, 15.7%) for males and 6:30 AM to 6:59 AM (238, 21.1%) for females.
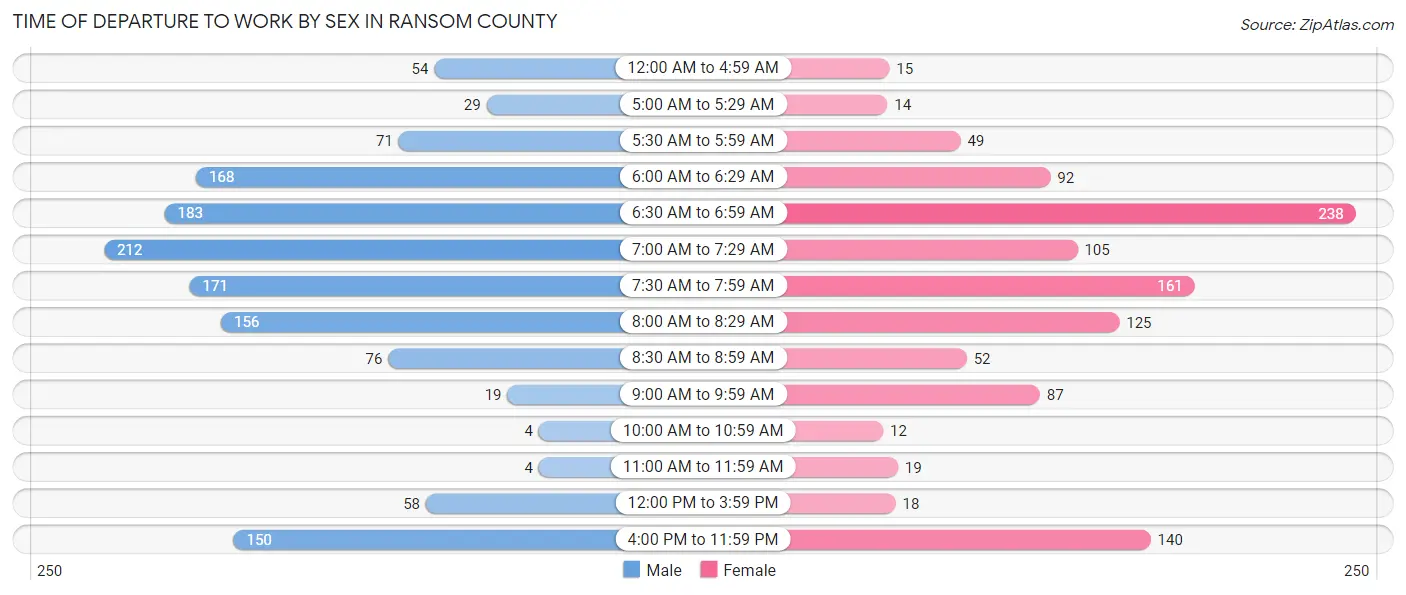
| Time of Departure | Male | Female |
| 12:00 AM to 4:59 AM | 54 (4.0%) | 15 (1.3%) |
| 5:00 AM to 5:29 AM | 29 (2.1%) | 14 (1.2%) |
| 5:30 AM to 5:59 AM | 71 (5.2%) | 49 (4.3%) |
| 6:00 AM to 6:29 AM | 168 (12.4%) | 92 (8.2%) |
| 6:30 AM to 6:59 AM | 183 (13.5%) | 238 (21.1%) |
| 7:00 AM to 7:29 AM | 212 (15.7%) | 105 (9.3%) |
| 7:30 AM to 7:59 AM | 171 (12.6%) | 161 (14.3%) |
| 8:00 AM to 8:29 AM | 156 (11.5%) | 125 (11.1%) |
| 8:30 AM to 8:59 AM | 76 (5.6%) | 52 (4.6%) |
| 9:00 AM to 9:59 AM | 19 (1.4%) | 87 (7.7%) |
| 10:00 AM to 10:59 AM | 4 (0.3%) | 12 (1.1%) |
| 11:00 AM to 11:59 AM | 4 (0.3%) | 19 (1.7%) |
| 12:00 PM to 3:59 PM | 58 (4.3%) | 18 (1.6%) |
| 4:00 PM to 11:59 PM | 150 (11.1%) | 140 (12.4%) |
| Total | 1,355 (100.0%) | 1,127 (100.0%) |
Housing Occupancy in Ransom County
Occupancy by Ownership in Ransom County
Of the total 2,347 dwellings in Ransom County, owner-occupied units account for 1,746 (74.4%), while renter-occupied units make up 601 (25.6%).
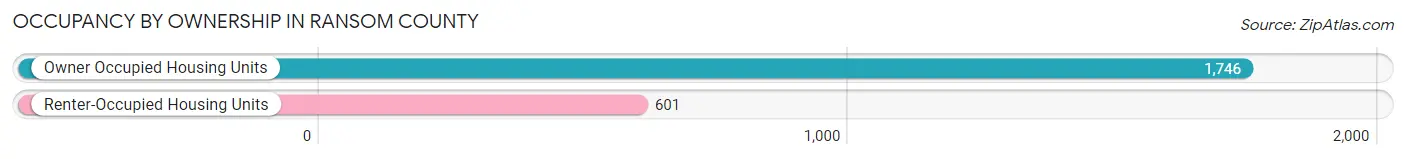
| Occupancy | # Housing Units | % Housing Units |
| Owner Occupied Housing Units | 1,746 | 74.4% |
| Renter-Occupied Housing Units | 601 | 25.6% |
| Total Occupied Housing Units | 2,347 | 100.0% |
Occupancy by Household Size in Ransom County
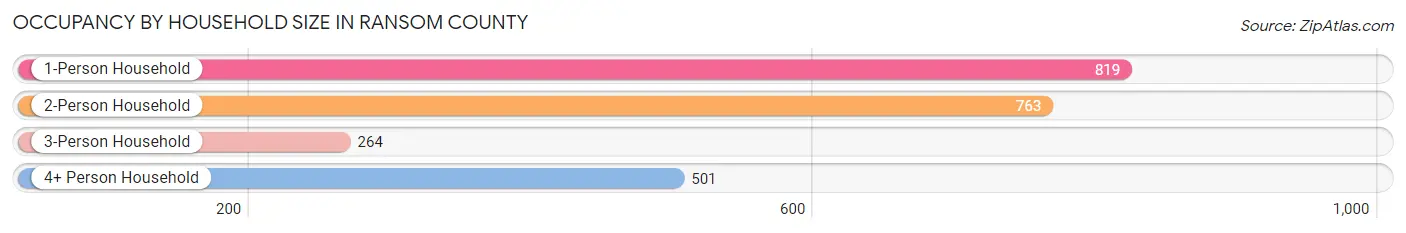
| Household Size | # Housing Units | % Housing Units |
| 1-Person Household | 819 | 34.9% |
| 2-Person Household | 763 | 32.5% |
| 3-Person Household | 264 | 11.3% |
| 4+ Person Household | 501 | 21.3% |
| Total Housing Units | 2,347 | 100.0% |
Occupancy by Ownership by Household Size in Ransom County
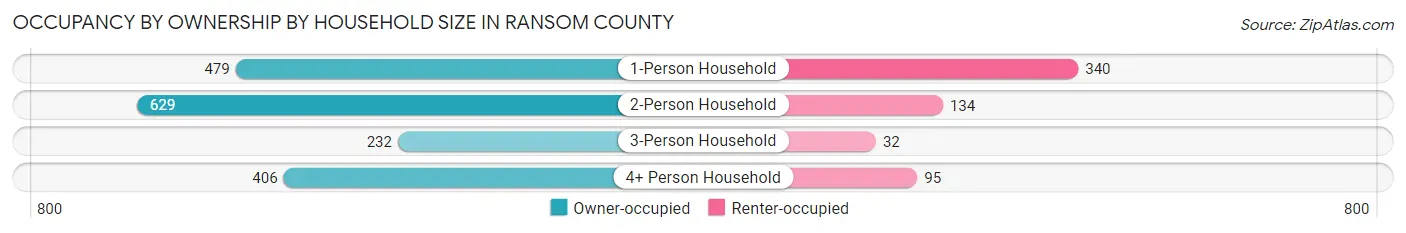
| Household Size | Owner-occupied | Renter-occupied |
| 1-Person Household | 479 (58.5%) | 340 (41.5%) |
| 2-Person Household | 629 (82.4%) | 134 (17.6%) |
| 3-Person Household | 232 (87.9%) | 32 (12.1%) |
| 4+ Person Household | 406 (81.0%) | 95 (19.0%) |
| Total Housing Units | 1,746 (74.4%) | 601 (25.6%) |
Occupancy by Educational Attainment in Ransom County
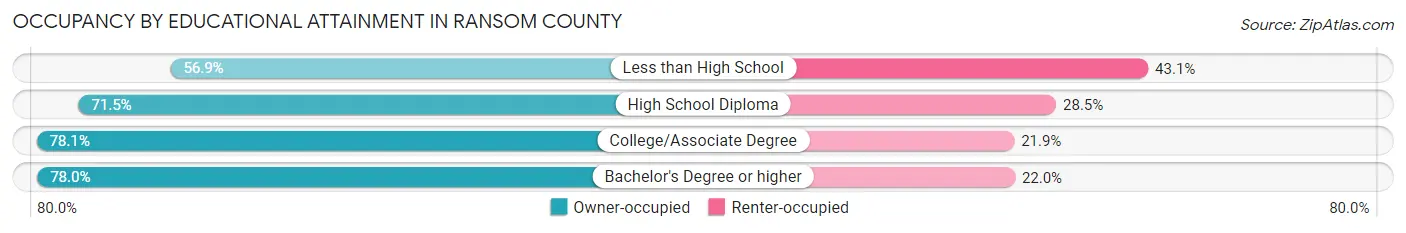
| Household Size | Owner-occupied | Renter-occupied |
| Less than High School | 87 (56.9%) | 66 (43.1%) |
| High School Diploma | 581 (71.5%) | 232 (28.5%) |
| College/Associate Degree | 635 (78.1%) | 178 (21.9%) |
| Bachelor's Degree or higher | 443 (78.0%) | 125 (22.0%) |
Occupancy by Age of Householder in Ransom County
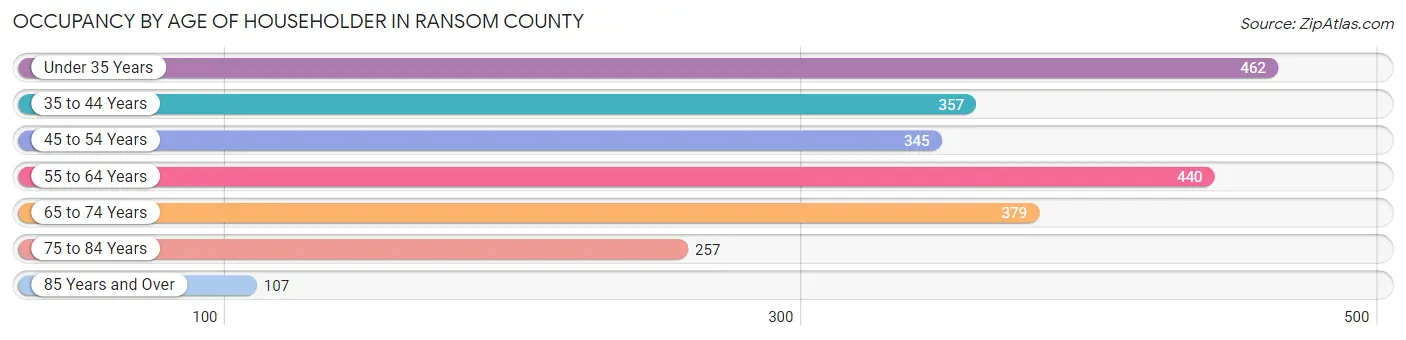
| Age Bracket | # Households | % Households |
| Under 35 Years | 462 | 19.7% |
| 35 to 44 Years | 357 | 15.2% |
| 45 to 54 Years | 345 | 14.7% |
| 55 to 64 Years | 440 | 18.8% |
| 65 to 74 Years | 379 | 16.2% |
| 75 to 84 Years | 257 | 11.0% |
| 85 Years and Over | 107 | 4.6% |
| Total | 2,347 | 100.0% |
Housing Finances in Ransom County
Median Income by Occupancy in Ransom County
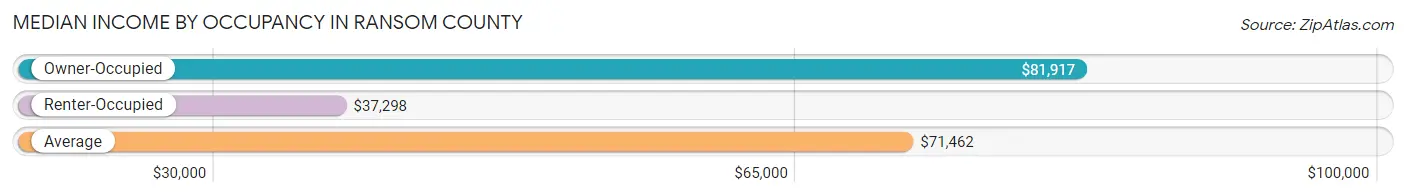
| Occupancy Type | # Households | Median Income |
| Owner-Occupied | 1,746 (74.4%) | $81,917 |
| Renter-Occupied | 601 (25.6%) | $37,298 |
| Average | 2,347 (100.0%) | $71,462 |
Occupancy by Householder Income Bracket in Ransom County
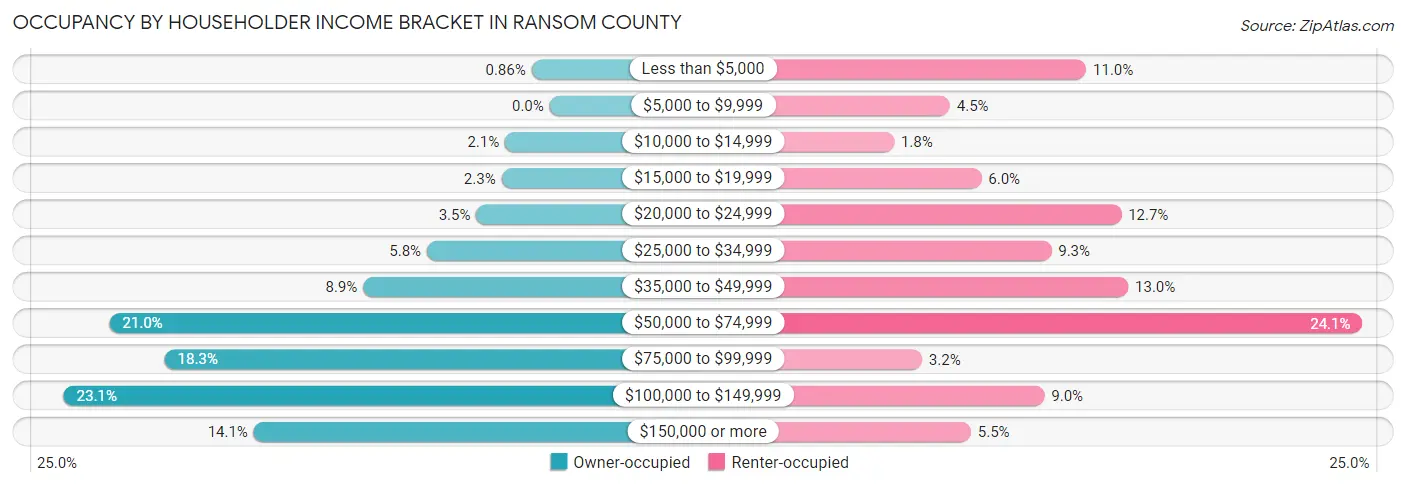
| Income Bracket | Owner-occupied | Renter-occupied |
| Less than $5,000 | 15 (0.9%) | 66 (11.0%) |
| $5,000 to $9,999 | 0 (0.0%) | 27 (4.5%) |
| $10,000 to $14,999 | 37 (2.1%) | 11 (1.8%) |
| $15,000 to $19,999 | 40 (2.3%) | 36 (6.0%) |
| $20,000 to $24,999 | 61 (3.5%) | 76 (12.7%) |
| $25,000 to $34,999 | 102 (5.8%) | 56 (9.3%) |
| $35,000 to $49,999 | 155 (8.9%) | 78 (13.0%) |
| $50,000 to $74,999 | 366 (21.0%) | 145 (24.1%) |
| $75,000 to $99,999 | 320 (18.3%) | 19 (3.2%) |
| $100,000 to $149,999 | 404 (23.1%) | 54 (9.0%) |
| $150,000 or more | 246 (14.1%) | 33 (5.5%) |
| Total | 1,746 (100.0%) | 601 (100.0%) |
Monthly Housing Cost Tiers in Ransom County
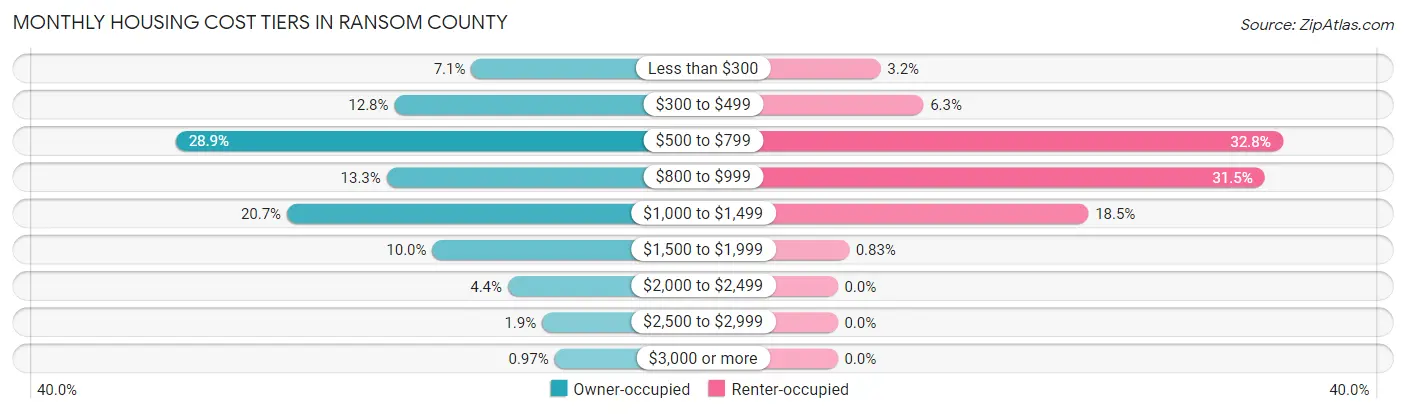
| Monthly Cost | Owner-occupied | Renter-occupied |
| Less than $300 | 124 (7.1%) | 19 (3.2%) |
| $300 to $499 | 223 (12.8%) | 38 (6.3%) |
| $500 to $799 | 504 (28.9%) | 197 (32.8%) |
| $800 to $999 | 233 (13.3%) | 189 (31.5%) |
| $1,000 to $1,499 | 361 (20.7%) | 111 (18.5%) |
| $1,500 to $1,999 | 174 (10.0%) | 5 (0.8%) |
| $2,000 to $2,499 | 77 (4.4%) | 0 (0.0%) |
| $2,500 to $2,999 | 33 (1.9%) | 0 (0.0%) |
| $3,000 or more | 17 (1.0%) | 0 (0.0%) |
| Total | 1,746 (100.0%) | 601 (100.0%) |
Physical Housing Characteristics in Ransom County
Housing Structures in Ransom County
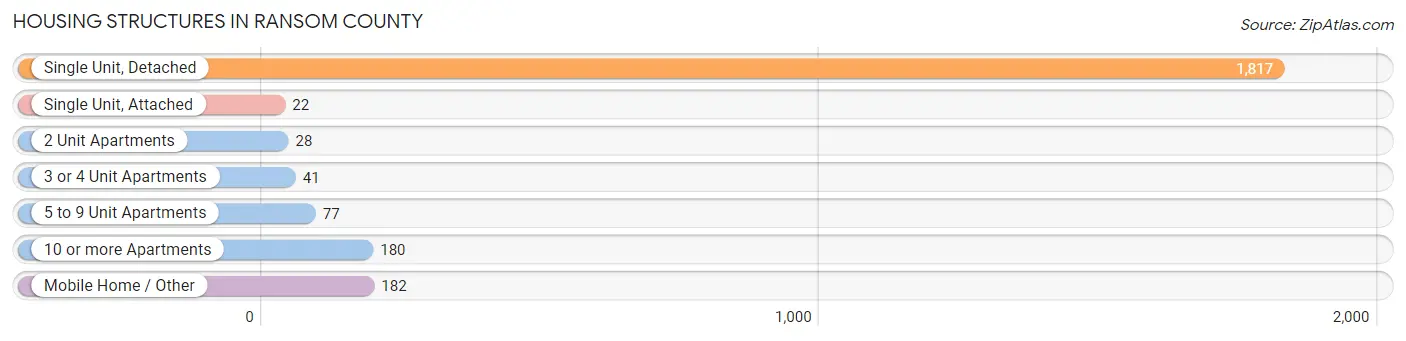
| Structure Type | # Housing Units | % Housing Units |
| Single Unit, Detached | 1,817 | 77.4% |
| Single Unit, Attached | 22 | 0.9% |
| 2 Unit Apartments | 28 | 1.2% |
| 3 or 4 Unit Apartments | 41 | 1.8% |
| 5 to 9 Unit Apartments | 77 | 3.3% |
| 10 or more Apartments | 180 | 7.7% |
| Mobile Home / Other | 182 | 7.7% |
| Total | 2,347 | 100.0% |
Housing Structures by Occupancy in Ransom County
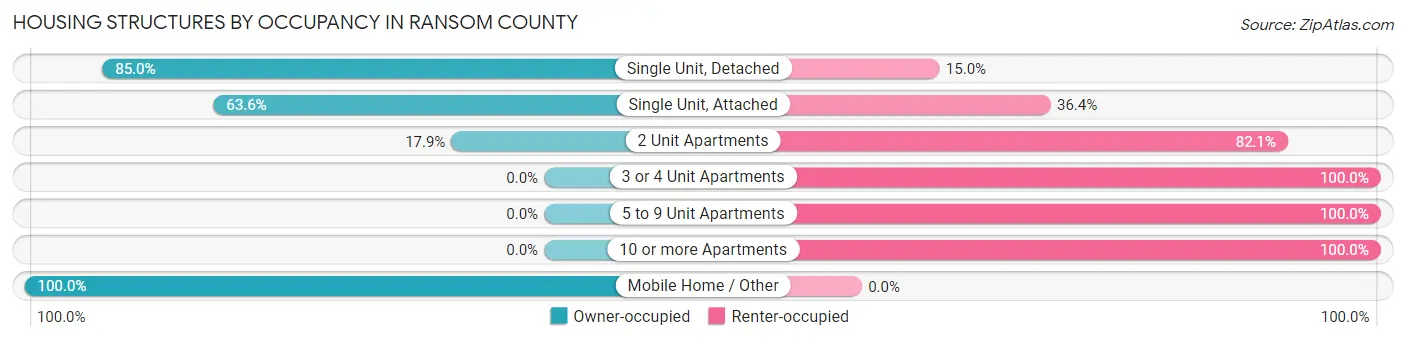
| Structure Type | Owner-occupied | Renter-occupied |
| Single Unit, Detached | 1,545 (85.0%) | 272 (15.0%) |
| Single Unit, Attached | 14 (63.6%) | 8 (36.4%) |
| 2 Unit Apartments | 5 (17.9%) | 23 (82.1%) |
| 3 or 4 Unit Apartments | 0 (0.0%) | 41 (100.0%) |
| 5 to 9 Unit Apartments | 0 (0.0%) | 77 (100.0%) |
| 10 or more Apartments | 0 (0.0%) | 180 (100.0%) |
| Mobile Home / Other | 182 (100.0%) | 0 (0.0%) |
| Total | 1,746 (74.4%) | 601 (25.6%) |
Housing Structures by Number of Rooms in Ransom County
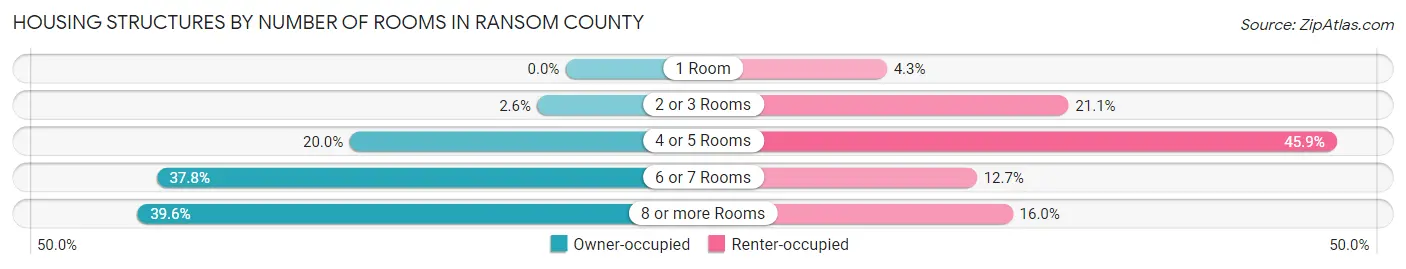
| Number of Rooms | Owner-occupied | Renter-occupied |
| 1 Room | 0 (0.0%) | 26 (4.3%) |
| 2 or 3 Rooms | 46 (2.6%) | 127 (21.1%) |
| 4 or 5 Rooms | 349 (20.0%) | 276 (45.9%) |
| 6 or 7 Rooms | 660 (37.8%) | 76 (12.7%) |
| 8 or more Rooms | 691 (39.6%) | 96 (16.0%) |
| Total | 1,746 (100.0%) | 601 (100.0%) |
Housing Structure by Heating Type in Ransom County
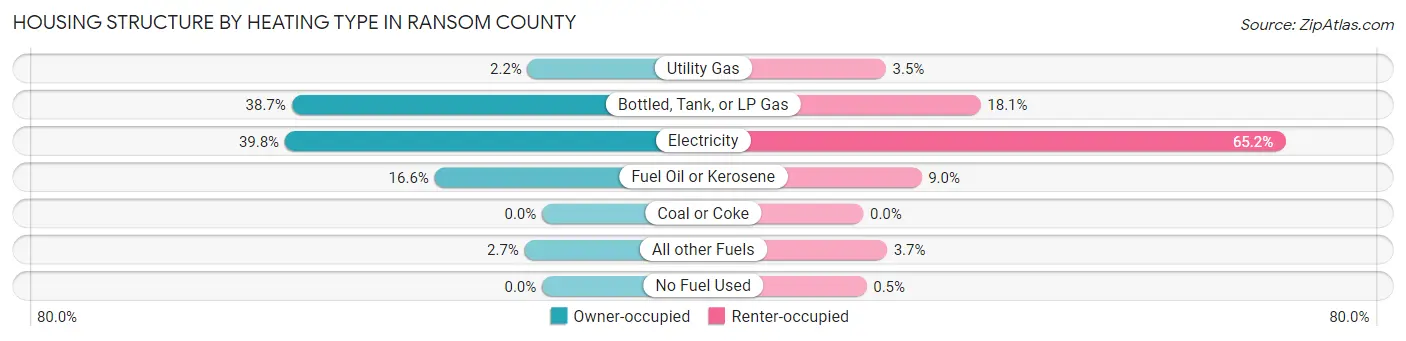
| Heating Type | Owner-occupied | Renter-occupied |
| Utility Gas | 39 (2.2%) | 21 (3.5%) |
| Bottled, Tank, or LP Gas | 676 (38.7%) | 109 (18.1%) |
| Electricity | 694 (39.8%) | 392 (65.2%) |
| Fuel Oil or Kerosene | 290 (16.6%) | 54 (9.0%) |
| Coal or Coke | 0 (0.0%) | 0 (0.0%) |
| All other Fuels | 47 (2.7%) | 22 (3.7%) |
| No Fuel Used | 0 (0.0%) | 3 (0.5%) |
| Total | 1,746 (100.0%) | 601 (100.0%) |
Household Vehicle Usage in Ransom County
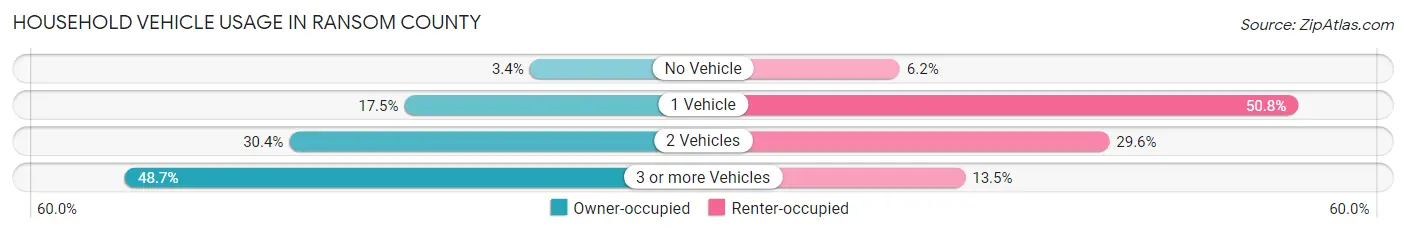
| Vehicles per Household | Owner-occupied | Renter-occupied |
| No Vehicle | 60 (3.4%) | 37 (6.2%) |
| 1 Vehicle | 305 (17.5%) | 305 (50.7%) |
| 2 Vehicles | 530 (30.4%) | 178 (29.6%) |
| 3 or more Vehicles | 851 (48.7%) | 81 (13.5%) |
| Total | 1,746 (100.0%) | 601 (100.0%) |
Real Estate & Mortgages in Ransom County
Real Estate and Mortgage Overview in Ransom County
| Characteristic | Without Mortgage | With Mortgage |
| Housing Units | 924 | 822 |
| Median Property Value | $148,700 | $142,200 |
| Median Household Income | $71,458 | $128 |
| Monthly Housing Costs | $568 | $17 |
| Real Estate Taxes | $1,483 | $64 |
Property Value by Mortgage Status in Ransom County

| Property Value | Without Mortgage | With Mortgage |
| Less than $50,000 | 163 (17.6%) | 27 (3.3%) |
| $50,000 to $99,999 | 170 (18.4%) | 213 (25.9%) |
| $100,000 to $299,999 | 456 (49.3%) | 473 (57.5%) |
| $300,000 to $499,999 | 102 (11.0%) | 89 (10.8%) |
| $500,000 to $749,999 | 23 (2.5%) | 16 (1.9%) |
| $750,000 to $999,999 | 5 (0.5%) | 0 (0.0%) |
| $1,000,000 or more | 5 (0.5%) | 4 (0.5%) |
| Total | 924 (100.0%) | 822 (100.0%) |
Household Income by Mortgage Status in Ransom County
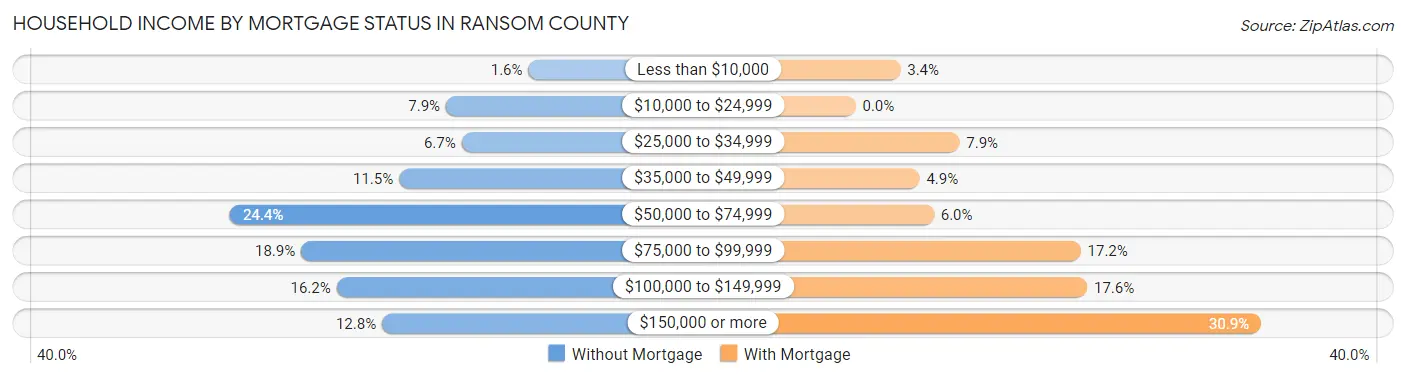
| Household Income | Without Mortgage | With Mortgage |
| Less than $10,000 | 15 (1.6%) | 28 (3.4%) |
| $10,000 to $24,999 | 73 (7.9%) | 0 (0.0%) |
| $25,000 to $34,999 | 62 (6.7%) | 65 (7.9%) |
| $35,000 to $49,999 | 106 (11.5%) | 40 (4.9%) |
| $50,000 to $74,999 | 225 (24.3%) | 49 (6.0%) |
| $75,000 to $99,999 | 175 (18.9%) | 141 (17.2%) |
| $100,000 to $149,999 | 150 (16.2%) | 145 (17.6%) |
| $150,000 or more | 118 (12.8%) | 254 (30.9%) |
| Total | 924 (100.0%) | 822 (100.0%) |
Property Value to Household Income Ratio in Ransom County
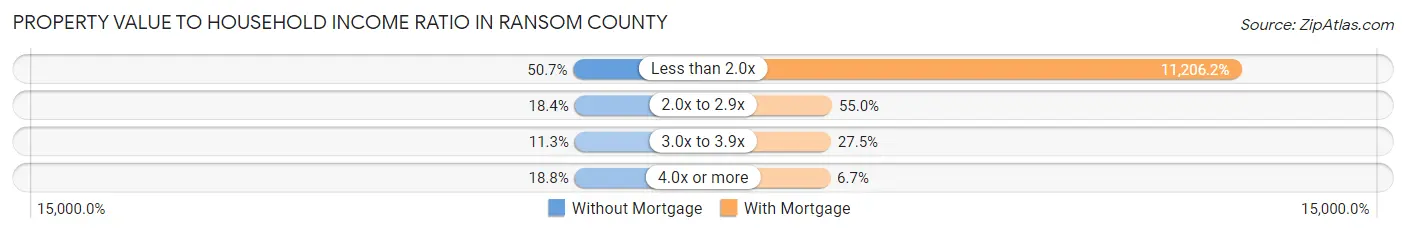
| Value-to-Income Ratio | Without Mortgage | With Mortgage |
| Less than 2.0x | 468 (50.6%) | 92,115 (11,206.2%) |
| 2.0x to 2.9x | 170 (18.4%) | 452 (55.0%) |
| 3.0x to 3.9x | 104 (11.3%) | 226 (27.5%) |
| 4.0x or more | 174 (18.8%) | 55 (6.7%) |
| Total | 924 (100.0%) | 822 (100.0%) |
Real Estate Taxes by Mortgage Status in Ransom County
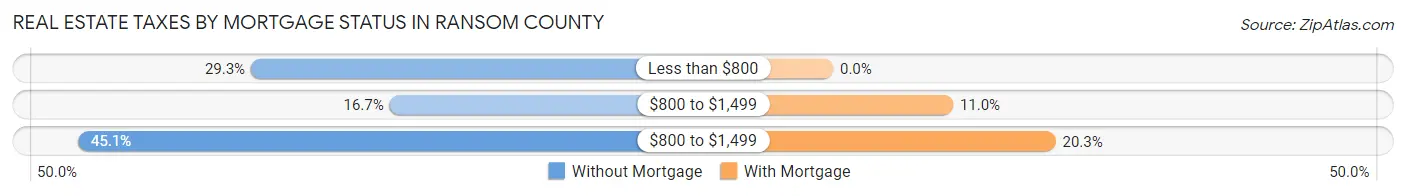
| Property Taxes | Without Mortgage | With Mortgage |
| Less than $800 | 271 (29.3%) | 0 (0.0%) |
| $800 to $1,499 | 154 (16.7%) | 90 (11.0%) |
| $800 to $1,499 | 417 (45.1%) | 167 (20.3%) |
| Total | 924 (100.0%) | 822 (100.0%) |
Health & Disability in Ransom County
Health Insurance Coverage by Age in Ransom County
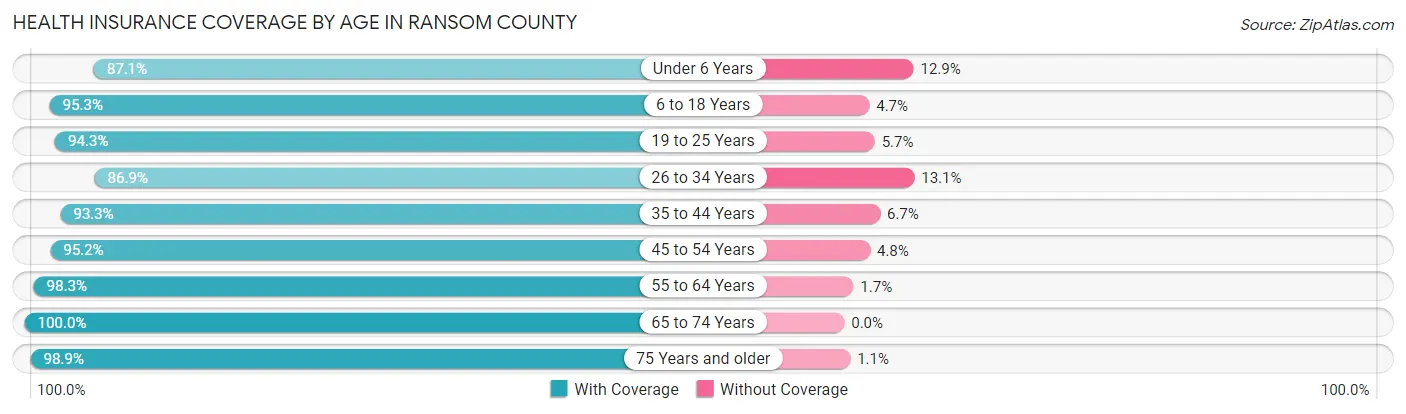
| Age Bracket | With Coverage | Without Coverage |
| Under 6 Years | 283 (87.1%) | 42 (12.9%) |
| 6 to 18 Years | 1,002 (95.3%) | 49 (4.7%) |
| 19 to 25 Years | 332 (94.3%) | 20 (5.7%) |
| 26 to 34 Years | 446 (86.9%) | 67 (13.1%) |
| 35 to 44 Years | 645 (93.3%) | 46 (6.7%) |
| 45 to 54 Years | 655 (95.2%) | 33 (4.8%) |
| 55 to 64 Years | 752 (98.3%) | 13 (1.7%) |
| 65 to 74 Years | 610 (100.0%) | 0 (0.0%) |
| 75 Years and older | 447 (98.9%) | 5 (1.1%) |
| Total | 5,172 (95.0%) | 275 (5.1%) |
Health Insurance Coverage by Citizenship Status in Ransom County
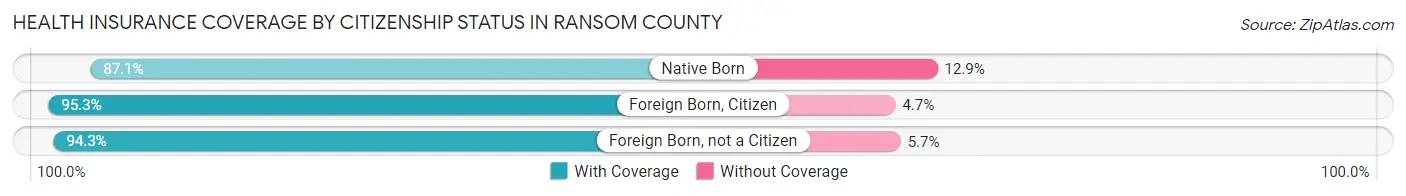
| Citizenship Status | With Coverage | Without Coverage |
| Native Born | 283 (87.1%) | 42 (12.9%) |
| Foreign Born, Citizen | 1,002 (95.3%) | 49 (4.7%) |
| Foreign Born, not a Citizen | 332 (94.3%) | 20 (5.7%) |
Health Insurance Coverage by Household Income in Ransom County
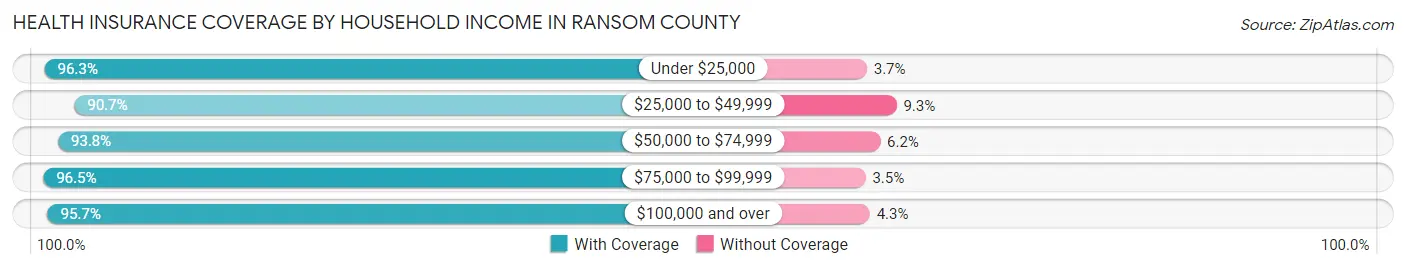
| Household Income | With Coverage | Without Coverage |
| Under $25,000 | 540 (96.3%) | 21 (3.7%) |
| $25,000 to $49,999 | 604 (90.7%) | 62 (9.3%) |
| $50,000 to $74,999 | 1,022 (93.8%) | 68 (6.2%) |
| $75,000 to $99,999 | 938 (96.5%) | 34 (3.5%) |
| $100,000 and over | 2,005 (95.7%) | 90 (4.3%) |
Public vs Private Health Insurance Coverage by Age in Ransom County
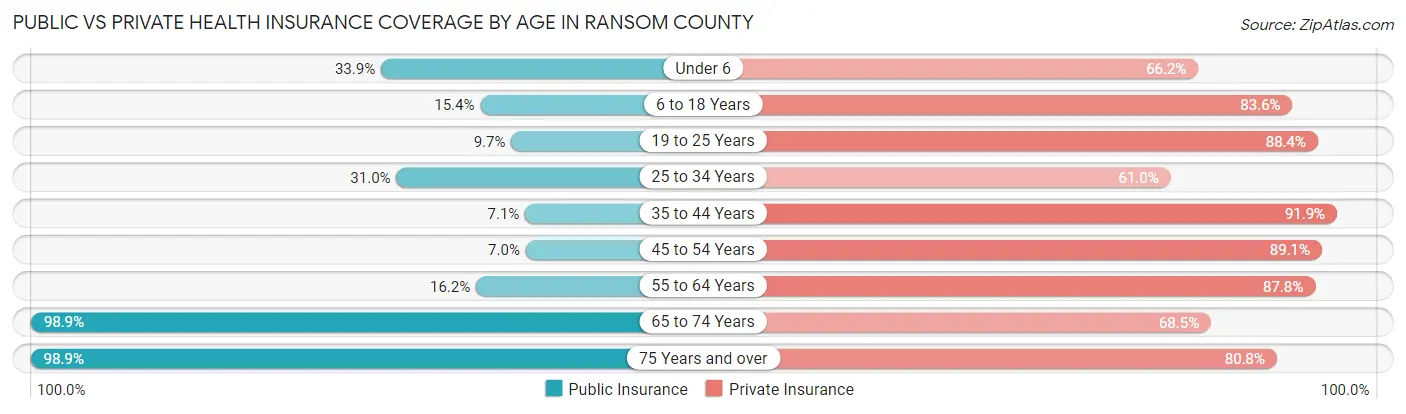
| Age Bracket | Public Insurance | Private Insurance |
| Under 6 | 110 (33.9%) | 215 (66.1%) |
| 6 to 18 Years | 162 (15.4%) | 879 (83.6%) |
| 19 to 25 Years | 34 (9.7%) | 311 (88.3%) |
| 25 to 34 Years | 159 (31.0%) | 313 (61.0%) |
| 35 to 44 Years | 49 (7.1%) | 635 (91.9%) |
| 45 to 54 Years | 48 (7.0%) | 613 (89.1%) |
| 55 to 64 Years | 124 (16.2%) | 672 (87.8%) |
| 65 to 74 Years | 603 (98.9%) | 418 (68.5%) |
| 75 Years and over | 447 (98.9%) | 365 (80.7%) |
| Total | 1,736 (31.9%) | 4,421 (81.2%) |
Disability Status by Sex by Age in Ransom County
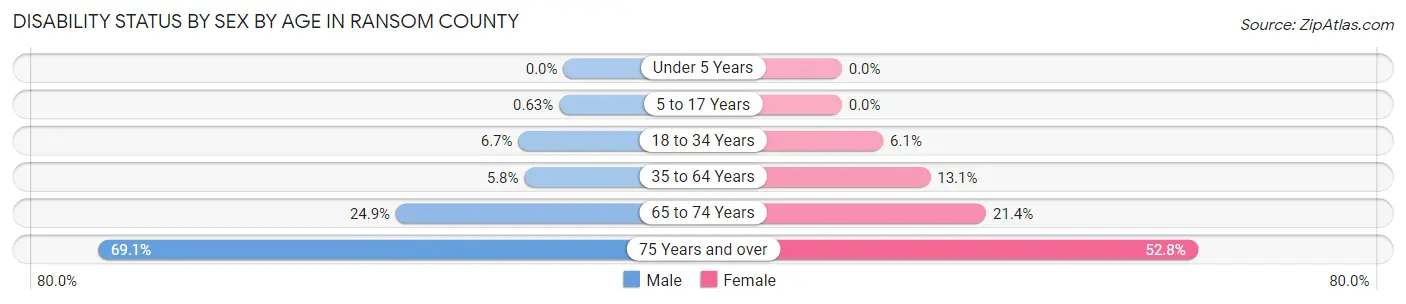
| Age Bracket | Male | Female |
| Under 5 Years | 0 (0.0%) | 0 (0.0%) |
| 5 to 17 Years | 3 (0.6%) | 0 (0.0%) |
| 18 to 34 Years | 37 (6.7%) | 27 (6.1%) |
| 35 to 64 Years | 62 (5.8%) | 141 (13.1%) |
| 65 to 74 Years | 89 (24.9%) | 54 (21.4%) |
| 75 Years and over | 141 (69.1%) | 131 (52.8%) |
Disability Class by Sex by Age in Ransom County
Disability Class: Hearing Difficulty
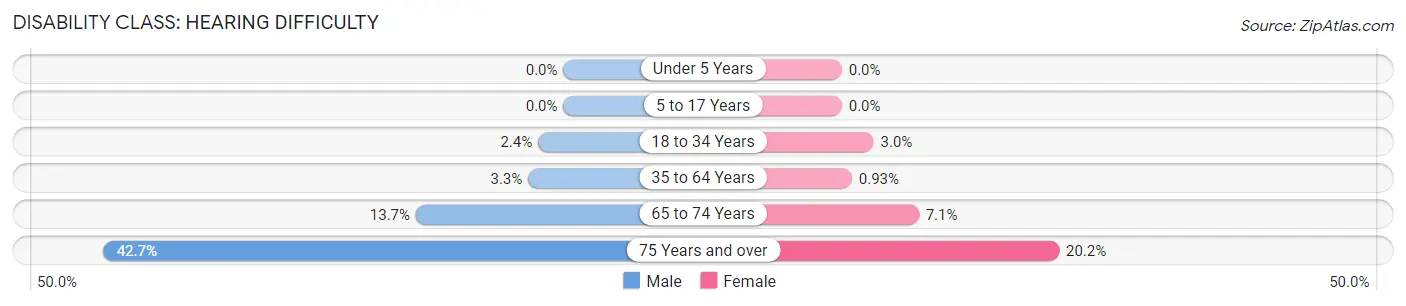
| Age Bracket | Male | Female |
| Under 5 Years | 0 (0.0%) | 0 (0.0%) |
| 5 to 17 Years | 0 (0.0%) | 0 (0.0%) |
| 18 to 34 Years | 13 (2.4%) | 13 (2.9%) |
| 35 to 64 Years | 35 (3.3%) | 10 (0.9%) |
| 65 to 74 Years | 49 (13.7%) | 18 (7.1%) |
| 75 Years and over | 87 (42.6%) | 50 (20.2%) |
Disability Class: Vision Difficulty
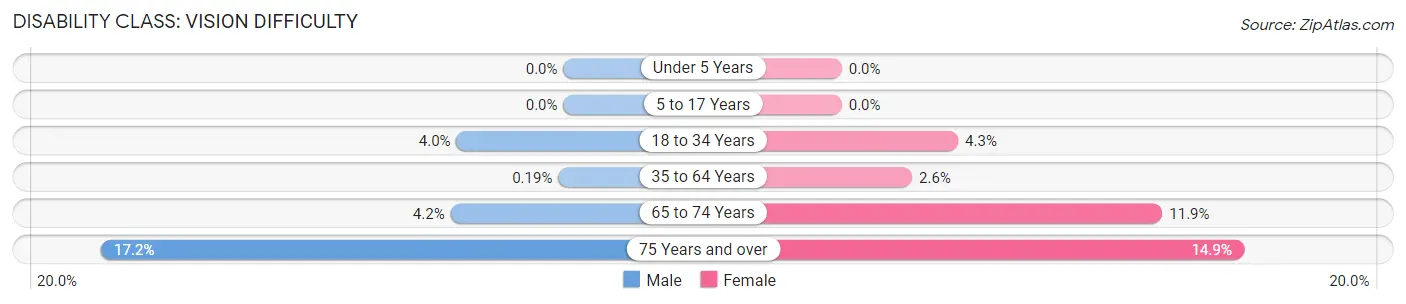
| Age Bracket | Male | Female |
| Under 5 Years | 0 (0.0%) | 0 (0.0%) |
| 5 to 17 Years | 0 (0.0%) | 0 (0.0%) |
| 18 to 34 Years | 22 (4.0%) | 19 (4.3%) |
| 35 to 64 Years | 2 (0.2%) | 28 (2.6%) |
| 65 to 74 Years | 15 (4.2%) | 30 (11.9%) |
| 75 Years and over | 35 (17.2%) | 37 (14.9%) |
Disability Class: Cognitive Difficulty
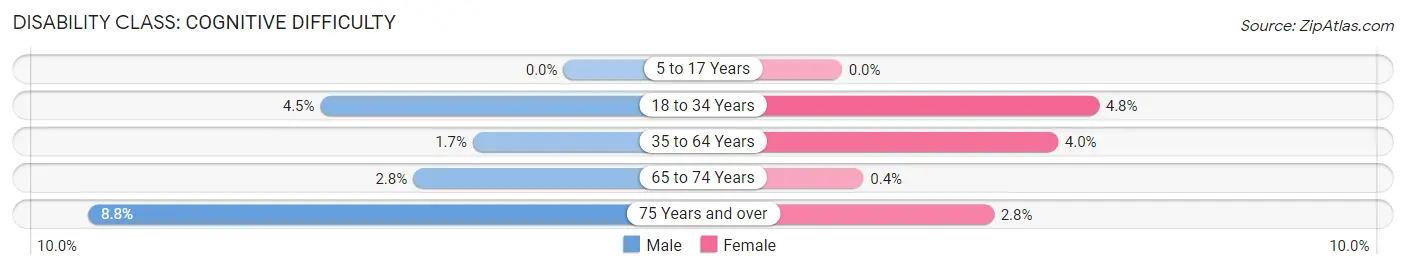
| Age Bracket | Male | Female |
| 5 to 17 Years | 0 (0.0%) | 0 (0.0%) |
| 18 to 34 Years | 25 (4.5%) | 21 (4.8%) |
| 35 to 64 Years | 18 (1.7%) | 43 (4.0%) |
| 65 to 74 Years | 10 (2.8%) | 1 (0.4%) |
| 75 Years and over | 18 (8.8%) | 7 (2.8%) |
Disability Class: Ambulatory Difficulty
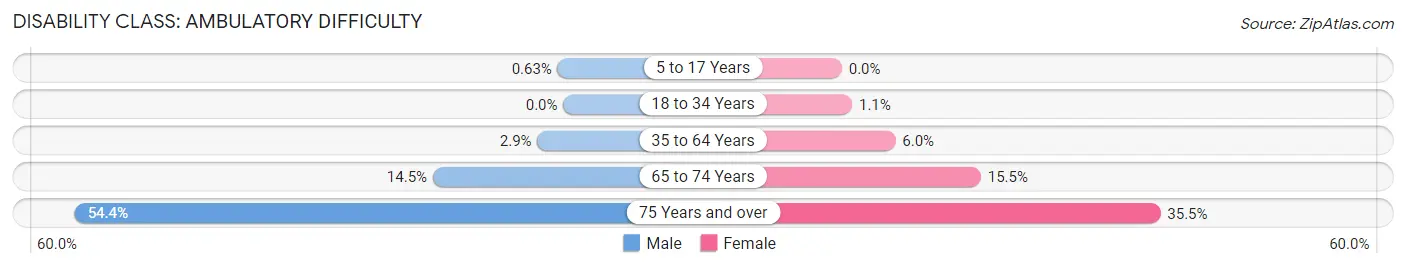
| Age Bracket | Male | Female |
| 5 to 17 Years | 3 (0.6%) | 0 (0.0%) |
| 18 to 34 Years | 0 (0.0%) | 5 (1.1%) |
| 35 to 64 Years | 31 (2.9%) | 64 (6.0%) |
| 65 to 74 Years | 52 (14.5%) | 39 (15.5%) |
| 75 Years and over | 111 (54.4%) | 88 (35.5%) |
Disability Class: Self-Care Difficulty
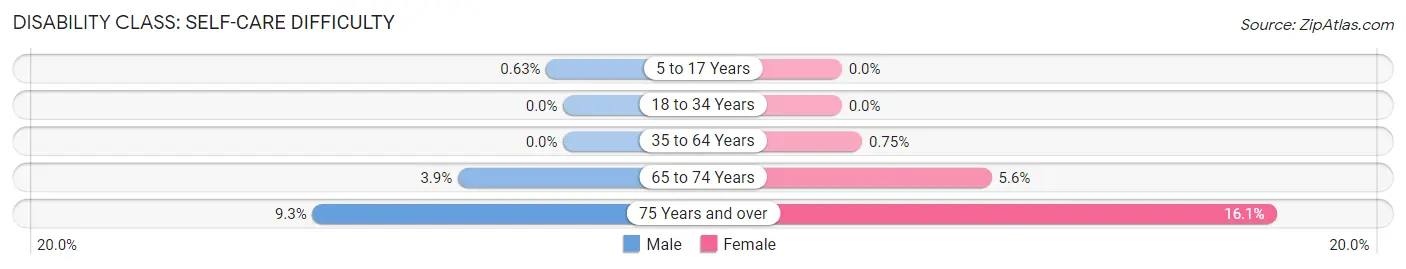
| Age Bracket | Male | Female |
| 5 to 17 Years | 3 (0.6%) | 0 (0.0%) |
| 18 to 34 Years | 0 (0.0%) | 0 (0.0%) |
| 35 to 64 Years | 0 (0.0%) | 8 (0.7%) |
| 65 to 74 Years | 14 (3.9%) | 14 (5.6%) |
| 75 Years and over | 19 (9.3%) | 40 (16.1%) |
Technology Access in Ransom County
Computing Device Access in Ransom County
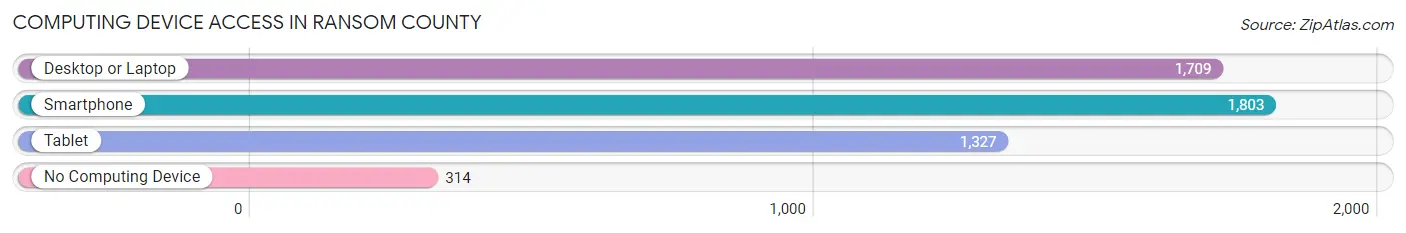
| Device Type | # Households | % Households |
| Desktop or Laptop | 1,709 | 72.8% |
| Smartphone | 1,803 | 76.8% |
| Tablet | 1,327 | 56.5% |
| No Computing Device | 314 | 13.4% |
| Total | 2,347 | 100.0% |
Internet Access in Ransom County
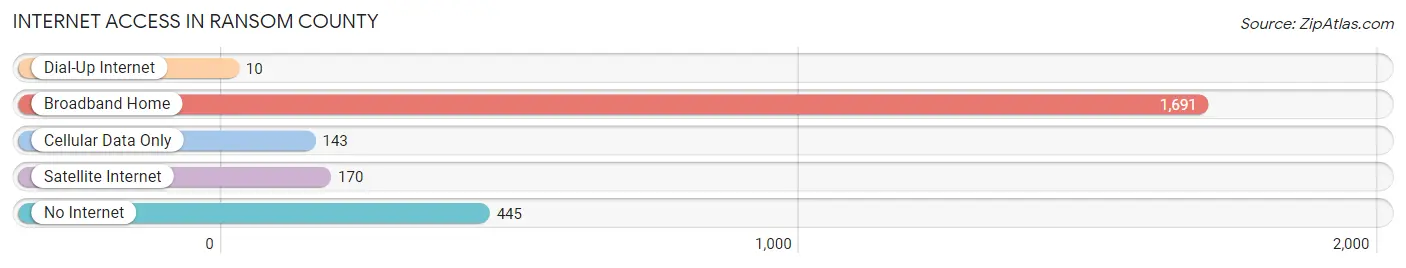
| Internet Type | # Households | % Households |
| Dial-Up Internet | 10 | 0.4% |
| Broadband Home | 1,691 | 72.1% |
| Cellular Data Only | 143 | 6.1% |
| Satellite Internet | 170 | 7.2% |
| No Internet | 445 | 19.0% |
| Total | 2,347 | 100.0% |
Ransom County Summary
Ransom County is located in the eastern part of North Dakota, in the Red River Valley. It is bordered by Richland County to the north, Sargent County to the east, LaMoure County to the south, and Dickey County to the west. The county seat is Lisbon, and the largest city is Enderlin.
History
Ransom County was established in 1873, and was named after Alexander Ransom, a Civil War general and former governor of Minnesota. The county was originally part of the Dakota Territory, and was part of the Dakota Territory until 1889, when it became part of the newly formed state of North Dakota.
The first settlers in Ransom County were mostly of German and Scandinavian descent. The first permanent settlement was established in 1872, and the county was officially organized in 1873. The first county seat was located in Lisbon, and the first courthouse was built in 1875.
Geography
Ransom County covers an area of 1,072 square miles, and is located in the Red River Valley. The county is mostly flat, with some rolling hills in the western part of the county. The county is drained by the Sheyenne River, which flows through the county from north to south.
The county is home to several lakes, including Lake Alice, Lake Ashtabula, and Lake LaMoure. The county also contains several state parks, including Sheyenne State Forest, Sheyenne National Grassland, and Sheyenne River State Park.
Economy
Ransom County has a diverse economy, with a mix of agriculture, manufacturing, and services. The county is home to several large agricultural operations, including grain and livestock farms. The county is also home to several manufacturing companies, including a large food processing plant and a furniture manufacturer.
The county also has a thriving service sector, with several businesses providing services such as banking, insurance, and healthcare. The county is also home to several retail stores, restaurants, and hotels.
Demographics
As of the 2010 census, the population of Ransom County was 6,845. The population is mostly white (96.2%), with small percentages of Native American (1.2%), African American (0.7%), and Asian (0.5%) residents. The median household income is $50,945, and the median home value is $118,400.
Ransom County is home to several small towns, including Enderlin, Lisbon, and Sheldon. The county is also home to several unincorporated communities, including Alice, Ashtabula, and LaMoure. The county is served by several school districts, including Enderlin Public Schools, Lisbon Public Schools, and Sheldon Public Schools.
Common Questions
What is the Total Population of Ransom County?
Total Population of Ransom County is 5,663.
What is the Total Male Population of Ransom County?
Total Male Population of Ransom County is 2,912.
What is the Total Female Population of Ransom County?
Total Female Population of Ransom County is 2,751.
What is the Ratio of Males per 100 Females in Ransom County?
There are 105.85 Males per 100 Females in Ransom County.
What is the Ratio of Females per 100 Males in Ransom County?
There are 94.47 Females per 100 Males in Ransom County.
What is the Median Population Age in Ransom County?
Median Population Age in Ransom County is 42.7 Years.
What is the Average Family Size in Ransom County
Average Family Size in Ransom County is 3.0 People.
What is the Average Household Size in Ransom County
Average Household Size in Ransom County is 2.3 People.
What is Per Capita Income in Ransom County?
Per Capita income in Ransom County is $36,706.
What is the Median Family Income in Ransom County?
Median Family Income in Ransom County is $89,663.
What is the Median Household income in Ransom County?
Median Household Income in Ransom County is $71,462.
What is Income or Wage Gap in Ransom County?
Income or Wage Gap in Ransom County is 37.6%.
Women in Ransom County earn 62.4 cents for every dollar earned by a man.
What is Inequality or Gini Index in Ransom County?
Inequality or Gini Index in Ransom County is 0.41.
How Large is the Labor Force in Ransom County?
There are 2,784 People in the Labor Forcein in Ransom County.
What is the Percentage of People in the Labor Force in Ransom County?
61.2% of People are in the Labor Force in Ransom County.
What is the Unemployment Rate in Ransom County?
Unemployment Rate in Ransom County is 2.9%.