Pierce County, ND
Pierce County Map
Pierce County Overview
3,999
TOTAL POPULATION
1,995
MALE POPULATION
2,004
FEMALE POPULATION
99.55
MALES / 100 FEMALES
100.45
FEMALES / 100 MALES
44.6
MEDIAN AGE
3.0
AVG FAMILY SIZE
2.3
AVG HOUSEHOLD SIZE
$35,931
PER CAPITA INCOME
$97,689
AVG FAMILY INCOME
$59,583
AVG HOUSEHOLD INCOME
45.8%
WAGE / INCOME GAP [ % ]
54.2¢/ $1
WAGE / INCOME GAP [ $ ]
0.43
INEQUALITY / GINI INDEX
1,883
LABOR FORCE [ PEOPLE ]
58.7%
PERCENT IN LABOR FORCE
1.0%
UNEMPLOYMENT RATE
Pierce County Area Codes
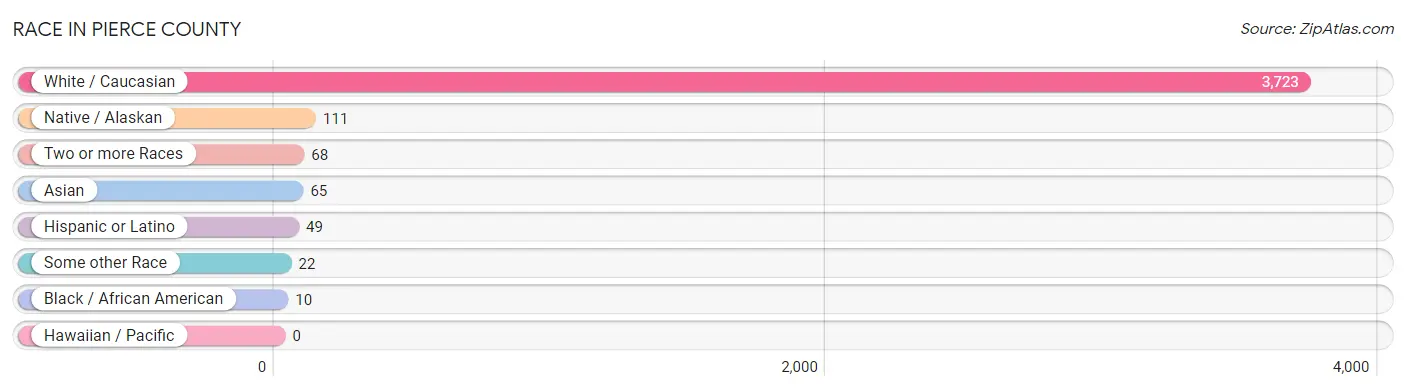
Race in Pierce County
The most populous races in Pierce County are White / Caucasian (3,723 | 93.1%), Native / Alaskan (111 | 2.8%), and Two or more Races (68 | 1.7%).
| Race | # Population | % Population |
| Asian | 65 | 1.6% |
| Black / African American | 10 | 0.3% |
| Hawaiian / Pacific | 0 | 0.0% |
| Hispanic or Latino | 49 | 1.2% |
| Native / Alaskan | 111 | 2.8% |
| White / Caucasian | 3,723 | 93.1% |
| Two or more Races | 68 | 1.7% |
| Some other Race | 22 | 0.5% |
| Total | 3,999 | 100.0% |
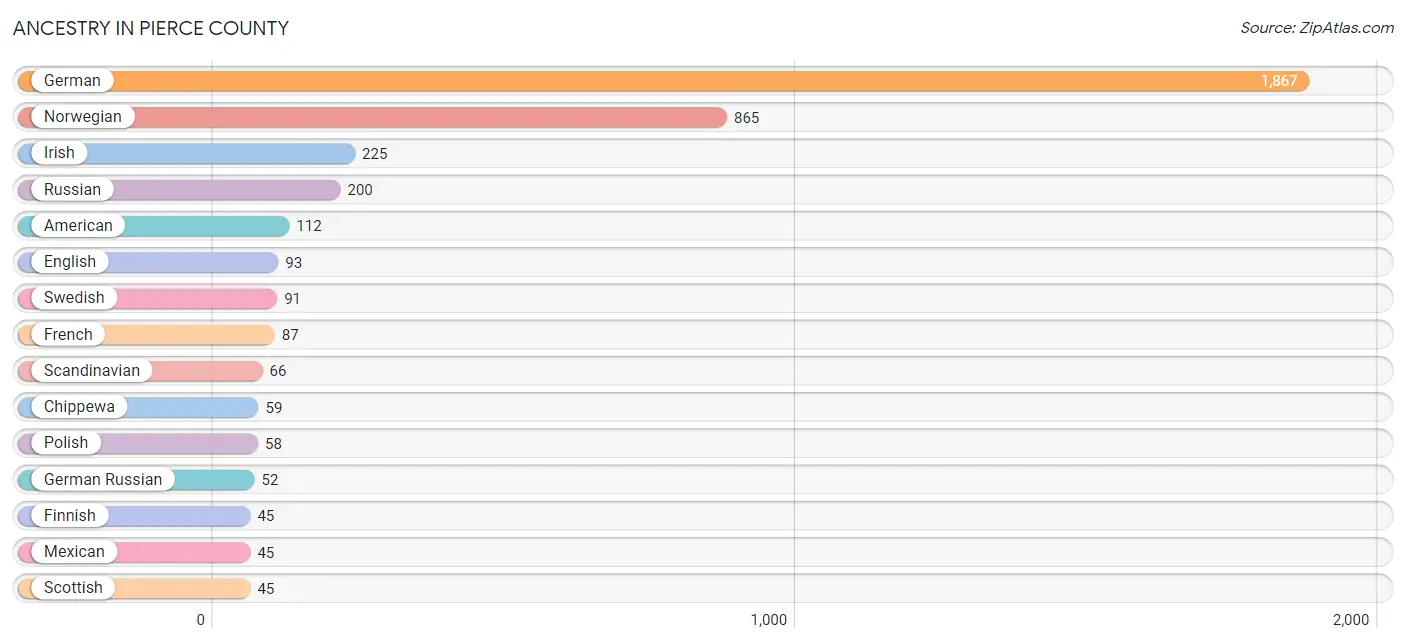
Ancestry in Pierce County
The most populous ancestries reported in Pierce County are German (1,867 | 46.7%), Norwegian (865 | 21.6%), Irish (225 | 5.6%), Russian (200 | 5.0%), and American (112 | 2.8%), together accounting for 81.8% of all Pierce County residents.
| Ancestry | # Population | % Population |
| Alaska Native | 12 | 0.3% |
| American | 112 | 2.8% |
| Austrian | 10 | 0.3% |
| Bhutanese | 2 | 0.1% |
| Chippewa | 59 | 1.5% |
| Czech | 8 | 0.2% |
| Danish | 15 | 0.4% |
| Dutch | 40 | 1.0% |
| Eastern European | 8 | 0.2% |
| English | 93 | 2.3% |
| European | 17 | 0.4% |
| Finnish | 45 | 1.1% |
| French | 87 | 2.2% |
| French Canadian | 15 | 0.4% |
| German | 1,867 | 46.7% |
| German Russian | 52 | 1.3% |
| Hungarian | 7 | 0.2% |
| Icelander | 12 | 0.3% |
| Irish | 225 | 5.6% |
| Italian | 28 | 0.7% |
| Jamaican | 2 | 0.1% |
| Korean | 26 | 0.6% |
| Mexican | 45 | 1.1% |
| Northern European | 18 | 0.4% |
| Norwegian | 865 | 21.6% |
| Polish | 58 | 1.5% |
| Russian | 200 | 5.0% |
| Scandinavian | 66 | 1.7% |
| Scotch-Irish | 19 | 0.5% |
| Scottish | 45 | 1.1% |
| Sioux | 43 | 1.1% |
| Sri Lankan | 17 | 0.4% |
| Swedish | 91 | 2.3% |
| Swiss | 25 | 0.6% |
| Thai | 20 | 0.5% |
| Welsh | 6 | 0.2% | View All 36 Rows |
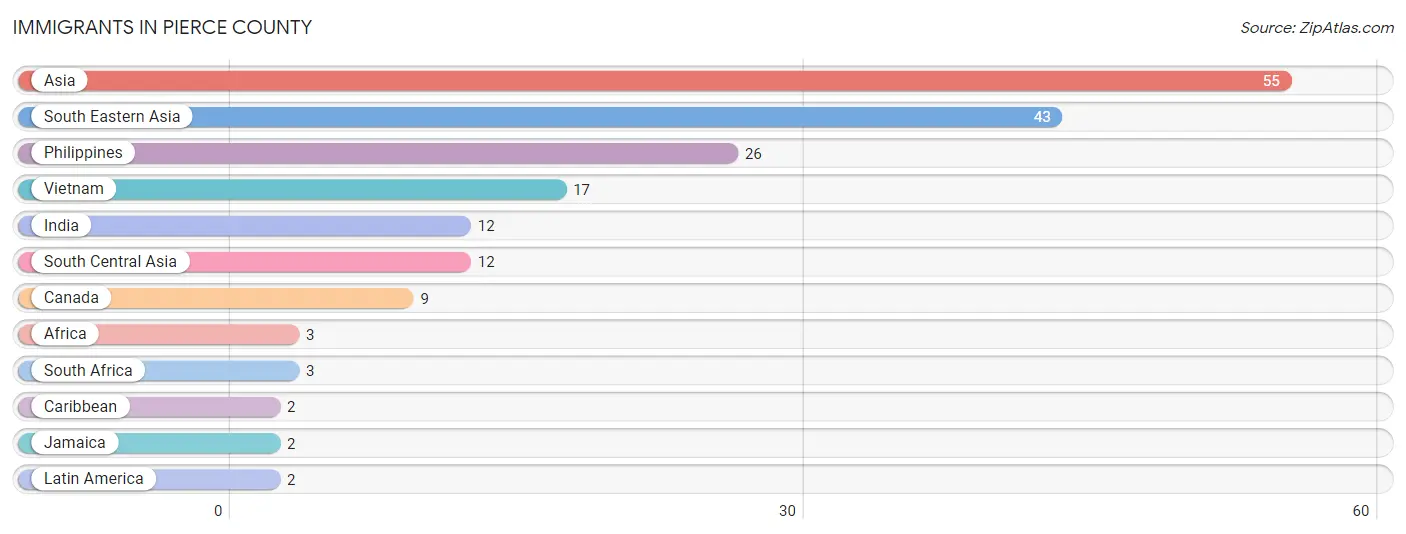
Immigrants in Pierce County
The most numerous immigrant groups reported in Pierce County came from Asia (55 | 1.4%), South Eastern Asia (43 | 1.1%), Philippines (26 | 0.6%), Vietnam (17 | 0.4%), and India (12 | 0.3%), together accounting for 3.8% of all Pierce County residents.
| Immigration Origin | # Population | % Population |
| Africa | 3 | 0.1% |
| Asia | 55 | 1.4% |
| Canada | 9 | 0.2% |
| Caribbean | 2 | 0.1% |
| India | 12 | 0.3% |
| Jamaica | 2 | 0.1% |
| Latin America | 2 | 0.1% |
| Philippines | 26 | 0.6% |
| South Africa | 3 | 0.1% |
| South Central Asia | 12 | 0.3% |
| South Eastern Asia | 43 | 1.1% |
| Vietnam | 17 | 0.4% | View All 12 Rows |
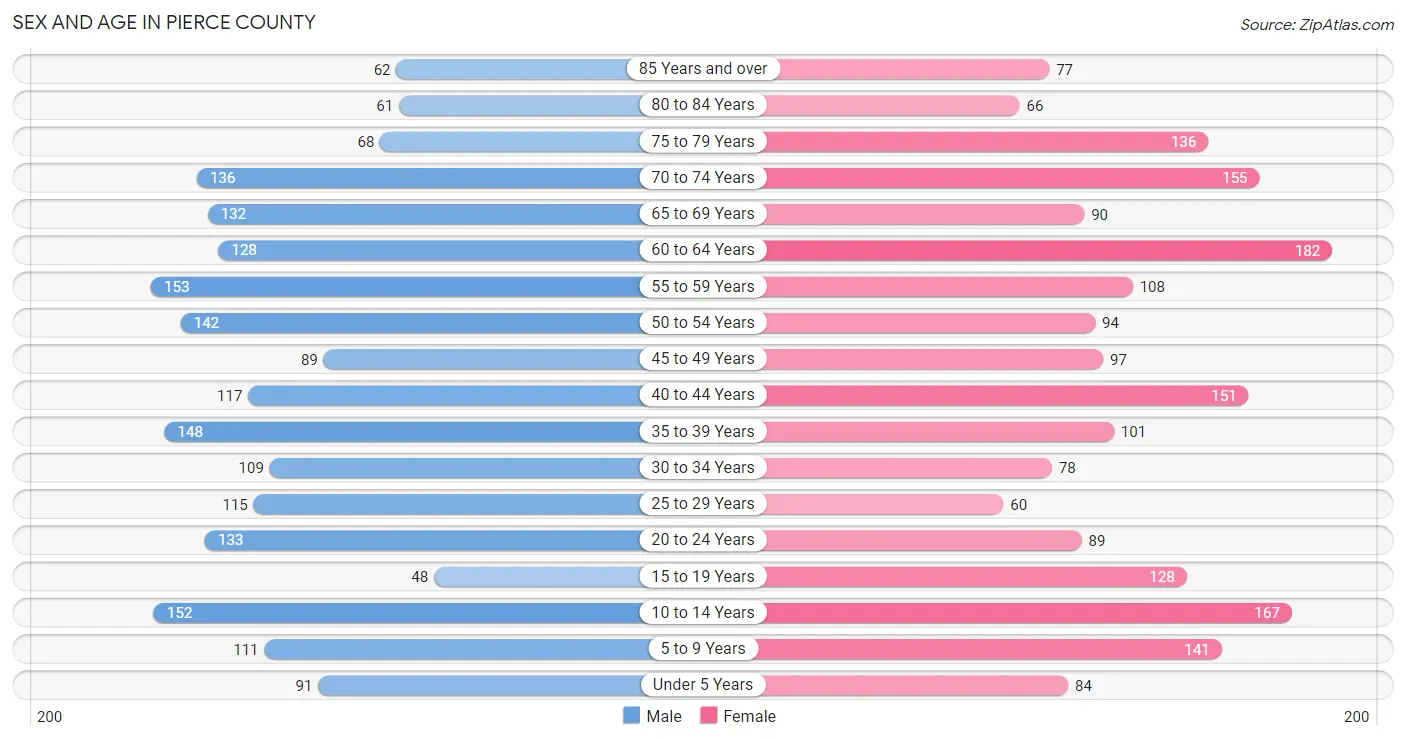
Sex and Age in Pierce County
Sex and Age in Pierce County
The most populous age groups in Pierce County are 55 to 59 Years (153 | 7.7%) for men and 60 to 64 Years (182 | 9.1%) for women.
| Age Bracket | Male | Female |
| Under 5 Years | 91 (4.6%) | 84 (4.2%) |
| 5 to 9 Years | 111 (5.6%) | 141 (7.0%) |
| 10 to 14 Years | 152 (7.6%) | 167 (8.3%) |
| 15 to 19 Years | 48 (2.4%) | 128 (6.4%) |
| 20 to 24 Years | 133 (6.7%) | 89 (4.4%) |
| 25 to 29 Years | 115 (5.8%) | 60 (3.0%) |
| 30 to 34 Years | 109 (5.5%) | 78 (3.9%) |
| 35 to 39 Years | 148 (7.4%) | 101 (5.0%) |
| 40 to 44 Years | 117 (5.9%) | 151 (7.5%) |
| 45 to 49 Years | 89 (4.5%) | 97 (4.8%) |
| 50 to 54 Years | 142 (7.1%) | 94 (4.7%) |
| 55 to 59 Years | 153 (7.7%) | 108 (5.4%) |
| 60 to 64 Years | 128 (6.4%) | 182 (9.1%) |
| 65 to 69 Years | 132 (6.6%) | 90 (4.5%) |
| 70 to 74 Years | 136 (6.8%) | 155 (7.7%) |
| 75 to 79 Years | 68 (3.4%) | 136 (6.8%) |
| 80 to 84 Years | 61 (3.1%) | 66 (3.3%) |
| 85 Years and over | 62 (3.1%) | 77 (3.8%) |
| Total | 1,995 (100.0%) | 2,004 (100.0%) |
Families and Households in Pierce County
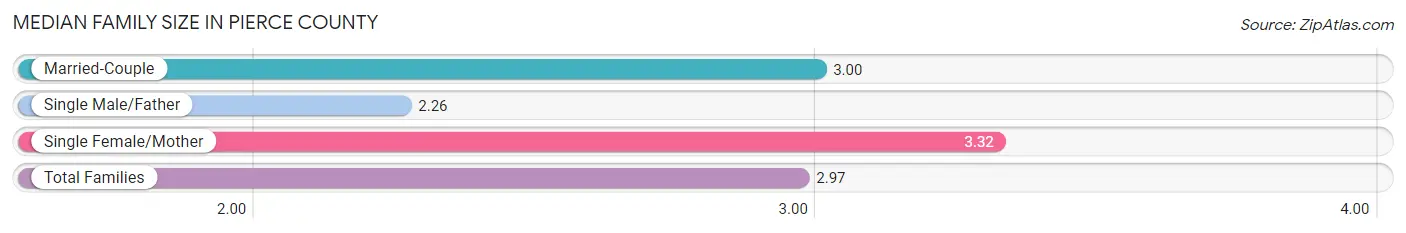
Median Family Size in Pierce County
The median family size in Pierce County is 2.97 persons per family, with single female/mother families (66 | 6.5%) accounting for the largest median family size of 3.32 persons per family. On the other hand, single male/father families (74 | 7.3%) represent the smallest median family size with 2.26 persons per family.
| Family Type | # Families | Family Size |
| Married-Couple | 878 (86.3%) | 3.00 |
| Single Male/Father | 74 (7.3%) | 2.26 |
| Single Female/Mother | 66 (6.5%) | 3.32 |
| Total Families | 1,018 (100.0%) | 2.97 |
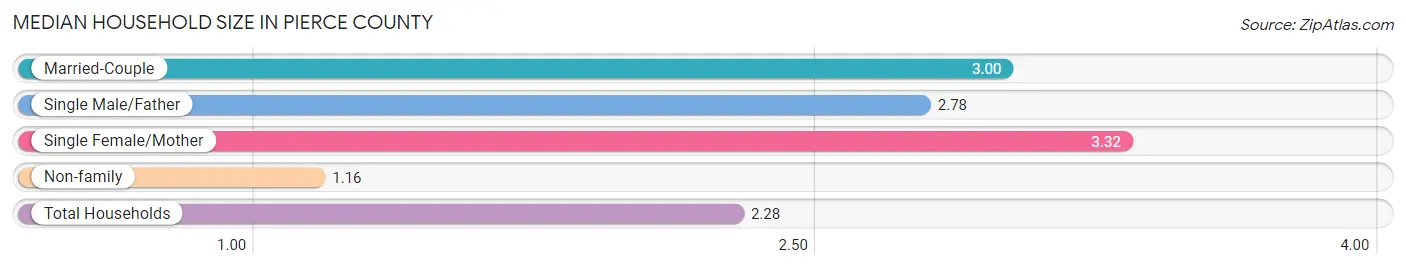
Median Household Size in Pierce County
The median household size in Pierce County is 2.28 persons per household, with single female/mother households (66 | 3.9%) accounting for the largest median household size of 3.32 persons per household. non-family households (671 | 39.7%) represent the smallest median household size with 1.16 persons per household.
| Household Type | # Households | Household Size |
| Married-Couple | 878 (52.0%) | 3.00 |
| Single Male/Father | 74 (4.4%) | 2.78 |
| Single Female/Mother | 66 (3.9%) | 3.32 |
| Non-family | 671 (39.7%) | 1.16 |
| Total Households | 1,689 (100.0%) | 2.28 |
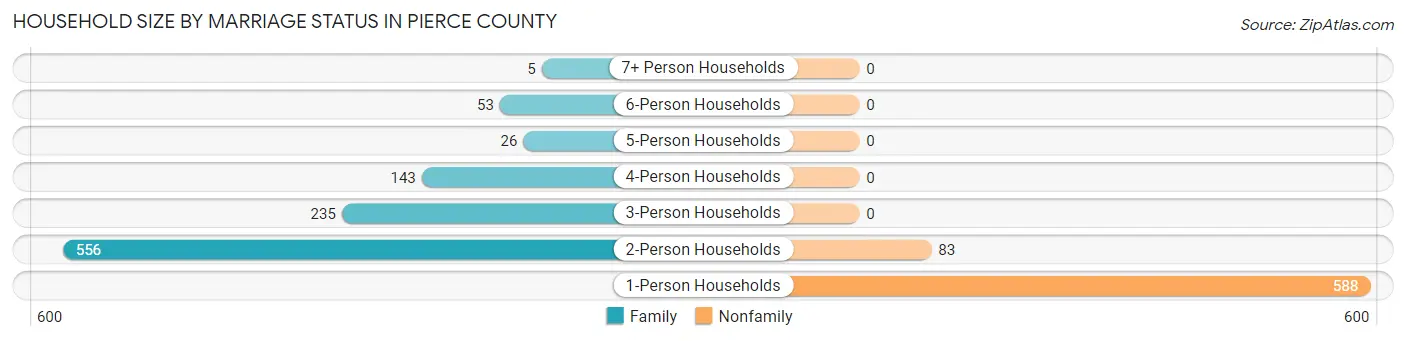
Household Size by Marriage Status in Pierce County
Out of a total of 1,689 households in Pierce County, 1,018 (60.3%) are family households, while 671 (39.7%) are nonfamily households. The most numerous type of family households are 2-person households, comprising 556, and the most common type of nonfamily households are 1-person households, comprising 588.
| Household Size | Family Households | Nonfamily Households |
| 1-Person Households | - | 588 (34.8%) |
| 2-Person Households | 556 (32.9%) | 83 (4.9%) |
| 3-Person Households | 235 (13.9%) | 0 (0.0%) |
| 4-Person Households | 143 (8.5%) | 0 (0.0%) |
| 5-Person Households | 26 (1.5%) | 0 (0.0%) |
| 6-Person Households | 53 (3.1%) | 0 (0.0%) |
| 7+ Person Households | 5 (0.3%) | 0 (0.0%) |
| Total | 1,018 (60.3%) | 671 (39.7%) |
Female Fertility in Pierce County
Fertility by Age in Pierce County
Average fertility rate in Pierce County is 34.0 births per 1,000 women. Women in the age bracket of 20 to 34 years have the highest fertility rate with 101.0 births per 1,000 women. Women in the age bracket of 20 to 34 years acount for 92.0% of all women with births.
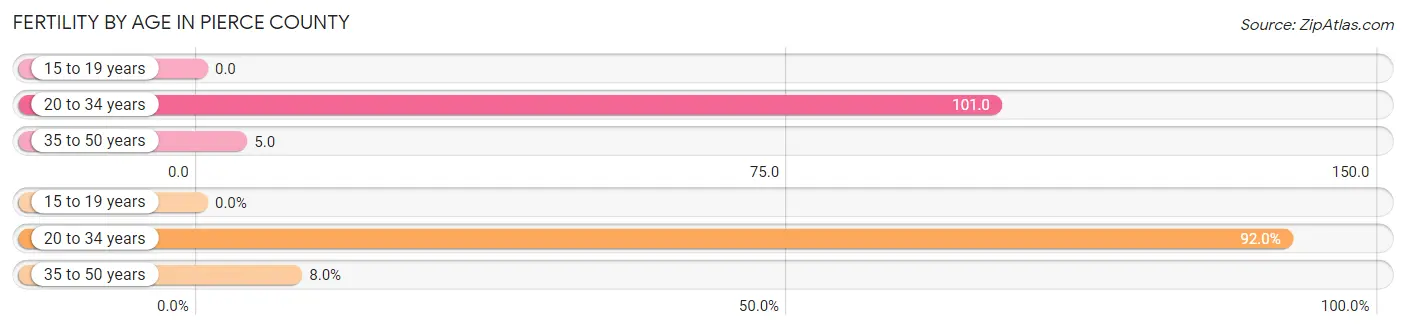
| Age Bracket | Women with Births | Births / 1,000 Women |
| 15 to 19 years | 0 (0.0%) | 0.0 |
| 20 to 34 years | 23 (92.0%) | 101.0 |
| 35 to 50 years | 2 (8.0%) | 5.0 |
| Total | 25 (100.0%) | 34.0 |
Fertility by Age by Marriage Status in Pierce County
44.0% of women with births (25) in Pierce County are married. The highest percentage of unmarried women with births falls into 20 to 34 years age bracket with 60.9% of them unmarried at the time of birth, while the lowest percentage of unmarried women with births belong to 35 to 50 years age bracket with 0.0% of them unmarried.
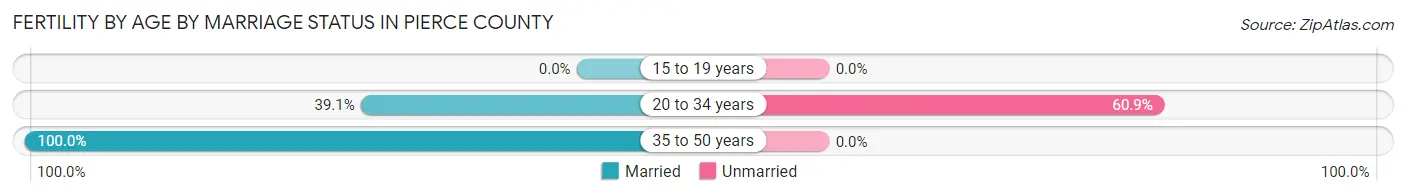
| Age Bracket | Married | Unmarried |
| 15 to 19 years | 0 (0.0%) | 0 (0.0%) |
| 20 to 34 years | 9 (39.1%) | 14 (60.9%) |
| 35 to 50 years | 2 (100.0%) | 0 (0.0%) |
| Total | 11 (44.0%) | 14 (56.0%) |
Fertility by Education in Pierce County
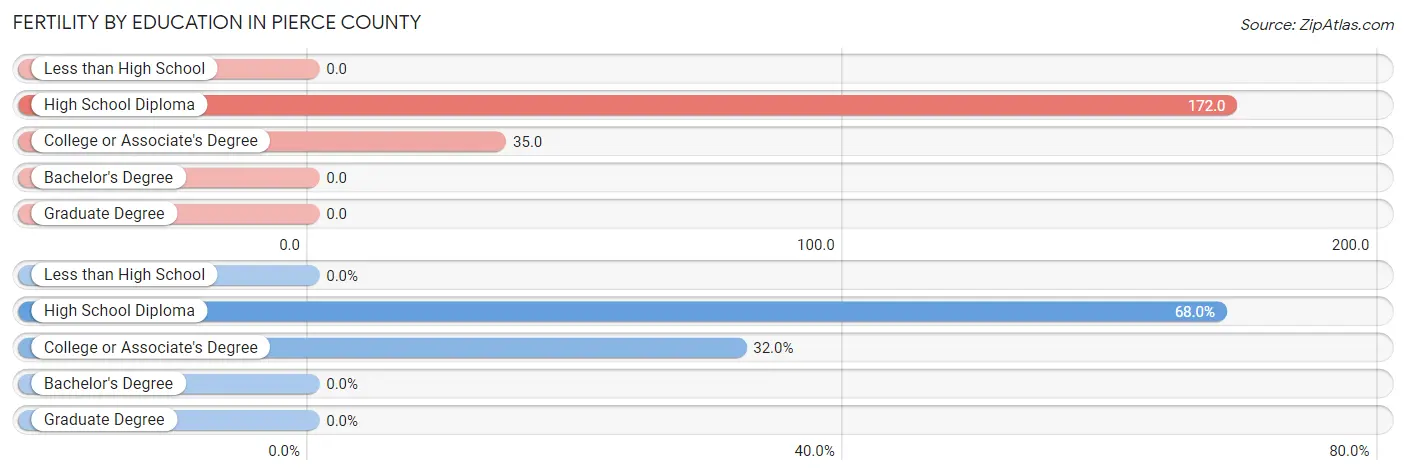
| Educational Attainment | Women with Births | Births / 1,000 Women |
| Less than High School | 0 (0.0%) | 0.0 |
| High School Diploma | 17 (68.0%) | 172.0 |
| College or Associate's Degree | 8 (32.0%) | 35.0 |
| Bachelor's Degree | 0 (0.0%) | 0.0 |
| Graduate Degree | 0 (0.0%) | 0.0 |
| Total | 25 (100.0%) | 34.0 |
Fertility by Education by Marriage Status in Pierce County
56.0% of women with births in Pierce County are unmarried. Women with the educational attainment of college or associate's degree are most likely to be married with 100.0% of them married at childbirth, while women with the educational attainment of high school diploma are least likely to be married with 82.4% of them unmarried at childbirth.
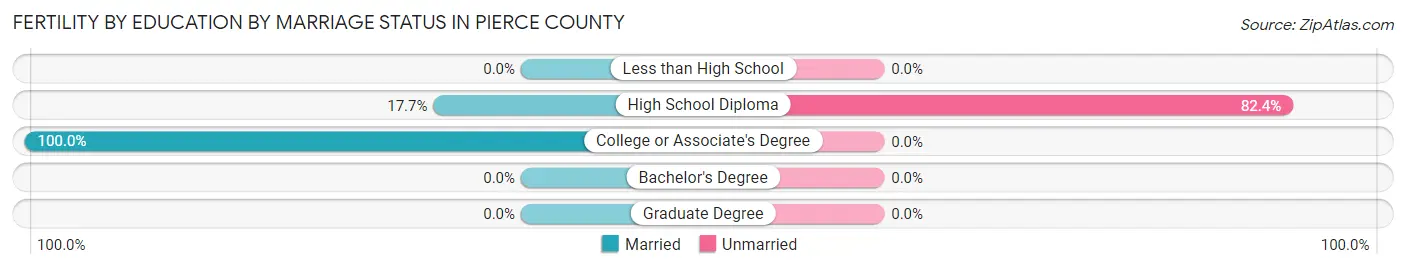
| Educational Attainment | Married | Unmarried |
| Less than High School | 0 (0.0%) | 0 (0.0%) |
| High School Diploma | 3 (17.6%) | 14 (82.4%) |
| College or Associate's Degree | 8 (100.0%) | 0 (0.0%) |
| Bachelor's Degree | 0 (0.0%) | 0 (0.0%) |
| Graduate Degree | 0 (0.0%) | 0 (0.0%) |
| Total | 11 (44.0%) | 14 (56.0%) |
Income in Pierce County
Income Overview in Pierce County
Per Capita Income in Pierce County is $35,931, while median incomes of families and households are $97,689 and $59,583 respectively.
| Characteristic | Number | Measure |
| Per Capita Income | 3,999 | $35,931 |
| Median Family Income | 1,018 | $97,689 |
| Mean Family Income | 1,018 | $106,064 |
| Median Household Income | 1,689 | $59,583 |
| Mean Household Income | 1,689 | $79,592 |
| Income Deficit | 1,018 | $0 |
| Wage / Income Gap (%) | 3,999 | 45.81% |
| Wage / Income Gap ($) | 3,999 | 54.19¢ per $1 |
| Gini / Inequality Index | 3,999 | 0.43 |
Earnings by Sex in Pierce County
Average Earnings in Pierce County are $41,615, $52,632 for men and $28,520 for women, a difference of 45.8%.
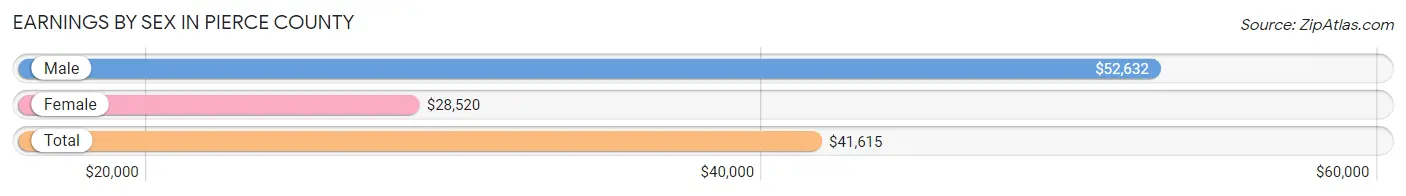
| Sex | Number | Average Earnings |
| Male | 1,198 (56.3%) | $52,632 |
| Female | 929 (43.7%) | $28,520 |
| Total | 2,127 (100.0%) | $41,615 |
Earnings by Sex by Income Bracket in Pierce County
The most common earnings brackets in Pierce County are $100,000+ for men (256 | 21.4%) and $12,500 to $14,999 for women (73 | 7.9%).
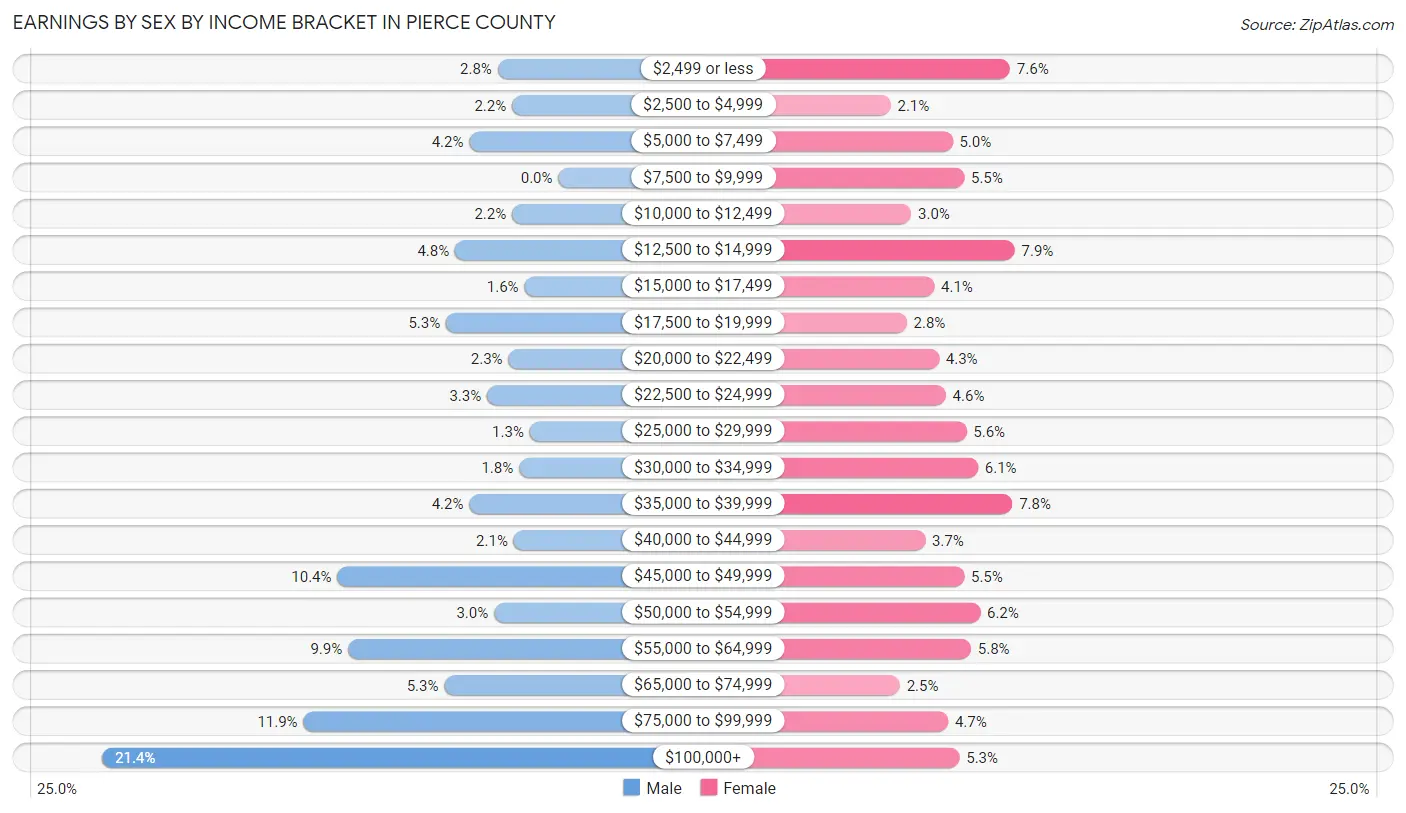
| Income | Male | Female |
| $2,499 or less | 34 (2.8%) | 71 (7.6%) |
| $2,500 to $4,999 | 26 (2.2%) | 19 (2.1%) |
| $5,000 to $7,499 | 50 (4.2%) | 46 (5.0%) |
| $7,500 to $9,999 | 0 (0.0%) | 51 (5.5%) |
| $10,000 to $12,499 | 26 (2.2%) | 28 (3.0%) |
| $12,500 to $14,999 | 58 (4.8%) | 73 (7.9%) |
| $15,000 to $17,499 | 19 (1.6%) | 38 (4.1%) |
| $17,500 to $19,999 | 63 (5.3%) | 26 (2.8%) |
| $20,000 to $22,499 | 28 (2.3%) | 40 (4.3%) |
| $22,500 to $24,999 | 40 (3.3%) | 43 (4.6%) |
| $25,000 to $29,999 | 16 (1.3%) | 52 (5.6%) |
| $30,000 to $34,999 | 22 (1.8%) | 57 (6.1%) |
| $35,000 to $39,999 | 50 (4.2%) | 72 (7.7%) |
| $40,000 to $44,999 | 25 (2.1%) | 34 (3.7%) |
| $45,000 to $49,999 | 124 (10.3%) | 51 (5.5%) |
| $50,000 to $54,999 | 36 (3.0%) | 58 (6.2%) |
| $55,000 to $64,999 | 118 (9.9%) | 54 (5.8%) |
| $65,000 to $74,999 | 64 (5.3%) | 23 (2.5%) |
| $75,000 to $99,999 | 143 (11.9%) | 44 (4.7%) |
| $100,000+ | 256 (21.4%) | 49 (5.3%) |
| Total | 1,198 (100.0%) | 929 (100.0%) |
Earnings by Sex by Educational Attainment in Pierce County
Average earnings in Pierce County are $56,942 for men and $35,000 for women, a difference of 38.5%. Men with an educational attainment of bachelor's degree enjoy the highest average annual earnings of $84,875, while those with high school diploma education earn the least with $38,482. Women with an educational attainment of graduate degree earn the most with the average annual earnings of $58,750, while those with high school diploma education have the smallest earnings of $15,592.
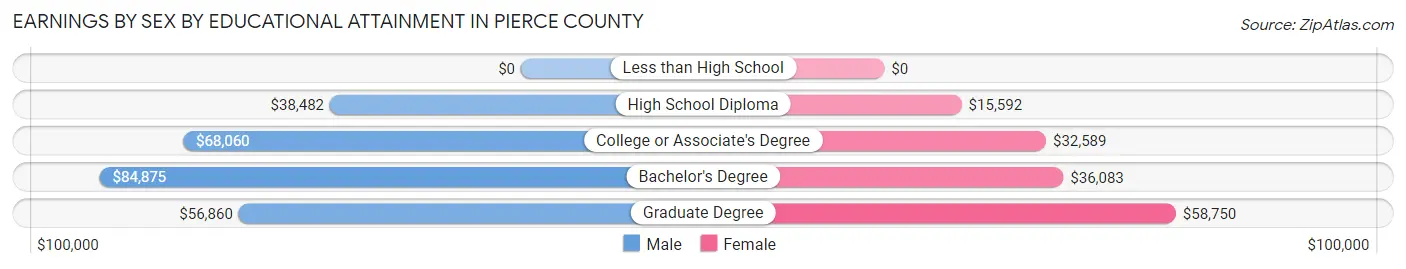
| Educational Attainment | Male Income | Female Income |
| Less than High School | - | - |
| High School Diploma | $38,482 | $15,592 |
| College or Associate's Degree | $68,060 | $32,589 |
| Bachelor's Degree | $84,875 | $36,083 |
| Graduate Degree | $56,860 | $58,750 |
| Total | $56,942 | $35,000 |
Family Income in Pierce County
Family Income Brackets in Pierce County
According to the Pierce County family income data, there are 263 families falling into the $100,000 to $149,999 income range, which is the most common income bracket and makes up 25.8% of all families.
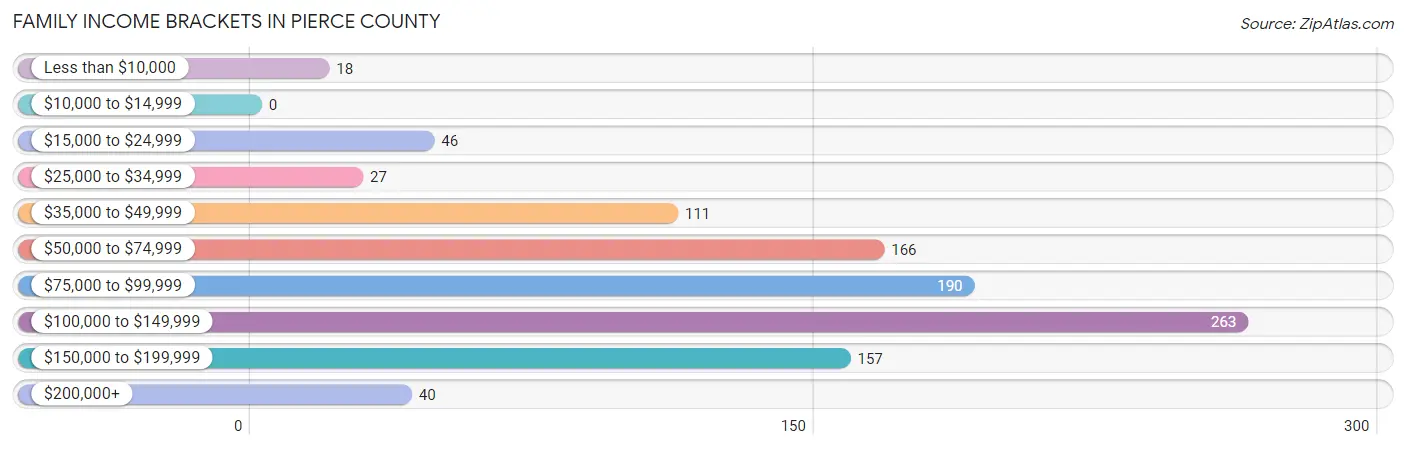
| Income Bracket | # Families | % Families |
| Less than $10,000 | 18 | 1.8% |
| $10,000 to $14,999 | 0 | 0.0% |
| $15,000 to $24,999 | 46 | 4.5% |
| $25,000 to $34,999 | 27 | 2.7% |
| $35,000 to $49,999 | 111 | 10.9% |
| $50,000 to $74,999 | 166 | 16.3% |
| $75,000 to $99,999 | 190 | 18.7% |
| $100,000 to $149,999 | 263 | 25.8% |
| $150,000 to $199,999 | 157 | 15.4% |
| $200,000+ | 40 | 3.9% |
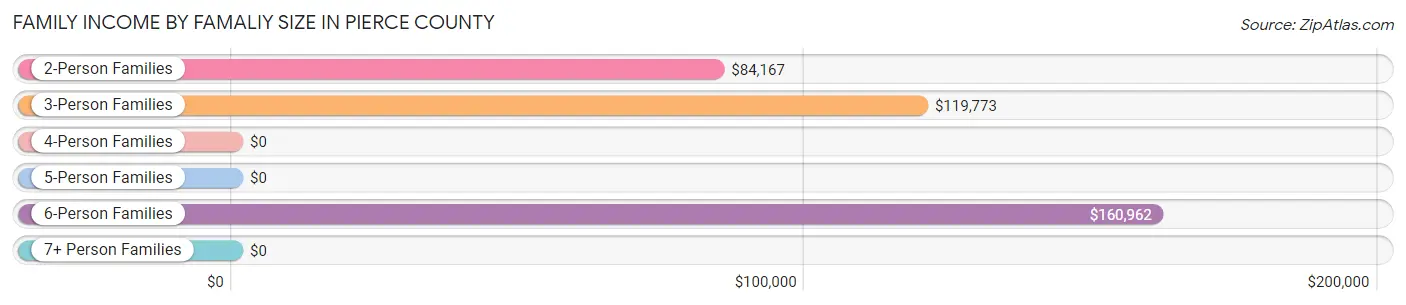
Family Income by Famaliy Size in Pierce County
6-person families (48 | 4.7%) account for the highest median family income in Pierce County with $160,962 per family, while 2-person families (556 | 54.6%) have the highest median income of $42,084 per family member.
| Income Bracket | # Families | Median Income |
| 2-Person Families | 556 (54.6%) | $84,167 |
| 3-Person Families | 250 (24.6%) | $119,773 |
| 4-Person Families | 133 (13.1%) | $0 |
| 5-Person Families | 26 (2.5%) | $0 |
| 6-Person Families | 48 (4.7%) | $160,962 |
| 7+ Person Families | 5 (0.5%) | $0 |
| Total | 1,018 (100.0%) | $97,689 |
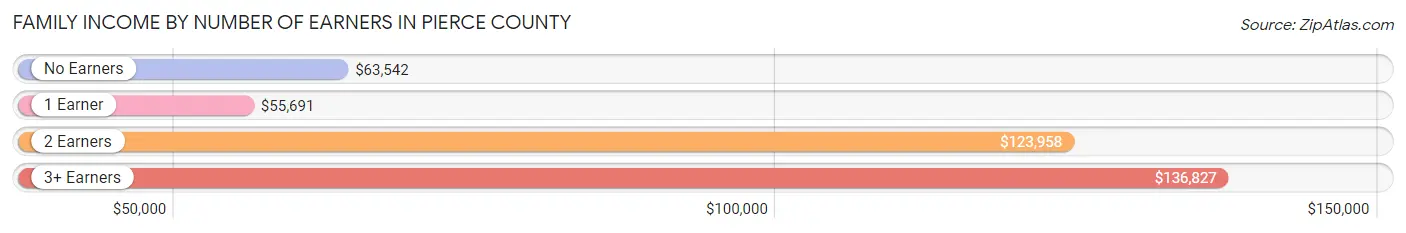
Family Income by Number of Earners in Pierce County
The median family income in Pierce County is $97,689, with families comprising 3+ earners (153) having the highest median family income of $136,827, while families with 1 earner (298) have the lowest median family income of $55,691, accounting for 15.0% and 29.3% of families, respectively.
| Number of Earners | # Families | Median Income |
| No Earners | 177 (17.4%) | $63,542 |
| 1 Earner | 298 (29.3%) | $55,691 |
| 2 Earners | 390 (38.3%) | $123,958 |
| 3+ Earners | 153 (15.0%) | $136,827 |
| Total | 1,018 (100.0%) | $97,689 |
Household Income in Pierce County
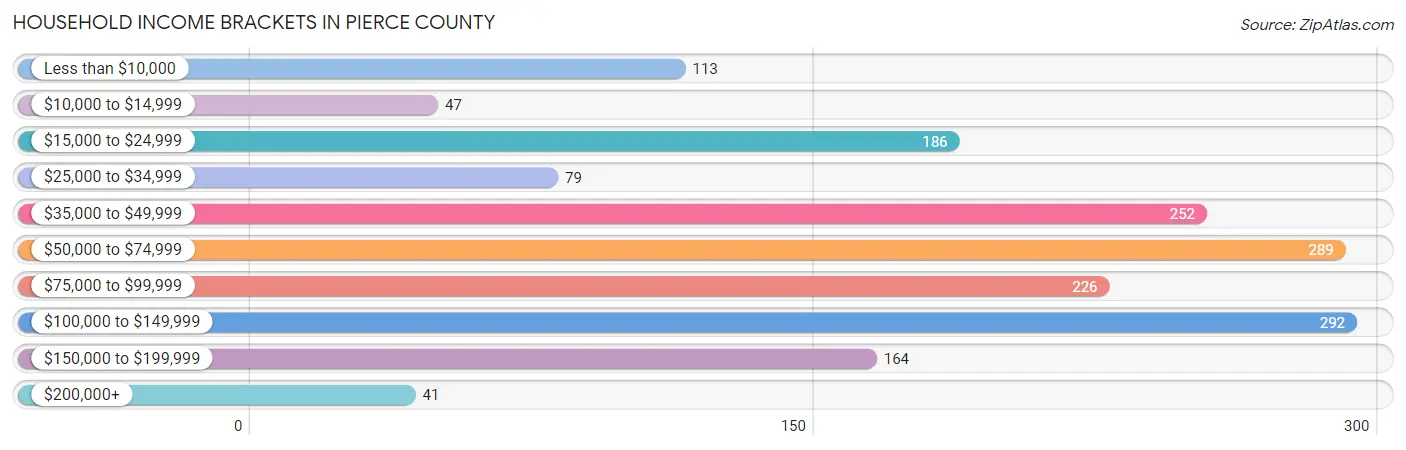
Household Income Brackets in Pierce County
With 292 households falling in the category, the $100,000 to $149,999 income range is the most frequent in Pierce County, accounting for 17.3% of all households. In contrast, only 41 households (2.4%) fall into the $200,000+ income bracket, making it the least populous group.
| Income Bracket | # Households | % Households |
| Less than $10,000 | 113 | 6.7% |
| $10,000 to $14,999 | 47 | 2.8% |
| $15,000 to $24,999 | 186 | 11.0% |
| $25,000 to $34,999 | 79 | 4.7% |
| $35,000 to $49,999 | 252 | 14.9% |
| $50,000 to $74,999 | 289 | 17.1% |
| $75,000 to $99,999 | 226 | 13.4% |
| $100,000 to $149,999 | 292 | 17.3% |
| $150,000 to $199,999 | 164 | 9.7% |
| $200,000+ | 41 | 2.4% |
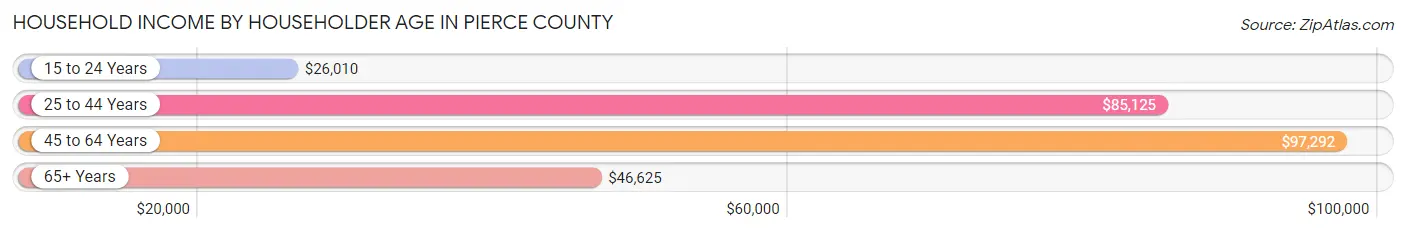
Household Income by Householder Age in Pierce County
The median household income in Pierce County is $59,583, with the highest median household income of $97,292 found in the 45 to 64 years age bracket for the primary householder. A total of 551 households (32.6%) fall into this category. Meanwhile, the 15 to 24 years age bracket for the primary householder has the lowest median household income of $26,010, with 87 households (5.1%) in this group.
| Income Bracket | # Households | Median Income |
| 15 to 24 Years | 87 (5.1%) | $26,010 |
| 25 to 44 Years | 431 (25.5%) | $85,125 |
| 45 to 64 Years | 551 (32.6%) | $97,292 |
| 65+ Years | 620 (36.7%) | $46,625 |
| Total | 1,689 (100.0%) | $59,583 |
Poverty in Pierce County
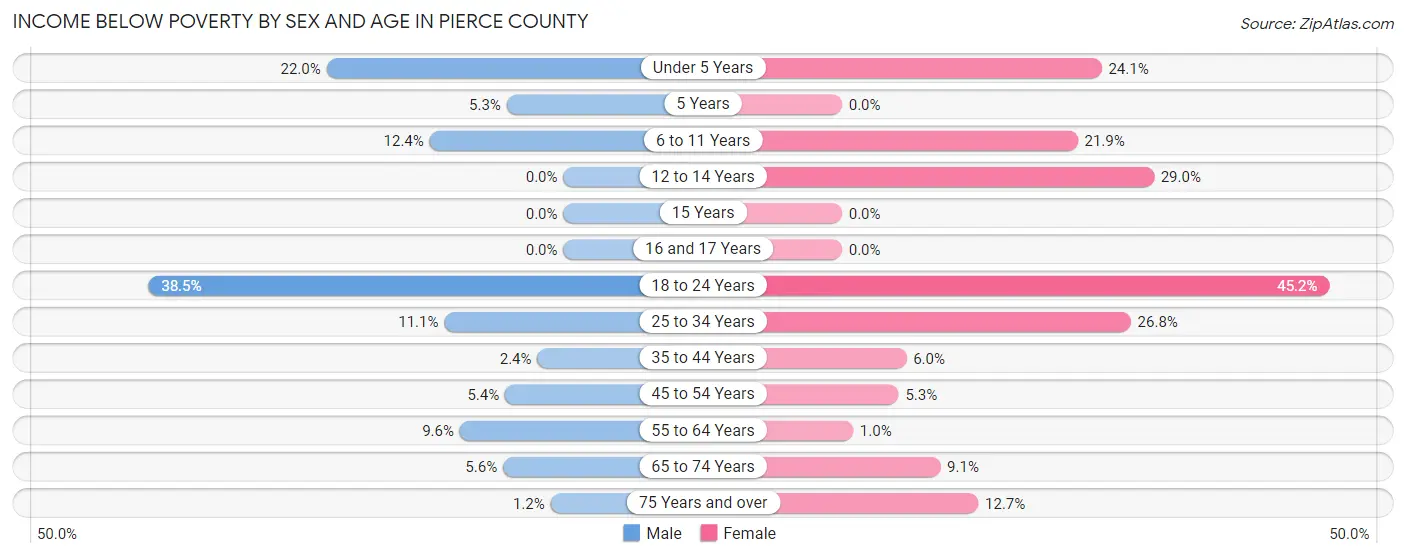
Income Below Poverty by Sex and Age in Pierce County
With 8.9% poverty level for males and 13.4% for females among the residents of Pierce County, 18 to 24 year old males and 18 to 24 year old females are the most vulnerable to poverty, with 47 males (38.5%) and 57 females (45.2%) in their respective age groups living below the poverty level.
| Age Bracket | Male | Female |
| Under 5 Years | 20 (22.0%) | 20 (24.1%) |
| 5 Years | 2 (5.3%) | 0 (0.0%) |
| 6 to 11 Years | 17 (12.4%) | 56 (21.9%) |
| 12 to 14 Years | 0 (0.0%) | 11 (28.9%) |
| 15 Years | 0 (0.0%) | 0 (0.0%) |
| 16 and 17 Years | 0 (0.0%) | 0 (0.0%) |
| 18 to 24 Years | 47 (38.5%) | 57 (45.2%) |
| 25 to 34 Years | 19 (11.1%) | 37 (26.8%) |
| 35 to 44 Years | 6 (2.4%) | 15 (6.0%) |
| 45 to 54 Years | 12 (5.4%) | 10 (5.3%) |
| 55 to 64 Years | 27 (9.6%) | 3 (1.0%) |
| 65 to 74 Years | 15 (5.6%) | 22 (9.1%) |
| 75 Years and over | 2 (1.2%) | 31 (12.7%) |
| Total | 167 (8.9%) | 262 (13.4%) |
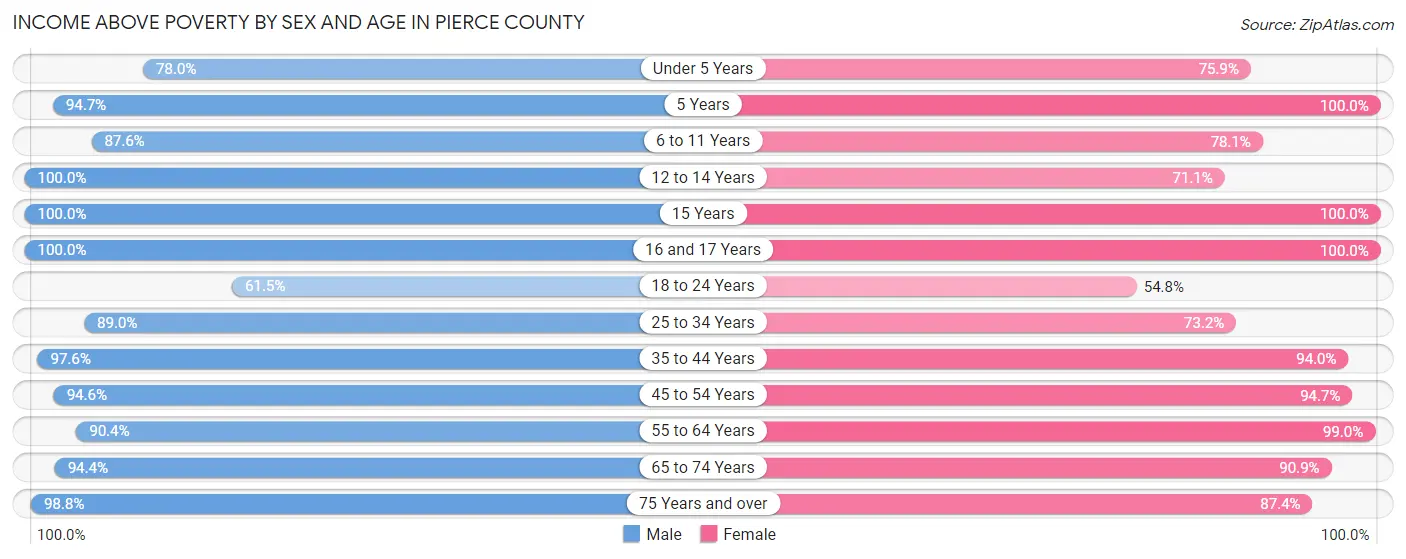
Income Above Poverty by Sex and Age in Pierce County
According to the poverty statistics in Pierce County, males aged 12 to 14 years and females aged 5 years are the age groups that are most secure financially, with 100.0% of males and 100.0% of females in these age groups living above the poverty line.
| Age Bracket | Male | Female |
| Under 5 Years | 71 (78.0%) | 63 (75.9%) |
| 5 Years | 36 (94.7%) | 6 (100.0%) |
| 6 to 11 Years | 120 (87.6%) | 200 (78.1%) |
| 12 to 14 Years | 82 (100.0%) | 27 (71.1%) |
| 15 Years | 28 (100.0%) | 17 (100.0%) |
| 16 and 17 Years | 20 (100.0%) | 70 (100.0%) |
| 18 to 24 Years | 75 (61.5%) | 69 (54.8%) |
| 25 to 34 Years | 153 (88.9%) | 101 (73.2%) |
| 35 to 44 Years | 243 (97.6%) | 236 (94.0%) |
| 45 to 54 Years | 210 (94.6%) | 180 (94.7%) |
| 55 to 64 Years | 254 (90.4%) | 287 (99.0%) |
| 65 to 74 Years | 253 (94.4%) | 219 (90.9%) |
| 75 Years and over | 166 (98.8%) | 214 (87.4%) |
| Total | 1,711 (91.1%) | 1,689 (86.6%) |
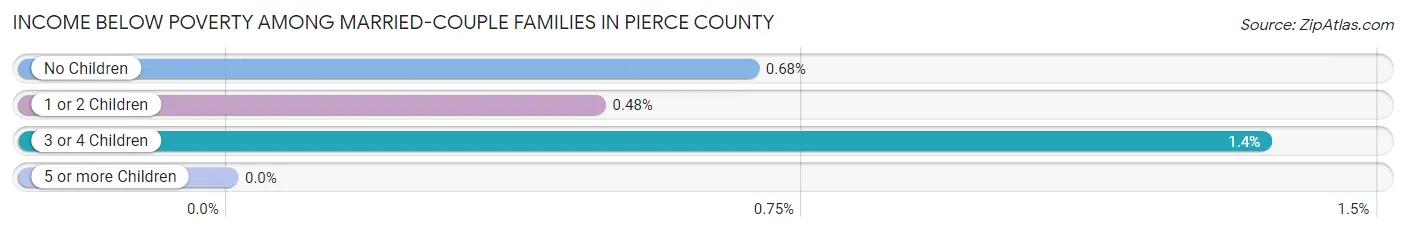
Income Below Poverty Among Married-Couple Families in Pierce County
The poverty statistics for married-couple families in Pierce County show that 0.7% or 6 of the total 878 families live below the poverty line. Families with 3 or 4 children have the highest poverty rate of 1.3%, comprising of 1 families. On the other hand, families with 5 or more children have the lowest poverty rate of 0.0%, which includes 0 families.
| Children | Above Poverty | Below Poverty |
| No Children | 588 (99.3%) | 4 (0.7%) |
| 1 or 2 Children | 206 (99.5%) | 1 (0.5%) |
| 3 or 4 Children | 73 (98.7%) | 1 (1.3%) |
| 5 or more Children | 5 (100.0%) | 0 (0.0%) |
| Total | 872 (99.3%) | 6 (0.7%) |
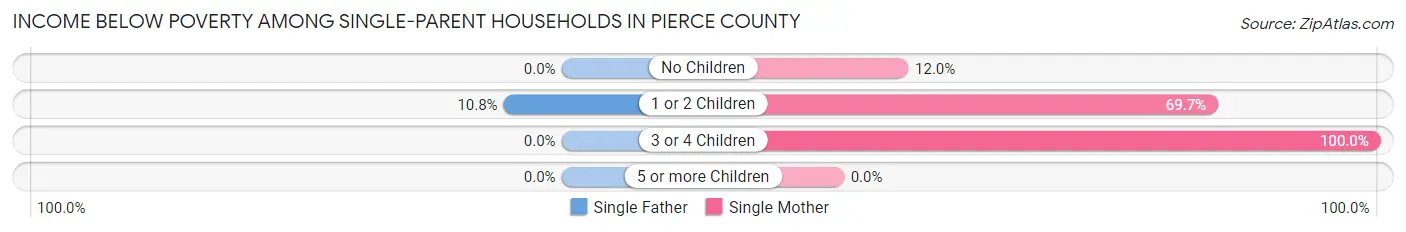
Income Below Poverty Among Single-Parent Households in Pierce County
According to the poverty data in Pierce County, 10.8% or 8 single-father households and 51.5% or 34 single-mother households are living below the poverty line. Among single-father households, those with 1 or 2 children have the highest poverty rate, with 8 households (10.8%) experiencing poverty. Likewise, among single-mother households, those with 3 or 4 children have the highest poverty rate, with 8 households (100.0%) falling below the poverty line.
| Children | Single Father | Single Mother |
| No Children | 0 (0.0%) | 3 (12.0%) |
| 1 or 2 Children | 8 (10.8%) | 23 (69.7%) |
| 3 or 4 Children | 0 (0.0%) | 8 (100.0%) |
| 5 or more Children | 0 (0.0%) | 0 (0.0%) |
| Total | 8 (10.8%) | 34 (51.5%) |
Income Below Poverty Among Married-Couple vs Single-Parent Households in Pierce County
The poverty data for Pierce County shows that 6 of the married-couple family households (0.7%) and 42 of the single-parent households (30.0%) are living below the poverty level. Within the married-couple family households, those with 3 or 4 children have the highest poverty rate, with 1 households (1.3%) falling below the poverty line. Among the single-parent households, those with 3 or 4 children have the highest poverty rate, with 8 household (100.0%) living below poverty.
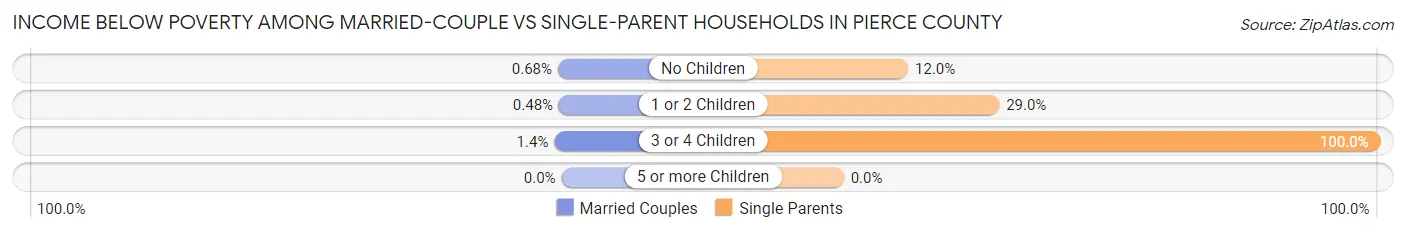
| Children | Married-Couple Families | Single-Parent Households |
| No Children | 4 (0.7%) | 3 (12.0%) |
| 1 or 2 Children | 1 (0.5%) | 31 (29.0%) |
| 3 or 4 Children | 1 (1.3%) | 8 (100.0%) |
| 5 or more Children | 0 (0.0%) | 0 (0.0%) |
| Total | 6 (0.7%) | 42 (30.0%) |
Employment Characteristics in Pierce County
Employment by Class of Employer in Pierce County
Among the 1,831 employed individuals in Pierce County, private company employees (864 | 47.2%), self-employed (not incorporated) (271 | 14.8%), and local government employees (221 | 12.1%) make up the most common classes of employment.
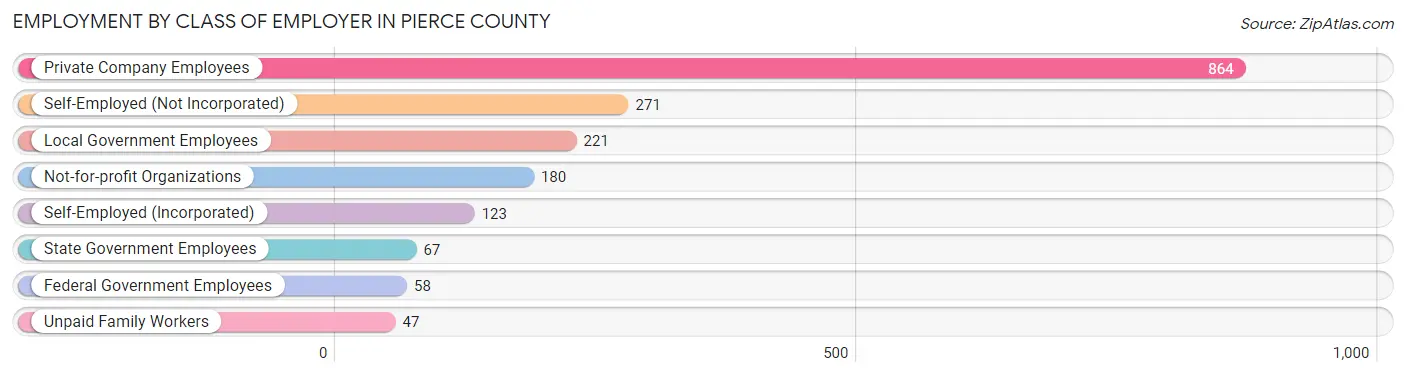
| Employer Class | # Employees | % Employees |
| Private Company Employees | 864 | 47.2% |
| Self-Employed (Incorporated) | 123 | 6.7% |
| Self-Employed (Not Incorporated) | 271 | 14.8% |
| Not-for-profit Organizations | 180 | 9.8% |
| Local Government Employees | 221 | 12.1% |
| State Government Employees | 67 | 3.7% |
| Federal Government Employees | 58 | 3.2% |
| Unpaid Family Workers | 47 | 2.6% |
| Total | 1,831 | 100.0% |
Employment Status by Age in Pierce County
According to the labor force statistics for Pierce County, out of the total population over 16 years of age (3,208), 58.7% or 1,883 individuals are in the labor force, with 1.0% or 19 of them unemployed. The age group with the highest labor force participation rate is 55 to 59 years, with 95.8% or 250 individuals in the labor force. Within the labor force, the 30 to 34 years age range has the highest percentage of unemployed individuals, with 9.6% or 13 of them being unemployed.
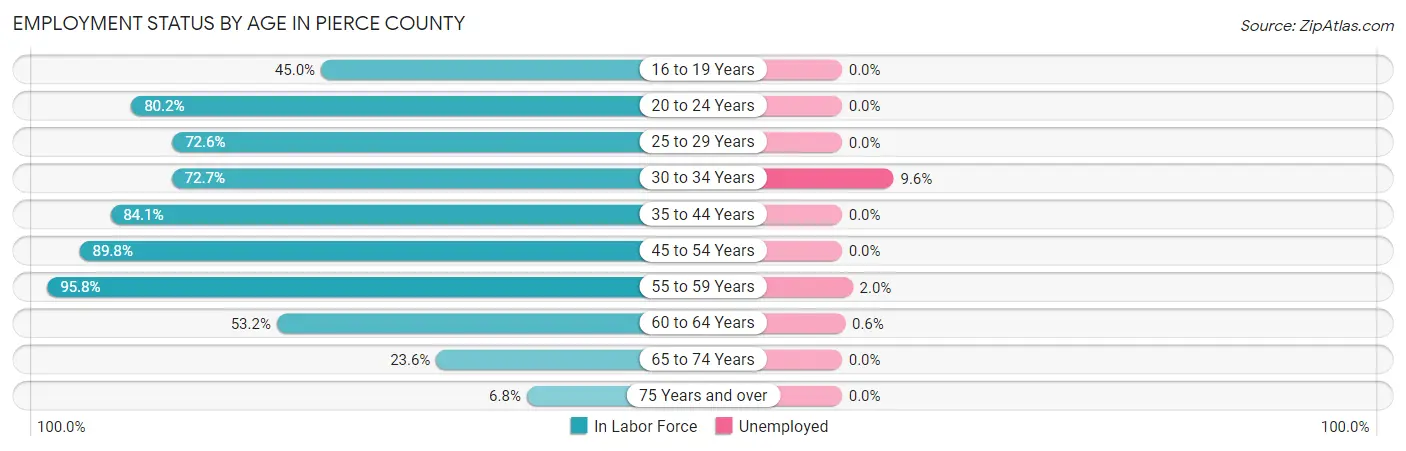
| Age Bracket | In Labor Force | Unemployed |
| 16 to 19 Years | 59 (45.0%) | 0 (0.0%) |
| 20 to 24 Years | 178 (80.2%) | 0 (0.0%) |
| 25 to 29 Years | 127 (72.6%) | 0 (0.0%) |
| 30 to 34 Years | 136 (72.7%) | 13 (9.6%) |
| 35 to 44 Years | 435 (84.1%) | 0 (0.0%) |
| 45 to 54 Years | 379 (89.8%) | 0 (0.0%) |
| 55 to 59 Years | 250 (95.8%) | 5 (2.0%) |
| 60 to 64 Years | 165 (53.2%) | 1 (0.6%) |
| 65 to 74 Years | 121 (23.6%) | 0 (0.0%) |
| 75 Years and over | 32 (6.8%) | 0 (0.0%) |
| Total | 1,883 (58.7%) | 19 (1.0%) |
Employment Status by Educational Attainment in Pierce County
According to labor force statistics for Pierce County, 79.7% of individuals (1,492) out of the total population between 25 and 64 years of age (1,872) are in the labor force, with 1.3% or 19 of them being unemployed. The group with the highest labor force participation rate are those with the educational attainment of bachelor's degree or higher, with 81.8% or 540 individuals in the labor force. Within the labor force, individuals with less than high school education have the highest percentage of unemployment, with 9.3% or 5 of them being unemployed.
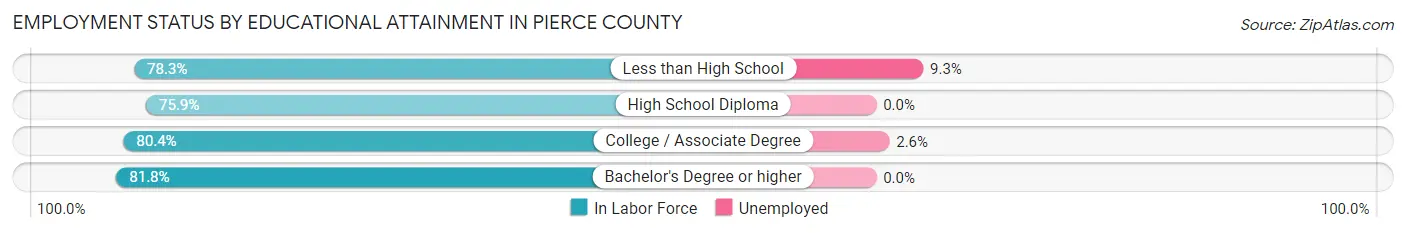
| Educational Attainment | In Labor Force | Unemployed |
| Less than High School | 54 (78.3%) | 6 (9.3%) |
| High School Diploma | 359 (75.9%) | 0 (0.0%) |
| College / Associate Degree | 539 (80.4%) | 17 (2.6%) |
| Bachelor's Degree or higher | 540 (81.8%) | 0 (0.0%) |
| Total | 1,492 (79.7%) | 24 (1.3%) |
Employment Occupations by Sex in Pierce County
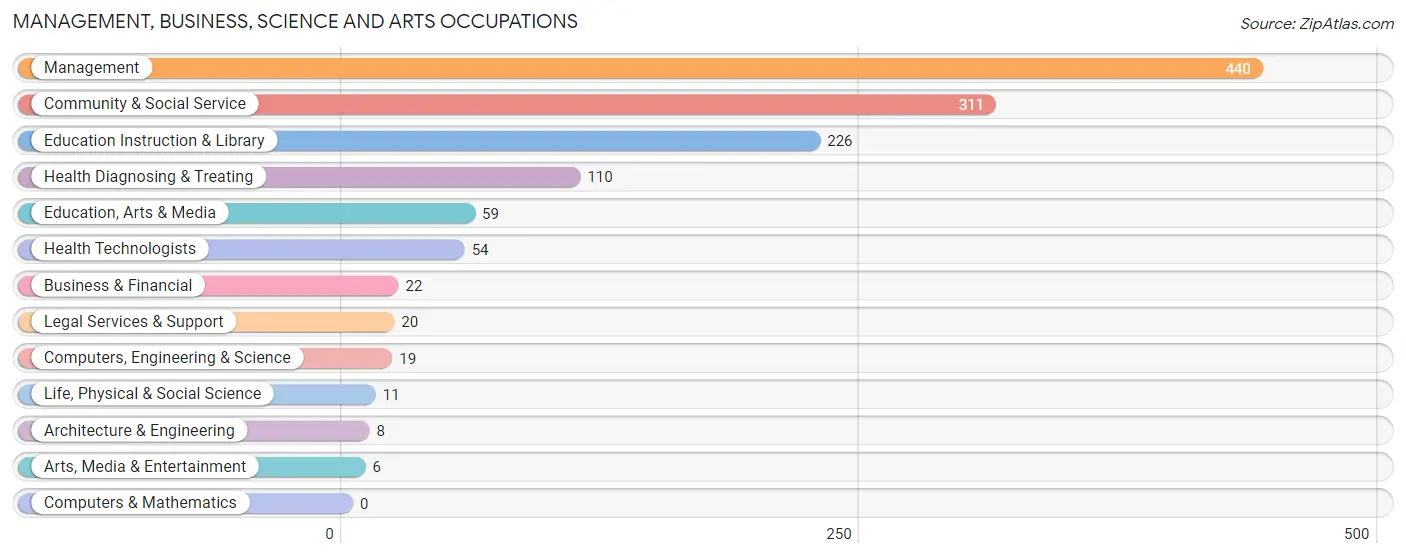
Management, Business, Science and Arts Occupations
The most common Management, Business, Science and Arts occupations in Pierce County are Management (440 | 23.7%), Community & Social Service (311 | 16.7%), Education Instruction & Library (226 | 12.2%), Health Diagnosing & Treating (110 | 5.9%), and Education, Arts & Media (59 | 3.2%).
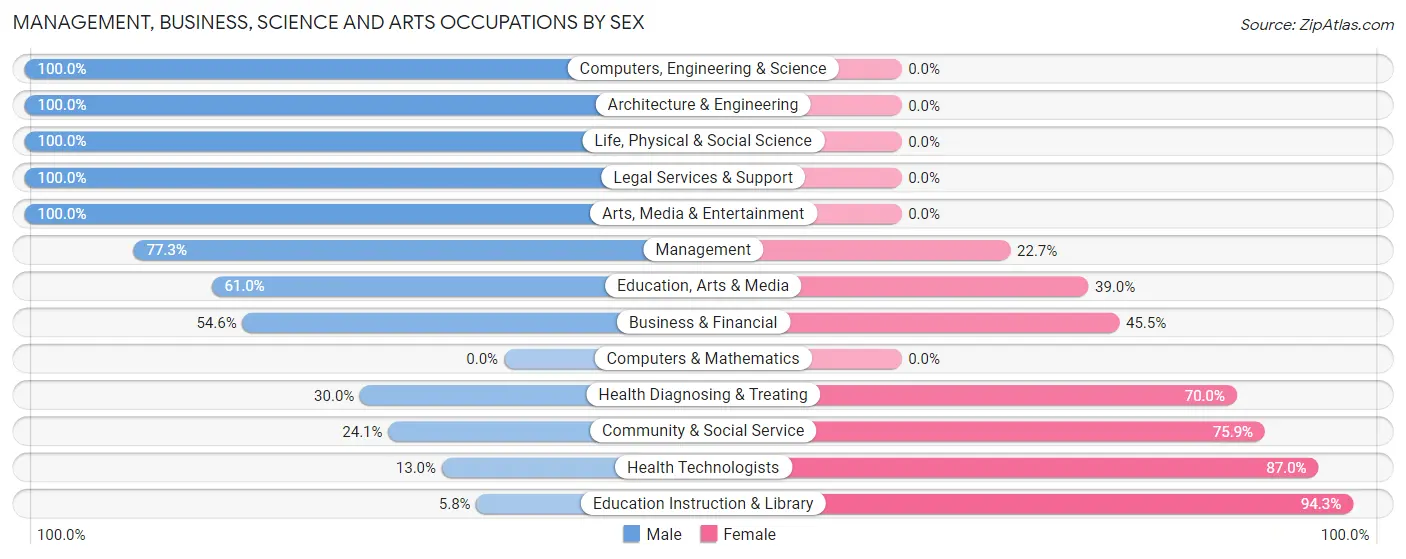
Management, Business, Science and Arts Occupations by Sex
Within the Management, Business, Science and Arts occupations in Pierce County, the most male-oriented occupations are Computers, Engineering & Science (100.0%), Architecture & Engineering (100.0%), and Life, Physical & Social Science (100.0%), while the most female-oriented occupations are Education Instruction & Library (94.3%), Health Technologists (87.0%), and Community & Social Service (75.9%).
| Occupation | Male | Female |
| Management | 340 (77.3%) | 100 (22.7%) |
| Business & Financial | 12 (54.5%) | 10 (45.5%) |
| Computers, Engineering & Science | 19 (100.0%) | 0 (0.0%) |
| Computers & Mathematics | 0 (0.0%) | 0 (0.0%) |
| Architecture & Engineering | 8 (100.0%) | 0 (0.0%) |
| Life, Physical & Social Science | 11 (100.0%) | 0 (0.0%) |
| Community & Social Service | 75 (24.1%) | 236 (75.9%) |
| Education, Arts & Media | 36 (61.0%) | 23 (39.0%) |
| Legal Services & Support | 20 (100.0%) | 0 (0.0%) |
| Education Instruction & Library | 13 (5.8%) | 213 (94.3%) |
| Arts, Media & Entertainment | 6 (100.0%) | 0 (0.0%) |
| Health Diagnosing & Treating | 33 (30.0%) | 77 (70.0%) |
| Health Technologists | 7 (13.0%) | 47 (87.0%) |
| Total (Category) | 479 (53.1%) | 423 (46.9%) |
| Total (Overall) | 1,043 (56.1%) | 816 (43.9%) |
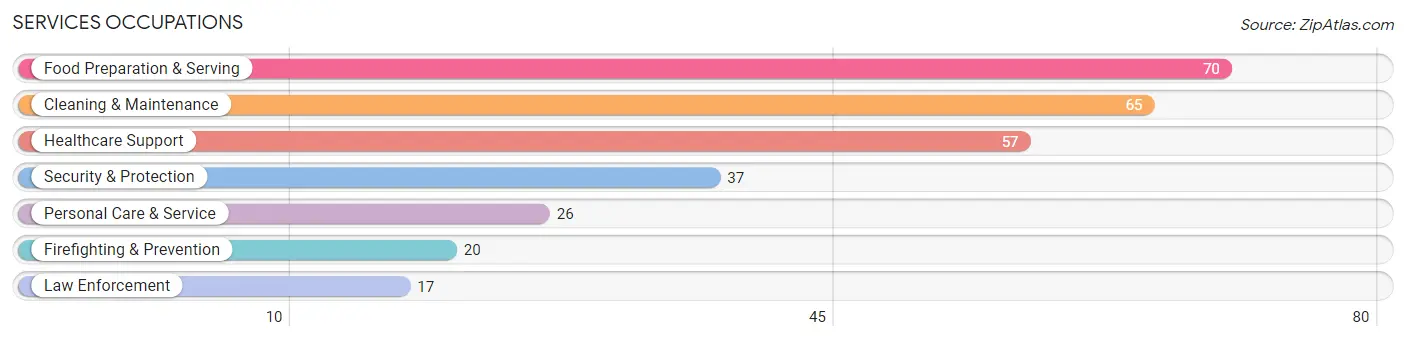
Services Occupations
The most common Services occupations in Pierce County are Food Preparation & Serving (70 | 3.8%), Cleaning & Maintenance (65 | 3.5%), Healthcare Support (57 | 3.1%), Security & Protection (37 | 2.0%), and Personal Care & Service (26 | 1.4%).
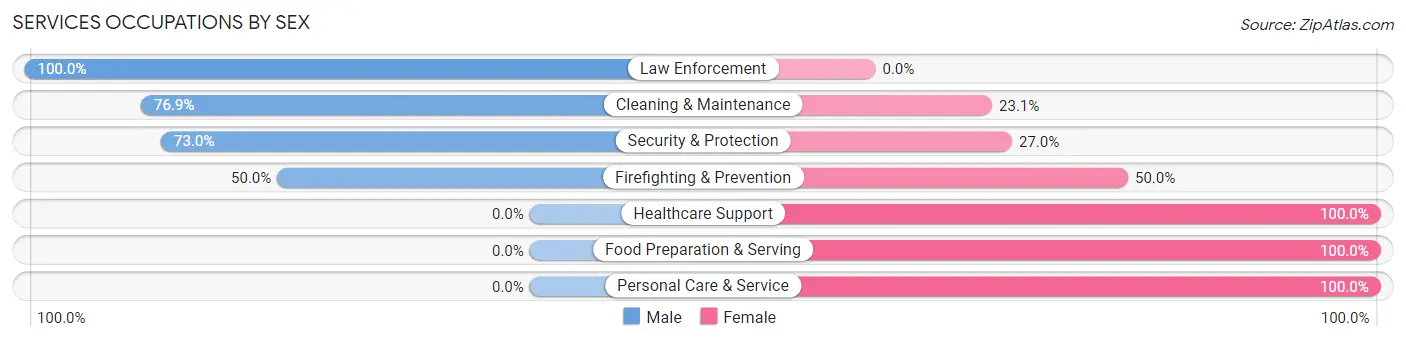
Services Occupations by Sex
Within the Services occupations in Pierce County, the most male-oriented occupations are Law Enforcement (100.0%), Cleaning & Maintenance (76.9%), and Security & Protection (73.0%), while the most female-oriented occupations are Healthcare Support (100.0%), Food Preparation & Serving (100.0%), and Personal Care & Service (100.0%).
| Occupation | Male | Female |
| Healthcare Support | 0 (0.0%) | 57 (100.0%) |
| Security & Protection | 27 (73.0%) | 10 (27.0%) |
| Firefighting & Prevention | 10 (50.0%) | 10 (50.0%) |
| Law Enforcement | 17 (100.0%) | 0 (0.0%) |
| Food Preparation & Serving | 0 (0.0%) | 70 (100.0%) |
| Cleaning & Maintenance | 50 (76.9%) | 15 (23.1%) |
| Personal Care & Service | 0 (0.0%) | 26 (100.0%) |
| Total (Category) | 77 (30.2%) | 178 (69.8%) |
| Total (Overall) | 1,043 (56.1%) | 816 (43.9%) |
Sales and Office Occupations
The most common Sales and Office occupations in Pierce County are Sales & Related (199 | 10.7%), and Office & Administration (102 | 5.5%).
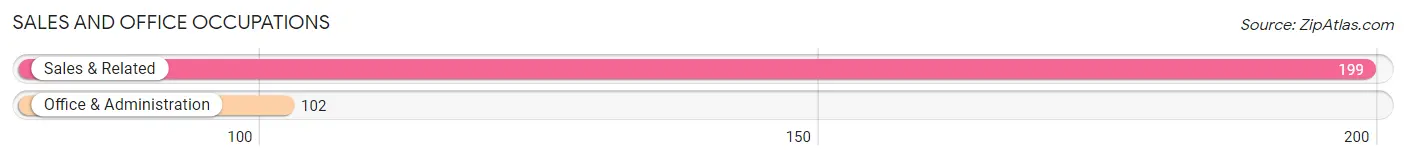
Sales and Office Occupations by Sex
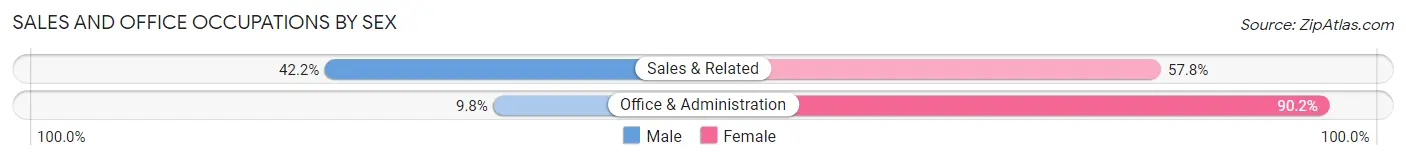
| Occupation | Male | Female |
| Sales & Related | 84 (42.2%) | 115 (57.8%) |
| Office & Administration | 10 (9.8%) | 92 (90.2%) |
| Total (Category) | 94 (31.2%) | 207 (68.8%) |
| Total (Overall) | 1,043 (56.1%) | 816 (43.9%) |
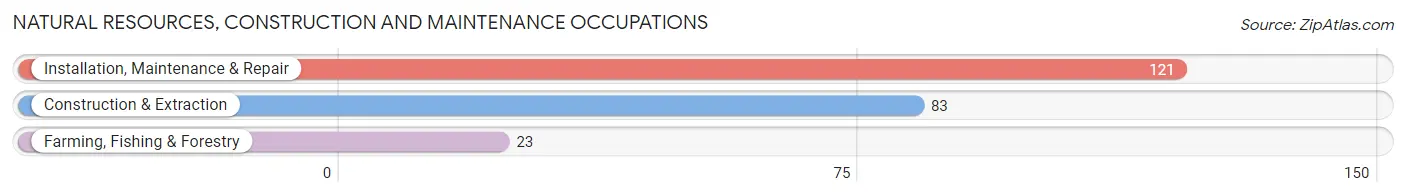
Natural Resources, Construction and Maintenance Occupations
The most common Natural Resources, Construction and Maintenance occupations in Pierce County are Installation, Maintenance & Repair (121 | 6.5%), Construction & Extraction (83 | 4.5%), and Farming, Fishing & Forestry (23 | 1.2%).
Natural Resources, Construction and Maintenance Occupations by Sex
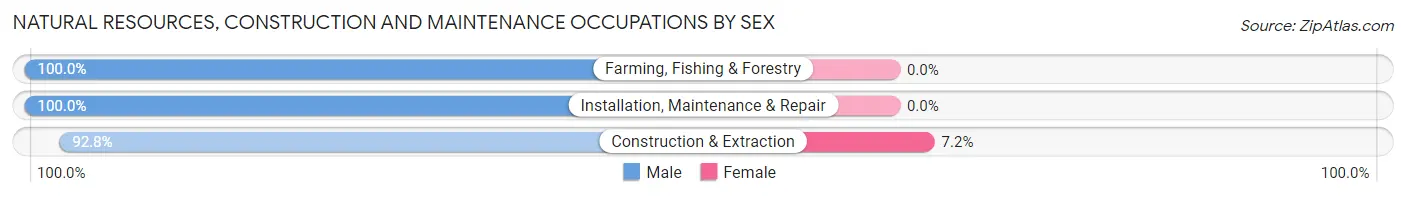
| Occupation | Male | Female |
| Farming, Fishing & Forestry | 23 (100.0%) | 0 (0.0%) |
| Construction & Extraction | 77 (92.8%) | 6 (7.2%) |
| Installation, Maintenance & Repair | 121 (100.0%) | 0 (0.0%) |
| Total (Category) | 221 (97.4%) | 6 (2.6%) |
| Total (Overall) | 1,043 (56.1%) | 816 (43.9%) |
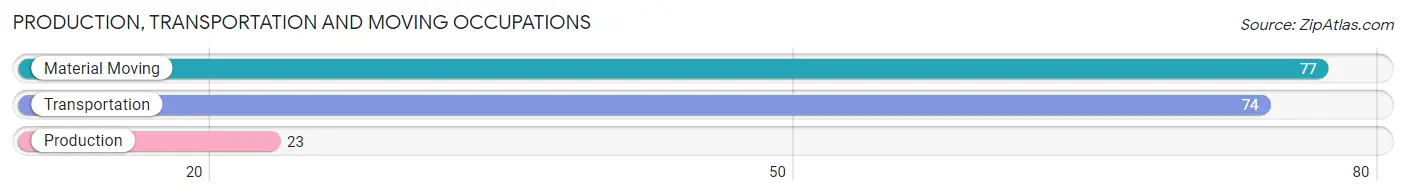
Production, Transportation and Moving Occupations
The most common Production, Transportation and Moving occupations in Pierce County are Material Moving (77 | 4.1%), Transportation (74 | 4.0%), and Production (23 | 1.2%).
Production, Transportation and Moving Occupations by Sex
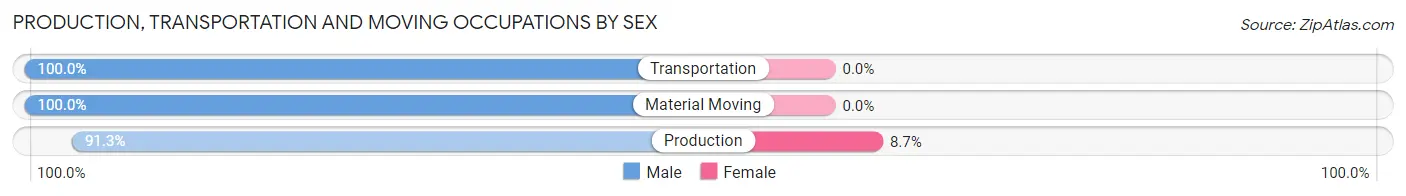
| Occupation | Male | Female |
| Production | 21 (91.3%) | 2 (8.7%) |
| Transportation | 74 (100.0%) | 0 (0.0%) |
| Material Moving | 77 (100.0%) | 0 (0.0%) |
| Total (Category) | 172 (98.9%) | 2 (1.1%) |
| Total (Overall) | 1,043 (56.1%) | 816 (43.9%) |
Employment Industries by Sex in Pierce County
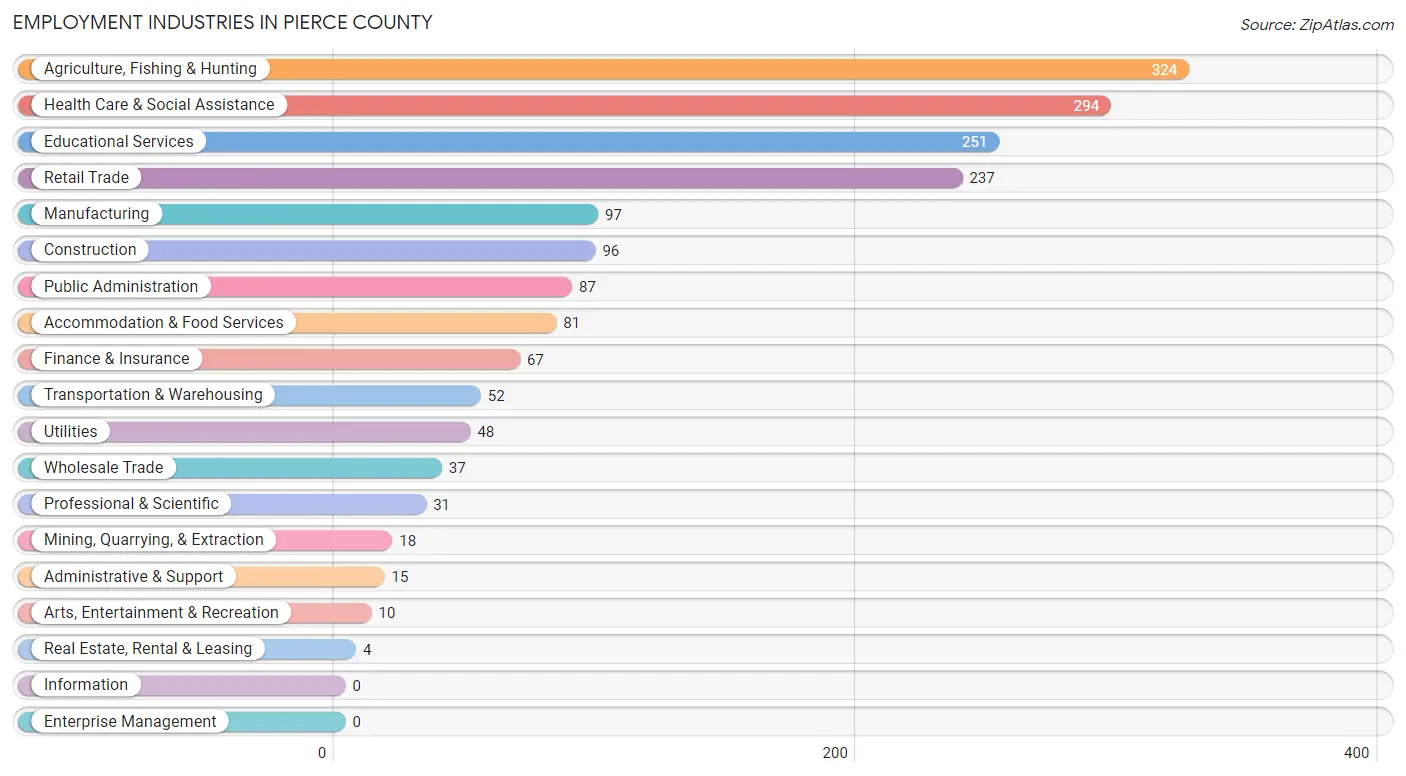
Employment Industries in Pierce County
The major employment industries in Pierce County include Agriculture, Fishing & Hunting (324 | 17.4%), Health Care & Social Assistance (294 | 15.8%), Educational Services (251 | 13.5%), Retail Trade (237 | 12.8%), and Manufacturing (97 | 5.2%).
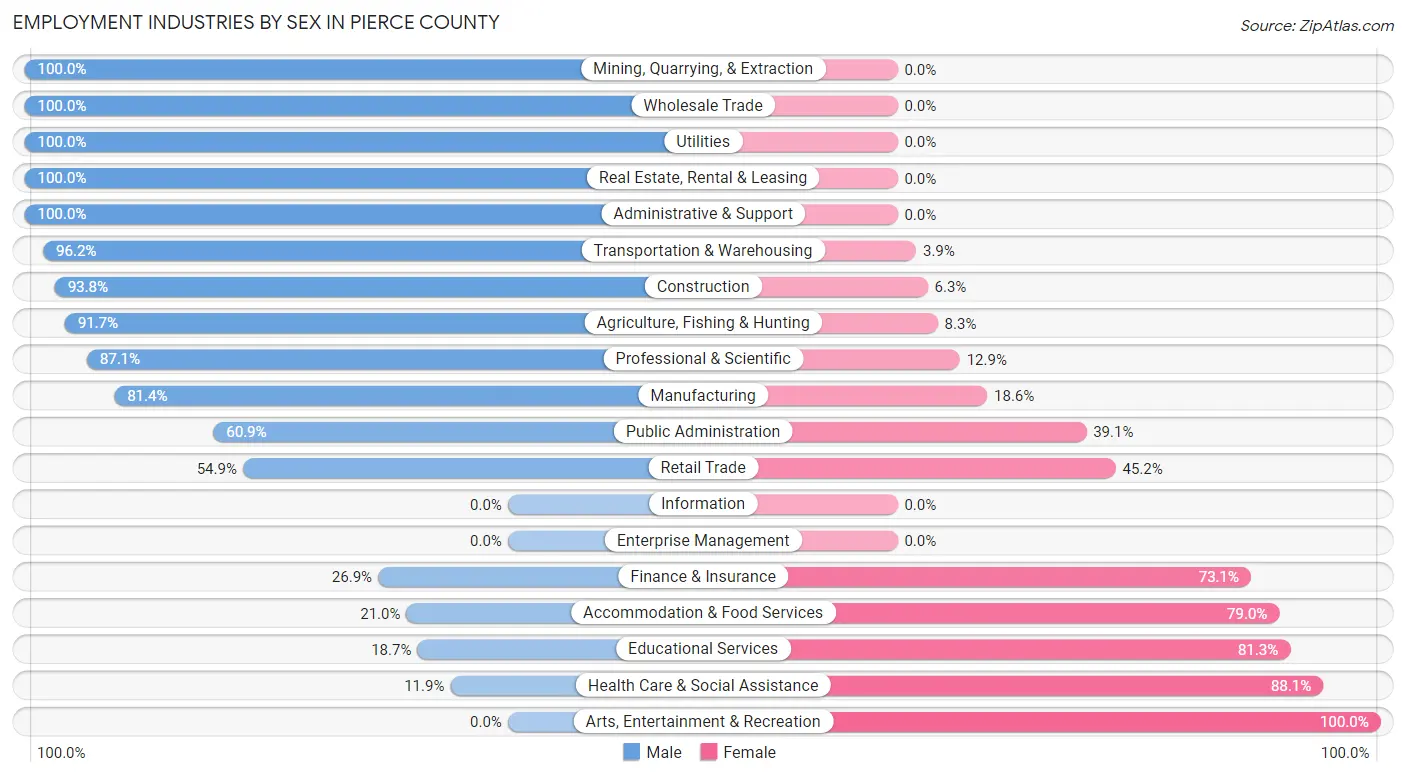
Employment Industries by Sex in Pierce County
The Pierce County industries that see more men than women are Mining, Quarrying, & Extraction (100.0%), Wholesale Trade (100.0%), and Utilities (100.0%), whereas the industries that tend to have a higher number of women are Arts, Entertainment & Recreation (100.0%), Health Care & Social Assistance (88.1%), and Educational Services (81.3%).
| Industry | Male | Female |
| Agriculture, Fishing & Hunting | 297 (91.7%) | 27 (8.3%) |
| Mining, Quarrying, & Extraction | 18 (100.0%) | 0 (0.0%) |
| Construction | 90 (93.8%) | 6 (6.2%) |
| Manufacturing | 79 (81.4%) | 18 (18.6%) |
| Wholesale Trade | 37 (100.0%) | 0 (0.0%) |
| Retail Trade | 130 (54.8%) | 107 (45.2%) |
| Transportation & Warehousing | 50 (96.2%) | 2 (3.8%) |
| Utilities | 48 (100.0%) | 0 (0.0%) |
| Information | 0 (0.0%) | 0 (0.0%) |
| Finance & Insurance | 18 (26.9%) | 49 (73.1%) |
| Real Estate, Rental & Leasing | 4 (100.0%) | 0 (0.0%) |
| Professional & Scientific | 27 (87.1%) | 4 (12.9%) |
| Enterprise Management | 0 (0.0%) | 0 (0.0%) |
| Administrative & Support | 15 (100.0%) | 0 (0.0%) |
| Educational Services | 47 (18.7%) | 204 (81.3%) |
| Health Care & Social Assistance | 35 (11.9%) | 259 (88.1%) |
| Arts, Entertainment & Recreation | 0 (0.0%) | 10 (100.0%) |
| Accommodation & Food Services | 17 (21.0%) | 64 (79.0%) |
| Public Administration | 53 (60.9%) | 34 (39.1%) |
| Total | 1,043 (56.1%) | 816 (43.9%) |
Education in Pierce County
School Enrollment in Pierce County
The most common levels of schooling among the 802 students in Pierce County are middle school (247 | 30.8%), elementary school (240 | 29.9%), and high school (139 | 17.3%).
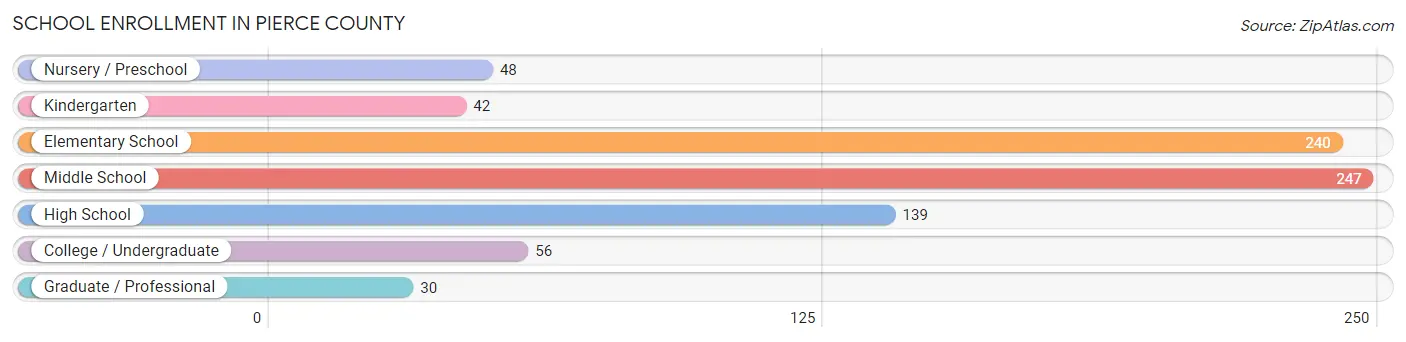
| School Level | # Students | % Students |
| Nursery / Preschool | 48 | 6.0% |
| Kindergarten | 42 | 5.2% |
| Elementary School | 240 | 29.9% |
| Middle School | 247 | 30.8% |
| High School | 139 | 17.3% |
| College / Undergraduate | 56 | 7.0% |
| Graduate / Professional | 30 | 3.7% |
| Total | 802 | 100.0% |
School Enrollment by Age by Funding Source in Pierce County
Out of a total of 802 students who are enrolled in schools in Pierce County, 139 (17.3%) attend a private institution, while the remaining 663 (82.7%) are enrolled in public schools. The age group of 3 to 4 year olds has the highest likelihood of being enrolled in private schools, with 25 (100.0% in the age bracket) enrolled. Conversely, the age group of 18 to 19 year olds has the lowest likelihood of being enrolled in a private school, with 19 (100.0% in the age bracket) attending a public institution.
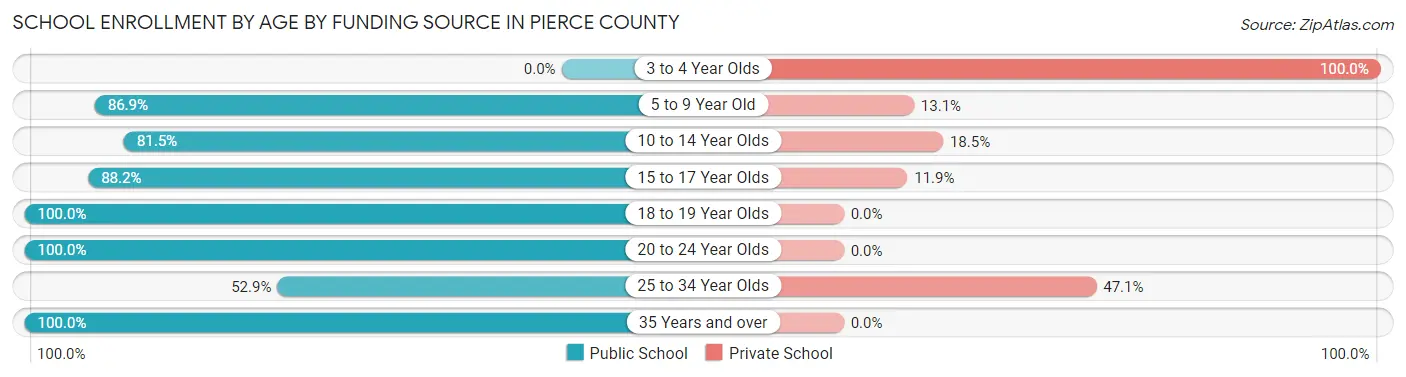
| Age Bracket | Public School | Private School |
| 3 to 4 Year Olds | 0 (0.0%) | 25 (100.0%) |
| 5 to 9 Year Old | 206 (86.9%) | 31 (13.1%) |
| 10 to 14 Year Olds | 260 (81.5%) | 59 (18.5%) |
| 15 to 17 Year Olds | 119 (88.1%) | 16 (11.8%) |
| 18 to 19 Year Olds | 19 (100.0%) | 0 (0.0%) |
| 20 to 24 Year Olds | 17 (100.0%) | 0 (0.0%) |
| 25 to 34 Year Olds | 9 (52.9%) | 8 (47.1%) |
| 35 Years and over | 33 (100.0%) | 0 (0.0%) |
| Total | 663 (82.7%) | 139 (17.3%) |
Educational Attainment by Field of Study in Pierce County
Education (276 | 31.9%), science & technology (129 | 14.9%), bio, nature & agricultural (124 | 14.3%), business (121 | 14.0%), and engineering (78 | 9.0%) are the most common fields of study among 866 individuals in Pierce County who have obtained a bachelor's degree or higher.
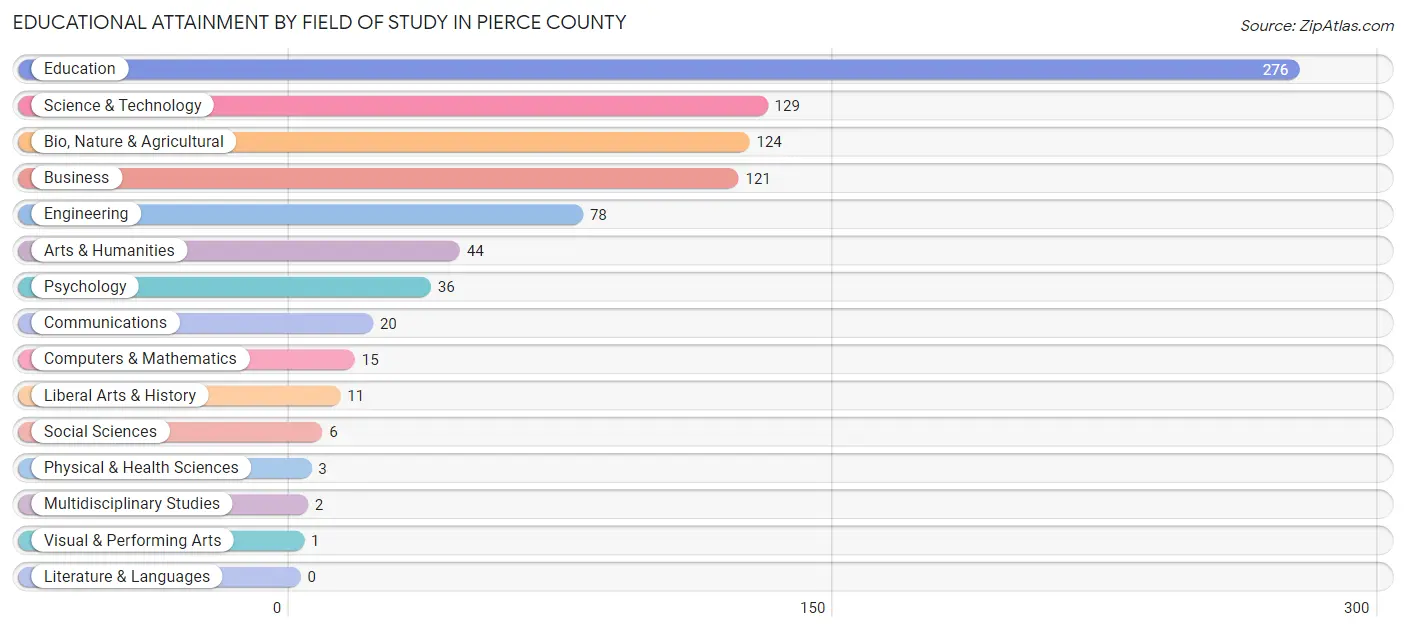
| Field of Study | # Graduates | % Graduates |
| Computers & Mathematics | 15 | 1.7% |
| Bio, Nature & Agricultural | 124 | 14.3% |
| Physical & Health Sciences | 3 | 0.4% |
| Psychology | 36 | 4.2% |
| Social Sciences | 6 | 0.7% |
| Engineering | 78 | 9.0% |
| Multidisciplinary Studies | 2 | 0.2% |
| Science & Technology | 129 | 14.9% |
| Business | 121 | 14.0% |
| Education | 276 | 31.9% |
| Literature & Languages | 0 | 0.0% |
| Liberal Arts & History | 11 | 1.3% |
| Visual & Performing Arts | 1 | 0.1% |
| Communications | 20 | 2.3% |
| Arts & Humanities | 44 | 5.1% |
| Total | 866 | 100.0% |
Transportation & Commute in Pierce County
Vehicle Availability by Sex in Pierce County
The most prevalent vehicle ownership categories in Pierce County are males with 3 vehicles (311, accounting for 29.9%) and females with 3 vehicles (286, making up 39.3%).
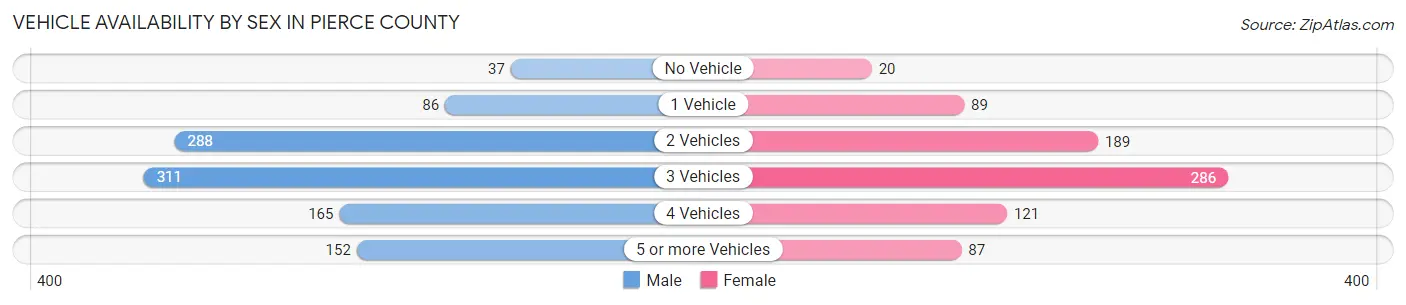
| Vehicles Available | Male | Female |
| No Vehicle | 37 (3.6%) | 20 (2.5%) |
| 1 Vehicle | 86 (8.3%) | 89 (11.2%) |
| 2 Vehicles | 288 (27.7%) | 189 (23.9%) |
| 3 Vehicles | 311 (29.9%) | 286 (36.1%) |
| 4 Vehicles | 165 (15.9%) | 121 (15.3%) |
| 5 or more Vehicles | 152 (14.6%) | 87 (11.0%) |
| Total | 1,039 (100.0%) | 792 (100.0%) |
Commute Time in Pierce County
The most frequently occuring commute durations in Pierce County are less than 5 minutes (502 commuters, 30.6%), 5 to 9 minutes (491 commuters, 29.9%), and 10 to 14 minutes (159 commuters, 9.7%).
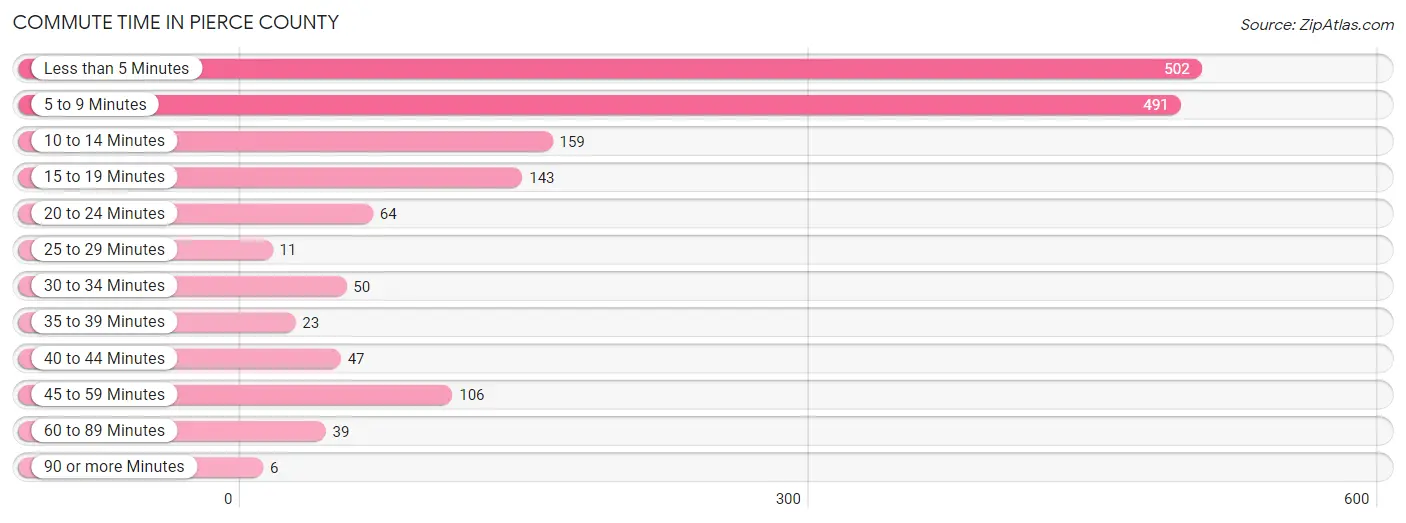
| Commute Time | # Commuters | % Commuters |
| Less than 5 Minutes | 502 | 30.6% |
| 5 to 9 Minutes | 491 | 29.9% |
| 10 to 14 Minutes | 159 | 9.7% |
| 15 to 19 Minutes | 143 | 8.7% |
| 20 to 24 Minutes | 64 | 3.9% |
| 25 to 29 Minutes | 11 | 0.7% |
| 30 to 34 Minutes | 50 | 3.0% |
| 35 to 39 Minutes | 23 | 1.4% |
| 40 to 44 Minutes | 47 | 2.9% |
| 45 to 59 Minutes | 106 | 6.5% |
| 60 to 89 Minutes | 39 | 2.4% |
| 90 or more Minutes | 6 | 0.4% |
Commute Time by Sex in Pierce County
The most common commute times in Pierce County are less than 5 minutes (287 commuters, 31.8%) for males and 5 to 9 minutes (267 commuters, 36.1%) for females.
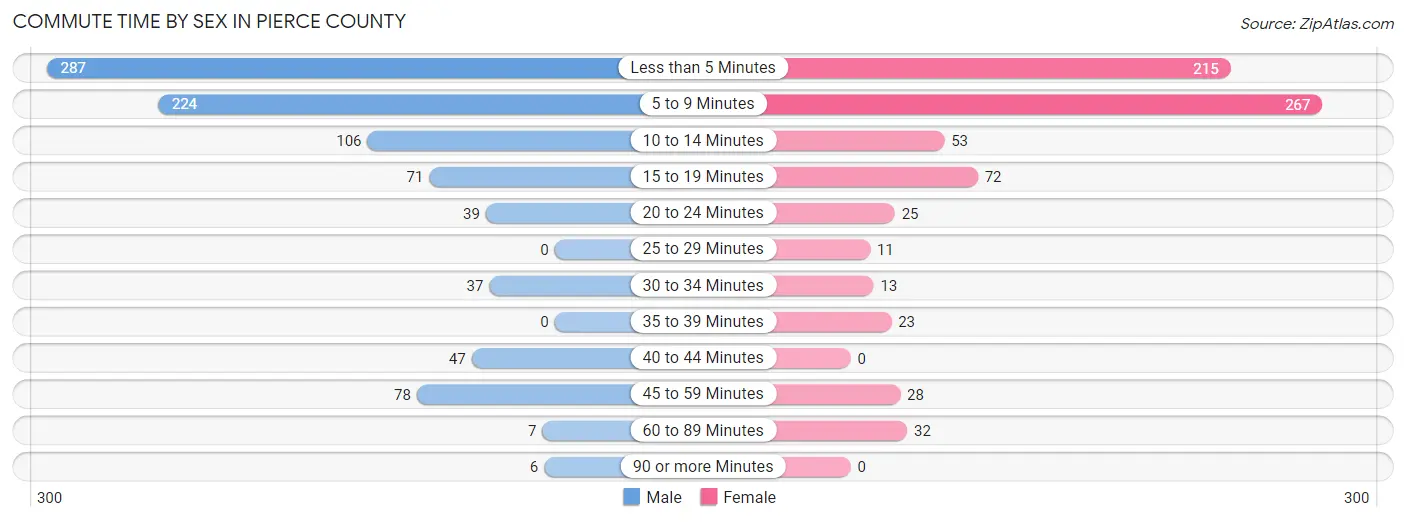
| Commute Time | Male | Female |
| Less than 5 Minutes | 287 (31.8%) | 215 (29.1%) |
| 5 to 9 Minutes | 224 (24.8%) | 267 (36.1%) |
| 10 to 14 Minutes | 106 (11.7%) | 53 (7.2%) |
| 15 to 19 Minutes | 71 (7.9%) | 72 (9.7%) |
| 20 to 24 Minutes | 39 (4.3%) | 25 (3.4%) |
| 25 to 29 Minutes | 0 (0.0%) | 11 (1.5%) |
| 30 to 34 Minutes | 37 (4.1%) | 13 (1.8%) |
| 35 to 39 Minutes | 0 (0.0%) | 23 (3.1%) |
| 40 to 44 Minutes | 47 (5.2%) | 0 (0.0%) |
| 45 to 59 Minutes | 78 (8.6%) | 28 (3.8%) |
| 60 to 89 Minutes | 7 (0.8%) | 32 (4.3%) |
| 90 or more Minutes | 6 (0.7%) | 0 (0.0%) |
Time of Departure to Work by Sex in Pierce County
The most frequent times of departure to work in Pierce County are 7:30 AM to 7:59 AM (252, 27.9%) for males and 7:30 AM to 7:59 AM (334, 45.2%) for females.
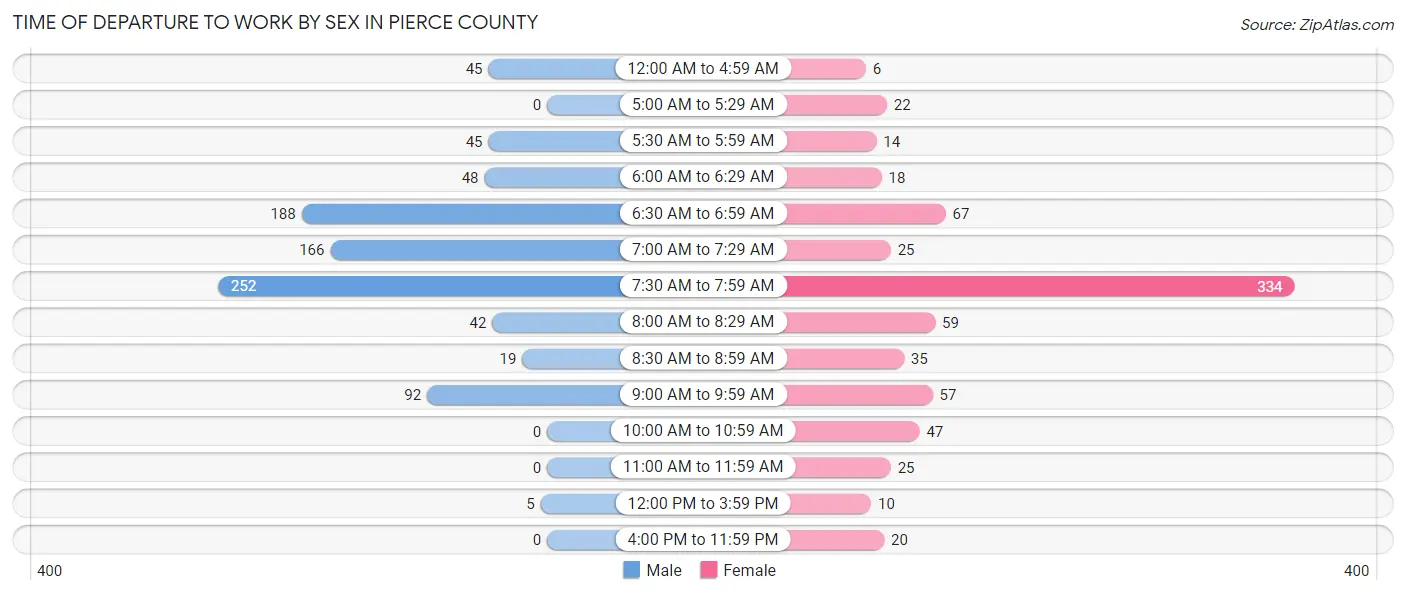
| Time of Departure | Male | Female |
| 12:00 AM to 4:59 AM | 45 (5.0%) | 6 (0.8%) |
| 5:00 AM to 5:29 AM | 0 (0.0%) | 22 (3.0%) |
| 5:30 AM to 5:59 AM | 45 (5.0%) | 14 (1.9%) |
| 6:00 AM to 6:29 AM | 48 (5.3%) | 18 (2.4%) |
| 6:30 AM to 6:59 AM | 188 (20.8%) | 67 (9.1%) |
| 7:00 AM to 7:29 AM | 166 (18.4%) | 25 (3.4%) |
| 7:30 AM to 7:59 AM | 252 (27.9%) | 334 (45.2%) |
| 8:00 AM to 8:29 AM | 42 (4.7%) | 59 (8.0%) |
| 8:30 AM to 8:59 AM | 19 (2.1%) | 35 (4.7%) |
| 9:00 AM to 9:59 AM | 92 (10.2%) | 57 (7.7%) |
| 10:00 AM to 10:59 AM | 0 (0.0%) | 47 (6.4%) |
| 11:00 AM to 11:59 AM | 0 (0.0%) | 25 (3.4%) |
| 12:00 PM to 3:59 PM | 5 (0.5%) | 10 (1.3%) |
| 4:00 PM to 11:59 PM | 0 (0.0%) | 20 (2.7%) |
| Total | 902 (100.0%) | 739 (100.0%) |
Housing Occupancy in Pierce County
Occupancy by Ownership in Pierce County
Of the total 1,689 dwellings in Pierce County, owner-occupied units account for 1,354 (80.2%), while renter-occupied units make up 335 (19.8%).
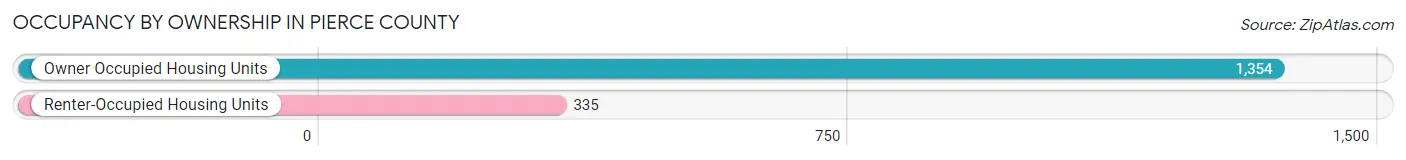
| Occupancy | # Housing Units | % Housing Units |
| Owner Occupied Housing Units | 1,354 | 80.2% |
| Renter-Occupied Housing Units | 335 | 19.8% |
| Total Occupied Housing Units | 1,689 | 100.0% |
Occupancy by Household Size in Pierce County
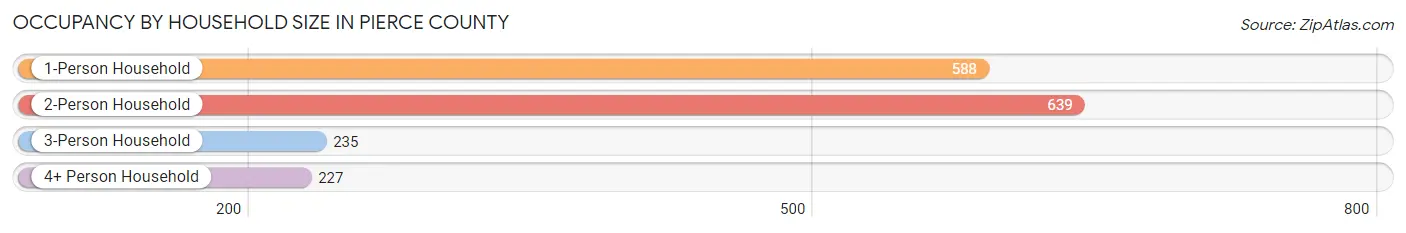
| Household Size | # Housing Units | % Housing Units |
| 1-Person Household | 588 | 34.8% |
| 2-Person Household | 639 | 37.8% |
| 3-Person Household | 235 | 13.9% |
| 4+ Person Household | 227 | 13.4% |
| Total Housing Units | 1,689 | 100.0% |
Occupancy by Ownership by Household Size in Pierce County
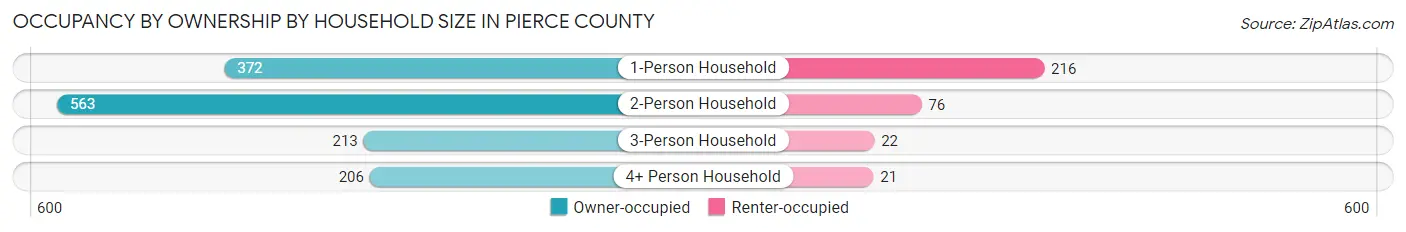
| Household Size | Owner-occupied | Renter-occupied |
| 1-Person Household | 372 (63.3%) | 216 (36.7%) |
| 2-Person Household | 563 (88.1%) | 76 (11.9%) |
| 3-Person Household | 213 (90.6%) | 22 (9.4%) |
| 4+ Person Household | 206 (90.7%) | 21 (9.2%) |
| Total Housing Units | 1,354 (80.2%) | 335 (19.8%) |
Occupancy by Educational Attainment in Pierce County
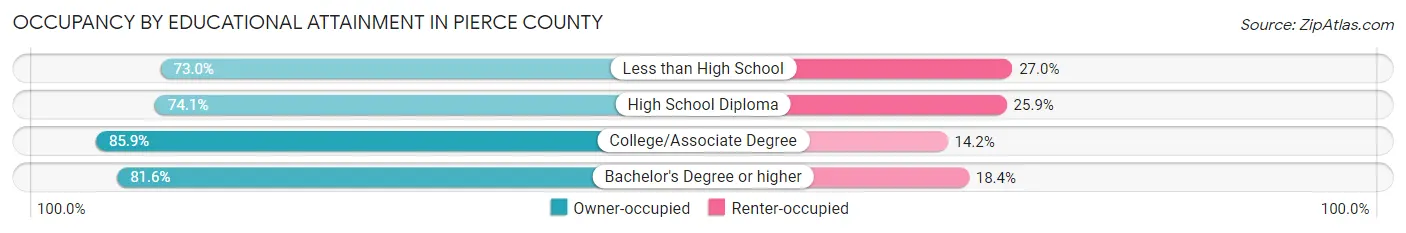
| Household Size | Owner-occupied | Renter-occupied |
| Less than High School | 92 (73.0%) | 34 (27.0%) |
| High School Diploma | 364 (74.1%) | 127 (25.9%) |
| College/Associate Degree | 467 (85.9%) | 77 (14.1%) |
| Bachelor's Degree or higher | 431 (81.6%) | 97 (18.4%) |
Occupancy by Age of Householder in Pierce County
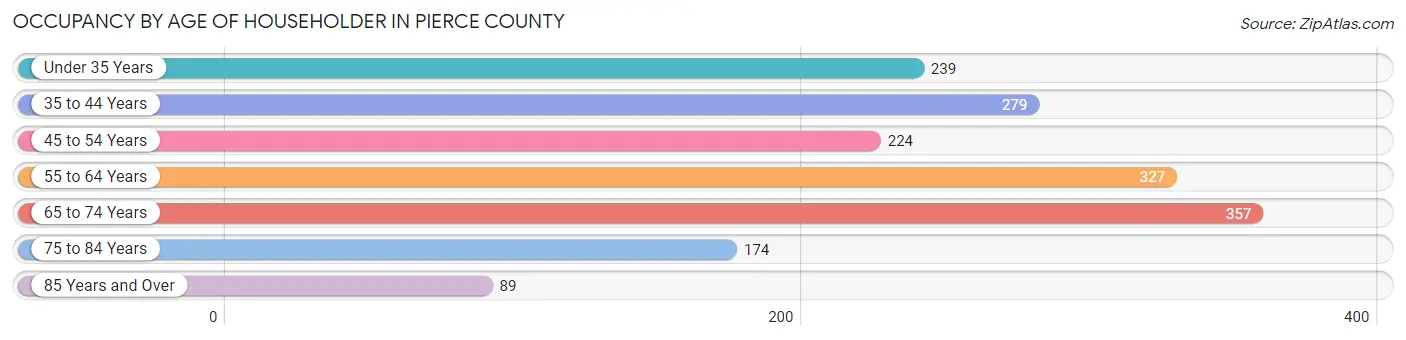
| Age Bracket | # Households | % Households |
| Under 35 Years | 239 | 14.1% |
| 35 to 44 Years | 279 | 16.5% |
| 45 to 54 Years | 224 | 13.3% |
| 55 to 64 Years | 327 | 19.4% |
| 65 to 74 Years | 357 | 21.1% |
| 75 to 84 Years | 174 | 10.3% |
| 85 Years and Over | 89 | 5.3% |
| Total | 1,689 | 100.0% |
Housing Finances in Pierce County
Median Income by Occupancy in Pierce County
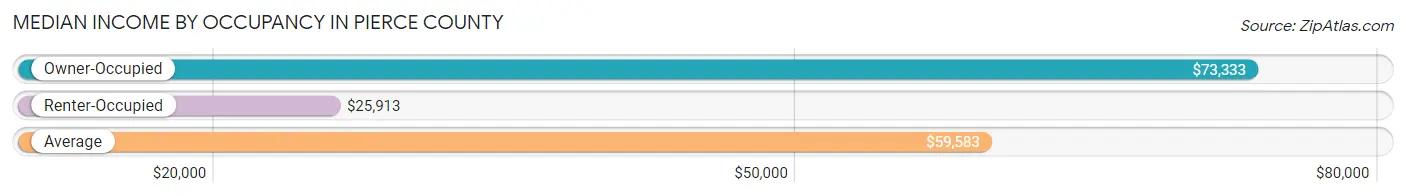
| Occupancy Type | # Households | Median Income |
| Owner-Occupied | 1,354 (80.2%) | $73,333 |
| Renter-Occupied | 335 (19.8%) | $25,913 |
| Average | 1,689 (100.0%) | $59,583 |
Occupancy by Householder Income Bracket in Pierce County
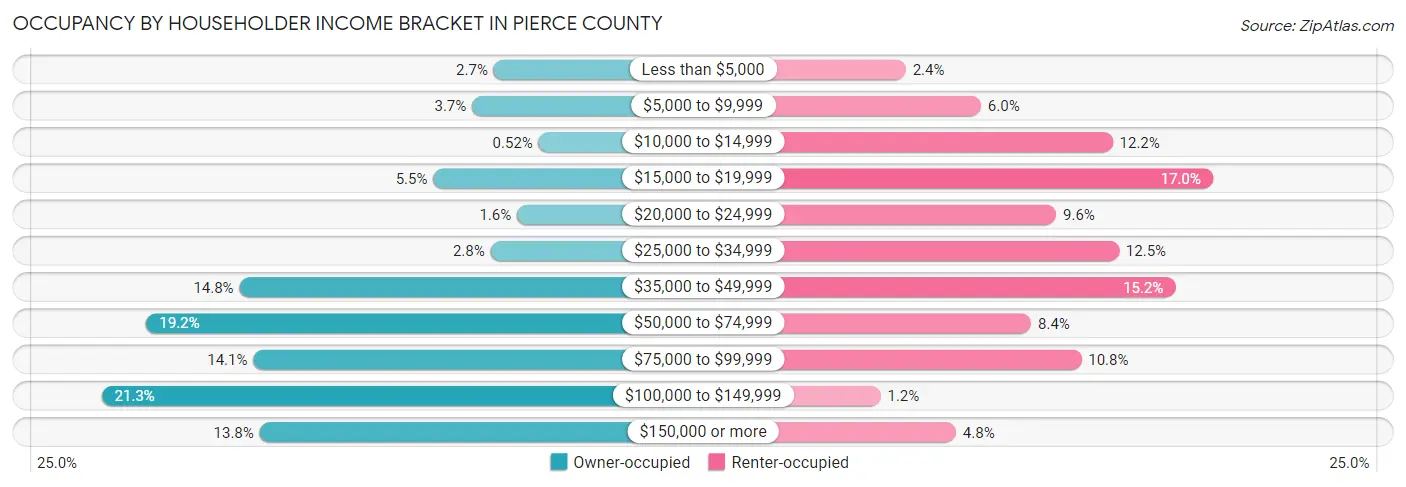
| Income Bracket | Owner-occupied | Renter-occupied |
| Less than $5,000 | 36 (2.7%) | 8 (2.4%) |
| $5,000 to $9,999 | 50 (3.7%) | 20 (6.0%) |
| $10,000 to $14,999 | 7 (0.5%) | 41 (12.2%) |
| $15,000 to $19,999 | 75 (5.5%) | 57 (17.0%) |
| $20,000 to $24,999 | 21 (1.5%) | 32 (9.6%) |
| $25,000 to $34,999 | 38 (2.8%) | 42 (12.5%) |
| $35,000 to $49,999 | 200 (14.8%) | 51 (15.2%) |
| $50,000 to $74,999 | 260 (19.2%) | 28 (8.4%) |
| $75,000 to $99,999 | 191 (14.1%) | 36 (10.7%) |
| $100,000 to $149,999 | 289 (21.3%) | 4 (1.2%) |
| $150,000 or more | 187 (13.8%) | 16 (4.8%) |
| Total | 1,354 (100.0%) | 335 (100.0%) |
Monthly Housing Cost Tiers in Pierce County
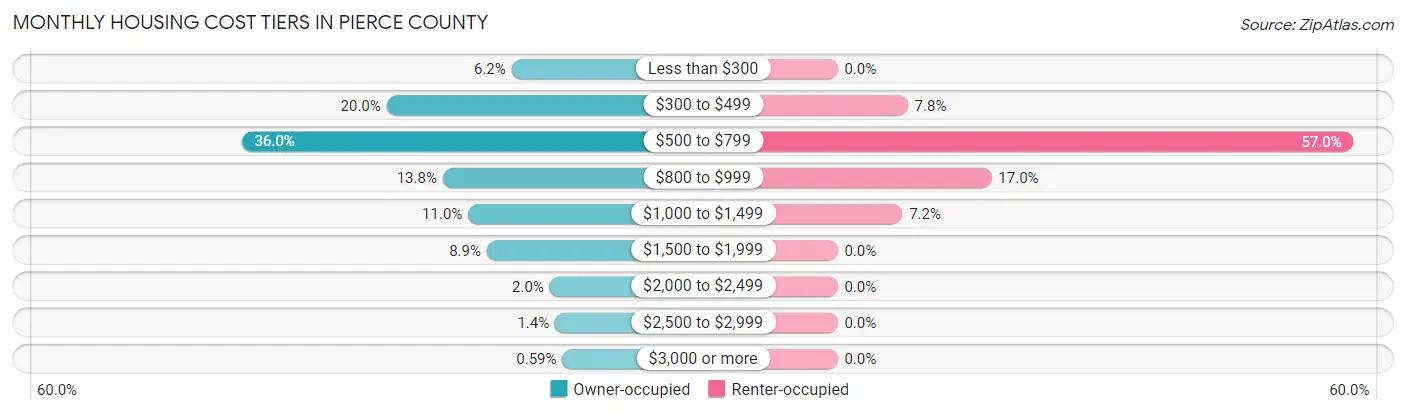
| Monthly Cost | Owner-occupied | Renter-occupied |
| Less than $300 | 84 (6.2%) | 0 (0.0%) |
| $300 to $499 | 271 (20.0%) | 26 (7.8%) |
| $500 to $799 | 488 (36.0%) | 191 (57.0%) |
| $800 to $999 | 187 (13.8%) | 57 (17.0%) |
| $1,000 to $1,499 | 149 (11.0%) | 24 (7.2%) |
| $1,500 to $1,999 | 121 (8.9%) | 0 (0.0%) |
| $2,000 to $2,499 | 27 (2.0%) | 0 (0.0%) |
| $2,500 to $2,999 | 19 (1.4%) | 0 (0.0%) |
| $3,000 or more | 8 (0.6%) | 0 (0.0%) |
| Total | 1,354 (100.0%) | 335 (100.0%) |
Physical Housing Characteristics in Pierce County
Housing Structures in Pierce County
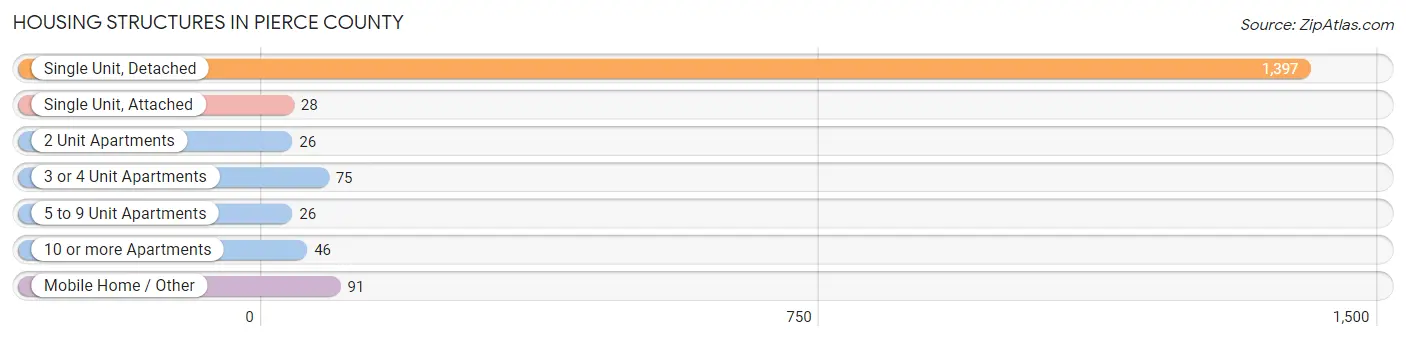
| Structure Type | # Housing Units | % Housing Units |
| Single Unit, Detached | 1,397 | 82.7% |
| Single Unit, Attached | 28 | 1.7% |
| 2 Unit Apartments | 26 | 1.5% |
| 3 or 4 Unit Apartments | 75 | 4.4% |
| 5 to 9 Unit Apartments | 26 | 1.5% |
| 10 or more Apartments | 46 | 2.7% |
| Mobile Home / Other | 91 | 5.4% |
| Total | 1,689 | 100.0% |
Housing Structures by Occupancy in Pierce County
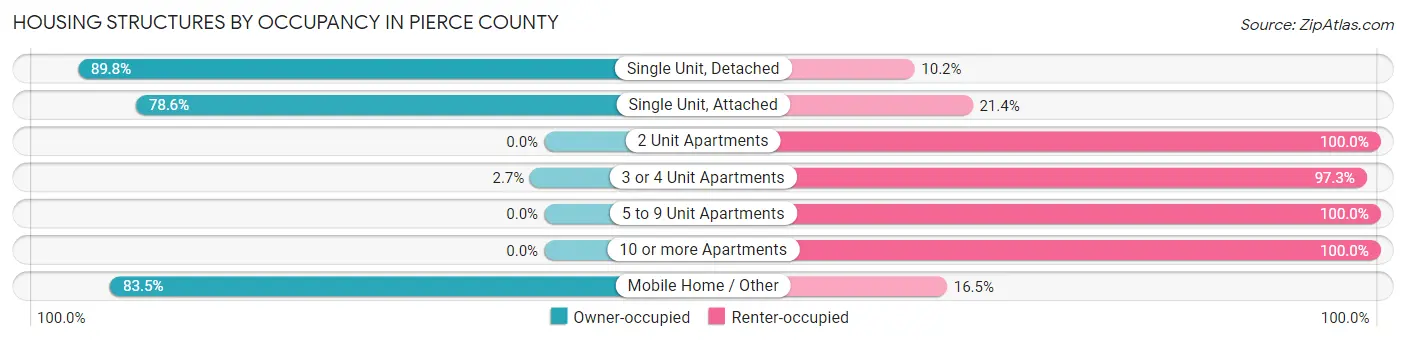
| Structure Type | Owner-occupied | Renter-occupied |
| Single Unit, Detached | 1,254 (89.8%) | 143 (10.2%) |
| Single Unit, Attached | 22 (78.6%) | 6 (21.4%) |
| 2 Unit Apartments | 0 (0.0%) | 26 (100.0%) |
| 3 or 4 Unit Apartments | 2 (2.7%) | 73 (97.3%) |
| 5 to 9 Unit Apartments | 0 (0.0%) | 26 (100.0%) |
| 10 or more Apartments | 0 (0.0%) | 46 (100.0%) |
| Mobile Home / Other | 76 (83.5%) | 15 (16.5%) |
| Total | 1,354 (80.2%) | 335 (19.8%) |
Housing Structures by Number of Rooms in Pierce County

| Number of Rooms | Owner-occupied | Renter-occupied |
| 1 Room | 4 (0.3%) | 6 (1.8%) |
| 2 or 3 Rooms | 0 (0.0%) | 53 (15.8%) |
| 4 or 5 Rooms | 207 (15.3%) | 157 (46.9%) |
| 6 or 7 Rooms | 444 (32.8%) | 54 (16.1%) |
| 8 or more Rooms | 699 (51.6%) | 65 (19.4%) |
| Total | 1,354 (100.0%) | 335 (100.0%) |
Housing Structure by Heating Type in Pierce County
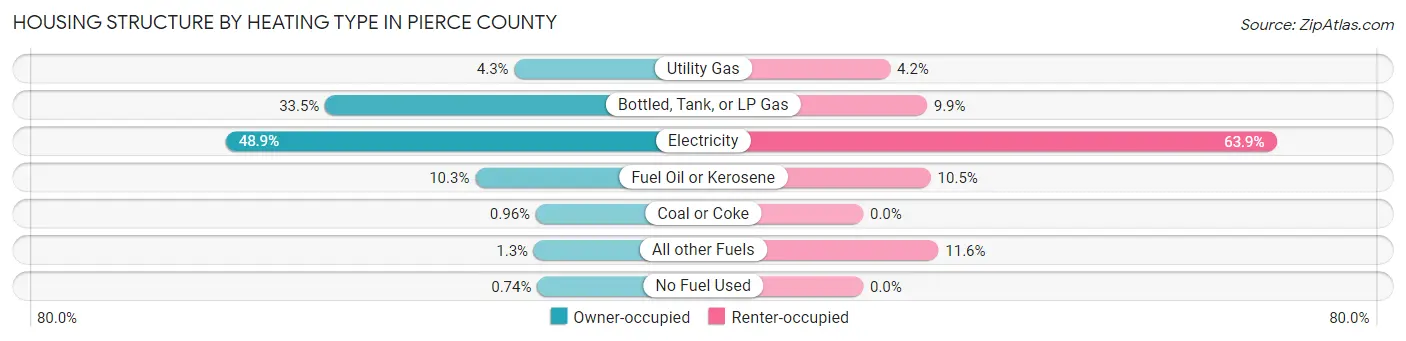
| Heating Type | Owner-occupied | Renter-occupied |
| Utility Gas | 58 (4.3%) | 14 (4.2%) |
| Bottled, Tank, or LP Gas | 454 (33.5%) | 33 (9.9%) |
| Electricity | 662 (48.9%) | 214 (63.9%) |
| Fuel Oil or Kerosene | 140 (10.3%) | 35 (10.4%) |
| Coal or Coke | 13 (1.0%) | 0 (0.0%) |
| All other Fuels | 17 (1.3%) | 39 (11.6%) |
| No Fuel Used | 10 (0.7%) | 0 (0.0%) |
| Total | 1,354 (100.0%) | 335 (100.0%) |
Household Vehicle Usage in Pierce County
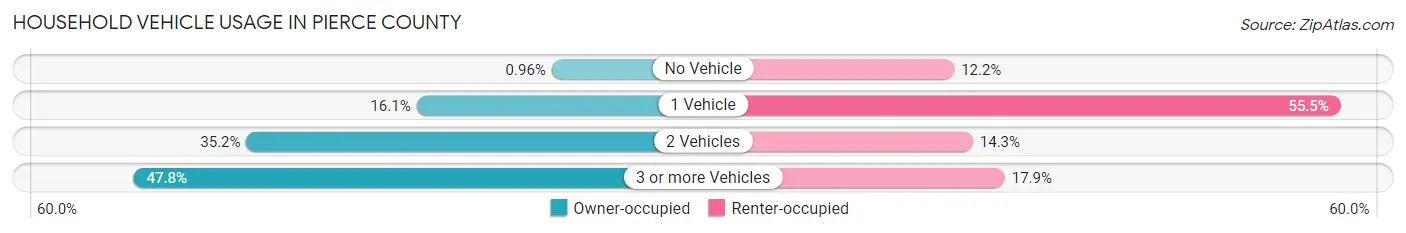
| Vehicles per Household | Owner-occupied | Renter-occupied |
| No Vehicle | 13 (1.0%) | 41 (12.2%) |
| 1 Vehicle | 218 (16.1%) | 186 (55.5%) |
| 2 Vehicles | 476 (35.2%) | 48 (14.3%) |
| 3 or more Vehicles | 647 (47.8%) | 60 (17.9%) |
| Total | 1,354 (100.0%) | 335 (100.0%) |
Real Estate & Mortgages in Pierce County
Real Estate and Mortgage Overview in Pierce County
| Characteristic | Without Mortgage | With Mortgage |
| Housing Units | 918 | 436 |
| Median Property Value | $151,500 | $160,100 |
| Median Household Income | $69,231 | $101 |
| Monthly Housing Costs | $578 | $8 |
| Real Estate Taxes | $1,664 | $9 |
Property Value by Mortgage Status in Pierce County
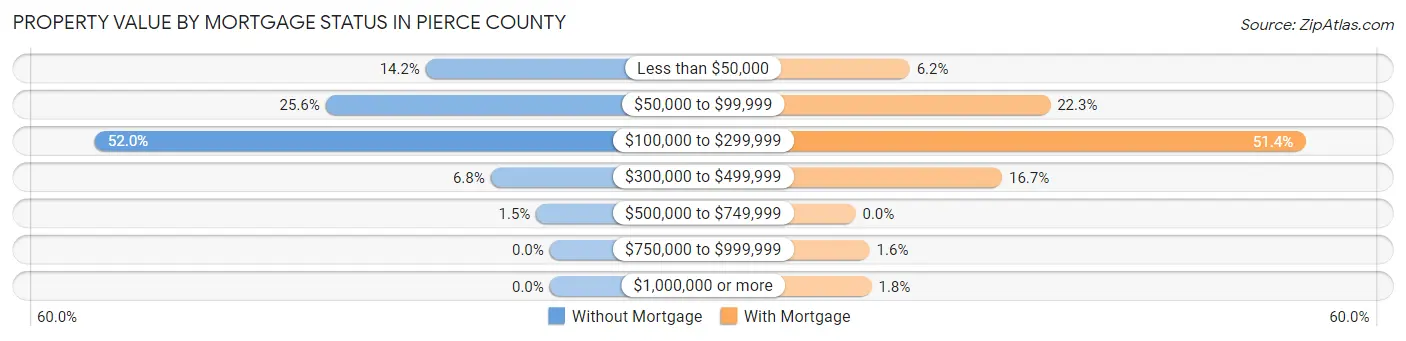
| Property Value | Without Mortgage | With Mortgage |
| Less than $50,000 | 130 (14.2%) | 27 (6.2%) |
| $50,000 to $99,999 | 235 (25.6%) | 97 (22.3%) |
| $100,000 to $299,999 | 477 (52.0%) | 224 (51.4%) |
| $300,000 to $499,999 | 62 (6.8%) | 73 (16.7%) |
| $500,000 to $749,999 | 14 (1.5%) | 0 (0.0%) |
| $750,000 to $999,999 | 0 (0.0%) | 7 (1.6%) |
| $1,000,000 or more | 0 (0.0%) | 8 (1.8%) |
| Total | 918 (100.0%) | 436 (100.0%) |
Household Income by Mortgage Status in Pierce County
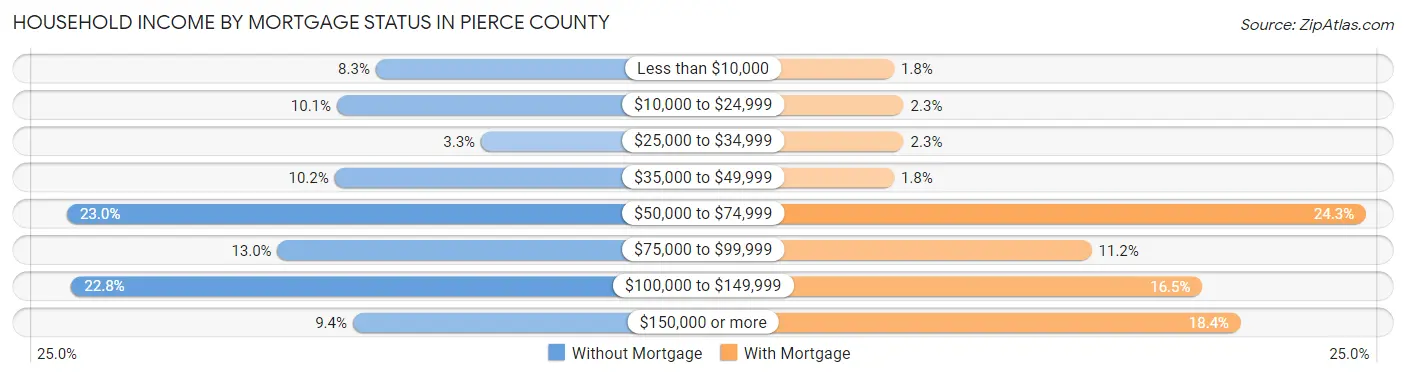
| Household Income | Without Mortgage | With Mortgage |
| Less than $10,000 | 76 (8.3%) | 8 (1.8%) |
| $10,000 to $24,999 | 93 (10.1%) | 10 (2.3%) |
| $25,000 to $34,999 | 30 (3.3%) | 10 (2.3%) |
| $35,000 to $49,999 | 94 (10.2%) | 8 (1.8%) |
| $50,000 to $74,999 | 211 (23.0%) | 106 (24.3%) |
| $75,000 to $99,999 | 119 (13.0%) | 49 (11.2%) |
| $100,000 to $149,999 | 209 (22.8%) | 72 (16.5%) |
| $150,000 or more | 86 (9.4%) | 80 (18.3%) |
| Total | 918 (100.0%) | 436 (100.0%) |
Property Value to Household Income Ratio in Pierce County
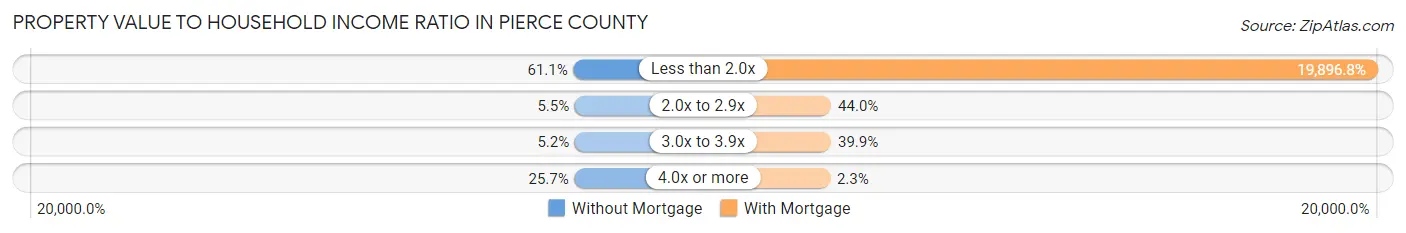
| Value-to-Income Ratio | Without Mortgage | With Mortgage |
| Less than 2.0x | 561 (61.1%) | 86,750 (19,896.8%) |
| 2.0x to 2.9x | 50 (5.4%) | 192 (44.0%) |
| 3.0x to 3.9x | 48 (5.2%) | 174 (39.9%) |
| 4.0x or more | 236 (25.7%) | 10 (2.3%) |
| Total | 918 (100.0%) | 436 (100.0%) |
Real Estate Taxes by Mortgage Status in Pierce County
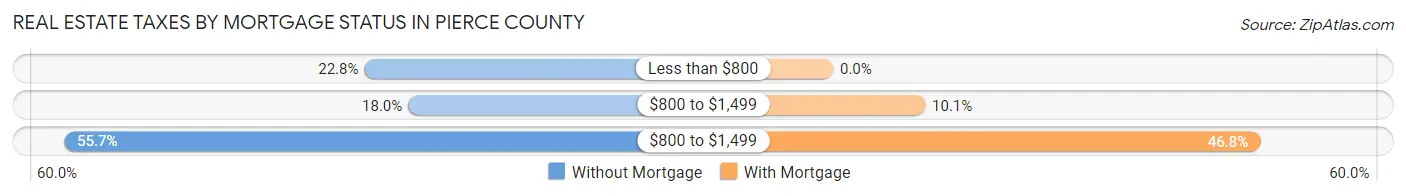
| Property Taxes | Without Mortgage | With Mortgage |
| Less than $800 | 209 (22.8%) | 0 (0.0%) |
| $800 to $1,499 | 165 (18.0%) | 44 (10.1%) |
| $800 to $1,499 | 511 (55.7%) | 204 (46.8%) |
| Total | 918 (100.0%) | 436 (100.0%) |
Health & Disability in Pierce County
Health Insurance Coverage by Age in Pierce County
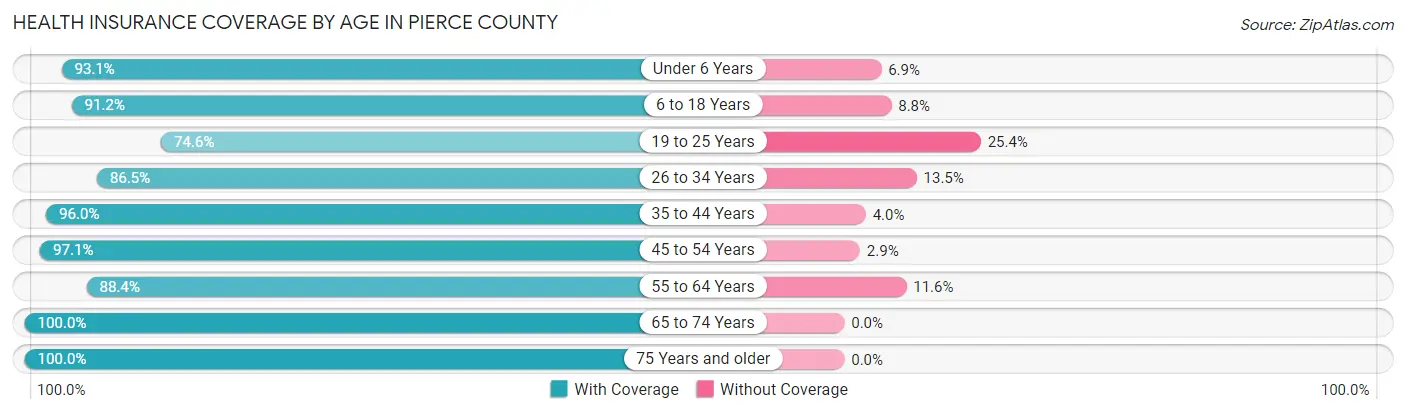
| Age Bracket | With Coverage | Without Coverage |
| Under 6 Years | 203 (93.1%) | 15 (6.9%) |
| 6 to 18 Years | 604 (91.2%) | 58 (8.8%) |
| 19 to 25 Years | 214 (74.6%) | 73 (25.4%) |
| 26 to 34 Years | 231 (86.5%) | 36 (13.5%) |
| 35 to 44 Years | 480 (96.0%) | 20 (4.0%) |
| 45 to 54 Years | 400 (97.1%) | 12 (2.9%) |
| 55 to 64 Years | 505 (88.4%) | 66 (11.6%) |
| 65 to 74 Years | 509 (100.0%) | 0 (0.0%) |
| 75 Years and older | 413 (100.0%) | 0 (0.0%) |
| Total | 3,559 (92.7%) | 280 (7.3%) |
Health Insurance Coverage by Citizenship Status in Pierce County
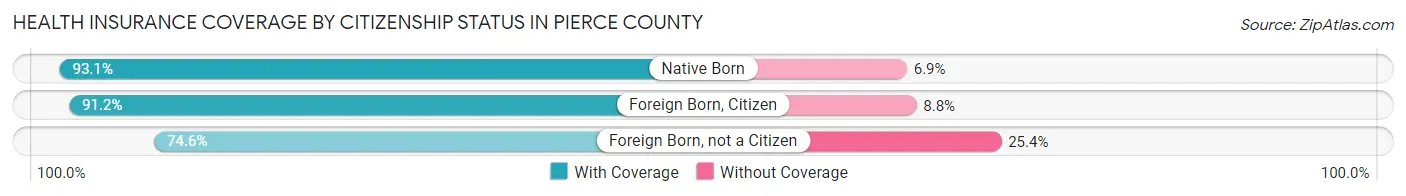
| Citizenship Status | With Coverage | Without Coverage |
| Native Born | 203 (93.1%) | 15 (6.9%) |
| Foreign Born, Citizen | 604 (91.2%) | 58 (8.8%) |
| Foreign Born, not a Citizen | 214 (74.6%) | 73 (25.4%) |
Health Insurance Coverage by Household Income in Pierce County
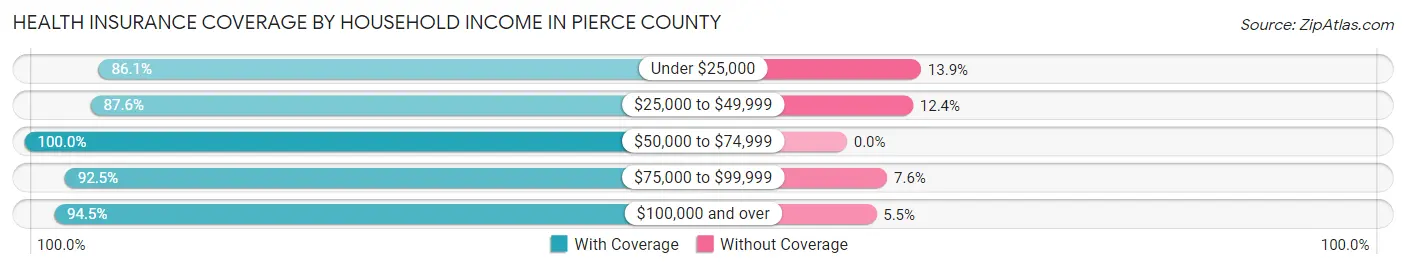
| Household Income | With Coverage | Without Coverage |
| Under $25,000 | 428 (86.1%) | 69 (13.9%) |
| $25,000 to $49,999 | 559 (87.6%) | 79 (12.4%) |
| $50,000 to $74,999 | 511 (100.0%) | 0 (0.0%) |
| $75,000 to $99,999 | 502 (92.4%) | 41 (7.5%) |
| $100,000 and over | 1,559 (94.5%) | 91 (5.5%) |
Public vs Private Health Insurance Coverage by Age in Pierce County
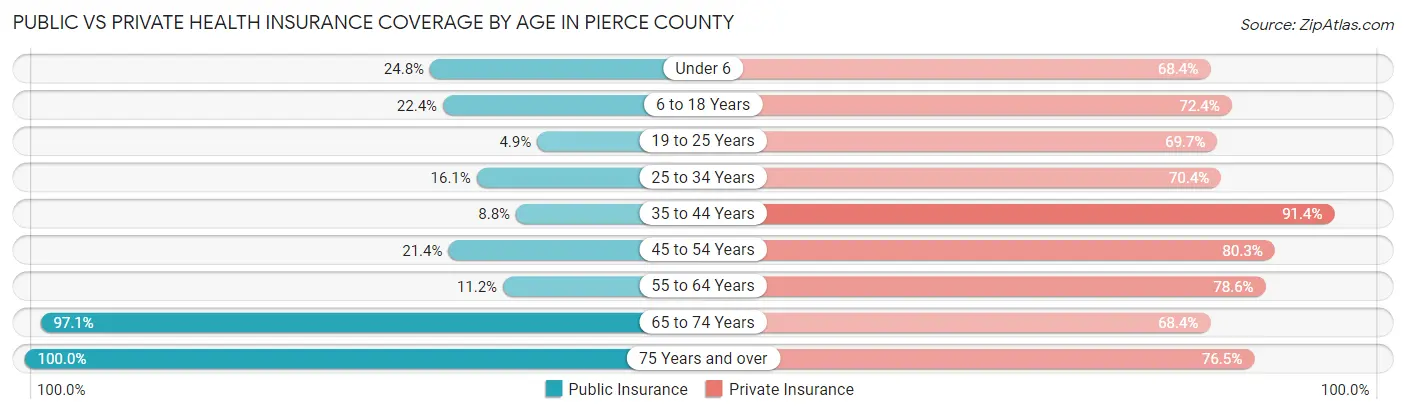
| Age Bracket | Public Insurance | Private Insurance |
| Under 6 | 54 (24.8%) | 149 (68.3%) |
| 6 to 18 Years | 148 (22.4%) | 479 (72.4%) |
| 19 to 25 Years | 14 (4.9%) | 200 (69.7%) |
| 25 to 34 Years | 43 (16.1%) | 188 (70.4%) |
| 35 to 44 Years | 44 (8.8%) | 457 (91.4%) |
| 45 to 54 Years | 88 (21.4%) | 331 (80.3%) |
| 55 to 64 Years | 64 (11.2%) | 449 (78.6%) |
| 65 to 74 Years | 494 (97.1%) | 348 (68.4%) |
| 75 Years and over | 413 (100.0%) | 316 (76.5%) |
| Total | 1,362 (35.5%) | 2,917 (76.0%) |
Disability Status by Sex by Age in Pierce County
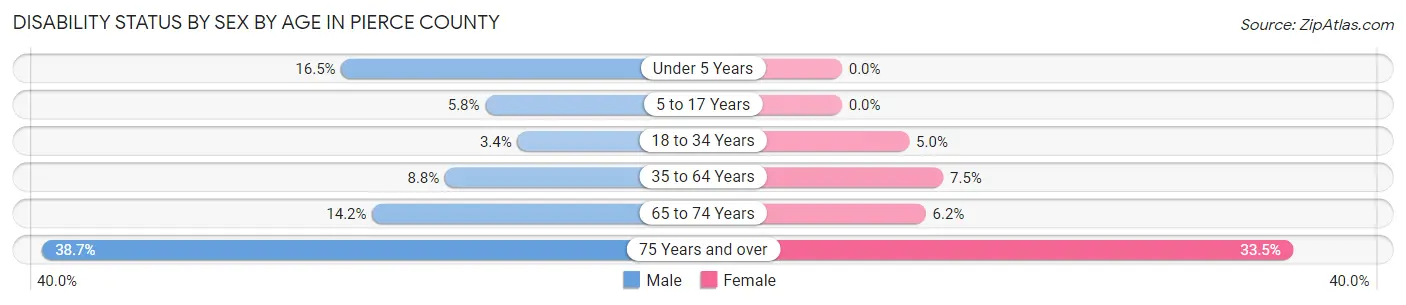
| Age Bracket | Male | Female |
| Under 5 Years | 15 (16.5%) | 0 (0.0%) |
| 5 to 17 Years | 18 (5.8%) | 0 (0.0%) |
| 18 to 34 Years | 10 (3.4%) | 13 (5.0%) |
| 35 to 64 Years | 66 (8.8%) | 55 (7.5%) |
| 65 to 74 Years | 38 (14.2%) | 15 (6.2%) |
| 75 Years and over | 65 (38.7%) | 82 (33.5%) |
Disability Class by Sex by Age in Pierce County
Disability Class: Hearing Difficulty
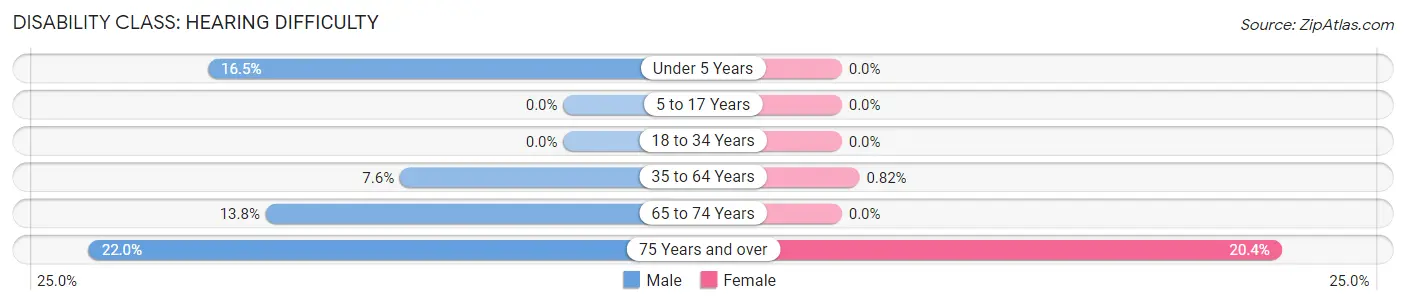
| Age Bracket | Male | Female |
| Under 5 Years | 15 (16.5%) | 0 (0.0%) |
| 5 to 17 Years | 0 (0.0%) | 0 (0.0%) |
| 18 to 34 Years | 0 (0.0%) | 0 (0.0%) |
| 35 to 64 Years | 57 (7.6%) | 6 (0.8%) |
| 65 to 74 Years | 37 (13.8%) | 0 (0.0%) |
| 75 Years and over | 37 (22.0%) | 50 (20.4%) |
Disability Class: Vision Difficulty
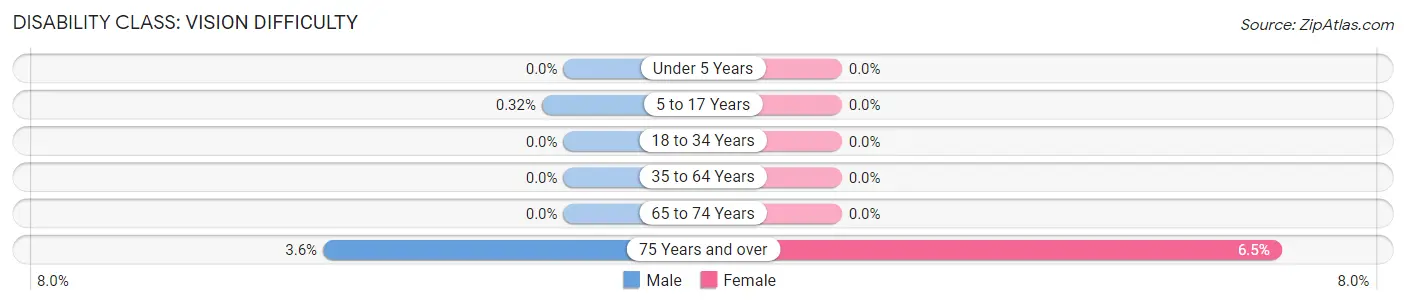
| Age Bracket | Male | Female |
| Under 5 Years | 0 (0.0%) | 0 (0.0%) |
| 5 to 17 Years | 1 (0.3%) | 0 (0.0%) |
| 18 to 34 Years | 0 (0.0%) | 0 (0.0%) |
| 35 to 64 Years | 0 (0.0%) | 0 (0.0%) |
| 65 to 74 Years | 0 (0.0%) | 0 (0.0%) |
| 75 Years and over | 6 (3.6%) | 16 (6.5%) |
Disability Class: Cognitive Difficulty
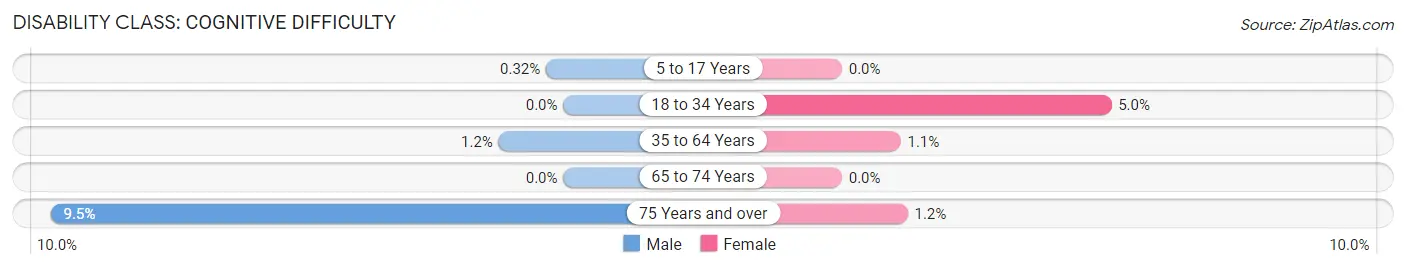
| Age Bracket | Male | Female |
| 5 to 17 Years | 1 (0.3%) | 0 (0.0%) |
| 18 to 34 Years | 0 (0.0%) | 13 (5.0%) |
| 35 to 64 Years | 9 (1.2%) | 8 (1.1%) |
| 65 to 74 Years | 0 (0.0%) | 0 (0.0%) |
| 75 Years and over | 16 (9.5%) | 3 (1.2%) |
Disability Class: Ambulatory Difficulty
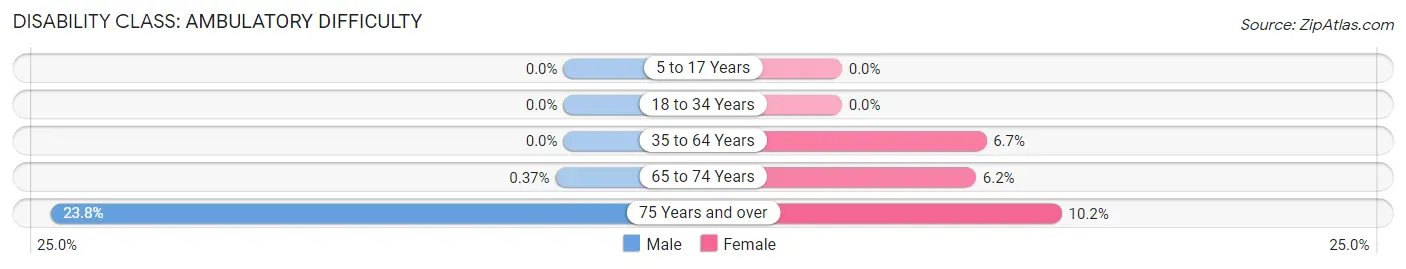
| Age Bracket | Male | Female |
| 5 to 17 Years | 0 (0.0%) | 0 (0.0%) |
| 18 to 34 Years | 0 (0.0%) | 0 (0.0%) |
| 35 to 64 Years | 0 (0.0%) | 49 (6.7%) |
| 65 to 74 Years | 1 (0.4%) | 15 (6.2%) |
| 75 Years and over | 40 (23.8%) | 25 (10.2%) |
Disability Class: Self-Care Difficulty
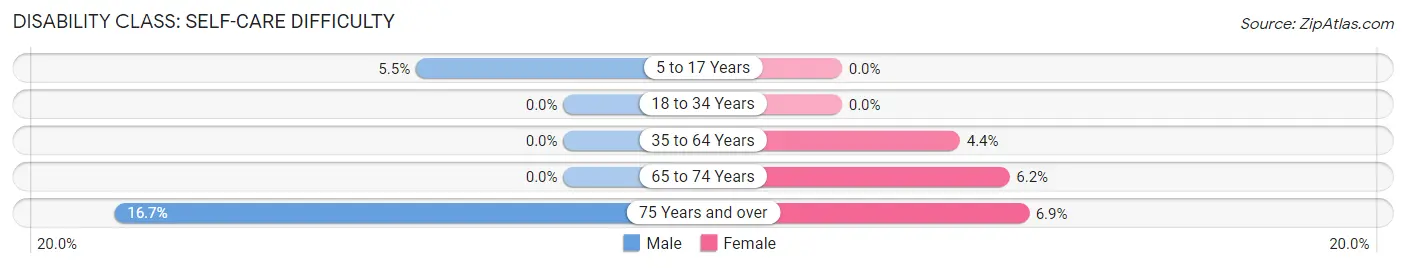
| Age Bracket | Male | Female |
| 5 to 17 Years | 17 (5.5%) | 0 (0.0%) |
| 18 to 34 Years | 0 (0.0%) | 0 (0.0%) |
| 35 to 64 Years | 0 (0.0%) | 32 (4.4%) |
| 65 to 74 Years | 0 (0.0%) | 15 (6.2%) |
| 75 Years and over | 28 (16.7%) | 17 (6.9%) |
Technology Access in Pierce County
Computing Device Access in Pierce County
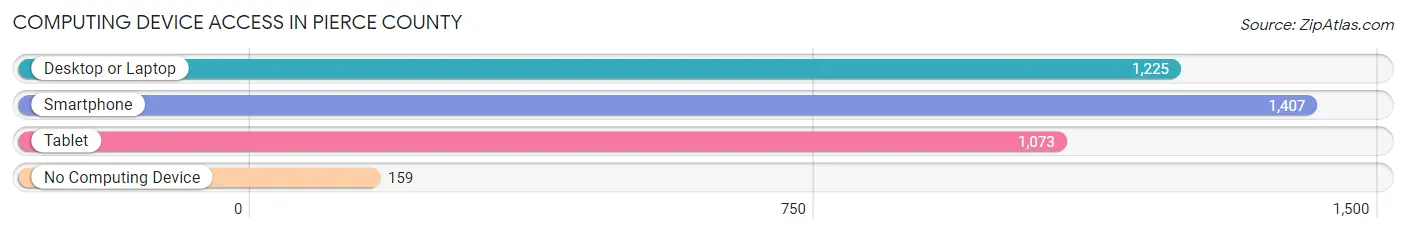
| Device Type | # Households | % Households |
| Desktop or Laptop | 1,225 | 72.5% |
| Smartphone | 1,407 | 83.3% |
| Tablet | 1,073 | 63.5% |
| No Computing Device | 159 | 9.4% |
| Total | 1,689 | 100.0% |
Internet Access in Pierce County
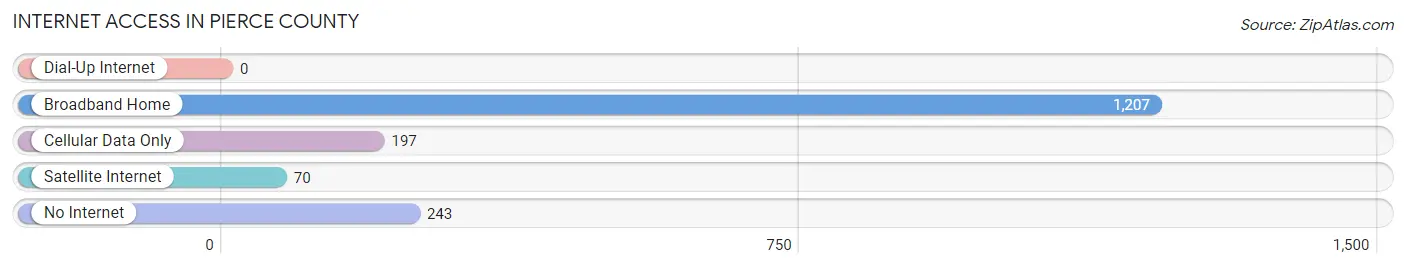
| Internet Type | # Households | % Households |
| Dial-Up Internet | 0 | 0.0% |
| Broadband Home | 1,207 | 71.5% |
| Cellular Data Only | 197 | 11.7% |
| Satellite Internet | 70 | 4.1% |
| No Internet | 243 | 14.4% |
| Total | 1,689 | 100.0% |
Pierce County Summary
Pierce County is located in the northeastern corner of North Dakota, and is bordered by Walsh County to the north, Nelson County to the east, and Cavalier County to the south. The county seat is Rugby, and the county was named after Franklin Pierce, the 14th President of the United States. The county has a total area of 1,068 square miles, and a population of 4,766 as of the 2010 census.
Geography
Pierce County is located in the Red River Valley, and is part of the Great Plains region. The county is mostly flat, with some rolling hills in the western part of the county. The county is drained by the Tongue River, which flows through the county from north to south. The county is also home to several small lakes, including Lake Alice, Lake Metigoshe, and Lake Metigoshe State Park.
The county is mostly rural, with the majority of the population living in small towns and rural areas. The largest city in the county is Rugby, with a population of 2,876 as of the 2010 census. Other towns in the county include Balta, Wolford, York, and Esmond.
Economy
The economy of Pierce County is largely based on agriculture. The county is home to several large farms, and the majority of the population is employed in the agricultural sector. The county is also home to several small businesses, including a number of restaurants, retail stores, and service providers.
The county is also home to several manufacturing companies, including a number of food processing plants. The county is also home to a number of energy companies, including a wind farm and a number of oil and gas wells.
Demographics
As of the 2010 census, the population of Pierce County was 4,766, with a population density of 4.5 people per square mile. The racial makeup of the county was 97.2% White, 0.3% African American, 0.3% Native American, 0.2% Asian, 0.1% Pacific Islander, 0.7% from other races, and 1.2% from two or more races. Hispanic or Latino of any race were 1.7% of the population.
The median income for a household in the county was $45,938, and the median income for a family was $51,944. The per capita income for the county was $20,945. About 8.2% of families and 10.2% of the population were below the poverty line, including 13.2% of those under age 18 and 8.2% of those age 65 or over.
Education
Pierce County is served by the Rugby Public School District, which includes one elementary school, one middle school, and one high school. The county is also home to a number of private schools, including St. Mary's Catholic School and the Rugby Academy. The county is also home to a number of higher education institutions, including the University of North Dakota, North Dakota State University, and the University of Mary.
Common Questions
What is the Total Population of Pierce County?
Total Population of Pierce County is 3,999.
What is the Total Male Population of Pierce County?
Total Male Population of Pierce County is 1,995.
What is the Total Female Population of Pierce County?
Total Female Population of Pierce County is 2,004.
What is the Ratio of Males per 100 Females in Pierce County?
There are 99.55 Males per 100 Females in Pierce County.
What is the Ratio of Females per 100 Males in Pierce County?
There are 100.45 Females per 100 Males in Pierce County.
What is the Median Population Age in Pierce County?
Median Population Age in Pierce County is 44.6 Years.
What is the Average Family Size in Pierce County
Average Family Size in Pierce County is 3.0 People.
What is the Average Household Size in Pierce County
Average Household Size in Pierce County is 2.3 People.
What is Per Capita Income in Pierce County?
Per Capita income in Pierce County is $35,931.
What is the Median Family Income in Pierce County?
Median Family Income in Pierce County is $97,689.
What is the Median Household income in Pierce County?
Median Household Income in Pierce County is $59,583.
What is Income or Wage Gap in Pierce County?
Income or Wage Gap in Pierce County is 45.8%.
Women in Pierce County earn 54.2 cents for every dollar earned by a man.
What is Inequality or Gini Index in Pierce County?
Inequality or Gini Index in Pierce County is 0.43.
How Large is the Labor Force in Pierce County?
There are 1,883 People in the Labor Forcein in Pierce County.
What is the Percentage of People in the Labor Force in Pierce County?
58.7% of People are in the Labor Force in Pierce County.
What is the Unemployment Rate in Pierce County?
Unemployment Rate in Pierce County is 1.0%.