Oliver County, ND
Oliver County Map
Oliver County Overview
1,832
TOTAL POPULATION
973
MALE POPULATION
859
FEMALE POPULATION
113.27
MALES / 100 FEMALES
88.28
FEMALES / 100 MALES
48.1
MEDIAN AGE
3.0
AVG FAMILY SIZE
2.6
AVG HOUSEHOLD SIZE
$36,532
PER CAPITA INCOME
$82,321
AVG FAMILY INCOME
$69,722
AVG HOUSEHOLD INCOME
35.2%
WAGE / INCOME GAP [ % ]
64.8¢/ $1
WAGE / INCOME GAP [ $ ]
0.38
INEQUALITY / GINI INDEX
802
LABOR FORCE [ PEOPLE ]
57.6%
PERCENT IN LABOR FORCE
2.9%
UNEMPLOYMENT RATE
Oliver County Area Codes
Race in Oliver County
The most populous races in Oliver County are White / Caucasian (1,683 | 91.9%), Two or more Races (128 | 7.0%), and Hispanic or Latino (61 | 3.3%).

| Race | # Population | % Population |
| Asian | 6 | 0.3% |
| Black / African American | 0 | 0.0% |
| Hawaiian / Pacific | 7 | 0.4% |
| Hispanic or Latino | 61 | 3.3% |
| Native / Alaskan | 8 | 0.4% |
| White / Caucasian | 1,683 | 91.9% |
| Two or more Races | 128 | 7.0% |
| Some other Race | 0 | 0.0% |
| Total | 1,832 | 100.0% |
Ancestry in Oliver County
The most populous ancestries reported in Oliver County are German (1,176 | 64.2%), Norwegian (280 | 15.3%), American (106 | 5.8%), Irish (97 | 5.3%), and Russian (85 | 4.6%), together accounting for 95.2% of all Oliver County residents.

| Ancestry | # Population | % Population |
| American | 106 | 5.8% |
| Burmese | 6 | 0.3% |
| Chippewa | 55 | 3.0% |
| Czech | 20 | 1.1% |
| Czechoslovakian | 3 | 0.2% |
| Danish | 9 | 0.5% |
| Dutch | 2 | 0.1% |
| English | 36 | 2.0% |
| Fijian | 7 | 0.4% |
| Finnish | 5 | 0.3% |
| French | 33 | 1.8% |
| German | 1,176 | 64.2% |
| German Russian | 2 | 0.1% |
| Hungarian | 2 | 0.1% |
| Irish | 97 | 5.3% |
| Italian | 3 | 0.2% |
| Korean | 3 | 0.2% |
| Malaysian | 9 | 0.5% |
| Mexican | 33 | 1.8% |
| Norwegian | 280 | 15.3% |
| Polish | 2 | 0.1% |
| Russian | 85 | 4.6% |
| Scandinavian | 16 | 0.9% |
| Scotch-Irish | 6 | 0.3% |
| Scottish | 11 | 0.6% |
| Sioux | 8 | 0.4% |
| Spaniard | 28 | 1.5% |
| Swedish | 31 | 1.7% |
| Ukrainian | 20 | 1.1% | View All 29 Rows |
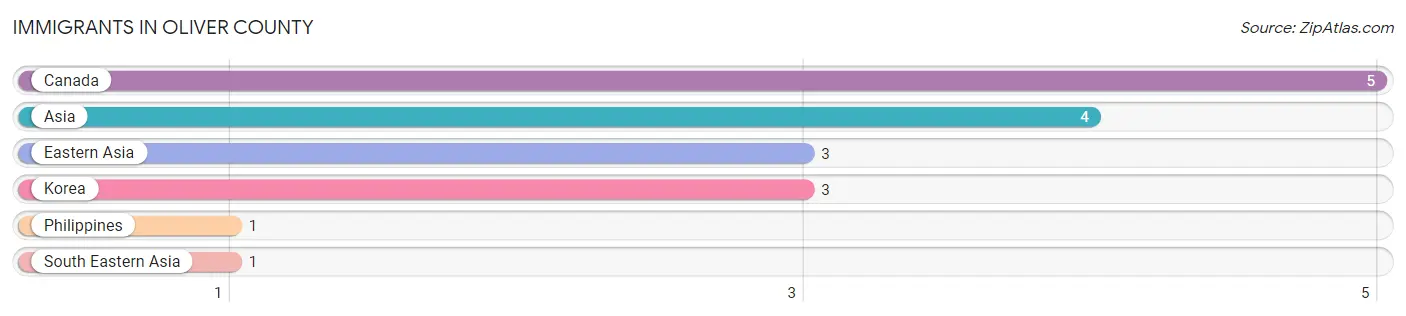
Immigrants in Oliver County
The most numerous immigrant groups reported in Oliver County came from Canada (5 | 0.3%), Asia (4 | 0.2%), Eastern Asia (3 | 0.2%), Korea (3 | 0.2%), and Philippines (1 | 0.1%), together accounting for 0.9% of all Oliver County residents.
| Immigration Origin | # Population | % Population |
| Asia | 4 | 0.2% |
| Canada | 5 | 0.3% |
| Eastern Asia | 3 | 0.2% |
| Korea | 3 | 0.2% |
| Philippines | 1 | 0.1% |
| South Eastern Asia | 1 | 0.1% | View All 6 Rows |
Sex and Age in Oliver County
Sex and Age in Oliver County
The most populous age groups in Oliver County are 65 to 69 Years (114 | 11.7%) for men and 55 to 59 Years (103 | 12.0%) for women.

| Age Bracket | Male | Female |
| Under 5 Years | 72 (7.4%) | 56 (6.5%) |
| 5 to 9 Years | 62 (6.4%) | 88 (10.2%) |
| 10 to 14 Years | 79 (8.1%) | 54 (6.3%) |
| 15 to 19 Years | 63 (6.5%) | 22 (2.6%) |
| 20 to 24 Years | 16 (1.6%) | 35 (4.1%) |
| 25 to 29 Years | 10 (1.0%) | 40 (4.7%) |
| 30 to 34 Years | 62 (6.4%) | 40 (4.7%) |
| 35 to 39 Years | 41 (4.2%) | 45 (5.2%) |
| 40 to 44 Years | 37 (3.8%) | 46 (5.4%) |
| 45 to 49 Years | 36 (3.7%) | 34 (4.0%) |
| 50 to 54 Years | 78 (8.0%) | 45 (5.2%) |
| 55 to 59 Years | 98 (10.1%) | 103 (12.0%) |
| 60 to 64 Years | 67 (6.9%) | 45 (5.2%) |
| 65 to 69 Years | 114 (11.7%) | 64 (7.4%) |
| 70 to 74 Years | 45 (4.6%) | 36 (4.2%) |
| 75 to 79 Years | 43 (4.4%) | 82 (9.6%) |
| 80 to 84 Years | 40 (4.1%) | 9 (1.1%) |
| 85 Years and over | 10 (1.0%) | 15 (1.8%) |
| Total | 973 (100.0%) | 859 (100.0%) |
Families and Households in Oliver County
Median Family Size in Oliver County
The median family size in Oliver County is 2.96 persons per family, with single female/mother families (35 | 6.2%) accounting for the largest median family size of 4.83 persons per family. On the other hand, married-couple families (505 | 89.4%) represent the smallest median family size with 2.83 persons per family.

| Family Type | # Families | Family Size |
| Married-Couple | 505 (89.4%) | 2.83 |
| Single Male/Father | 25 (4.4%) | 3.00 |
| Single Female/Mother | 35 (6.2%) | 4.83 |
| Total Families | 565 (100.0%) | 2.96 |
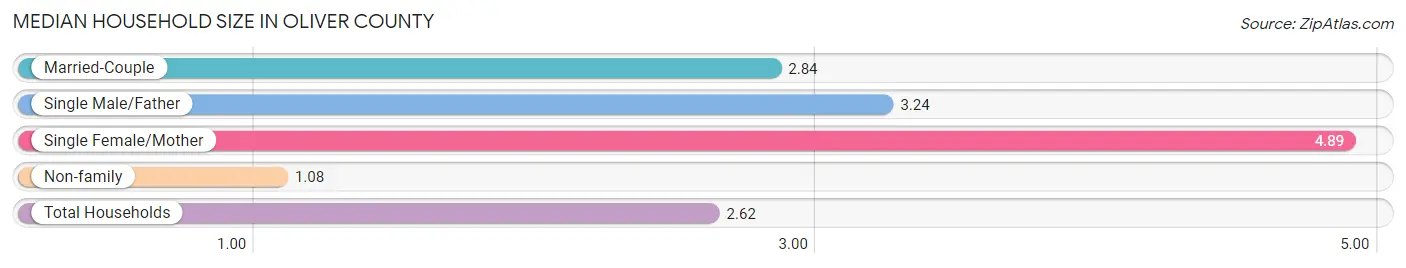
Median Household Size in Oliver County
The median household size in Oliver County is 2.62 persons per household, with single female/mother households (35 | 5.0%) accounting for the largest median household size of 4.89 persons per household. non-family households (133 | 19.1%) represent the smallest median household size with 1.08 persons per household.
| Household Type | # Households | Household Size |
| Married-Couple | 505 (72.4%) | 2.84 |
| Single Male/Father | 25 (3.6%) | 3.24 |
| Single Female/Mother | 35 (5.0%) | 4.89 |
| Non-family | 133 (19.1%) | 1.08 |
| Total Households | 698 (100.0%) | 2.62 |
Household Size by Marriage Status in Oliver County
Out of a total of 698 households in Oliver County, 565 (80.9%) are family households, while 133 (19.1%) are nonfamily households. The most numerous type of family households are 2-person households, comprising 343, and the most common type of nonfamily households are 1-person households, comprising 122.

| Household Size | Family Households | Nonfamily Households |
| 1-Person Households | - | 122 (17.5%) |
| 2-Person Households | 343 (49.1%) | 11 (1.6%) |
| 3-Person Households | 81 (11.6%) | 0 (0.0%) |
| 4-Person Households | 33 (4.7%) | 0 (0.0%) |
| 5-Person Households | 62 (8.9%) | 0 (0.0%) |
| 6-Person Households | 37 (5.3%) | 0 (0.0%) |
| 7+ Person Households | 9 (1.3%) | 0 (0.0%) |
| Total | 565 (80.9%) | 133 (19.1%) |
Female Fertility in Oliver County
Fertility by Age in Oliver County
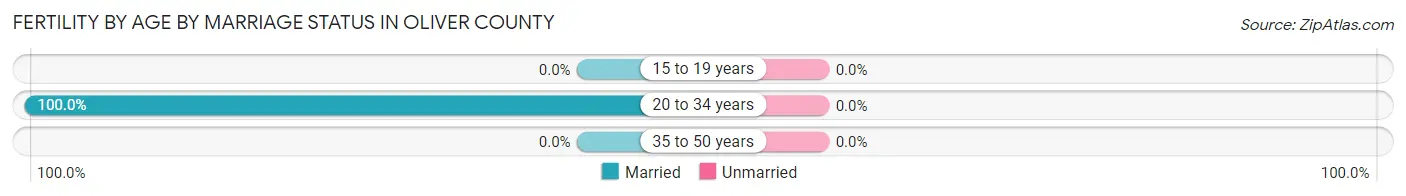
Average fertility rate in Oliver County is 22.0 births per 1,000 women. Women in the age bracket of 20 to 34 years have the highest fertility rate with 52.0 births per 1,000 women. Women in the age bracket of 20 to 34 years acount for 100.0% of all women with births.

| Age Bracket | Women with Births | Births / 1,000 Women |
| 15 to 19 years | 0 (0.0%) | 0.0 |
| 20 to 34 years | 6 (100.0%) | 52.0 |
| 35 to 50 years | 0 (0.0%) | 0.0 |
| Total | 6 (100.0%) | 22.0 |
Fertility by Age by Marriage Status in Oliver County
| Age Bracket | Married | Unmarried |
| 15 to 19 years | 0 (0.0%) | 0 (0.0%) |
| 20 to 34 years | 6 (100.0%) | 0 (0.0%) |
| 35 to 50 years | 0 (0.0%) | 0 (0.0%) |
| Total | 6 (100.0%) | 0 (0.0%) |
Fertility by Education in Oliver County
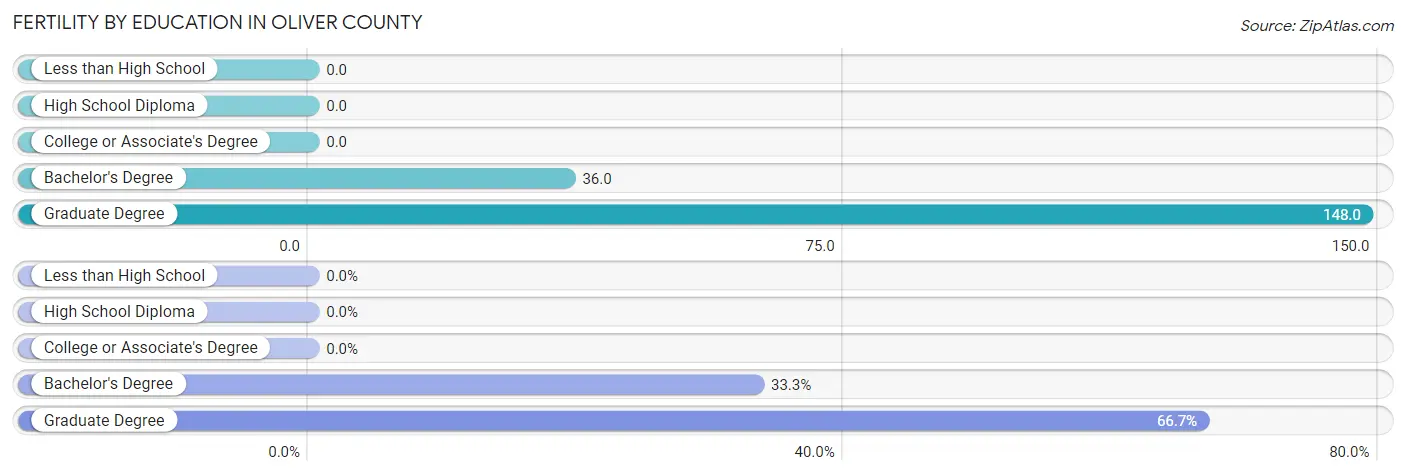
| Educational Attainment | Women with Births | Births / 1,000 Women |
| Less than High School | 0 (0.0%) | 0.0 |
| High School Diploma | 0 (0.0%) | 0.0 |
| College or Associate's Degree | 0 (0.0%) | 0.0 |
| Bachelor's Degree | 2 (33.3%) | 36.0 |
| Graduate Degree | 4 (66.7%) | 148.0 |
| Total | 6 (100.0%) | 22.0 |
Fertility by Education by Marriage Status in Oliver County

| Educational Attainment | Married | Unmarried |
| Less than High School | 0 (0.0%) | 0 (0.0%) |
| High School Diploma | 0 (0.0%) | 0 (0.0%) |
| College or Associate's Degree | 0 (0.0%) | 0 (0.0%) |
| Bachelor's Degree | 2 (100.0%) | 0 (0.0%) |
| Graduate Degree | 4 (100.0%) | 0 (0.0%) |
| Total | 6 (100.0%) | 0 (0.0%) |
Income in Oliver County
Income Overview in Oliver County
Per Capita Income in Oliver County is $36,532, while median incomes of families and households are $82,321 and $69,722 respectively.
| Characteristic | Number | Measure |
| Per Capita Income | 1,832 | $36,532 |
| Median Family Income | 565 | $82,321 |
| Mean Family Income | 565 | $99,731 |
| Median Household Income | 698 | $69,722 |
| Mean Household Income | 698 | $93,800 |
| Income Deficit | 565 | $0 |
| Wage / Income Gap (%) | 1,832 | 35.25% |
| Wage / Income Gap ($) | 1,832 | 64.75¢ per $1 |
| Gini / Inequality Index | 1,832 | 0.38 |
Earnings by Sex in Oliver County
Average Earnings in Oliver County are $48,920, $59,063 for men and $38,245 for women, a difference of 35.2%.

| Sex | Number | Average Earnings |
| Male | 473 (55.1%) | $59,063 |
| Female | 385 (44.9%) | $38,245 |
| Total | 858 (100.0%) | $48,920 |
Earnings by Sex by Income Bracket in Oliver County
The most common earnings brackets in Oliver County are $100,000+ for men (116 | 24.5%) and $35,000 to $39,999 for women (60 | 15.6%).

| Income | Male | Female |
| $2,499 or less | 40 (8.5%) | 19 (4.9%) |
| $2,500 to $4,999 | 14 (3.0%) | 14 (3.6%) |
| $5,000 to $7,499 | 11 (2.3%) | 8 (2.1%) |
| $7,500 to $9,999 | 2 (0.4%) | 5 (1.3%) |
| $10,000 to $12,499 | 0 (0.0%) | 5 (1.3%) |
| $12,500 to $14,999 | 5 (1.1%) | 6 (1.6%) |
| $15,000 to $17,499 | 10 (2.1%) | 1 (0.3%) |
| $17,500 to $19,999 | 2 (0.4%) | 22 (5.7%) |
| $20,000 to $22,499 | 10 (2.1%) | 20 (5.2%) |
| $22,500 to $24,999 | 0 (0.0%) | 11 (2.9%) |
| $25,000 to $29,999 | 4 (0.9%) | 34 (8.8%) |
| $30,000 to $34,999 | 7 (1.5%) | 24 (6.2%) |
| $35,000 to $39,999 | 10 (2.1%) | 60 (15.6%) |
| $40,000 to $44,999 | 0 (0.0%) | 13 (3.4%) |
| $45,000 to $49,999 | 57 (12.0%) | 34 (8.8%) |
| $50,000 to $54,999 | 25 (5.3%) | 22 (5.7%) |
| $55,000 to $64,999 | 59 (12.5%) | 16 (4.2%) |
| $65,000 to $74,999 | 27 (5.7%) | 33 (8.6%) |
| $75,000 to $99,999 | 74 (15.6%) | 24 (6.2%) |
| $100,000+ | 116 (24.5%) | 14 (3.6%) |
| Total | 473 (100.0%) | 385 (100.0%) |
Earnings by Sex by Educational Attainment in Oliver County
Average earnings in Oliver County are $64,792 for men and $39,231 for women, a difference of 39.5%. Men with an educational attainment of graduate degree enjoy the highest average annual earnings of $90,000, while those with college or associate's degree education earn the least with $58,036. Women with an educational attainment of graduate degree earn the most with the average annual earnings of $58,942, while those with high school diploma education have the smallest earnings of $25,179.

| Educational Attainment | Male Income | Female Income |
| Less than High School | - | - |
| High School Diploma | $63,438 | $25,179 |
| College or Associate's Degree | $58,036 | $39,413 |
| Bachelor's Degree | $74,038 | $47,500 |
| Graduate Degree | $90,000 | $58,942 |
| Total | $64,792 | $39,231 |
Family Income in Oliver County
Family Income Brackets in Oliver County
According to the Oliver County family income data, there are 126 families falling into the $100,000 to $149,999 income range, which is the most common income bracket and makes up 22.3% of all families. Conversely, the $10,000 to $14,999 income bracket is the least frequent group with only 4 families (0.7%) belonging to this category.
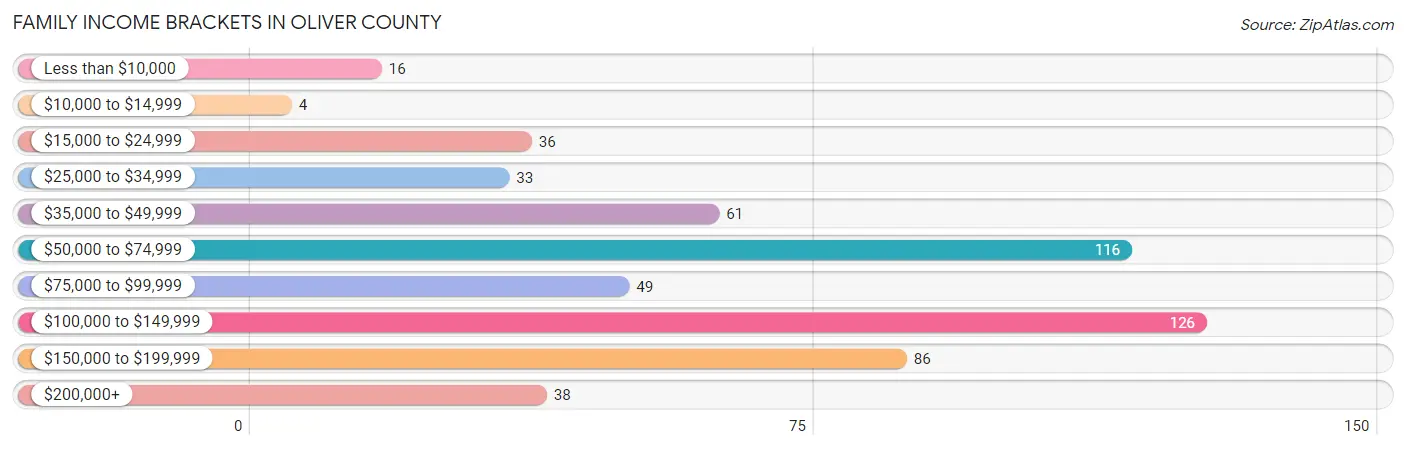
| Income Bracket | # Families | % Families |
| Less than $10,000 | 16 | 2.8% |
| $10,000 to $14,999 | 4 | 0.7% |
| $15,000 to $24,999 | 36 | 6.4% |
| $25,000 to $34,999 | 33 | 5.8% |
| $35,000 to $49,999 | 61 | 10.8% |
| $50,000 to $74,999 | 116 | 20.5% |
| $75,000 to $99,999 | 49 | 8.7% |
| $100,000 to $149,999 | 126 | 22.3% |
| $150,000 to $199,999 | 86 | 15.2% |
| $200,000+ | 38 | 6.7% |
Family Income by Famaliy Size in Oliver County
4-person families (30 | 5.3%) account for the highest median family income in Oliver County with $161,250 per family, while 3-person families (82 | 14.5%) have the highest median income of $49,231 per family member.

| Income Bracket | # Families | Median Income |
| 2-Person Families | 345 (61.1%) | $65,417 |
| 3-Person Families | 82 (14.5%) | $147,692 |
| 4-Person Families | 30 (5.3%) | $161,250 |
| 5-Person Families | 69 (12.2%) | $115,417 |
| 6-Person Families | 30 (5.3%) | $0 |
| 7+ Person Families | 9 (1.6%) | $0 |
| Total | 565 (100.0%) | $82,321 |
Family Income by Number of Earners in Oliver County
The median family income in Oliver County is $82,321, with families comprising 3+ earners (44) having the highest median family income of $188,750, while families with no earners (128) have the lowest median family income of $43,125, accounting for 7.8% and 22.7% of families, respectively.
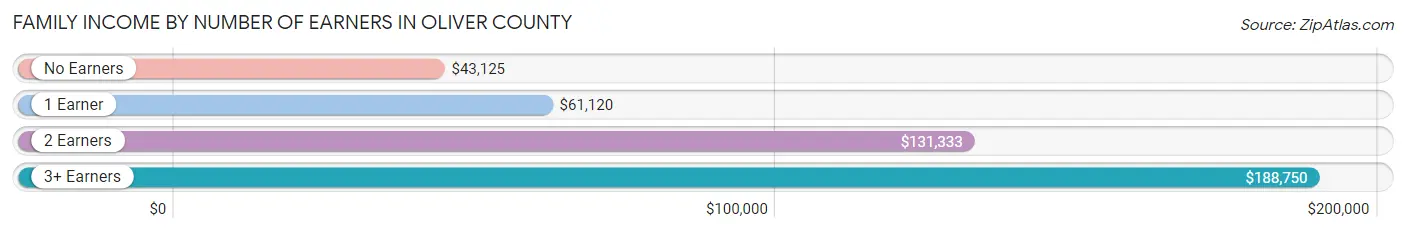
| Number of Earners | # Families | Median Income |
| No Earners | 128 (22.7%) | $43,125 |
| 1 Earner | 189 (33.5%) | $61,120 |
| 2 Earners | 204 (36.1%) | $131,333 |
| 3+ Earners | 44 (7.8%) | $188,750 |
| Total | 565 (100.0%) | $82,321 |
Household Income in Oliver County
Household Income Brackets in Oliver County
With 155 households falling in the category, the $50,000 to $74,999 income range is the most frequent in Oliver County, accounting for 22.2% of all households. In contrast, only 6 households (0.9%) fall into the $10,000 to $14,999 income bracket, making it the least populous group.

| Income Bracket | # Households | % Households |
| Less than $10,000 | 25 | 3.6% |
| $10,000 to $14,999 | 6 | 0.9% |
| $15,000 to $24,999 | 45 | 6.4% |
| $25,000 to $34,999 | 50 | 7.2% |
| $35,000 to $49,999 | 79 | 11.3% |
| $50,000 to $74,999 | 155 | 22.2% |
| $75,000 to $99,999 | 66 | 9.5% |
| $100,000 to $149,999 | 140 | 20.1% |
| $150,000 to $199,999 | 89 | 12.8% |
| $200,000+ | 43 | 6.2% |
Household Income by Householder Age in Oliver County
The median household income in Oliver County is $69,722, with the highest median household income of $105,750 found in the 25 to 44 years age bracket for the primary householder. A total of 170 households (24.4%) fall into this category. Meanwhile, the 15 to 24 years age bracket for the primary householder has the lowest median household income of $0, with 11 households (1.6%) in this group.

| Income Bracket | # Households | Median Income |
| 15 to 24 Years | 11 (1.6%) | $0 |
| 25 to 44 Years | 170 (24.4%) | $105,750 |
| 45 to 64 Years | 243 (34.8%) | $102,679 |
| 65+ Years | 274 (39.3%) | $56,875 |
| Total | 698 (100.0%) | $69,722 |
Poverty in Oliver County
Income Below Poverty by Sex and Age in Oliver County
With 11.5% poverty level for males and 11.5% for females among the residents of Oliver County, 12 to 14 year old males and 75 year old and over females are the most vulnerable to poverty, with 21 males (61.8%) and 41 females (38.7%) in their respective age groups living below the poverty level.

| Age Bracket | Male | Female |
| Under 5 Years | 10 (13.9%) | 2 (3.6%) |
| 5 Years | 0 (0.0%) | 0 (0.0%) |
| 6 to 11 Years | 23 (23.2%) | 12 (12.4%) |
| 12 to 14 Years | 21 (61.8%) | 0 (0.0%) |
| 15 Years | 8 (47.1%) | 0 (0.0%) |
| 16 and 17 Years | 0 (0.0%) | 2 (18.2%) |
| 18 to 24 Years | 5 (12.2%) | 0 (0.0%) |
| 25 to 34 Years | 3 (4.2%) | 11 (13.8%) |
| 35 to 44 Years | 0 (0.0%) | 7 (7.7%) |
| 45 to 54 Years | 27 (23.7%) | 6 (7.6%) |
| 55 to 64 Years | 0 (0.0%) | 10 (6.8%) |
| 65 to 74 Years | 5 (3.1%) | 8 (8.0%) |
| 75 Years and over | 10 (10.7%) | 41 (38.7%) |
| Total | 112 (11.5%) | 99 (11.5%) |
Income Above Poverty by Sex and Age in Oliver County
According to the poverty statistics in Oliver County, males aged 5 years and females aged 5 years are the age groups that are most secure financially, with 100.0% of males and 100.0% of females in these age groups living above the poverty line.

| Age Bracket | Male | Female |
| Under 5 Years | 62 (86.1%) | 54 (96.4%) |
| 5 Years | 7 (100.0%) | 17 (100.0%) |
| 6 to 11 Years | 76 (76.8%) | 85 (87.6%) |
| 12 to 14 Years | 13 (38.2%) | 28 (100.0%) |
| 15 Years | 9 (52.9%) | 11 (100.0%) |
| 16 and 17 Years | 21 (100.0%) | 9 (81.8%) |
| 18 to 24 Years | 36 (87.8%) | 35 (100.0%) |
| 25 to 34 Years | 69 (95.8%) | 69 (86.3%) |
| 35 to 44 Years | 78 (100.0%) | 84 (92.3%) |
| 45 to 54 Years | 87 (76.3%) | 73 (92.4%) |
| 55 to 64 Years | 165 (100.0%) | 138 (93.2%) |
| 65 to 74 Years | 154 (96.9%) | 92 (92.0%) |
| 75 Years and over | 83 (89.2%) | 65 (61.3%) |
| Total | 860 (88.5%) | 760 (88.5%) |
Income Below Poverty Among Married-Couple Families in Oliver County
The poverty statistics for married-couple families in Oliver County show that 4.0% or 20 of the total 505 families live below the poverty line. Families with 3 or 4 children have the highest poverty rate of 9.3%, comprising of 7 families. On the other hand, families with 1 or 2 children have the lowest poverty rate of 0.0%, which includes 0 families.

| Children | Above Poverty | Below Poverty |
| No Children | 323 (96.1%) | 13 (3.9%) |
| 1 or 2 Children | 85 (100.0%) | 0 (0.0%) |
| 3 or 4 Children | 68 (90.7%) | 7 (9.3%) |
| 5 or more Children | 9 (100.0%) | 0 (0.0%) |
| Total | 485 (96.0%) | 20 (4.0%) |
Income Below Poverty Among Single-Parent Households in Oliver County
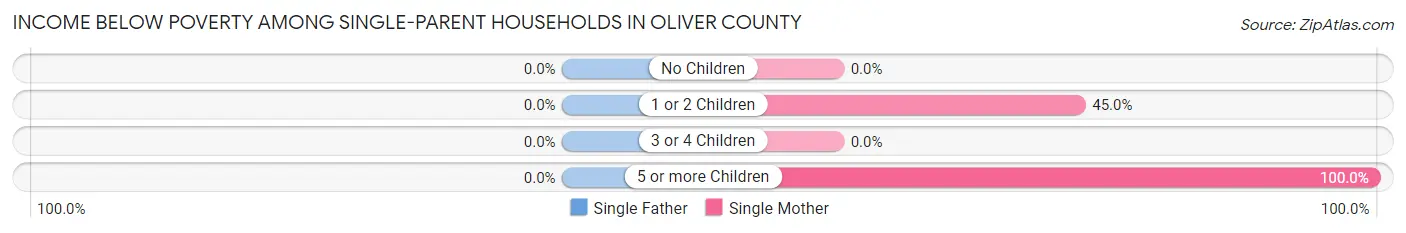
| Children | Single Father | Single Mother |
| No Children | 0 (0.0%) | 0 (0.0%) |
| 1 or 2 Children | 0 (0.0%) | 9 (45.0%) |
| 3 or 4 Children | 0 (0.0%) | 0 (0.0%) |
| 5 or more Children | 0 (0.0%) | 7 (100.0%) |
| Total | 0 (0.0%) | 16 (45.7%) |
Income Below Poverty Among Married-Couple vs Single-Parent Households in Oliver County
The poverty data for Oliver County shows that 20 of the married-couple family households (4.0%) and 16 of the single-parent households (26.7%) are living below the poverty level. Within the married-couple family households, those with 3 or 4 children have the highest poverty rate, with 7 households (9.3%) falling below the poverty line. Among the single-parent households, those with 5 or more children have the highest poverty rate, with 7 household (100.0%) living below poverty.
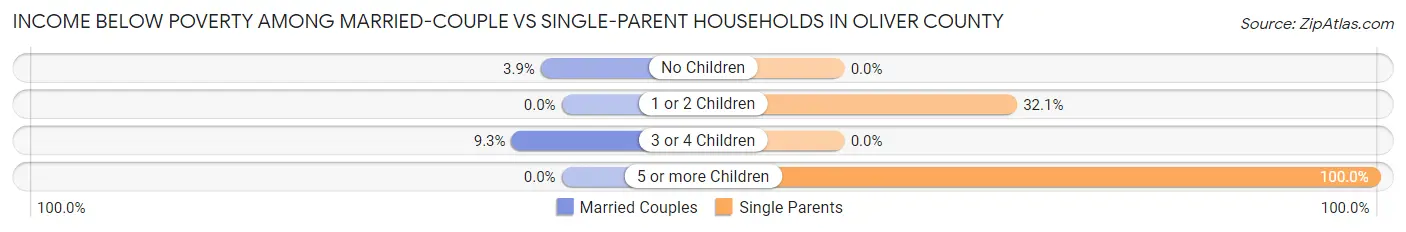
| Children | Married-Couple Families | Single-Parent Households |
| No Children | 13 (3.9%) | 0 (0.0%) |
| 1 or 2 Children | 0 (0.0%) | 9 (32.1%) |
| 3 or 4 Children | 7 (9.3%) | 0 (0.0%) |
| 5 or more Children | 0 (0.0%) | 7 (100.0%) |
| Total | 20 (4.0%) | 16 (26.7%) |
Employment Characteristics in Oliver County
Employment by Class of Employer in Oliver County
Among the 775 employed individuals in Oliver County, private company employees (419 | 54.1%), local government employees (93 | 12.0%), and self-employed (not incorporated) (81 | 10.4%) make up the most common classes of employment.

| Employer Class | # Employees | % Employees |
| Private Company Employees | 419 | 54.1% |
| Self-Employed (Incorporated) | 19 | 2.5% |
| Self-Employed (Not Incorporated) | 81 | 10.4% |
| Not-for-profit Organizations | 57 | 7.3% |
| Local Government Employees | 93 | 12.0% |
| State Government Employees | 53 | 6.8% |
| Federal Government Employees | 49 | 6.3% |
| Unpaid Family Workers | 4 | 0.5% |
| Total | 775 | 100.0% |
Employment Status by Age in Oliver County
According to the labor force statistics for Oliver County, out of the total population over 16 years of age (1,393), 57.6% or 802 individuals are in the labor force, with 2.9% or 23 of them unemployed. The age group with the highest labor force participation rate is 20 to 24 years, with 100.0% or 51 individuals in the labor force. Within the labor force, the 60 to 64 years age range has the highest percentage of unemployed individuals, with 5.8% or 4 of them being unemployed.
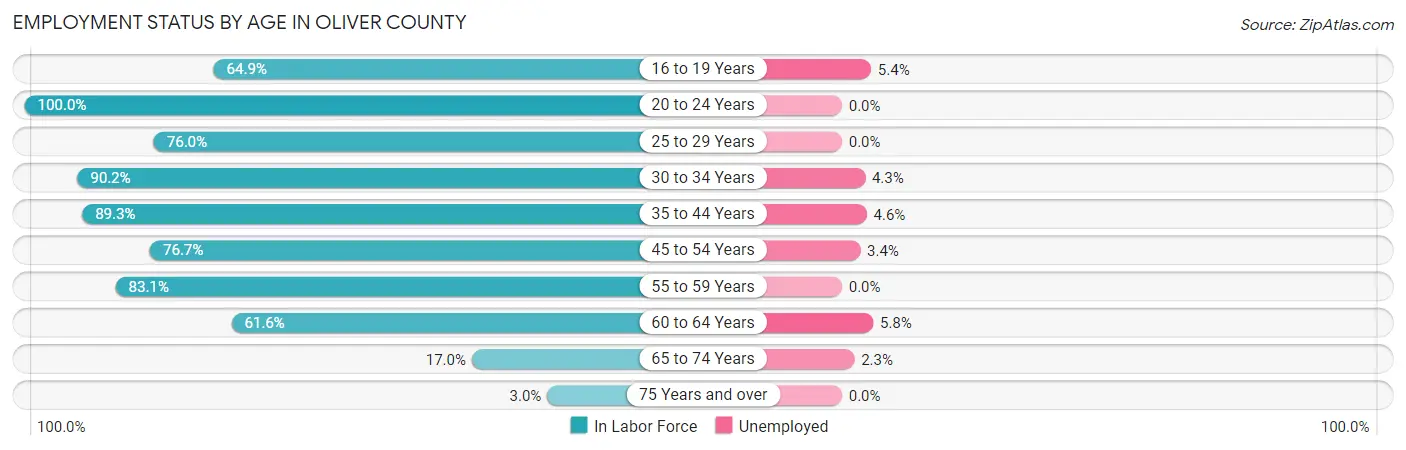
| Age Bracket | In Labor Force | Unemployed |
| 16 to 19 Years | 37 (64.9%) | 2 (5.4%) |
| 20 to 24 Years | 51 (100.0%) | 0 (0.0%) |
| 25 to 29 Years | 38 (76.0%) | 0 (0.0%) |
| 30 to 34 Years | 92 (90.2%) | 4 (4.3%) |
| 35 to 44 Years | 151 (89.3%) | 7 (4.6%) |
| 45 to 54 Years | 148 (76.7%) | 5 (3.4%) |
| 55 to 59 Years | 167 (83.1%) | 0 (0.0%) |
| 60 to 64 Years | 69 (61.6%) | 4 (5.8%) |
| 65 to 74 Years | 44 (17.0%) | 1 (2.3%) |
| 75 Years and over | 6 (3.0%) | 0 (0.0%) |
| Total | 802 (57.6%) | 23 (2.9%) |
Employment Status by Educational Attainment in Oliver County
According to labor force statistics for Oliver County, 80.4% of individuals (665) out of the total population between 25 and 64 years of age (827) are in the labor force, with 3.0% or 20 of them being unemployed. The group with the highest labor force participation rate are those with the educational attainment of bachelor's degree or higher, with 90.0% or 190 individuals in the labor force. Within the labor force, individuals with less than high school education have the highest percentage of unemployment, with 36.8% or 7 of them being unemployed.

| Educational Attainment | In Labor Force | Unemployed |
| Less than High School | 19 (63.3%) | 11 (36.8%) |
| High School Diploma | 196 (75.1%) | 5 (2.0%) |
| College / Associate Degree | 260 (80.0%) | 5 (1.5%) |
| Bachelor's Degree or higher | 190 (90.0%) | 5 (2.6%) |
| Total | 665 (80.4%) | 25 (3.0%) |
Employment Occupations by Sex in Oliver County
Management, Business, Science and Arts Occupations
The most common Management, Business, Science and Arts occupations in Oliver County are Management (130 | 16.7%), Community & Social Service (54 | 6.9%), Computers, Engineering & Science (51 | 6.5%), Health Diagnosing & Treating (35 | 4.5%), and Education Instruction & Library (32 | 4.1%).

Management, Business, Science and Arts Occupations by Sex
Within the Management, Business, Science and Arts occupations in Oliver County, the most male-oriented occupations are Architecture & Engineering (100.0%), Management (78.5%), and Education, Arts & Media (55.6%), while the most female-oriented occupations are Business & Financial (100.0%), Life, Physical & Social Science (100.0%), and Legal Services & Support (100.0%).

| Occupation | Male | Female |
| Management | 102 (78.5%) | 28 (21.5%) |
| Business & Financial | 0 (0.0%) | 27 (100.0%) |
| Computers, Engineering & Science | 28 (54.9%) | 23 (45.1%) |
| Computers & Mathematics | 12 (38.7%) | 19 (61.3%) |
| Architecture & Engineering | 16 (100.0%) | 0 (0.0%) |
| Life, Physical & Social Science | 0 (0.0%) | 4 (100.0%) |
| Community & Social Service | 5 (9.3%) | 49 (90.7%) |
| Education, Arts & Media | 5 (55.6%) | 4 (44.4%) |
| Legal Services & Support | 0 (0.0%) | 13 (100.0%) |
| Education Instruction & Library | 0 (0.0%) | 32 (100.0%) |
| Arts, Media & Entertainment | 0 (0.0%) | 0 (0.0%) |
| Health Diagnosing & Treating | 8 (22.9%) | 27 (77.1%) |
| Health Technologists | 5 (21.7%) | 18 (78.3%) |
| Total (Category) | 143 (48.1%) | 154 (51.8%) |
| Total (Overall) | 425 (54.5%) | 355 (45.5%) |
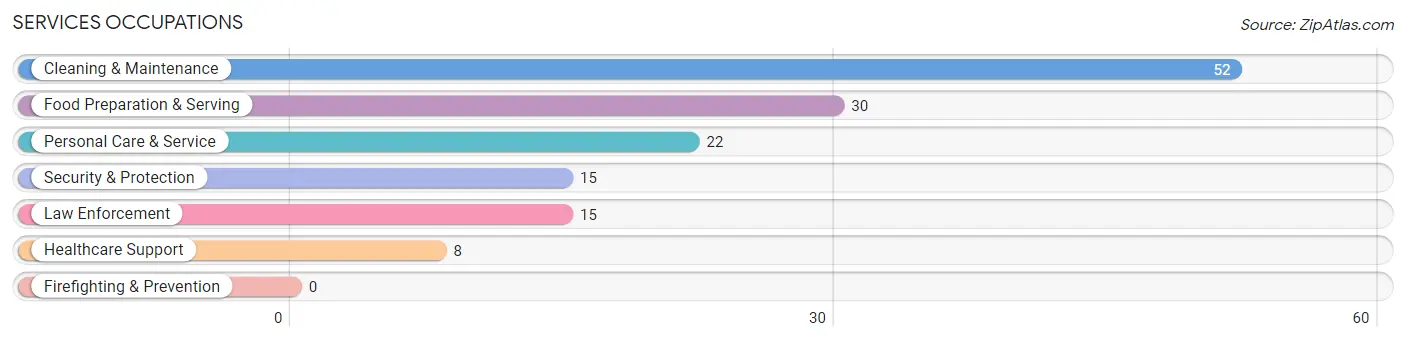
Services Occupations
The most common Services occupations in Oliver County are Cleaning & Maintenance (52 | 6.7%), Food Preparation & Serving (30 | 3.8%), Personal Care & Service (22 | 2.8%), Security & Protection (15 | 1.9%), and Law Enforcement (15 | 1.9%).
Services Occupations by Sex
Within the Services occupations in Oliver County, the most male-oriented occupations are Security & Protection (100.0%), Law Enforcement (100.0%), and Cleaning & Maintenance (82.7%), while the most female-oriented occupations are Healthcare Support (100.0%), Personal Care & Service (100.0%), and Food Preparation & Serving (63.3%).

| Occupation | Male | Female |
| Healthcare Support | 0 (0.0%) | 8 (100.0%) |
| Security & Protection | 15 (100.0%) | 0 (0.0%) |
| Firefighting & Prevention | 0 (0.0%) | 0 (0.0%) |
| Law Enforcement | 15 (100.0%) | 0 (0.0%) |
| Food Preparation & Serving | 11 (36.7%) | 19 (63.3%) |
| Cleaning & Maintenance | 43 (82.7%) | 9 (17.3%) |
| Personal Care & Service | 0 (0.0%) | 22 (100.0%) |
| Total (Category) | 69 (54.3%) | 58 (45.7%) |
| Total (Overall) | 425 (54.5%) | 355 (45.5%) |
Sales and Office Occupations
The most common Sales and Office occupations in Oliver County are Office & Administration (99 | 12.7%), and Sales & Related (71 | 9.1%).

Sales and Office Occupations by Sex

| Occupation | Male | Female |
| Sales & Related | 28 (39.4%) | 43 (60.6%) |
| Office & Administration | 3 (3.0%) | 96 (97.0%) |
| Total (Category) | 31 (18.2%) | 139 (81.8%) |
| Total (Overall) | 425 (54.5%) | 355 (45.5%) |
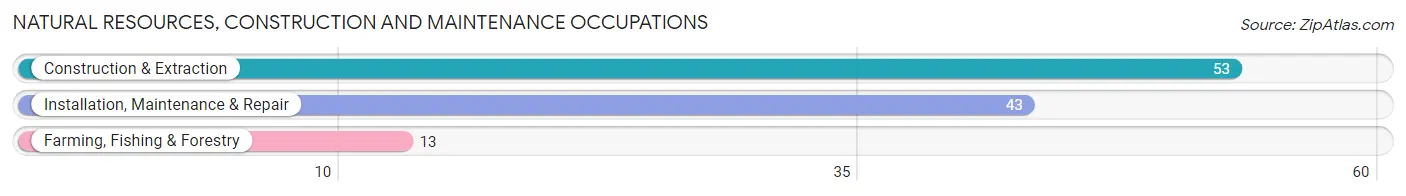
Natural Resources, Construction and Maintenance Occupations
The most common Natural Resources, Construction and Maintenance occupations in Oliver County are Construction & Extraction (53 | 6.8%), Installation, Maintenance & Repair (43 | 5.5%), and Farming, Fishing & Forestry (13 | 1.7%).
Natural Resources, Construction and Maintenance Occupations by Sex

| Occupation | Male | Female |
| Farming, Fishing & Forestry | 9 (69.2%) | 4 (30.8%) |
| Construction & Extraction | 53 (100.0%) | 0 (0.0%) |
| Installation, Maintenance & Repair | 43 (100.0%) | 0 (0.0%) |
| Total (Category) | 105 (96.3%) | 4 (3.7%) |
| Total (Overall) | 425 (54.5%) | 355 (45.5%) |
Production, Transportation and Moving Occupations
The most common Production, Transportation and Moving occupations in Oliver County are Production (45 | 5.8%), Transportation (25 | 3.2%), and Material Moving (7 | 0.9%).
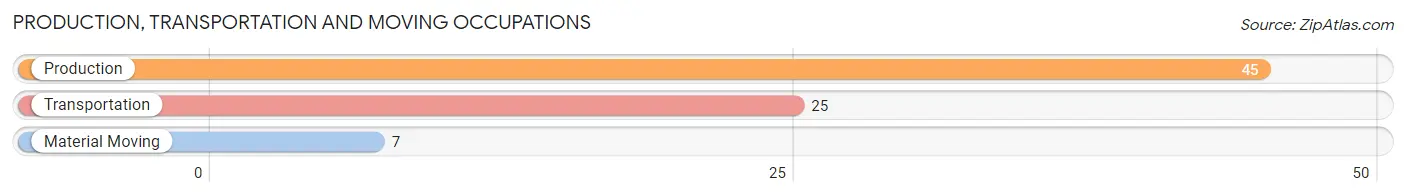
Production, Transportation and Moving Occupations by Sex

| Occupation | Male | Female |
| Production | 45 (100.0%) | 0 (0.0%) |
| Transportation | 25 (100.0%) | 0 (0.0%) |
| Material Moving | 7 (100.0%) | 0 (0.0%) |
| Total (Category) | 77 (100.0%) | 0 (0.0%) |
| Total (Overall) | 425 (54.5%) | 355 (45.5%) |
Employment Industries by Sex in Oliver County
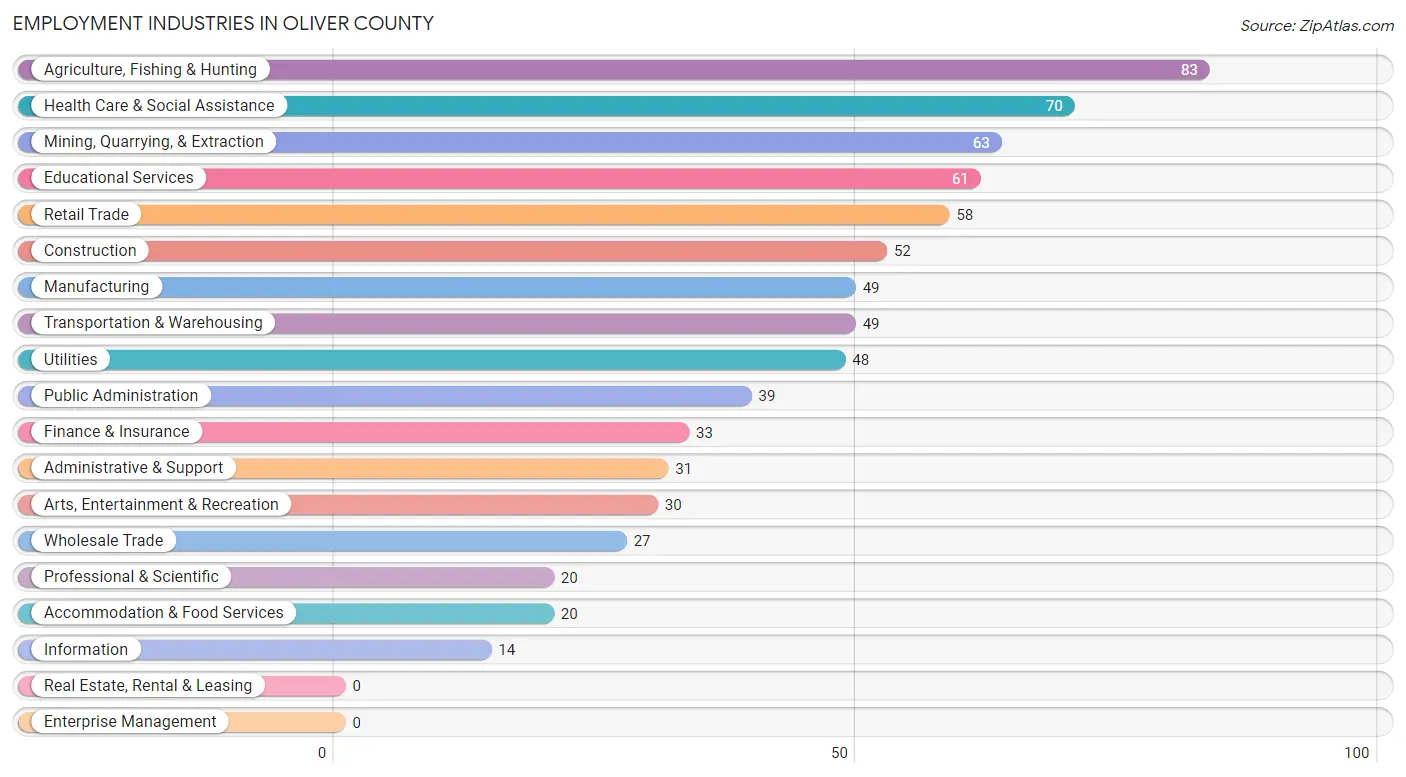
Employment Industries in Oliver County
The major employment industries in Oliver County include Agriculture, Fishing & Hunting (83 | 10.6%), Health Care & Social Assistance (70 | 9.0%), Mining, Quarrying, & Extraction (63 | 8.1%), Educational Services (61 | 7.8%), and Retail Trade (58 | 7.4%).
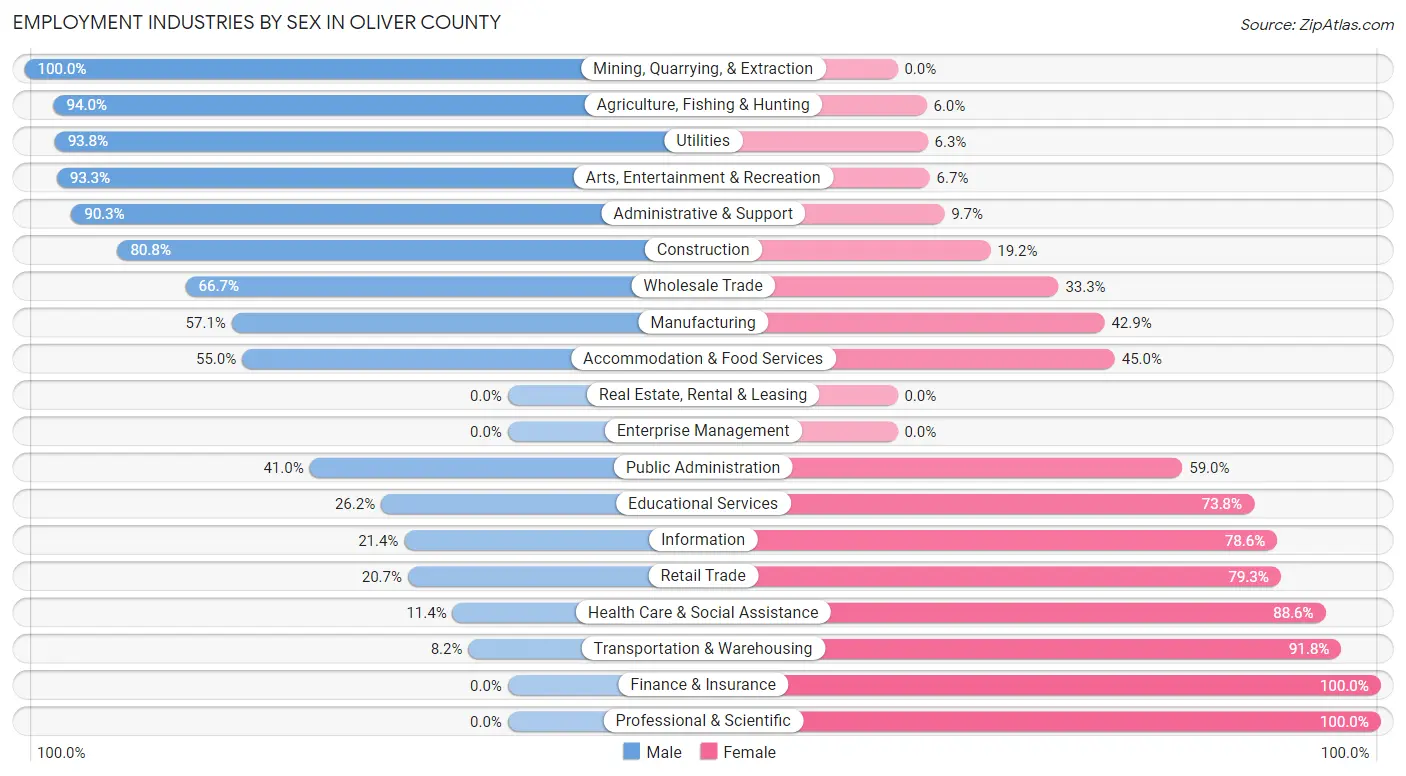
Employment Industries by Sex in Oliver County
The Oliver County industries that see more men than women are Mining, Quarrying, & Extraction (100.0%), Agriculture, Fishing & Hunting (94.0%), and Utilities (93.8%), whereas the industries that tend to have a higher number of women are Finance & Insurance (100.0%), Professional & Scientific (100.0%), and Transportation & Warehousing (91.8%).
| Industry | Male | Female |
| Agriculture, Fishing & Hunting | 78 (94.0%) | 5 (6.0%) |
| Mining, Quarrying, & Extraction | 63 (100.0%) | 0 (0.0%) |
| Construction | 42 (80.8%) | 10 (19.2%) |
| Manufacturing | 28 (57.1%) | 21 (42.9%) |
| Wholesale Trade | 18 (66.7%) | 9 (33.3%) |
| Retail Trade | 12 (20.7%) | 46 (79.3%) |
| Transportation & Warehousing | 4 (8.2%) | 45 (91.8%) |
| Utilities | 45 (93.8%) | 3 (6.2%) |
| Information | 3 (21.4%) | 11 (78.6%) |
| Finance & Insurance | 0 (0.0%) | 33 (100.0%) |
| Real Estate, Rental & Leasing | 0 (0.0%) | 0 (0.0%) |
| Professional & Scientific | 0 (0.0%) | 20 (100.0%) |
| Enterprise Management | 0 (0.0%) | 0 (0.0%) |
| Administrative & Support | 28 (90.3%) | 3 (9.7%) |
| Educational Services | 16 (26.2%) | 45 (73.8%) |
| Health Care & Social Assistance | 8 (11.4%) | 62 (88.6%) |
| Arts, Entertainment & Recreation | 28 (93.3%) | 2 (6.7%) |
| Accommodation & Food Services | 11 (55.0%) | 9 (45.0%) |
| Public Administration | 16 (41.0%) | 23 (59.0%) |
| Total | 425 (54.5%) | 355 (45.5%) |
Education in Oliver County
School Enrollment in Oliver County
The most common levels of schooling among the 394 students in Oliver County are elementary school (128 | 32.5%), middle school (105 | 26.7%), and high school (71 | 18.0%).

| School Level | # Students | % Students |
| Nursery / Preschool | 29 | 7.4% |
| Kindergarten | 25 | 6.4% |
| Elementary School | 128 | 32.5% |
| Middle School | 105 | 26.7% |
| High School | 71 | 18.0% |
| College / Undergraduate | 34 | 8.6% |
| Graduate / Professional | 2 | 0.5% |
| Total | 394 | 100.0% |
School Enrollment by Age by Funding Source in Oliver County
Out of a total of 394 students who are enrolled in schools in Oliver County, 21 (5.3%) attend a private institution, while the remaining 373 (94.7%) are enrolled in public schools. The age group of 20 to 24 year olds has the highest likelihood of being enrolled in private schools, with 20 (76.9% in the age bracket) enrolled. Conversely, the age group of 3 to 4 year olds has the lowest likelihood of being enrolled in a private school, with 12 (100.0% in the age bracket) attending a public institution.

| Age Bracket | Public School | Private School |
| 3 to 4 Year Olds | 12 (100.0%) | 0 (0.0%) |
| 5 to 9 Year Old | 141 (99.3%) | 1 (0.7%) |
| 10 to 14 Year Olds | 133 (100.0%) | 0 (0.0%) |
| 15 to 17 Year Olds | 54 (100.0%) | 0 (0.0%) |
| 18 to 19 Year Olds | 17 (100.0%) | 0 (0.0%) |
| 20 to 24 Year Olds | 6 (23.1%) | 20 (76.9%) |
| 25 to 34 Year Olds | 6 (100.0%) | 0 (0.0%) |
| 35 Years and over | 4 (100.0%) | 0 (0.0%) |
| Total | 373 (94.7%) | 21 (5.3%) |
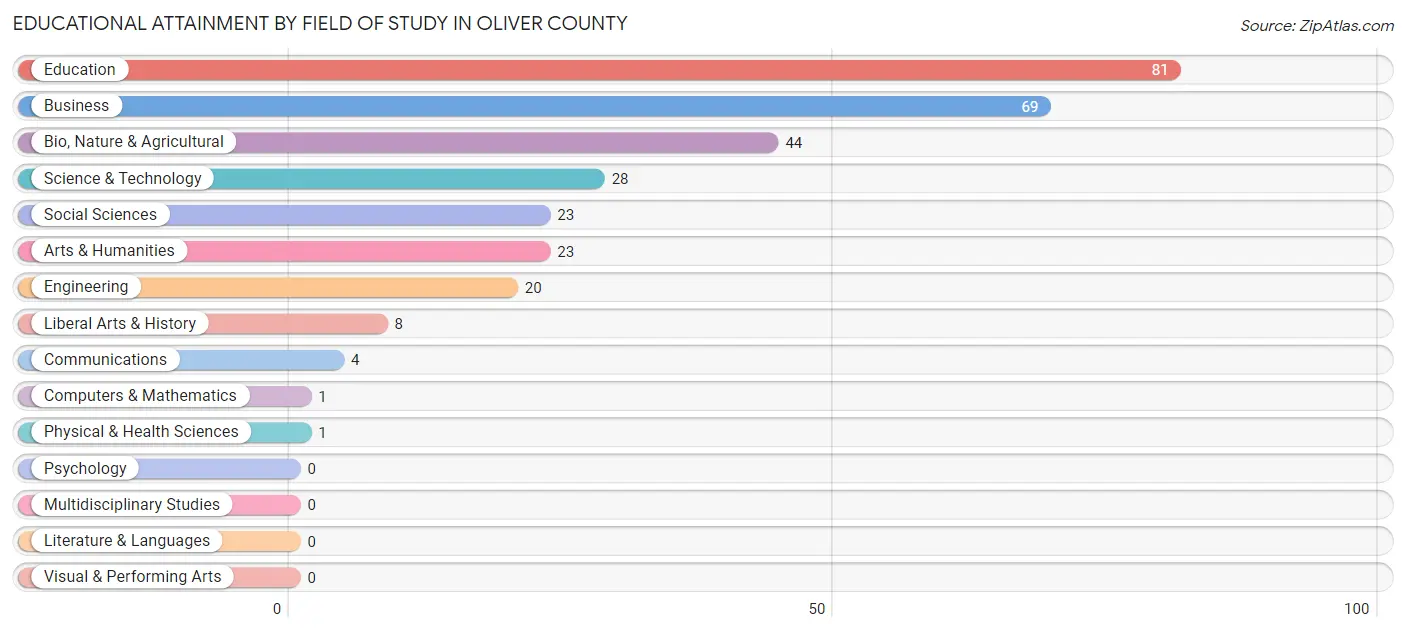
Educational Attainment by Field of Study in Oliver County
Education (81 | 26.8%), business (69 | 22.9%), bio, nature & agricultural (44 | 14.6%), science & technology (28 | 9.3%), and social sciences (23 | 7.6%) are the most common fields of study among 302 individuals in Oliver County who have obtained a bachelor's degree or higher.
| Field of Study | # Graduates | % Graduates |
| Computers & Mathematics | 1 | 0.3% |
| Bio, Nature & Agricultural | 44 | 14.6% |
| Physical & Health Sciences | 1 | 0.3% |
| Psychology | 0 | 0.0% |
| Social Sciences | 23 | 7.6% |
| Engineering | 20 | 6.6% |
| Multidisciplinary Studies | 0 | 0.0% |
| Science & Technology | 28 | 9.3% |
| Business | 69 | 22.9% |
| Education | 81 | 26.8% |
| Literature & Languages | 0 | 0.0% |
| Liberal Arts & History | 8 | 2.6% |
| Visual & Performing Arts | 0 | 0.0% |
| Communications | 4 | 1.3% |
| Arts & Humanities | 23 | 7.6% |
| Total | 302 | 100.0% |
Transportation & Commute in Oliver County
Vehicle Availability by Sex in Oliver County
The most prevalent vehicle ownership categories in Oliver County are males with 3 vehicles (121, accounting for 28.5%) and females with 3 vehicles (98, making up 34.6%).

| Vehicles Available | Male | Female |
| No Vehicle | 8 (1.9%) | 10 (2.9%) |
| 1 Vehicle | 10 (2.4%) | 9 (2.6%) |
| 2 Vehicles | 98 (23.1%) | 106 (30.3%) |
| 3 Vehicles | 121 (28.5%) | 98 (28.0%) |
| 4 Vehicles | 110 (25.9%) | 52 (14.9%) |
| 5 or more Vehicles | 78 (18.3%) | 75 (21.4%) |
| Total | 425 (100.0%) | 350 (100.0%) |
Commute Time in Oliver County
The most frequently occuring commute durations in Oliver County are 5 to 9 minutes (127 commuters, 18.9%), 15 to 19 minutes (112 commuters, 16.7%), and 20 to 24 minutes (82 commuters, 12.2%).

| Commute Time | # Commuters | % Commuters |
| Less than 5 Minutes | 46 | 6.9% |
| 5 to 9 Minutes | 127 | 18.9% |
| 10 to 14 Minutes | 37 | 5.5% |
| 15 to 19 Minutes | 112 | 16.7% |
| 20 to 24 Minutes | 82 | 12.2% |
| 25 to 29 Minutes | 50 | 7.4% |
| 30 to 34 Minutes | 54 | 8.0% |
| 35 to 39 Minutes | 25 | 3.7% |
| 40 to 44 Minutes | 43 | 6.4% |
| 45 to 59 Minutes | 54 | 8.0% |
| 60 to 89 Minutes | 32 | 4.8% |
| 90 or more Minutes | 10 | 1.5% |
Commute Time by Sex in Oliver County
The most common commute times in Oliver County are 5 to 9 minutes (60 commuters, 17.1%) for males and 5 to 9 minutes (67 commuters, 20.9%) for females.

| Commute Time | Male | Female |
| Less than 5 Minutes | 33 (9.4%) | 13 (4.1%) |
| 5 to 9 Minutes | 60 (17.1%) | 67 (20.9%) |
| 10 to 14 Minutes | 17 (4.8%) | 20 (6.2%) |
| 15 to 19 Minutes | 53 (15.1%) | 59 (18.4%) |
| 20 to 24 Minutes | 37 (10.5%) | 45 (14.0%) |
| 25 to 29 Minutes | 50 (14.2%) | 0 (0.0%) |
| 30 to 34 Minutes | 42 (12.0%) | 12 (3.7%) |
| 35 to 39 Minutes | 10 (2.9%) | 15 (4.7%) |
| 40 to 44 Minutes | 15 (4.3%) | 28 (8.7%) |
| 45 to 59 Minutes | 21 (6.0%) | 33 (10.3%) |
| 60 to 89 Minutes | 6 (1.7%) | 26 (8.1%) |
| 90 or more Minutes | 7 (2.0%) | 3 (0.9%) |
Time of Departure to Work by Sex in Oliver County
The most frequent times of departure to work in Oliver County are 6:00 AM to 6:29 AM (75, 21.4%) for males and 6:00 AM to 6:29 AM (83, 25.9%) for females.
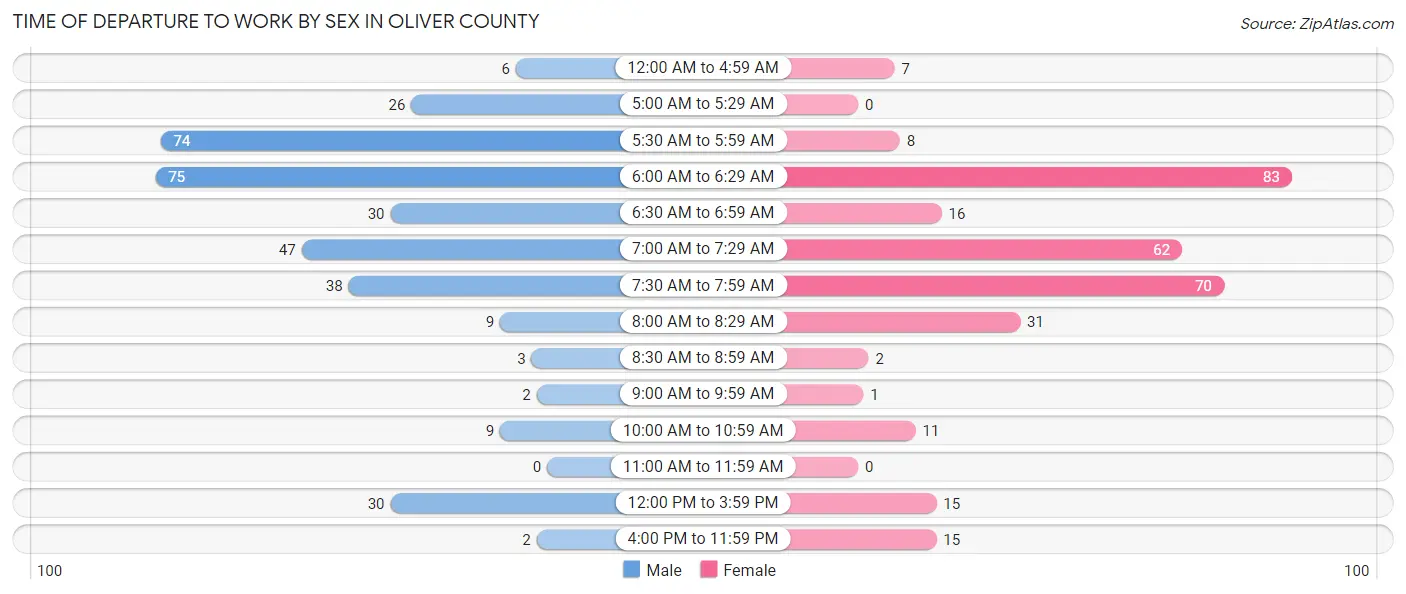
| Time of Departure | Male | Female |
| 12:00 AM to 4:59 AM | 6 (1.7%) | 7 (2.2%) |
| 5:00 AM to 5:29 AM | 26 (7.4%) | 0 (0.0%) |
| 5:30 AM to 5:59 AM | 74 (21.1%) | 8 (2.5%) |
| 6:00 AM to 6:29 AM | 75 (21.4%) | 83 (25.9%) |
| 6:30 AM to 6:59 AM | 30 (8.6%) | 16 (5.0%) |
| 7:00 AM to 7:29 AM | 47 (13.4%) | 62 (19.3%) |
| 7:30 AM to 7:59 AM | 38 (10.8%) | 70 (21.8%) |
| 8:00 AM to 8:29 AM | 9 (2.6%) | 31 (9.7%) |
| 8:30 AM to 8:59 AM | 3 (0.9%) | 2 (0.6%) |
| 9:00 AM to 9:59 AM | 2 (0.6%) | 1 (0.3%) |
| 10:00 AM to 10:59 AM | 9 (2.6%) | 11 (3.4%) |
| 11:00 AM to 11:59 AM | 0 (0.0%) | 0 (0.0%) |
| 12:00 PM to 3:59 PM | 30 (8.6%) | 15 (4.7%) |
| 4:00 PM to 11:59 PM | 2 (0.6%) | 15 (4.7%) |
| Total | 351 (100.0%) | 321 (100.0%) |
Housing Occupancy in Oliver County
Occupancy by Ownership in Oliver County
Of the total 698 dwellings in Oliver County, owner-occupied units account for 610 (87.4%), while renter-occupied units make up 88 (12.6%).
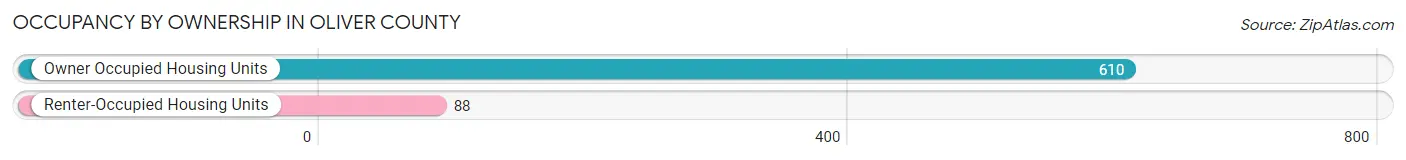
| Occupancy | # Housing Units | % Housing Units |
| Owner Occupied Housing Units | 610 | 87.4% |
| Renter-Occupied Housing Units | 88 | 12.6% |
| Total Occupied Housing Units | 698 | 100.0% |
Occupancy by Household Size in Oliver County

| Household Size | # Housing Units | % Housing Units |
| 1-Person Household | 122 | 17.5% |
| 2-Person Household | 354 | 50.7% |
| 3-Person Household | 81 | 11.6% |
| 4+ Person Household | 141 | 20.2% |
| Total Housing Units | 698 | 100.0% |
Occupancy by Ownership by Household Size in Oliver County

| Household Size | Owner-occupied | Renter-occupied |
| 1-Person Household | 77 (63.1%) | 45 (36.9%) |
| 2-Person Household | 350 (98.9%) | 4 (1.1%) |
| 3-Person Household | 65 (80.2%) | 16 (19.8%) |
| 4+ Person Household | 118 (83.7%) | 23 (16.3%) |
| Total Housing Units | 610 (87.4%) | 88 (12.6%) |
Occupancy by Educational Attainment in Oliver County

| Household Size | Owner-occupied | Renter-occupied |
| Less than High School | 31 (73.8%) | 11 (26.2%) |
| High School Diploma | 175 (92.6%) | 14 (7.4%) |
| College/Associate Degree | 264 (84.6%) | 48 (15.4%) |
| Bachelor's Degree or higher | 140 (90.3%) | 15 (9.7%) |
Occupancy by Age of Householder in Oliver County

| Age Bracket | # Households | % Households |
| Under 35 Years | 89 | 12.8% |
| 35 to 44 Years | 92 | 13.2% |
| 45 to 54 Years | 105 | 15.0% |
| 55 to 64 Years | 138 | 19.8% |
| 65 to 74 Years | 166 | 23.8% |
| 75 to 84 Years | 91 | 13.0% |
| 85 Years and Over | 17 | 2.4% |
| Total | 698 | 100.0% |
Housing Finances in Oliver County
Median Income by Occupancy in Oliver County

| Occupancy Type | # Households | Median Income |
| Owner-Occupied | 610 (87.4%) | $81,429 |
| Renter-Occupied | 88 (12.6%) | $55,625 |
| Average | 698 (100.0%) | $69,722 |
Occupancy by Householder Income Bracket in Oliver County

| Income Bracket | Owner-occupied | Renter-occupied |
| Less than $5,000 | 8 (1.3%) | 7 (8.0%) |
| $5,000 to $9,999 | 6 (1.0%) | 4 (4.5%) |
| $10,000 to $14,999 | 6 (1.0%) | 0 (0.0%) |
| $15,000 to $19,999 | 2 (0.3%) | 5 (5.7%) |
| $20,000 to $24,999 | 20 (3.3%) | 18 (20.4%) |
| $25,000 to $34,999 | 50 (8.2%) | 0 (0.0%) |
| $35,000 to $49,999 | 76 (12.5%) | 3 (3.4%) |
| $50,000 to $74,999 | 121 (19.8%) | 34 (38.6%) |
| $75,000 to $99,999 | 66 (10.8%) | 0 (0.0%) |
| $100,000 to $149,999 | 125 (20.5%) | 15 (17.1%) |
| $150,000 or more | 130 (21.3%) | 2 (2.3%) |
| Total | 610 (100.0%) | 88 (100.0%) |
Monthly Housing Cost Tiers in Oliver County

| Monthly Cost | Owner-occupied | Renter-occupied |
| Less than $300 | 29 (4.8%) | 0 (0.0%) |
| $300 to $499 | 97 (15.9%) | 11 (12.5%) |
| $500 to $799 | 200 (32.8%) | 21 (23.9%) |
| $800 to $999 | 63 (10.3%) | 2 (2.3%) |
| $1,000 to $1,499 | 65 (10.7%) | 4 (4.5%) |
| $1,500 to $1,999 | 91 (14.9%) | 0 (0.0%) |
| $2,000 to $2,499 | 30 (4.9%) | 0 (0.0%) |
| $2,500 to $2,999 | 26 (4.3%) | 0 (0.0%) |
| $3,000 or more | 9 (1.5%) | 0 (0.0%) |
| Total | 610 (100.0%) | 88 (100.0%) |
Physical Housing Characteristics in Oliver County
Housing Structures in Oliver County

| Structure Type | # Housing Units | % Housing Units |
| Single Unit, Detached | 607 | 87.0% |
| Single Unit, Attached | 3 | 0.4% |
| 2 Unit Apartments | 10 | 1.4% |
| 3 or 4 Unit Apartments | 10 | 1.4% |
| 5 to 9 Unit Apartments | 0 | 0.0% |
| 10 or more Apartments | 0 | 0.0% |
| Mobile Home / Other | 68 | 9.7% |
| Total | 698 | 100.0% |
Housing Structures by Occupancy in Oliver County

| Structure Type | Owner-occupied | Renter-occupied |
| Single Unit, Detached | 544 (89.6%) | 63 (10.4%) |
| Single Unit, Attached | 3 (100.0%) | 0 (0.0%) |
| 2 Unit Apartments | 0 (0.0%) | 10 (100.0%) |
| 3 or 4 Unit Apartments | 0 (0.0%) | 10 (100.0%) |
| 5 to 9 Unit Apartments | 0 (0.0%) | 0 (0.0%) |
| 10 or more Apartments | 0 (0.0%) | 0 (0.0%) |
| Mobile Home / Other | 63 (92.6%) | 5 (7.3%) |
| Total | 610 (87.4%) | 88 (12.6%) |
Housing Structures by Number of Rooms in Oliver County

| Number of Rooms | Owner-occupied | Renter-occupied |
| 1 Room | 0 (0.0%) | 7 (8.0%) |
| 2 or 3 Rooms | 7 (1.1%) | 0 (0.0%) |
| 4 or 5 Rooms | 62 (10.2%) | 25 (28.4%) |
| 6 or 7 Rooms | 268 (43.9%) | 12 (13.6%) |
| 8 or more Rooms | 273 (44.8%) | 44 (50.0%) |
| Total | 610 (100.0%) | 88 (100.0%) |
Housing Structure by Heating Type in Oliver County

| Heating Type | Owner-occupied | Renter-occupied |
| Utility Gas | 44 (7.2%) | 0 (0.0%) |
| Bottled, Tank, or LP Gas | 384 (62.9%) | 40 (45.5%) |
| Electricity | 110 (18.0%) | 35 (39.8%) |
| Fuel Oil or Kerosene | 2 (0.3%) | 0 (0.0%) |
| Coal or Coke | 58 (9.5%) | 0 (0.0%) |
| All other Fuels | 12 (2.0%) | 13 (14.8%) |
| No Fuel Used | 0 (0.0%) | 0 (0.0%) |
| Total | 610 (100.0%) | 88 (100.0%) |
Household Vehicle Usage in Oliver County

| Vehicles per Household | Owner-occupied | Renter-occupied |
| No Vehicle | 22 (3.6%) | 7 (8.0%) |
| 1 Vehicle | 23 (3.8%) | 26 (29.5%) |
| 2 Vehicles | 218 (35.7%) | 7 (8.0%) |
| 3 or more Vehicles | 347 (56.9%) | 48 (54.5%) |
| Total | 610 (100.0%) | 88 (100.0%) |
Real Estate & Mortgages in Oliver County
Real Estate and Mortgage Overview in Oliver County
| Characteristic | Without Mortgage | With Mortgage |
| Housing Units | 380 | 230 |
| Median Property Value | $214,100 | $244,600 |
| Median Household Income | $62,304 | $65 |
| Monthly Housing Costs | $604 | $9 |
| Real Estate Taxes | $1,253 | $6 |
Property Value by Mortgage Status in Oliver County
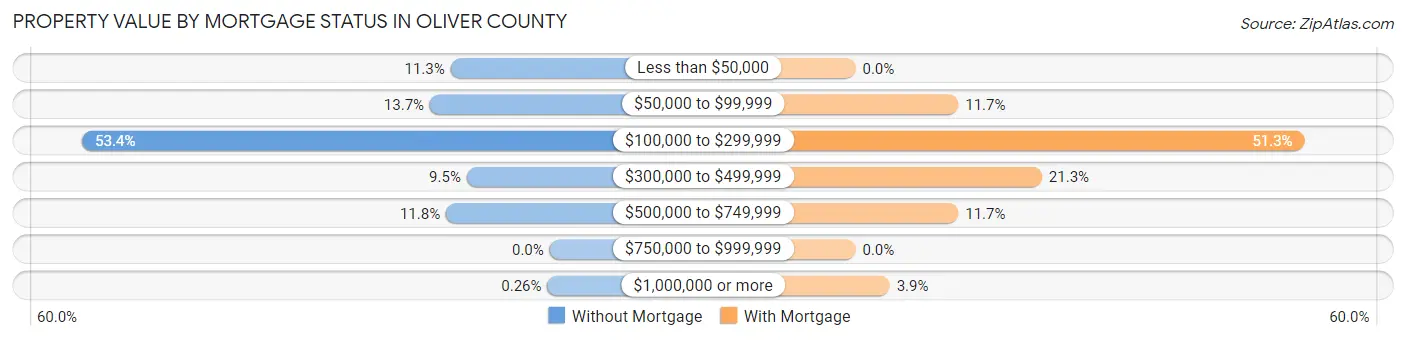
| Property Value | Without Mortgage | With Mortgage |
| Less than $50,000 | 43 (11.3%) | 0 (0.0%) |
| $50,000 to $99,999 | 52 (13.7%) | 27 (11.7%) |
| $100,000 to $299,999 | 203 (53.4%) | 118 (51.3%) |
| $300,000 to $499,999 | 36 (9.5%) | 49 (21.3%) |
| $500,000 to $749,999 | 45 (11.8%) | 27 (11.7%) |
| $750,000 to $999,999 | 0 (0.0%) | 0 (0.0%) |
| $1,000,000 or more | 1 (0.3%) | 9 (3.9%) |
| Total | 380 (100.0%) | 230 (100.0%) |
Household Income by Mortgage Status in Oliver County
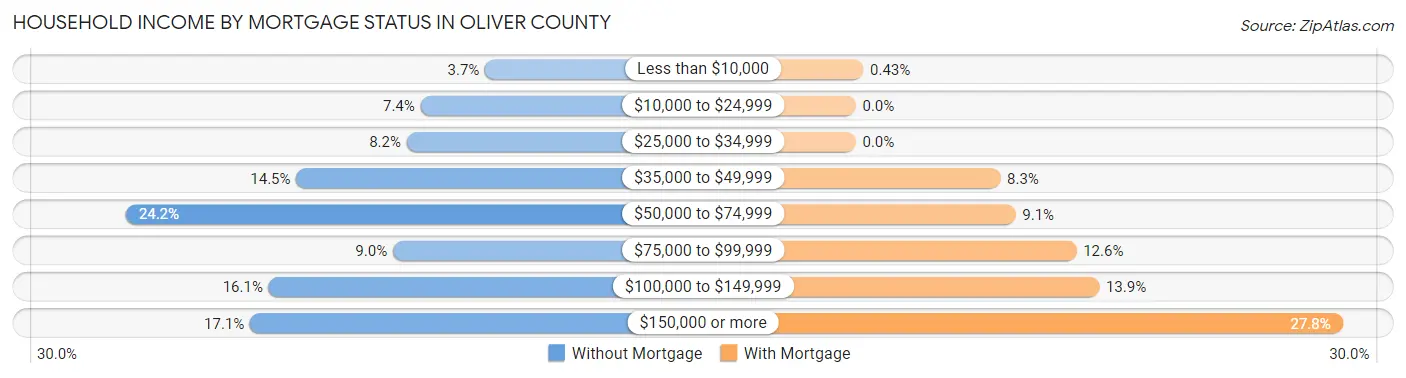
| Household Income | Without Mortgage | With Mortgage |
| Less than $10,000 | 14 (3.7%) | 1 (0.4%) |
| $10,000 to $24,999 | 28 (7.4%) | 0 (0.0%) |
| $25,000 to $34,999 | 31 (8.2%) | 0 (0.0%) |
| $35,000 to $49,999 | 55 (14.5%) | 19 (8.3%) |
| $50,000 to $74,999 | 92 (24.2%) | 21 (9.1%) |
| $75,000 to $99,999 | 34 (8.9%) | 29 (12.6%) |
| $100,000 to $149,999 | 61 (16.1%) | 32 (13.9%) |
| $150,000 or more | 65 (17.1%) | 64 (27.8%) |
| Total | 380 (100.0%) | 230 (100.0%) |
Property Value to Household Income Ratio in Oliver County

| Value-to-Income Ratio | Without Mortgage | With Mortgage |
| Less than 2.0x | 125 (32.9%) | 110,833 (48,188.3%) |
| 2.0x to 2.9x | 59 (15.5%) | 112 (48.7%) |
| 3.0x to 3.9x | 43 (11.3%) | 51 (22.2%) |
| 4.0x or more | 150 (39.5%) | 21 (9.1%) |
| Total | 380 (100.0%) | 230 (100.0%) |
Real Estate Taxes by Mortgage Status in Oliver County

| Property Taxes | Without Mortgage | With Mortgage |
| Less than $800 | 95 (25.0%) | 0 (0.0%) |
| $800 to $1,499 | 122 (32.1%) | 32 (13.9%) |
| $800 to $1,499 | 123 (32.4%) | 84 (36.5%) |
| Total | 380 (100.0%) | 230 (100.0%) |
Health & Disability in Oliver County
Health Insurance Coverage by Age in Oliver County

| Age Bracket | With Coverage | Without Coverage |
| Under 6 Years | 153 (100.0%) | 0 (0.0%) |
| 6 to 18 Years | 335 (97.7%) | 8 (2.3%) |
| 19 to 25 Years | 51 (100.0%) | 0 (0.0%) |
| 26 to 34 Years | 143 (94.1%) | 9 (5.9%) |
| 35 to 44 Years | 169 (100.0%) | 0 (0.0%) |
| 45 to 54 Years | 159 (82.4%) | 34 (17.6%) |
| 55 to 64 Years | 283 (90.4%) | 30 (9.6%) |
| 65 to 74 Years | 259 (100.0%) | 0 (0.0%) |
| 75 Years and older | 199 (100.0%) | 0 (0.0%) |
| Total | 1,751 (95.6%) | 81 (4.4%) |
Health Insurance Coverage by Citizenship Status in Oliver County

| Citizenship Status | With Coverage | Without Coverage |
| Native Born | 153 (100.0%) | 0 (0.0%) |
| Foreign Born, Citizen | 335 (97.7%) | 8 (2.3%) |
| Foreign Born, not a Citizen | 51 (100.0%) | 0 (0.0%) |
Health Insurance Coverage by Household Income in Oliver County
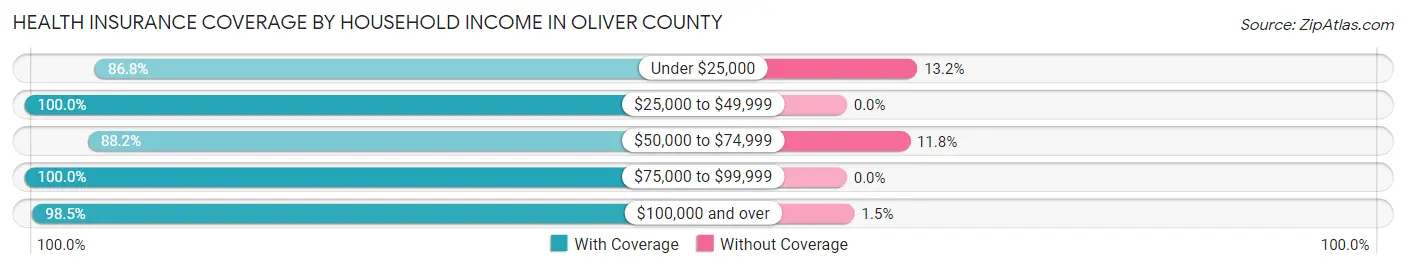
| Household Income | With Coverage | Without Coverage |
| Under $25,000 | 217 (86.8%) | 33 (13.2%) |
| $25,000 to $49,999 | 258 (100.0%) | 0 (0.0%) |
| $50,000 to $74,999 | 268 (88.2%) | 36 (11.8%) |
| $75,000 to $99,999 | 205 (100.0%) | 0 (0.0%) |
| $100,000 and over | 802 (98.5%) | 12 (1.5%) |
Public vs Private Health Insurance Coverage by Age in Oliver County

| Age Bracket | Public Insurance | Private Insurance |
| Under 6 | 29 (19.0%) | 139 (90.8%) |
| 6 to 18 Years | 81 (23.6%) | 274 (79.9%) |
| 19 to 25 Years | 5 (9.8%) | 46 (90.2%) |
| 25 to 34 Years | 12 (7.9%) | 137 (90.1%) |
| 35 to 44 Years | 31 (18.3%) | 153 (90.5%) |
| 45 to 54 Years | 22 (11.4%) | 155 (80.3%) |
| 55 to 64 Years | 38 (12.1%) | 268 (85.6%) |
| 65 to 74 Years | 253 (97.7%) | 160 (61.8%) |
| 75 Years and over | 196 (98.5%) | 131 (65.8%) |
| Total | 667 (36.4%) | 1,463 (79.9%) |
Disability Status by Sex by Age in Oliver County

| Age Bracket | Male | Female |
| Under 5 Years | 0 (0.0%) | 0 (0.0%) |
| 5 to 17 Years | 0 (0.0%) | 0 (0.0%) |
| 18 to 34 Years | 0 (0.0%) | 0 (0.0%) |
| 35 to 64 Years | 26 (7.3%) | 18 (5.7%) |
| 65 to 74 Years | 9 (5.7%) | 6 (6.0%) |
| 75 Years and over | 62 (66.7%) | 68 (64.1%) |
Disability Class by Sex by Age in Oliver County
Disability Class: Hearing Difficulty

| Age Bracket | Male | Female |
| Under 5 Years | 0 (0.0%) | 0 (0.0%) |
| 5 to 17 Years | 0 (0.0%) | 0 (0.0%) |
| 18 to 34 Years | 0 (0.0%) | 0 (0.0%) |
| 35 to 64 Years | 7 (2.0%) | 2 (0.6%) |
| 65 to 74 Years | 9 (5.7%) | 1 (1.0%) |
| 75 Years and over | 40 (43.0%) | 24 (22.6%) |
Disability Class: Vision Difficulty

| Age Bracket | Male | Female |
| Under 5 Years | 0 (0.0%) | 0 (0.0%) |
| 5 to 17 Years | 0 (0.0%) | 0 (0.0%) |
| 18 to 34 Years | 0 (0.0%) | 0 (0.0%) |
| 35 to 64 Years | 5 (1.4%) | 0 (0.0%) |
| 65 to 74 Years | 0 (0.0%) | 0 (0.0%) |
| 75 Years and over | 29 (31.2%) | 21 (19.8%) |
Disability Class: Cognitive Difficulty

| Age Bracket | Male | Female |
| 5 to 17 Years | 0 (0.0%) | 0 (0.0%) |
| 18 to 34 Years | 0 (0.0%) | 0 (0.0%) |
| 35 to 64 Years | 3 (0.8%) | 8 (2.5%) |
| 65 to 74 Years | 0 (0.0%) | 0 (0.0%) |
| 75 Years and over | 15 (16.1%) | 16 (15.1%) |
Disability Class: Ambulatory Difficulty

| Age Bracket | Male | Female |
| 5 to 17 Years | 0 (0.0%) | 0 (0.0%) |
| 18 to 34 Years | 0 (0.0%) | 0 (0.0%) |
| 35 to 64 Years | 17 (4.8%) | 16 (5.0%) |
| 65 to 74 Years | 0 (0.0%) | 5 (5.0%) |
| 75 Years and over | 36 (38.7%) | 16 (15.1%) |
Disability Class: Self-Care Difficulty

| Age Bracket | Male | Female |
| 5 to 17 Years | 0 (0.0%) | 0 (0.0%) |
| 18 to 34 Years | 0 (0.0%) | 0 (0.0%) |
| 35 to 64 Years | 9 (2.5%) | 3 (0.9%) |
| 65 to 74 Years | 0 (0.0%) | 2 (2.0%) |
| 75 Years and over | 0 (0.0%) | 12 (11.3%) |
Technology Access in Oliver County
Computing Device Access in Oliver County
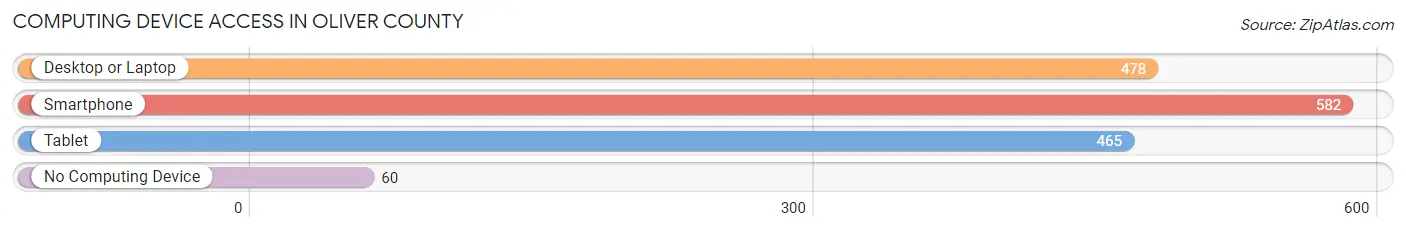
| Device Type | # Households | % Households |
| Desktop or Laptop | 478 | 68.5% |
| Smartphone | 582 | 83.4% |
| Tablet | 465 | 66.6% |
| No Computing Device | 60 | 8.6% |
| Total | 698 | 100.0% |
Internet Access in Oliver County

| Internet Type | # Households | % Households |
| Dial-Up Internet | 5 | 0.7% |
| Broadband Home | 503 | 72.1% |
| Cellular Data Only | 37 | 5.3% |
| Satellite Internet | 109 | 15.6% |
| No Internet | 127 | 18.2% |
| Total | 698 | 100.0% |
Oliver County Summary
Oliver County is located in the western part of North Dakota, in the United States. It is bordered by McKenzie County to the north, Mountrail County to the east, Williams County to the south, and Montana to the west. The county seat is Center, and the largest city is Watford City. The county was created in 1885 and named after Oliver Kelley, a founder of the National Grange.
Geography
Oliver County covers an area of 1,845 square miles, making it the fourth-largest county in North Dakota. The terrain is mostly flat, with rolling hills in the east and south. The Little Missouri River flows through the county, and there are several small lakes and ponds. The county is part of the Great Plains region, and the climate is semi-arid, with cold winters and hot summers.
Demographics
As of the 2010 census, there were 3,541 people living in Oliver County. The population density was 2 people per square mile. The racial makeup of the county was 94.3% White, 0.3% African American, 2.3% Native American, 0.3% Asian, 0.1% Pacific Islander, 0.7% from other races, and 2.0% from two or more races. Hispanic or Latino of any race were 2.2% of the population.
The median income for a household in the county was $45,938, and the median income for a family was $51,944. The per capita income for the county was $20,945. About 11.2% of families and 14.2% of the population were below the poverty line, including 17.2% of those under age 18 and 11.2% of those age 65 or over.
Economy
Agriculture is the main economic activity in Oliver County. The county is home to several large farms, and the main crops are wheat, barley, oats, and hay. Livestock production is also important, and the county is home to several large cattle ranches.
Oil and gas production is also an important part of the economy. The county is home to several large oil and gas fields, and the industry provides jobs for many of the county's residents.
The county is also home to several small businesses, including restaurants, retail stores, and service providers. Tourism is also an important part of the economy, and the county is home to several popular attractions, including the Theodore Roosevelt National Park and the Little Missouri National Grassland.
Conclusion
Oliver County is a rural county in western North Dakota. It is home to several large farms and ranches, as well as several large oil and gas fields. The county is also home to several small businesses, and tourism is an important part of the economy. The county has a population of 3,541, and the median income for a household is $45,938.
Common Questions
What is the Total Population of Oliver County?
Total Population of Oliver County is 1,832.
What is the Total Male Population of Oliver County?
Total Male Population of Oliver County is 973.
What is the Total Female Population of Oliver County?
Total Female Population of Oliver County is 859.
What is the Ratio of Males per 100 Females in Oliver County?
There are 113.27 Males per 100 Females in Oliver County.
What is the Ratio of Females per 100 Males in Oliver County?
There are 88.28 Females per 100 Males in Oliver County.
What is the Median Population Age in Oliver County?
Median Population Age in Oliver County is 48.1 Years.
What is the Average Family Size in Oliver County
Average Family Size in Oliver County is 3.0 People.
What is the Average Household Size in Oliver County
Average Household Size in Oliver County is 2.6 People.
What is Per Capita Income in Oliver County?
Per Capita income in Oliver County is $36,532.
What is the Median Family Income in Oliver County?
Median Family Income in Oliver County is $82,321.
What is the Median Household income in Oliver County?
Median Household Income in Oliver County is $69,722.
What is Income or Wage Gap in Oliver County?
Income or Wage Gap in Oliver County is 35.2%.
Women in Oliver County earn 64.8 cents for every dollar earned by a man.
What is Inequality or Gini Index in Oliver County?
Inequality or Gini Index in Oliver County is 0.38.
How Large is the Labor Force in Oliver County?
There are 802 People in the Labor Forcein in Oliver County.
What is the Percentage of People in the Labor Force in Oliver County?
57.6% of People are in the Labor Force in Oliver County.
What is the Unemployment Rate in Oliver County?
Unemployment Rate in Oliver County is 2.9%.