Mountrail County, ND
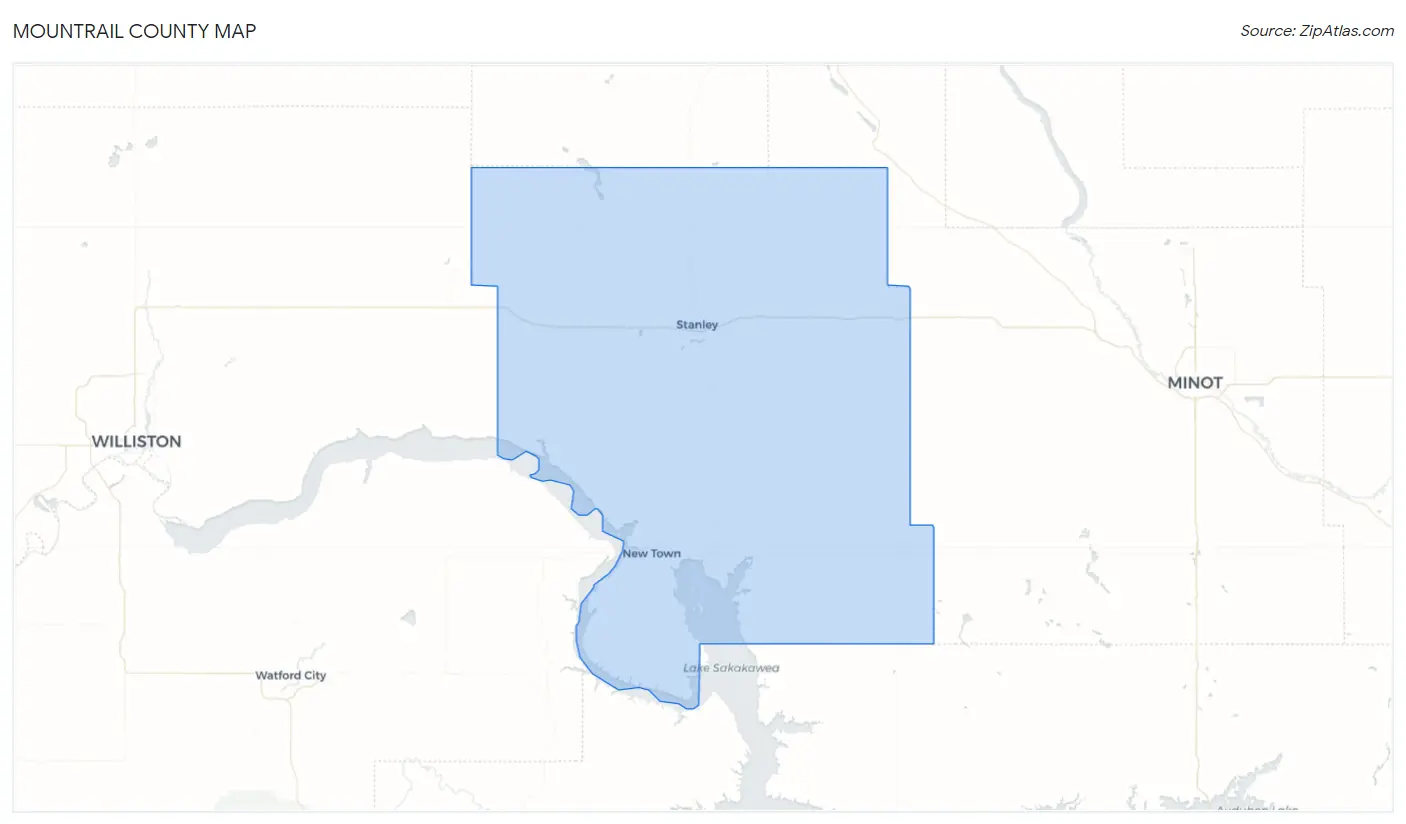
Mountrail County Map
Mountrail County Overview
9,648
TOTAL POPULATION
5,066
MALE POPULATION
4,582
FEMALE POPULATION
110.56
MALES / 100 FEMALES
90.45
FEMALES / 100 MALES
34.7
MEDIAN AGE
3.5
AVG FAMILY SIZE
2.7
AVG HOUSEHOLD SIZE
$39,603
PER CAPITA INCOME
$96,833
AVG FAMILY INCOME
$81,886
AVG HOUSEHOLD INCOME
40.0%
WAGE / INCOME GAP [ % ]
60.0¢/ $1
WAGE / INCOME GAP [ $ ]
$12,271
FAMILY INCOME DEFICIT
0.45
INEQUALITY / GINI INDEX
4,555
LABOR FORCE [ PEOPLE ]
63.4%
PERCENT IN LABOR FORCE
3.5%
UNEMPLOYMENT RATE
Mountrail County Area Codes
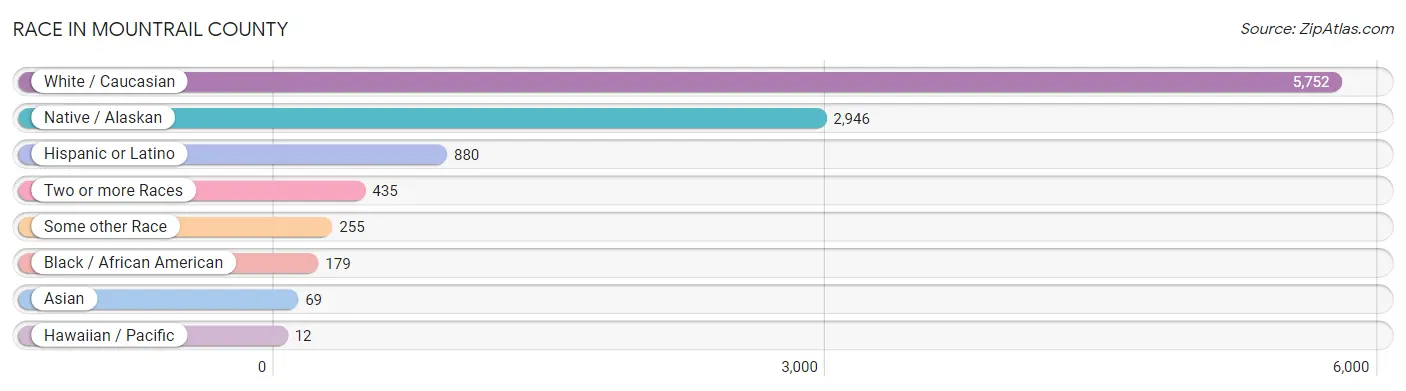
Race in Mountrail County
The most populous races in Mountrail County are White / Caucasian (5,752 | 59.6%), Native / Alaskan (2,946 | 30.5%), and Hispanic or Latino (880 | 9.1%).
| Race | # Population | % Population |
| Asian | 69 | 0.7% |
| Black / African American | 179 | 1.9% |
| Hawaiian / Pacific | 12 | 0.1% |
| Hispanic or Latino | 880 | 9.1% |
| Native / Alaskan | 2,946 | 30.5% |
| White / Caucasian | 5,752 | 59.6% |
| Two or more Races | 435 | 4.5% |
| Some other Race | 255 | 2.6% |
| Total | 9,648 | 100.0% |
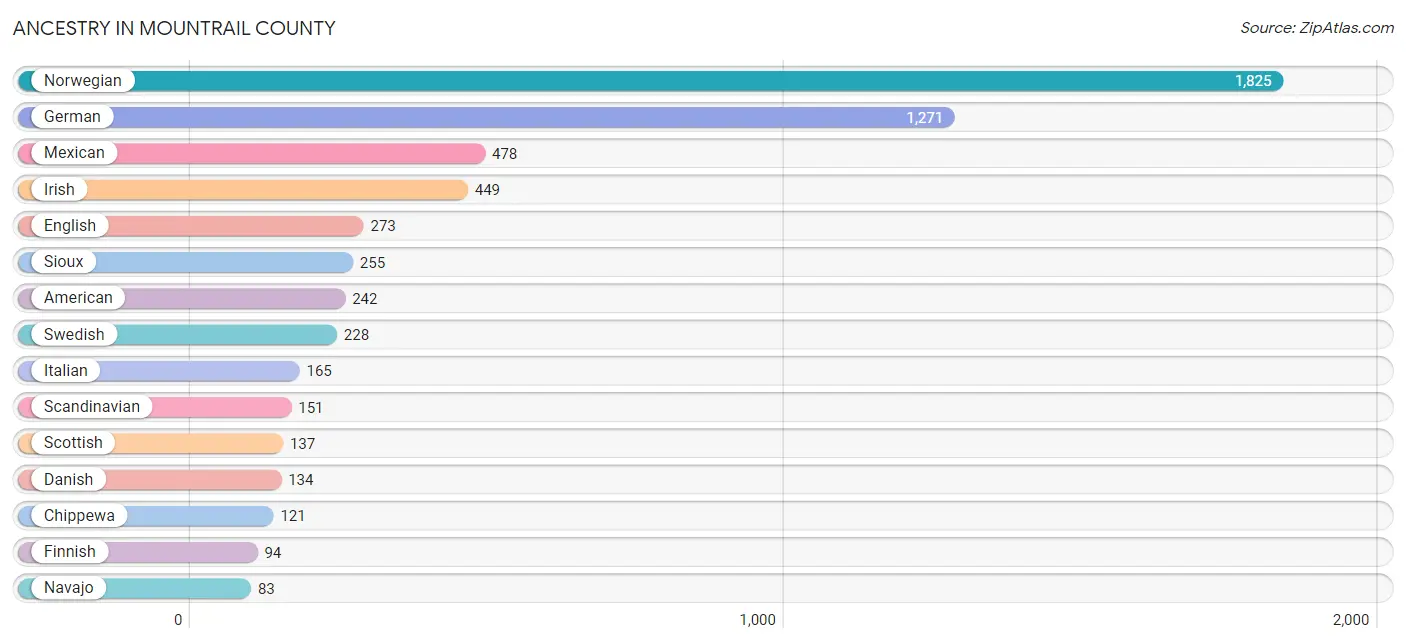
Ancestry in Mountrail County
The most populous ancestries reported in Mountrail County are Norwegian (1,825 | 18.9%), German (1,271 | 13.2%), Mexican (478 | 5.0%), Irish (449 | 4.6%), and English (273 | 2.8%), together accounting for 44.5% of all Mountrail County residents.
| Ancestry | # Population | % Population |
| African | 14 | 0.2% |
| American | 242 | 2.5% |
| Austrian | 4 | 0.0% |
| Bahamian | 11 | 0.1% |
| Belgian | 13 | 0.1% |
| Burmese | 20 | 0.2% |
| Canadian | 27 | 0.3% |
| Central American | 82 | 0.9% |
| Cheyenne | 47 | 0.5% |
| Chickasaw | 16 | 0.2% |
| Chippewa | 121 | 1.3% |
| Choctaw | 23 | 0.2% |
| Colombian | 13 | 0.1% |
| Cuban | 51 | 0.5% |
| Czech | 80 | 0.8% |
| Czechoslovakian | 4 | 0.0% |
| Danish | 134 | 1.4% |
| Dutch | 39 | 0.4% |
| Eastern European | 5 | 0.1% |
| English | 273 | 2.8% |
| European | 50 | 0.5% |
| Finnish | 94 | 1.0% |
| French | 27 | 0.3% |
| French Canadian | 26 | 0.3% |
| German | 1,271 | 13.2% |
| German Russian | 17 | 0.2% |
| Guamanian / Chamorro | 12 | 0.1% |
| Guatemalan | 67 | 0.7% |
| Haitian | 14 | 0.2% |
| Hopi | 16 | 0.2% |
| Hungarian | 2 | 0.0% |
| Icelander | 3 | 0.0% |
| Irish | 449 | 4.6% |
| Italian | 165 | 1.7% |
| Korean | 61 | 0.6% |
| Mexican | 478 | 5.0% |
| Navajo | 83 | 0.9% |
| Northern European | 40 | 0.4% |
| Norwegian | 1,825 | 18.9% |
| Pakistani | 13 | 0.1% |
| Polish | 33 | 0.3% |
| Portuguese | 4 | 0.0% |
| Puerto Rican | 43 | 0.4% |
| Puget Sound Salish | 11 | 0.1% |
| Russian | 39 | 0.4% |
| Salvadoran | 15 | 0.2% |
| Scandinavian | 151 | 1.6% |
| Scotch-Irish | 54 | 0.6% |
| Scottish | 137 | 1.4% |
| Seminole | 9 | 0.1% |
| Shoshone | 13 | 0.1% |
| Sioux | 255 | 2.6% |
| South American | 13 | 0.1% |
| Spaniard | 1 | 0.0% |
| Subsaharan African | 14 | 0.2% |
| Swedish | 228 | 2.4% |
| Swiss | 39 | 0.4% |
| Ukrainian | 6 | 0.1% |
| Welsh | 23 | 0.2% |
| Yuman | 4 | 0.0% | View All 60 Rows |
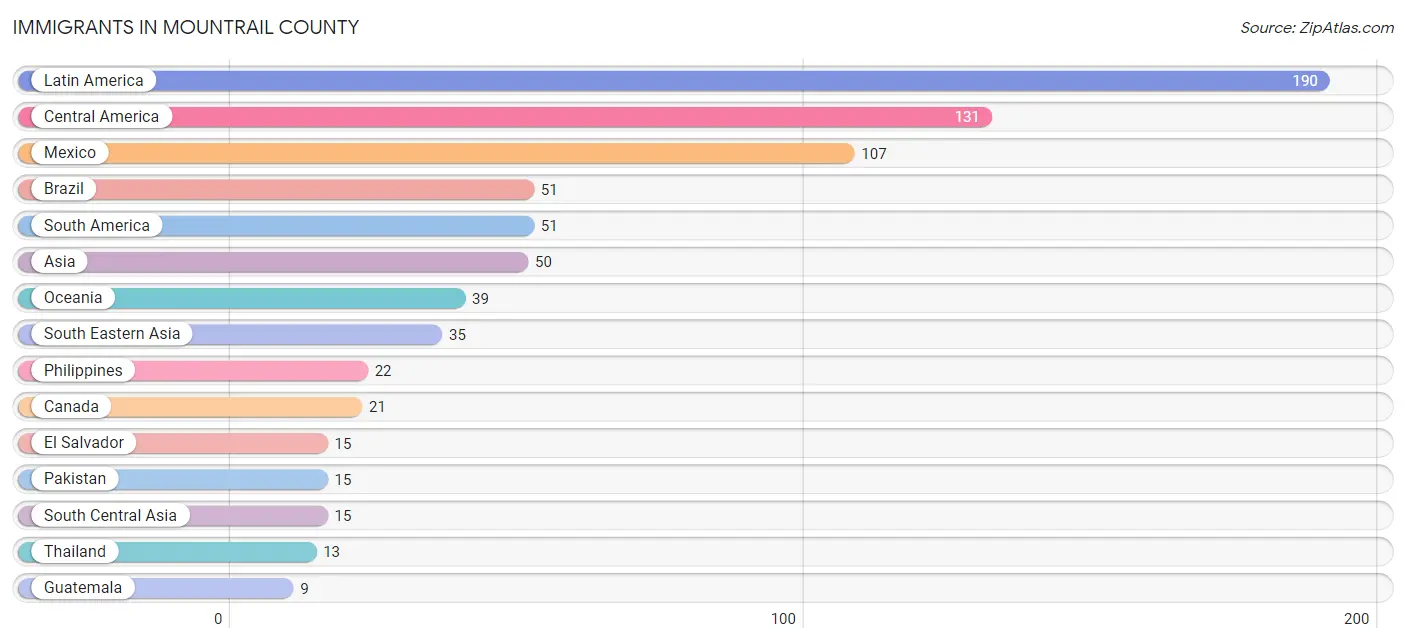
Immigrants in Mountrail County
The most numerous immigrant groups reported in Mountrail County came from Latin America (190 | 2.0%), Central America (131 | 1.4%), Mexico (107 | 1.1%), Brazil (51 | 0.5%), and South America (51 | 0.5%), together accounting for 5.5% of all Mountrail County residents.
| Immigration Origin | # Population | % Population |
| Africa | 3 | 0.0% |
| Asia | 50 | 0.5% |
| Brazil | 51 | 0.5% |
| Canada | 21 | 0.2% |
| Caribbean | 8 | 0.1% |
| Central America | 131 | 1.4% |
| El Salvador | 15 | 0.2% |
| Guatemala | 9 | 0.1% |
| Haiti | 8 | 0.1% |
| Latin America | 190 | 2.0% |
| Mexico | 107 | 1.1% |
| Oceania | 39 | 0.4% |
| Pakistan | 15 | 0.2% |
| Philippines | 22 | 0.2% |
| South Africa | 3 | 0.0% |
| South America | 51 | 0.5% |
| South Central Asia | 15 | 0.2% |
| South Eastern Asia | 35 | 0.4% |
| Thailand | 13 | 0.1% | View All 19 Rows |
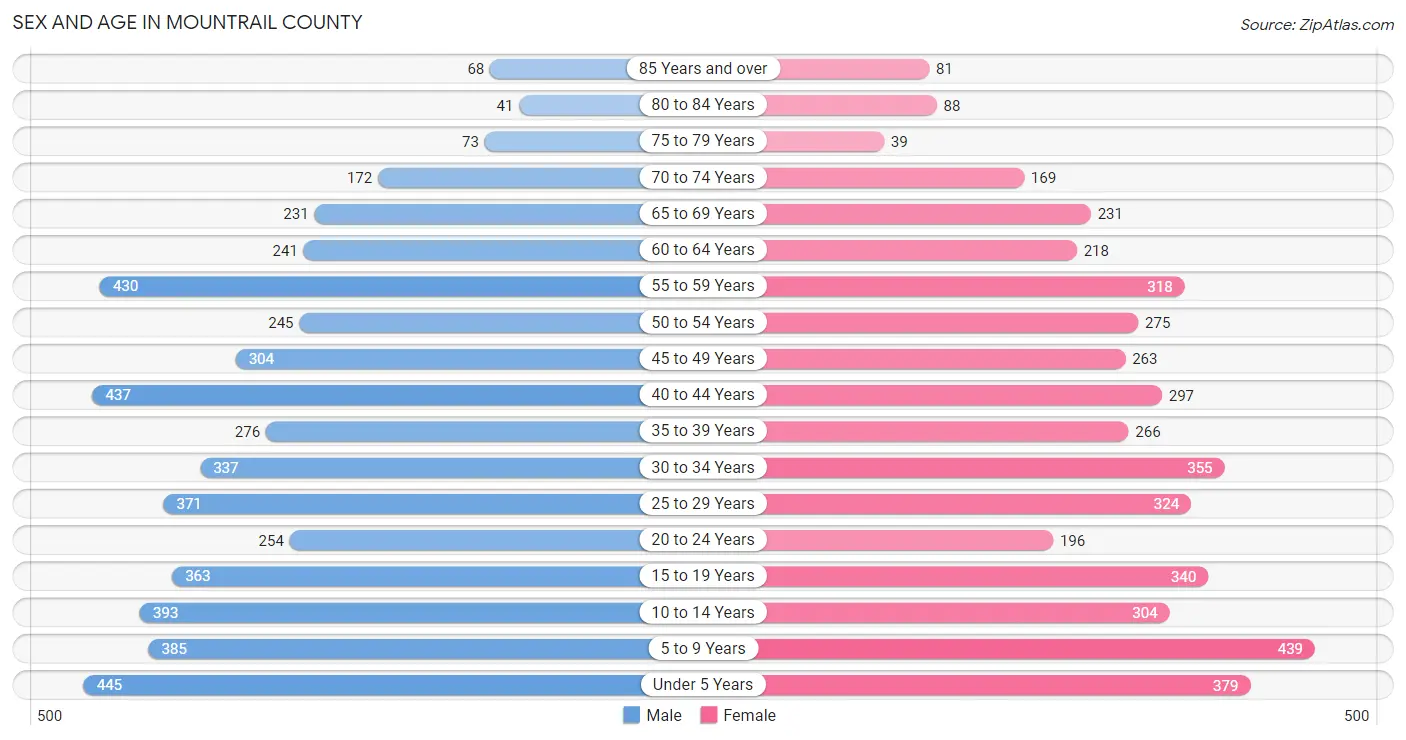
Sex and Age in Mountrail County
Sex and Age in Mountrail County
The most populous age groups in Mountrail County are Under 5 Years (445 | 8.8%) for men and 5 to 9 Years (439 | 9.6%) for women.
| Age Bracket | Male | Female |
| Under 5 Years | 445 (8.8%) | 379 (8.3%) |
| 5 to 9 Years | 385 (7.6%) | 439 (9.6%) |
| 10 to 14 Years | 393 (7.8%) | 304 (6.6%) |
| 15 to 19 Years | 363 (7.2%) | 340 (7.4%) |
| 20 to 24 Years | 254 (5.0%) | 196 (4.3%) |
| 25 to 29 Years | 371 (7.3%) | 324 (7.1%) |
| 30 to 34 Years | 337 (6.7%) | 355 (7.7%) |
| 35 to 39 Years | 276 (5.4%) | 266 (5.8%) |
| 40 to 44 Years | 437 (8.6%) | 297 (6.5%) |
| 45 to 49 Years | 304 (6.0%) | 263 (5.7%) |
| 50 to 54 Years | 245 (4.8%) | 275 (6.0%) |
| 55 to 59 Years | 430 (8.5%) | 318 (6.9%) |
| 60 to 64 Years | 241 (4.8%) | 218 (4.8%) |
| 65 to 69 Years | 231 (4.6%) | 231 (5.0%) |
| 70 to 74 Years | 172 (3.4%) | 169 (3.7%) |
| 75 to 79 Years | 73 (1.4%) | 39 (0.9%) |
| 80 to 84 Years | 41 (0.8%) | 88 (1.9%) |
| 85 Years and over | 68 (1.3%) | 81 (1.8%) |
| Total | 5,066 (100.0%) | 4,582 (100.0%) |
Families and Households in Mountrail County
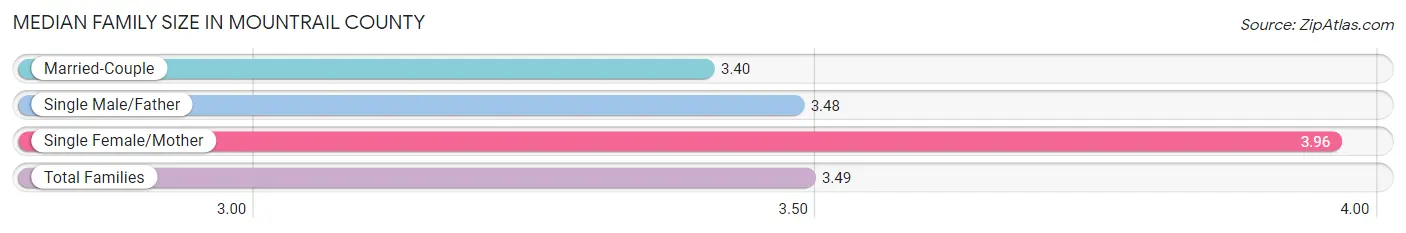
Median Family Size in Mountrail County
The median family size in Mountrail County is 3.49 persons per family, with single female/mother families (311 | 14.0%) accounting for the largest median family size of 3.96 persons per family. On the other hand, married-couple families (1,671 | 75.1%) represent the smallest median family size with 3.40 persons per family.
| Family Type | # Families | Family Size |
| Married-Couple | 1,671 (75.1%) | 3.40 |
| Single Male/Father | 244 (11.0%) | 3.48 |
| Single Female/Mother | 311 (14.0%) | 3.96 |
| Total Families | 2,226 (100.0%) | 3.49 |
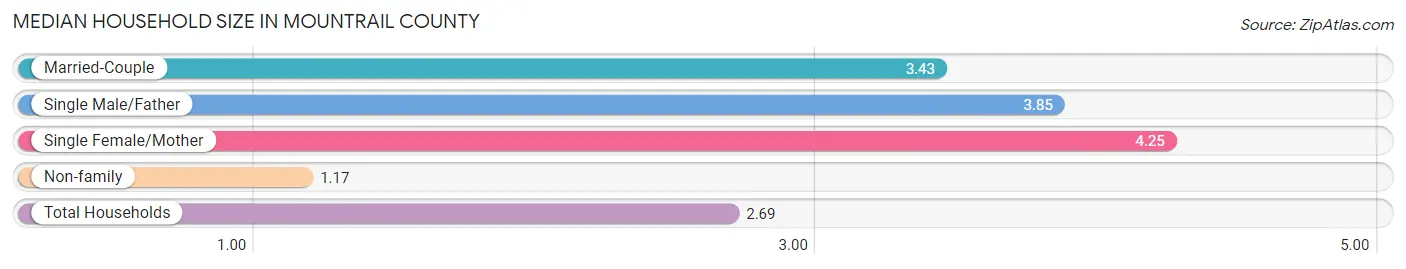
Median Household Size in Mountrail County
The median household size in Mountrail County is 2.69 persons per household, with single female/mother households (311 | 8.8%) accounting for the largest median household size of 4.25 persons per household. non-family households (1,313 | 37.1%) represent the smallest median household size with 1.17 persons per household.
| Household Type | # Households | Household Size |
| Married-Couple | 1,671 (47.2%) | 3.43 |
| Single Male/Father | 244 (6.9%) | 3.85 |
| Single Female/Mother | 311 (8.8%) | 4.25 |
| Non-family | 1,313 (37.1%) | 1.17 |
| Total Households | 3,539 (100.0%) | 2.69 |
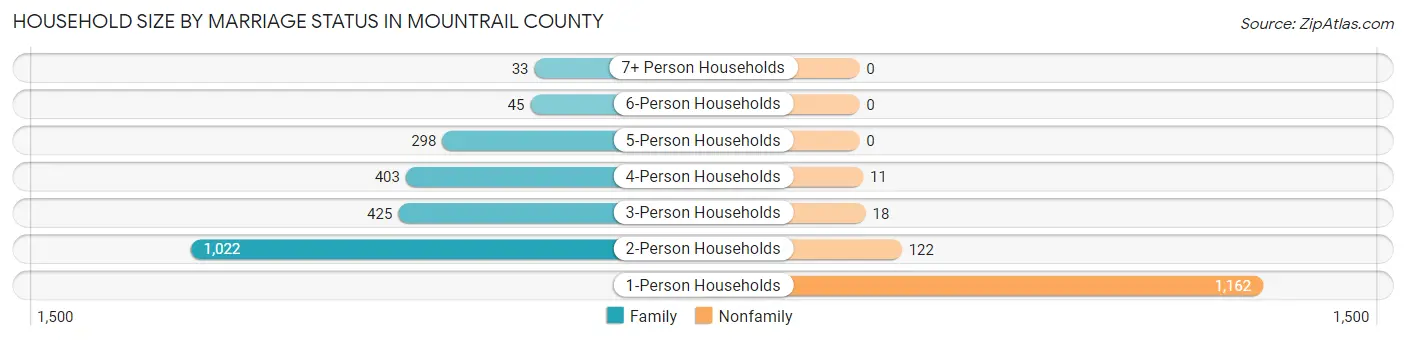
Household Size by Marriage Status in Mountrail County
Out of a total of 3,539 households in Mountrail County, 2,226 (62.9%) are family households, while 1,313 (37.1%) are nonfamily households. The most numerous type of family households are 2-person households, comprising 1,022, and the most common type of nonfamily households are 1-person households, comprising 1,162.
| Household Size | Family Households | Nonfamily Households |
| 1-Person Households | - | 1,162 (32.8%) |
| 2-Person Households | 1,022 (28.9%) | 122 (3.5%) |
| 3-Person Households | 425 (12.0%) | 18 (0.5%) |
| 4-Person Households | 403 (11.4%) | 11 (0.3%) |
| 5-Person Households | 298 (8.4%) | 0 (0.0%) |
| 6-Person Households | 45 (1.3%) | 0 (0.0%) |
| 7+ Person Households | 33 (0.9%) | 0 (0.0%) |
| Total | 2,226 (62.9%) | 1,313 (37.1%) |
Female Fertility in Mountrail County
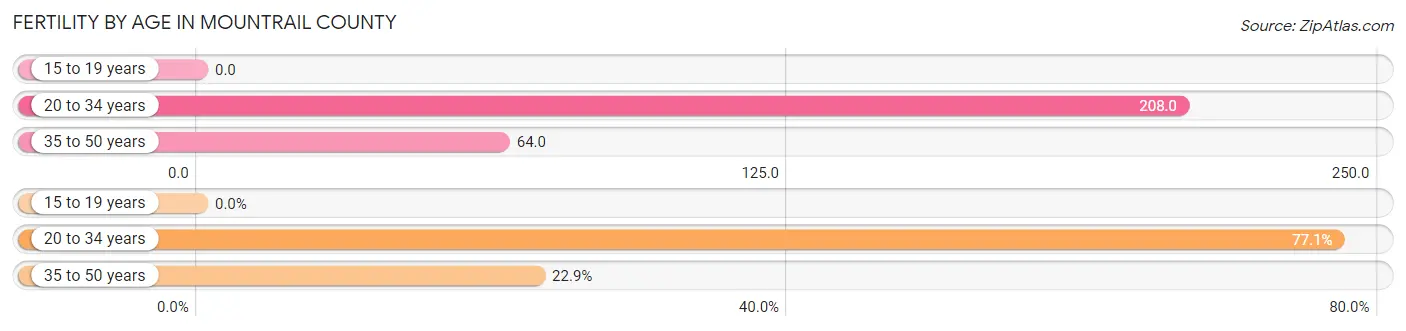
Fertility by Age in Mountrail County
Average fertility rate in Mountrail County is 114.0 births per 1,000 women. Women in the age bracket of 20 to 34 years have the highest fertility rate with 208.0 births per 1,000 women. Women in the age bracket of 20 to 34 years acount for 77.1% of all women with births.
| Age Bracket | Women with Births | Births / 1,000 Women |
| 15 to 19 years | 0 (0.0%) | 0.0 |
| 20 to 34 years | 182 (77.1%) | 208.0 |
| 35 to 50 years | 54 (22.9%) | 64.0 |
| Total | 236 (100.0%) | 114.0 |
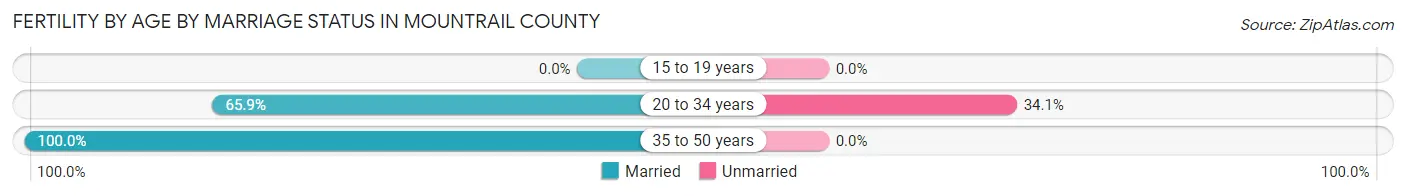
Fertility by Age by Marriage Status in Mountrail County
73.7% of women with births (236) in Mountrail County are married. The highest percentage of unmarried women with births falls into 20 to 34 years age bracket with 34.1% of them unmarried at the time of birth, while the lowest percentage of unmarried women with births belong to 35 to 50 years age bracket with 0.0% of them unmarried.
| Age Bracket | Married | Unmarried |
| 15 to 19 years | 0 (0.0%) | 0 (0.0%) |
| 20 to 34 years | 120 (65.9%) | 62 (34.1%) |
| 35 to 50 years | 54 (100.0%) | 0 (0.0%) |
| Total | 174 (73.7%) | 62 (26.3%) |
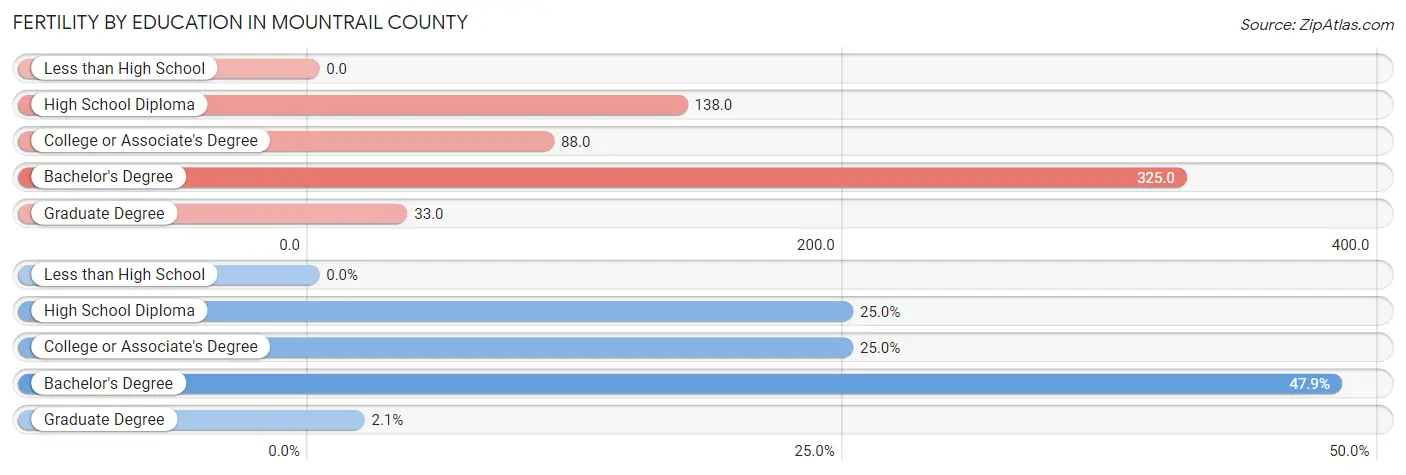
Fertility by Education in Mountrail County
| Educational Attainment | Women with Births | Births / 1,000 Women |
| Less than High School | 0 (0.0%) | 0.0 |
| High School Diploma | 59 (25.0%) | 138.0 |
| College or Associate's Degree | 59 (25.0%) | 88.0 |
| Bachelor's Degree | 113 (47.9%) | 325.0 |
| Graduate Degree | 5 (2.1%) | 33.0 |
| Total | 236 (100.0%) | 114.0 |
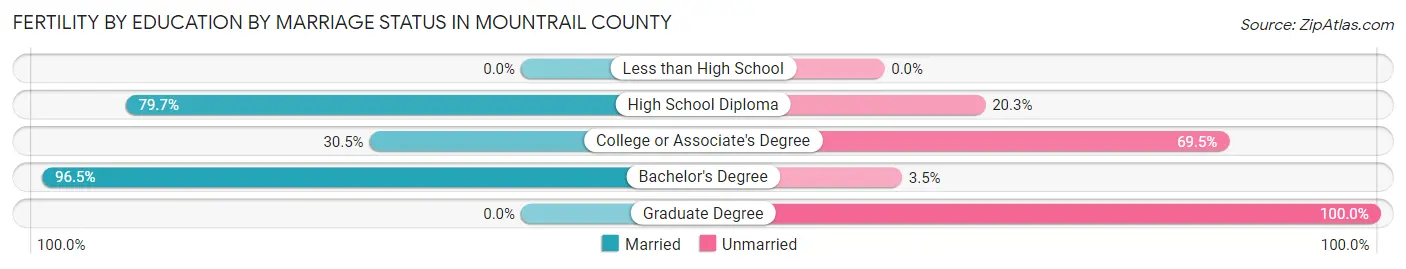
Fertility by Education by Marriage Status in Mountrail County
26.3% of women with births in Mountrail County are unmarried. Women with the educational attainment of bachelor's degree are most likely to be married with 96.5% of them married at childbirth, while women with the educational attainment of graduate degree are least likely to be married with 100.0% of them unmarried at childbirth.
| Educational Attainment | Married | Unmarried |
| Less than High School | 0 (0.0%) | 0 (0.0%) |
| High School Diploma | 47 (79.7%) | 12 (20.3%) |
| College or Associate's Degree | 18 (30.5%) | 41 (69.5%) |
| Bachelor's Degree | 109 (96.5%) | 4 (3.5%) |
| Graduate Degree | 0 (0.0%) | 5 (100.0%) |
| Total | 174 (73.7%) | 62 (26.3%) |
Income in Mountrail County
Income Overview in Mountrail County
Per Capita Income in Mountrail County is $39,603, while median incomes of families and households are $96,833 and $81,886 respectively.
| Characteristic | Number | Measure |
| Per Capita Income | 9,648 | $39,603 |
| Median Family Income | 2,226 | $96,833 |
| Mean Family Income | 2,226 | $119,843 |
| Median Household Income | 3,539 | $81,886 |
| Mean Household Income | 3,539 | $103,354 |
| Income Deficit | 2,226 | $12,271 |
| Wage / Income Gap (%) | 9,648 | 39.98% |
| Wage / Income Gap ($) | 9,648 | 60.02¢ per $1 |
| Gini / Inequality Index | 9,648 | 0.45 |
Earnings by Sex in Mountrail County
Average Earnings in Mountrail County are $46,411, $58,730 for men and $35,250 for women, a difference of 40.0%.
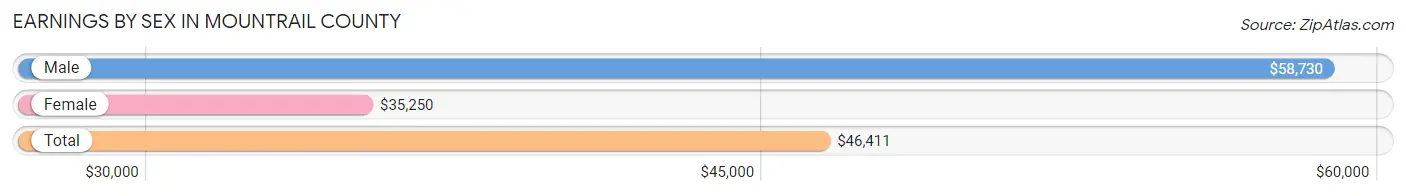
| Sex | Number | Average Earnings |
| Male | 2,815 (58.3%) | $58,730 |
| Female | 2,013 (41.7%) | $35,250 |
| Total | 4,828 (100.0%) | $46,411 |
Earnings by Sex by Income Bracket in Mountrail County
The most common earnings brackets in Mountrail County are $100,000+ for men (628 | 22.3%) and $55,000 to $64,999 for women (162 | 8.1%).
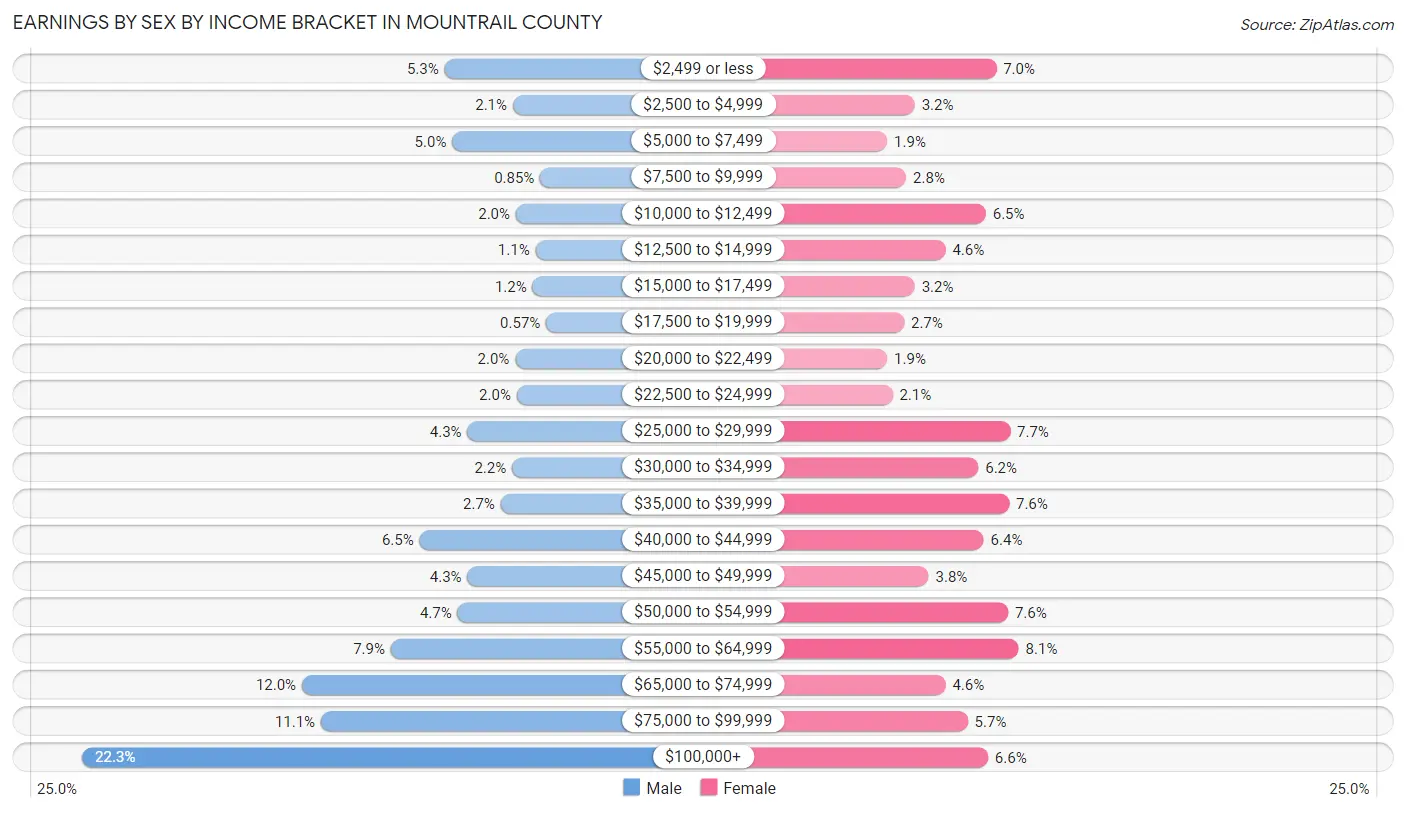
| Income | Male | Female |
| $2,499 or less | 150 (5.3%) | 141 (7.0%) |
| $2,500 to $4,999 | 60 (2.1%) | 64 (3.2%) |
| $5,000 to $7,499 | 140 (5.0%) | 38 (1.9%) |
| $7,500 to $9,999 | 24 (0.9%) | 56 (2.8%) |
| $10,000 to $12,499 | 56 (2.0%) | 131 (6.5%) |
| $12,500 to $14,999 | 30 (1.1%) | 93 (4.6%) |
| $15,000 to $17,499 | 34 (1.2%) | 64 (3.2%) |
| $17,500 to $19,999 | 16 (0.6%) | 54 (2.7%) |
| $20,000 to $22,499 | 57 (2.0%) | 38 (1.9%) |
| $22,500 to $24,999 | 55 (1.9%) | 43 (2.1%) |
| $25,000 to $29,999 | 120 (4.3%) | 154 (7.6%) |
| $30,000 to $34,999 | 61 (2.2%) | 124 (6.2%) |
| $35,000 to $39,999 | 76 (2.7%) | 153 (7.6%) |
| $40,000 to $44,999 | 183 (6.5%) | 129 (6.4%) |
| $45,000 to $49,999 | 120 (4.3%) | 77 (3.8%) |
| $50,000 to $54,999 | 133 (4.7%) | 152 (7.5%) |
| $55,000 to $64,999 | 221 (7.9%) | 162 (8.1%) |
| $65,000 to $74,999 | 338 (12.0%) | 93 (4.6%) |
| $75,000 to $99,999 | 313 (11.1%) | 114 (5.7%) |
| $100,000+ | 628 (22.3%) | 133 (6.6%) |
| Total | 2,815 (100.0%) | 2,013 (100.0%) |
Earnings by Sex by Educational Attainment in Mountrail County
Average earnings in Mountrail County are $66,033 for men and $39,660 for women, a difference of 39.9%. Men with an educational attainment of bachelor's degree enjoy the highest average annual earnings of $72,059, while those with less than high school education earn the least with $44,561. Women with an educational attainment of graduate degree earn the most with the average annual earnings of $55,588, while those with high school diploma education have the smallest earnings of $34,600.
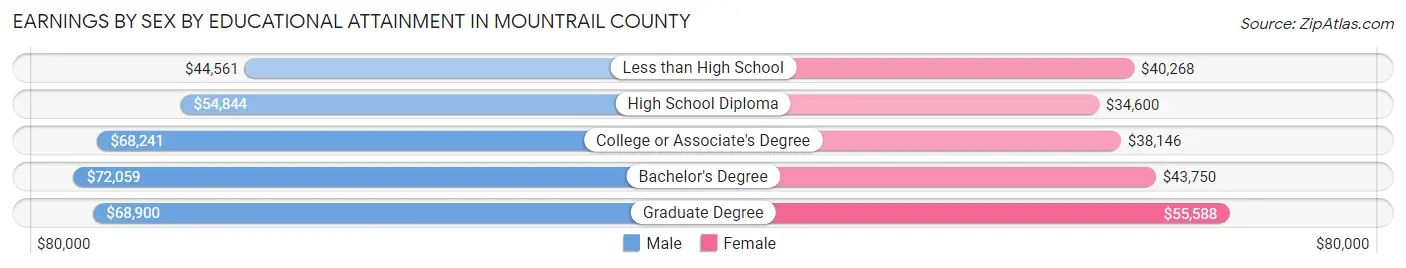
| Educational Attainment | Male Income | Female Income |
| Less than High School | $44,561 | $40,268 |
| High School Diploma | $54,844 | $34,600 |
| College or Associate's Degree | $68,241 | $38,146 |
| Bachelor's Degree | $72,059 | $43,750 |
| Graduate Degree | $68,900 | $55,588 |
| Total | $66,033 | $39,660 |
Family Income in Mountrail County
Family Income Brackets in Mountrail County
According to the Mountrail County family income data, there are 543 families falling into the $100,000 to $149,999 income range, which is the most common income bracket and makes up 24.4% of all families. Conversely, the $10,000 to $14,999 income bracket is the least frequent group with only 45 families (2.0%) belonging to this category.
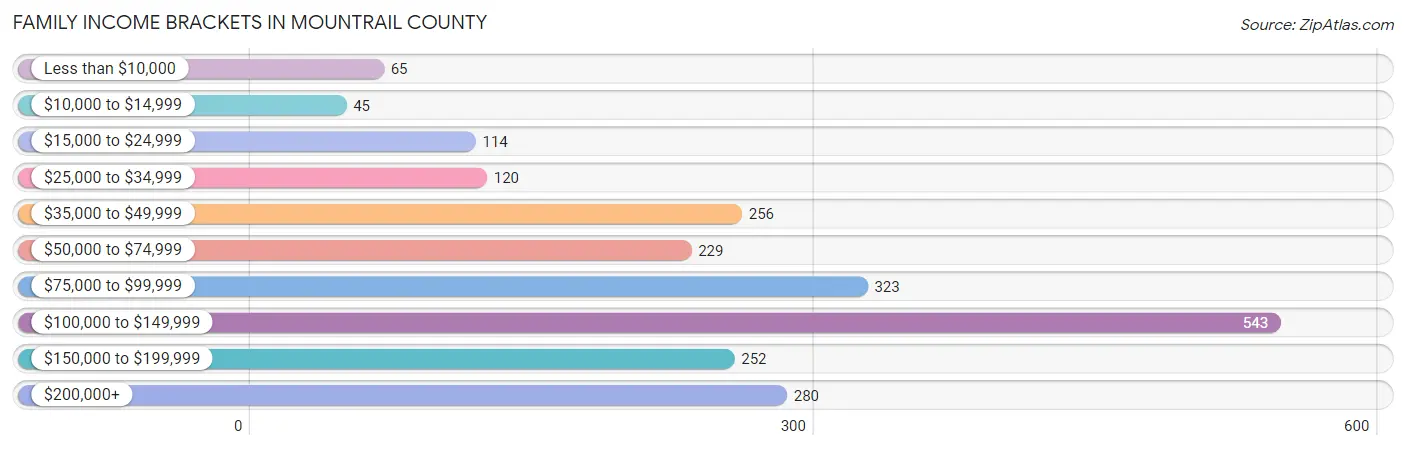
| Income Bracket | # Families | % Families |
| Less than $10,000 | 65 | 2.9% |
| $10,000 to $14,999 | 45 | 2.0% |
| $15,000 to $24,999 | 114 | 5.1% |
| $25,000 to $34,999 | 120 | 5.4% |
| $35,000 to $49,999 | 256 | 11.5% |
| $50,000 to $74,999 | 229 | 10.3% |
| $75,000 to $99,999 | 323 | 14.5% |
| $100,000 to $149,999 | 543 | 24.4% |
| $150,000 to $199,999 | 252 | 11.3% |
| $200,000+ | 280 | 12.6% |
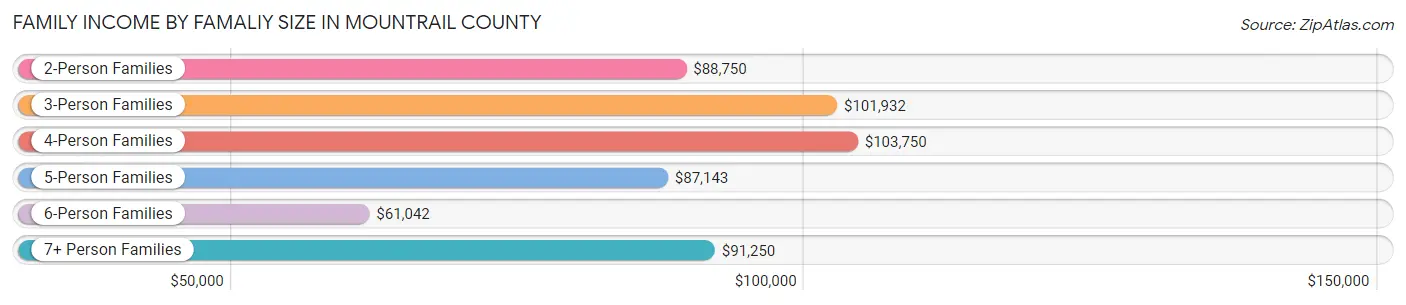
Family Income by Famaliy Size in Mountrail County
4-person families (360 | 16.2%) account for the highest median family income in Mountrail County with $103,750 per family, while 2-person families (1,093 | 49.1%) have the highest median income of $44,375 per family member.
| Income Bracket | # Families | Median Income |
| 2-Person Families | 1,093 (49.1%) | $88,750 |
| 3-Person Families | 413 (18.5%) | $101,932 |
| 4-Person Families | 360 (16.2%) | $103,750 |
| 5-Person Families | 294 (13.2%) | $87,143 |
| 6-Person Families | 33 (1.5%) | $61,042 |
| 7+ Person Families | 33 (1.5%) | $91,250 |
| Total | 2,226 (100.0%) | $96,833 |
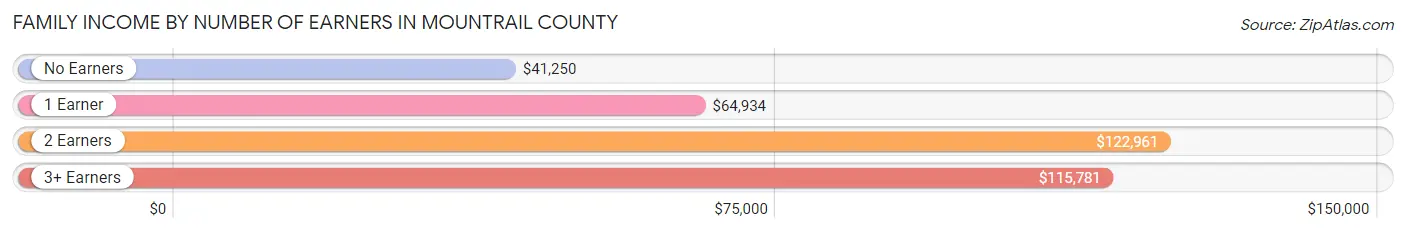
Family Income by Number of Earners in Mountrail County
The median family income in Mountrail County is $96,833, with families comprising 2 earners (919) having the highest median family income of $122,961, while families with no earners (367) have the lowest median family income of $41,250, accounting for 41.3% and 16.5% of families, respectively.
| Number of Earners | # Families | Median Income |
| No Earners | 367 (16.5%) | $41,250 |
| 1 Earner | 729 (32.8%) | $64,934 |
| 2 Earners | 919 (41.3%) | $122,961 |
| 3+ Earners | 211 (9.5%) | $115,781 |
| Total | 2,226 (100.0%) | $96,833 |
Household Income in Mountrail County
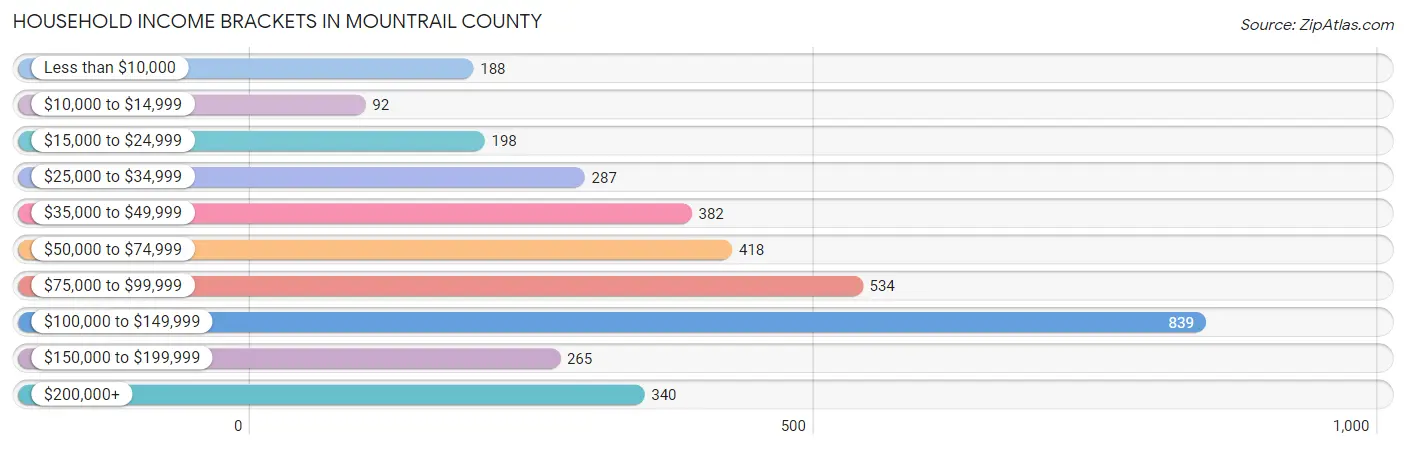
Household Income Brackets in Mountrail County
With 839 households falling in the category, the $100,000 to $149,999 income range is the most frequent in Mountrail County, accounting for 23.7% of all households. In contrast, only 92 households (2.6%) fall into the $10,000 to $14,999 income bracket, making it the least populous group.
| Income Bracket | # Households | % Households |
| Less than $10,000 | 188 | 5.3% |
| $10,000 to $14,999 | 92 | 2.6% |
| $15,000 to $24,999 | 198 | 5.6% |
| $25,000 to $34,999 | 287 | 8.1% |
| $35,000 to $49,999 | 382 | 10.8% |
| $50,000 to $74,999 | 418 | 11.8% |
| $75,000 to $99,999 | 534 | 15.1% |
| $100,000 to $149,999 | 839 | 23.7% |
| $150,000 to $199,999 | 265 | 7.5% |
| $200,000+ | 340 | 9.6% |
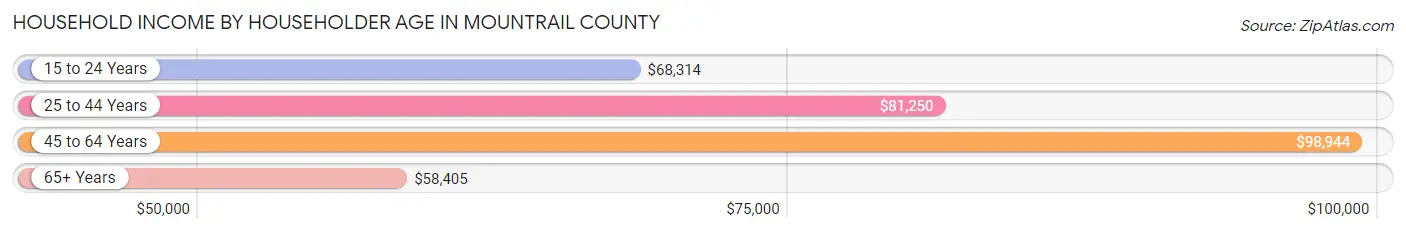
Household Income by Householder Age in Mountrail County
The median household income in Mountrail County is $81,886, with the highest median household income of $98,944 found in the 45 to 64 years age bracket for the primary householder. A total of 1,280 households (36.2%) fall into this category. Meanwhile, the 65+ years age bracket for the primary householder has the lowest median household income of $58,405, with 737 households (20.8%) in this group.
| Income Bracket | # Households | Median Income |
| 15 to 24 Years | 208 (5.9%) | $68,314 |
| 25 to 44 Years | 1,314 (37.1%) | $81,250 |
| 45 to 64 Years | 1,280 (36.2%) | $98,944 |
| 65+ Years | 737 (20.8%) | $58,405 |
| Total | 3,539 (100.0%) | $81,886 |
Poverty in Mountrail County
Income Below Poverty by Sex and Age in Mountrail County
With 11.9% poverty level for males and 12.9% for females among the residents of Mountrail County, 12 to 14 year old males and 45 to 54 year old females are the most vulnerable to poverty, with 90 males (32.4%) and 115 females (21.4%) in their respective age groups living below the poverty level.
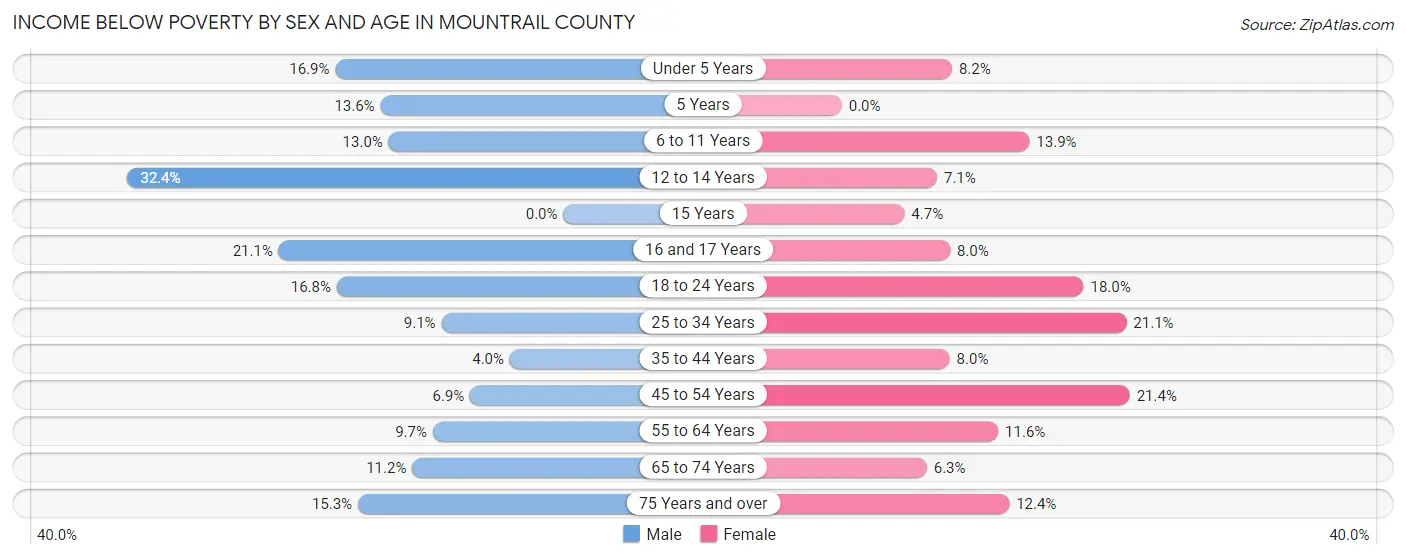
| Age Bracket | Male | Female |
| Under 5 Years | 75 (16.9%) | 31 (8.2%) |
| 5 Years | 11 (13.6%) | 0 (0.0%) |
| 6 to 11 Years | 52 (13.0%) | 56 (13.9%) |
| 12 to 14 Years | 90 (32.4%) | 14 (7.1%) |
| 15 Years | 0 (0.0%) | 4 (4.6%) |
| 16 and 17 Years | 30 (21.1%) | 11 (8.0%) |
| 18 to 24 Years | 74 (16.8%) | 56 (17.9%) |
| 25 to 34 Years | 64 (9.0%) | 142 (21.1%) |
| 35 to 44 Years | 28 (4.0%) | 45 (8.0%) |
| 45 to 54 Years | 38 (6.9%) | 115 (21.4%) |
| 55 to 64 Years | 65 (9.7%) | 62 (11.6%) |
| 65 to 74 Years | 45 (11.2%) | 25 (6.3%) |
| 75 Years and over | 27 (15.2%) | 22 (12.4%) |
| Total | 599 (11.9%) | 583 (12.9%) |
Income Above Poverty by Sex and Age in Mountrail County
According to the poverty statistics in Mountrail County, males aged 15 years and females aged 5 years are the age groups that are most secure financially, with 100.0% of males and 100.0% of females in these age groups living above the poverty line.
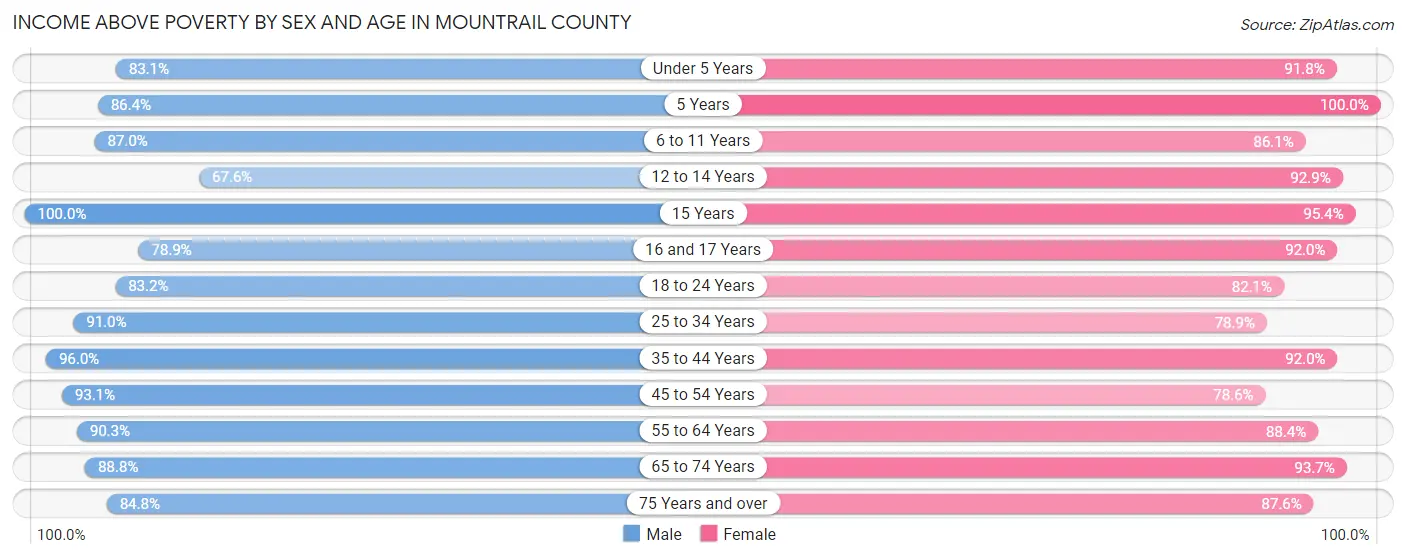
| Age Bracket | Male | Female |
| Under 5 Years | 368 (83.1%) | 348 (91.8%) |
| 5 Years | 70 (86.4%) | 124 (100.0%) |
| 6 to 11 Years | 349 (87.0%) | 346 (86.1%) |
| 12 to 14 Years | 188 (67.6%) | 184 (92.9%) |
| 15 Years | 33 (100.0%) | 82 (95.4%) |
| 16 and 17 Years | 112 (78.9%) | 126 (92.0%) |
| 18 to 24 Years | 366 (83.2%) | 256 (82.1%) |
| 25 to 34 Years | 643 (90.9%) | 530 (78.9%) |
| 35 to 44 Years | 678 (96.0%) | 517 (92.0%) |
| 45 to 54 Years | 511 (93.1%) | 423 (78.6%) |
| 55 to 64 Years | 606 (90.3%) | 472 (88.4%) |
| 65 to 74 Years | 356 (88.8%) | 371 (93.7%) |
| 75 Years and over | 150 (84.8%) | 155 (87.6%) |
| Total | 4,430 (88.1%) | 3,934 (87.1%) |
Income Below Poverty Among Married-Couple Families in Mountrail County
The poverty statistics for married-couple families in Mountrail County show that 5.0% or 84 of the total 1,671 families live below the poverty line. Families with 3 or 4 children have the highest poverty rate of 24.4%, comprising of 54 families. On the other hand, families with 1 or 2 children have the lowest poverty rate of 0.0%, which includes 0 families.
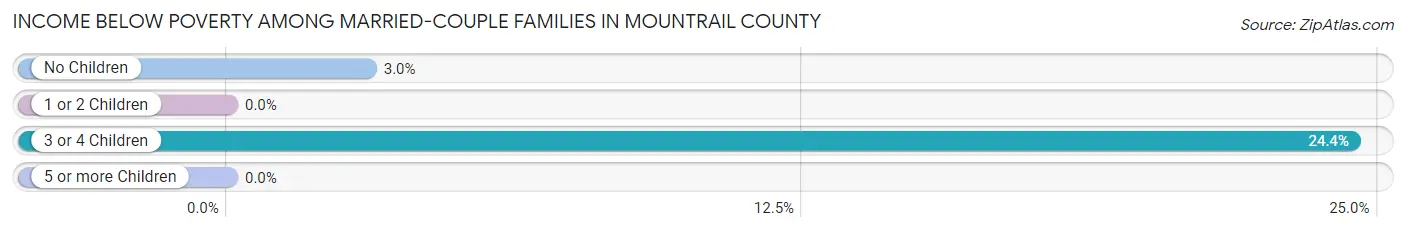
| Children | Above Poverty | Below Poverty |
| No Children | 962 (97.0%) | 30 (3.0%) |
| 1 or 2 Children | 449 (100.0%) | 0 (0.0%) |
| 3 or 4 Children | 167 (75.6%) | 54 (24.4%) |
| 5 or more Children | 9 (100.0%) | 0 (0.0%) |
| Total | 1,587 (95.0%) | 84 (5.0%) |
Income Below Poverty Among Single-Parent Households in Mountrail County
According to the poverty data in Mountrail County, 9.4% or 23 single-father households and 24.1% or 75 single-mother households are living below the poverty line. Among single-father households, those with 1 or 2 children have the highest poverty rate, with 23 households (13.3%) experiencing poverty. Likewise, among single-mother households, those with 1 or 2 children have the highest poverty rate, with 55 households (30.2%) falling below the poverty line.
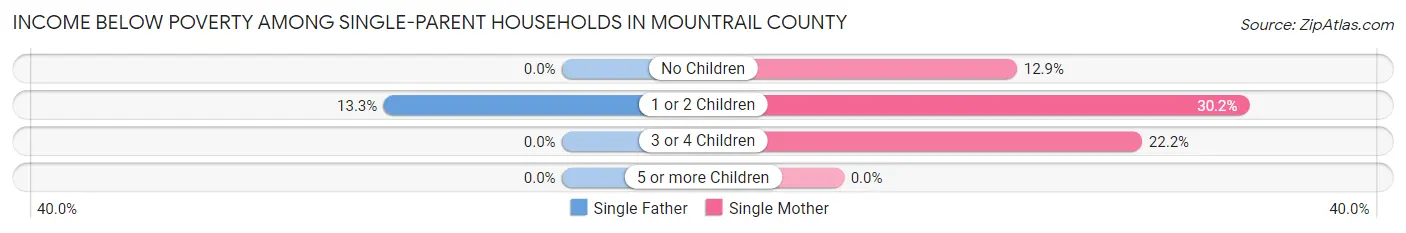
| Children | Single Father | Single Mother |
| No Children | 0 (0.0%) | 12 (12.9%) |
| 1 or 2 Children | 23 (13.3%) | 55 (30.2%) |
| 3 or 4 Children | 0 (0.0%) | 8 (22.2%) |
| 5 or more Children | 0 (0.0%) | 0 (0.0%) |
| Total | 23 (9.4%) | 75 (24.1%) |
Income Below Poverty Among Married-Couple vs Single-Parent Households in Mountrail County
The poverty data for Mountrail County shows that 84 of the married-couple family households (5.0%) and 98 of the single-parent households (17.7%) are living below the poverty level. Within the married-couple family households, those with 3 or 4 children have the highest poverty rate, with 54 households (24.4%) falling below the poverty line. Among the single-parent households, those with 1 or 2 children have the highest poverty rate, with 78 household (22.0%) living below poverty.
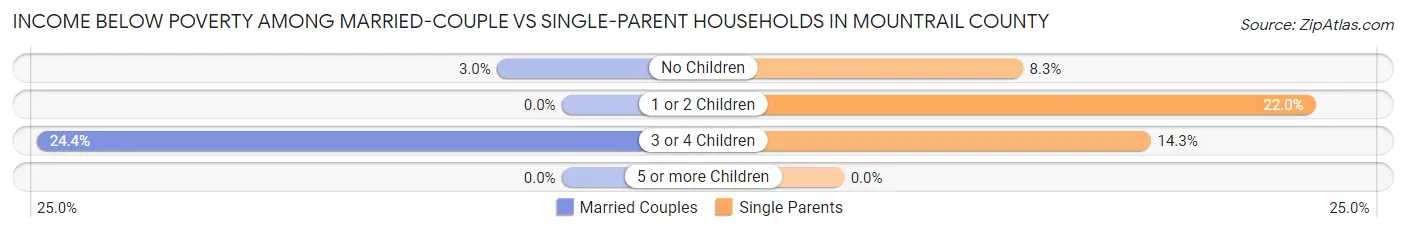
| Children | Married-Couple Families | Single-Parent Households |
| No Children | 30 (3.0%) | 12 (8.3%) |
| 1 or 2 Children | 0 (0.0%) | 78 (22.0%) |
| 3 or 4 Children | 54 (24.4%) | 8 (14.3%) |
| 5 or more Children | 0 (0.0%) | 0 (0.0%) |
| Total | 84 (5.0%) | 98 (17.7%) |
Employment Characteristics in Mountrail County
Employment by Class of Employer in Mountrail County
Among the 4,339 employed individuals in Mountrail County, private company employees (2,486 | 57.3%), local government employees (693 | 16.0%), and self-employed (not incorporated) (428 | 9.9%) make up the most common classes of employment.
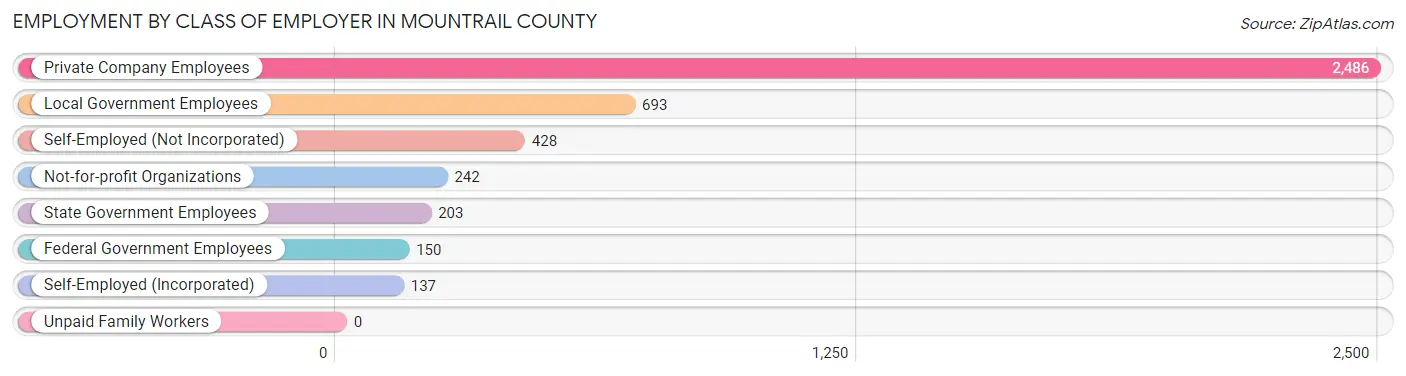
| Employer Class | # Employees | % Employees |
| Private Company Employees | 2,486 | 57.3% |
| Self-Employed (Incorporated) | 137 | 3.2% |
| Self-Employed (Not Incorporated) | 428 | 9.9% |
| Not-for-profit Organizations | 242 | 5.6% |
| Local Government Employees | 693 | 16.0% |
| State Government Employees | 203 | 4.7% |
| Federal Government Employees | 150 | 3.5% |
| Unpaid Family Workers | 0 | 0.0% |
| Total | 4,339 | 100.0% |
Employment Status by Age in Mountrail County
According to the labor force statistics for Mountrail County, out of the total population over 16 years of age (7,184), 63.4% or 4,555 individuals are in the labor force, with 3.5% or 159 of them unemployed. The age group with the highest labor force participation rate is 30 to 34 years, with 79.8% or 552 individuals in the labor force. Within the labor force, the 16 to 19 years age range has the highest percentage of unemployed individuals, with 19.1% or 58 of them being unemployed.
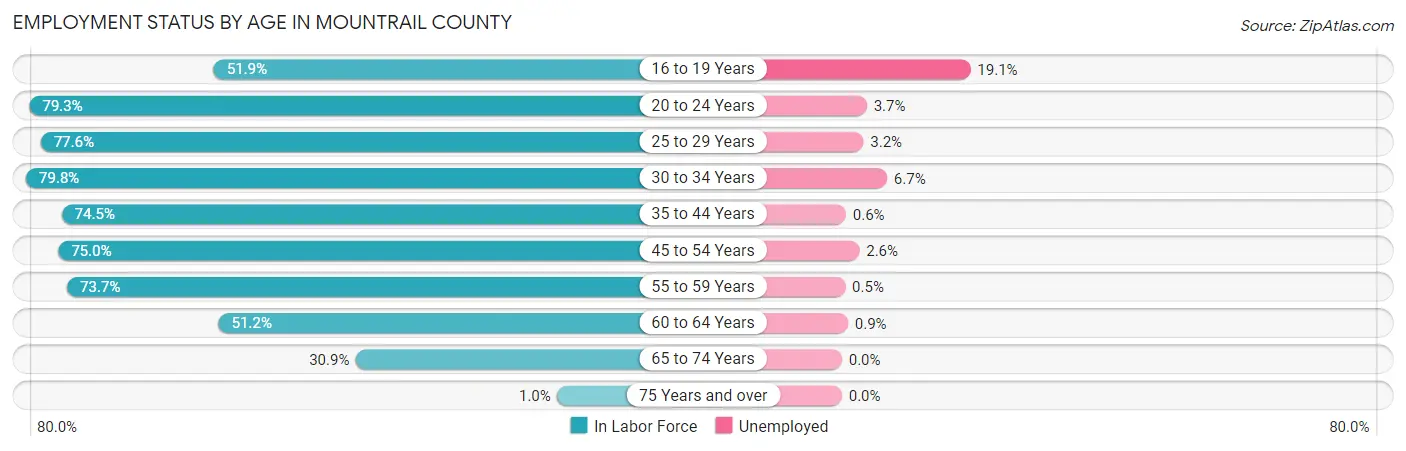
| Age Bracket | In Labor Force | Unemployed |
| 16 to 19 Years | 303 (51.9%) | 58 (19.1%) |
| 20 to 24 Years | 357 (79.3%) | 13 (3.7%) |
| 25 to 29 Years | 539 (77.6%) | 17 (3.2%) |
| 30 to 34 Years | 552 (79.8%) | 37 (6.7%) |
| 35 to 44 Years | 951 (74.5%) | 6 (0.6%) |
| 45 to 54 Years | 815 (75.0%) | 21 (2.6%) |
| 55 to 59 Years | 551 (73.7%) | 3 (0.5%) |
| 60 to 64 Years | 235 (51.2%) | 2 (0.9%) |
| 65 to 74 Years | 248 (30.9%) | 0 (0.0%) |
| 75 Years and over | 4 (1.0%) | 0 (0.0%) |
| Total | 4,555 (63.4%) | 159 (3.5%) |
Employment Status by Educational Attainment in Mountrail County
According to labor force statistics for Mountrail County, 73.5% of individuals (3,643) out of the total population between 25 and 64 years of age (4,957) are in the labor force, with 2.4% or 87 of them being unemployed. The group with the highest labor force participation rate are those with the educational attainment of bachelor's degree or higher, with 86.1% or 1,018 individuals in the labor force. Within the labor force, individuals with bachelor's degree or higher education have the highest percentage of unemployment, with 4.5% or 46 of them being unemployed.
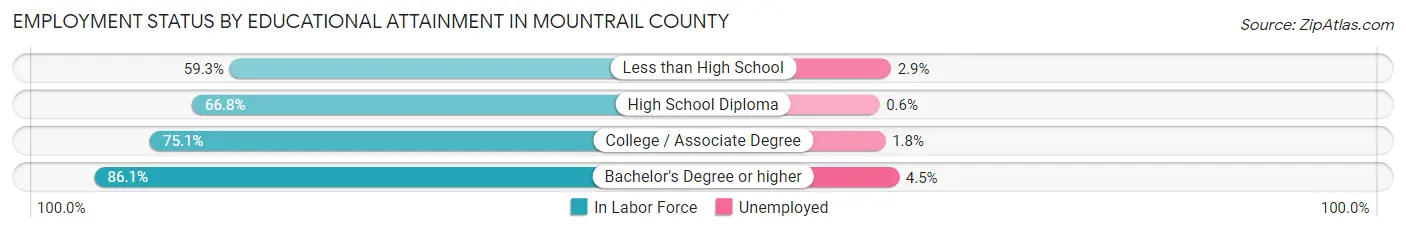
| Educational Attainment | In Labor Force | Unemployed |
| Less than High School | 345 (59.3%) | 17 (2.9%) |
| High School Diploma | 959 (66.8%) | 9 (0.6%) |
| College / Associate Degree | 1,320 (75.1%) | 32 (1.8%) |
| Bachelor's Degree or higher | 1,018 (86.1%) | 53 (4.5%) |
| Total | 3,643 (73.5%) | 119 (2.4%) |
Employment Occupations by Sex in Mountrail County
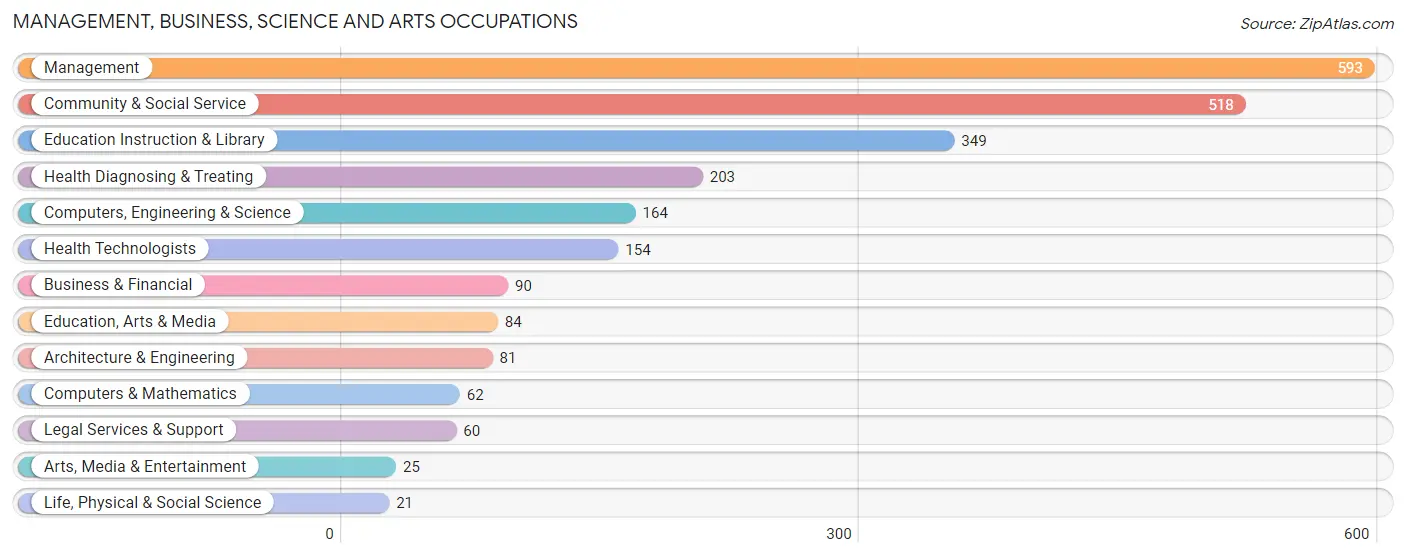
Management, Business, Science and Arts Occupations
The most common Management, Business, Science and Arts occupations in Mountrail County are Management (593 | 13.5%), Community & Social Service (518 | 11.8%), Education Instruction & Library (349 | 8.0%), Health Diagnosing & Treating (203 | 4.6%), and Computers, Engineering & Science (164 | 3.7%).
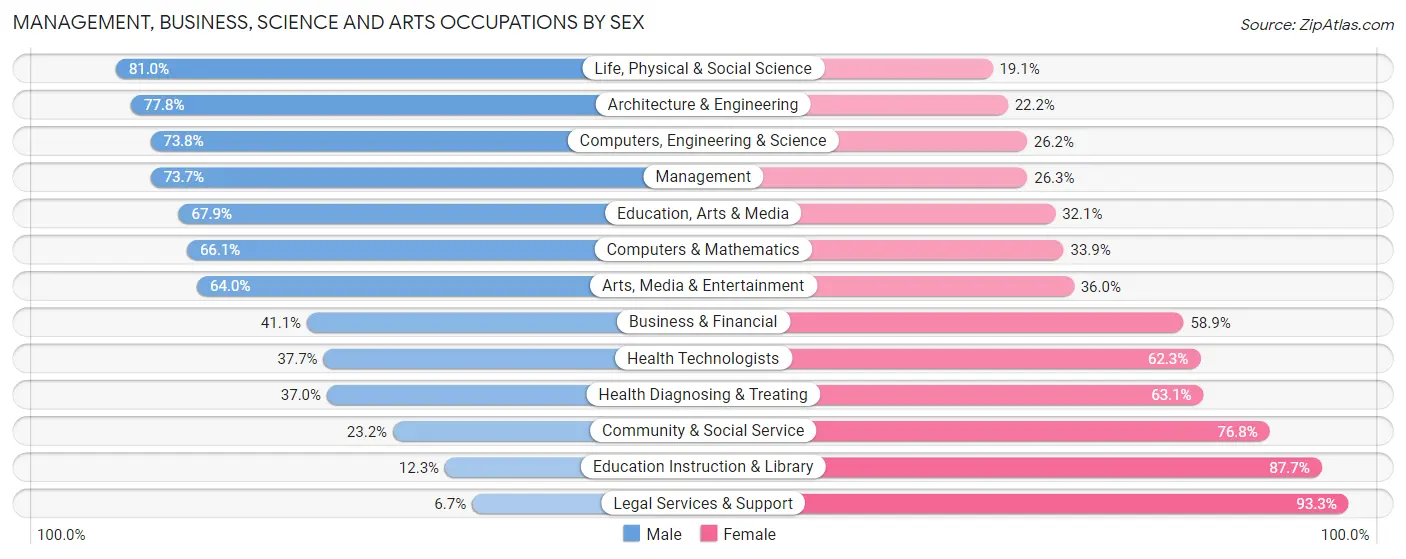
Management, Business, Science and Arts Occupations by Sex
Within the Management, Business, Science and Arts occupations in Mountrail County, the most male-oriented occupations are Life, Physical & Social Science (80.9%), Architecture & Engineering (77.8%), and Computers, Engineering & Science (73.8%), while the most female-oriented occupations are Legal Services & Support (93.3%), Education Instruction & Library (87.7%), and Community & Social Service (76.8%).
| Occupation | Male | Female |
| Management | 437 (73.7%) | 156 (26.3%) |
| Business & Financial | 37 (41.1%) | 53 (58.9%) |
| Computers, Engineering & Science | 121 (73.8%) | 43 (26.2%) |
| Computers & Mathematics | 41 (66.1%) | 21 (33.9%) |
| Architecture & Engineering | 63 (77.8%) | 18 (22.2%) |
| Life, Physical & Social Science | 17 (80.9%) | 4 (19.1%) |
| Community & Social Service | 120 (23.2%) | 398 (76.8%) |
| Education, Arts & Media | 57 (67.9%) | 27 (32.1%) |
| Legal Services & Support | 4 (6.7%) | 56 (93.3%) |
| Education Instruction & Library | 43 (12.3%) | 306 (87.7%) |
| Arts, Media & Entertainment | 16 (64.0%) | 9 (36.0%) |
| Health Diagnosing & Treating | 75 (36.9%) | 128 (63.0%) |
| Health Technologists | 58 (37.7%) | 96 (62.3%) |
| Total (Category) | 790 (50.4%) | 778 (49.6%) |
| Total (Overall) | 2,607 (59.4%) | 1,780 (40.6%) |
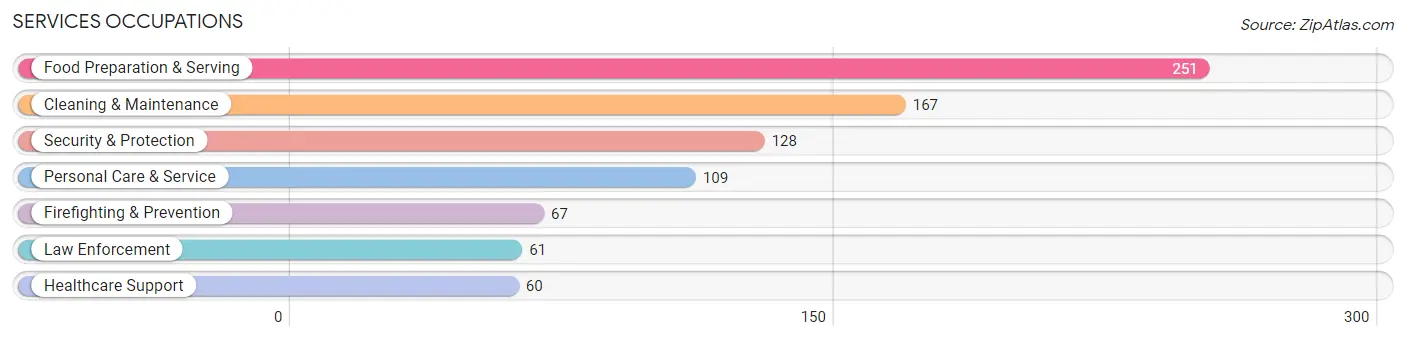
Services Occupations
The most common Services occupations in Mountrail County are Food Preparation & Serving (251 | 5.7%), Cleaning & Maintenance (167 | 3.8%), Security & Protection (128 | 2.9%), Personal Care & Service (109 | 2.5%), and Firefighting & Prevention (67 | 1.5%).
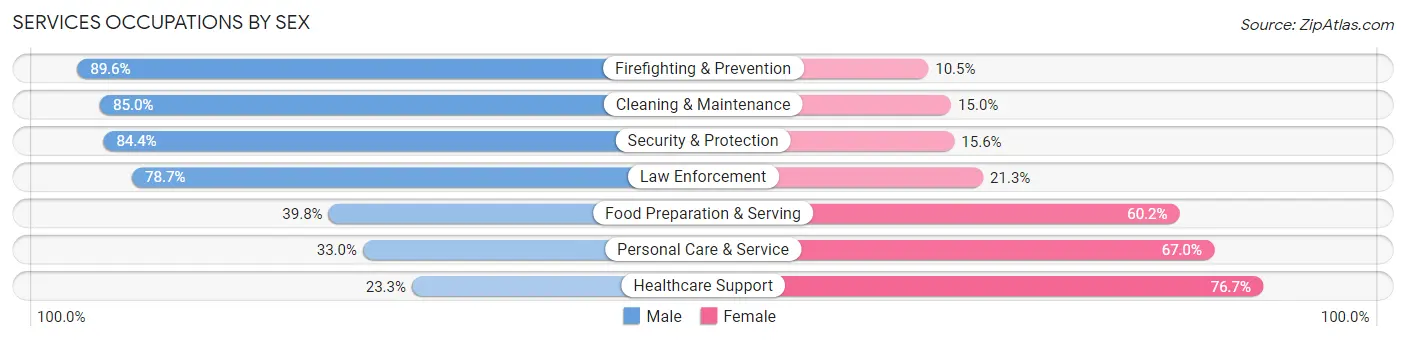
Services Occupations by Sex
Within the Services occupations in Mountrail County, the most male-oriented occupations are Firefighting & Prevention (89.5%), Cleaning & Maintenance (85.0%), and Security & Protection (84.4%), while the most female-oriented occupations are Healthcare Support (76.7%), Personal Care & Service (67.0%), and Food Preparation & Serving (60.2%).
| Occupation | Male | Female |
| Healthcare Support | 14 (23.3%) | 46 (76.7%) |
| Security & Protection | 108 (84.4%) | 20 (15.6%) |
| Firefighting & Prevention | 60 (89.5%) | 7 (10.4%) |
| Law Enforcement | 48 (78.7%) | 13 (21.3%) |
| Food Preparation & Serving | 100 (39.8%) | 151 (60.2%) |
| Cleaning & Maintenance | 142 (85.0%) | 25 (15.0%) |
| Personal Care & Service | 36 (33.0%) | 73 (67.0%) |
| Total (Category) | 400 (55.9%) | 315 (44.1%) |
| Total (Overall) | 2,607 (59.4%) | 1,780 (40.6%) |
Sales and Office Occupations
The most common Sales and Office occupations in Mountrail County are Office & Administration (531 | 12.1%), and Sales & Related (414 | 9.4%).
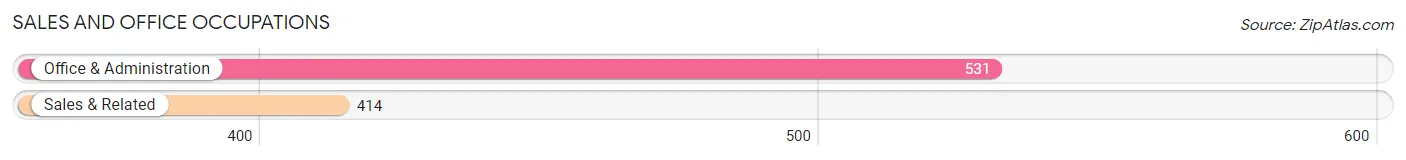
Sales and Office Occupations by Sex
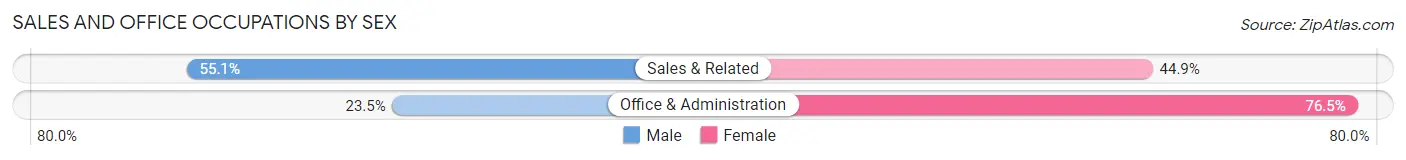
| Occupation | Male | Female |
| Sales & Related | 228 (55.1%) | 186 (44.9%) |
| Office & Administration | 125 (23.5%) | 406 (76.5%) |
| Total (Category) | 353 (37.3%) | 592 (62.6%) |
| Total (Overall) | 2,607 (59.4%) | 1,780 (40.6%) |
Natural Resources, Construction and Maintenance Occupations
The most common Natural Resources, Construction and Maintenance occupations in Mountrail County are Construction & Extraction (275 | 6.3%), Installation, Maintenance & Repair (242 | 5.5%), and Farming, Fishing & Forestry (68 | 1.5%).
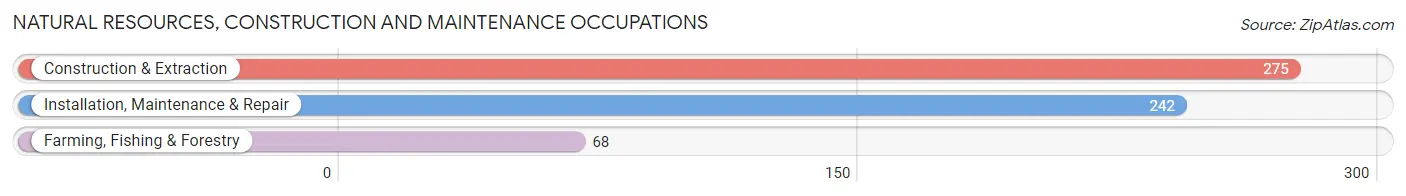
Natural Resources, Construction and Maintenance Occupations by Sex
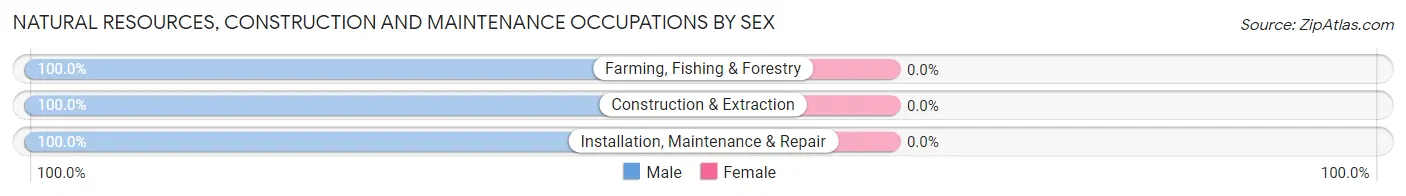
| Occupation | Male | Female |
| Farming, Fishing & Forestry | 68 (100.0%) | 0 (0.0%) |
| Construction & Extraction | 275 (100.0%) | 0 (0.0%) |
| Installation, Maintenance & Repair | 242 (100.0%) | 0 (0.0%) |
| Total (Category) | 585 (100.0%) | 0 (0.0%) |
| Total (Overall) | 2,607 (59.4%) | 1,780 (40.6%) |
Production, Transportation and Moving Occupations
The most common Production, Transportation and Moving occupations in Mountrail County are Transportation (244 | 5.6%), Production (219 | 5.0%), and Material Moving (111 | 2.5%).
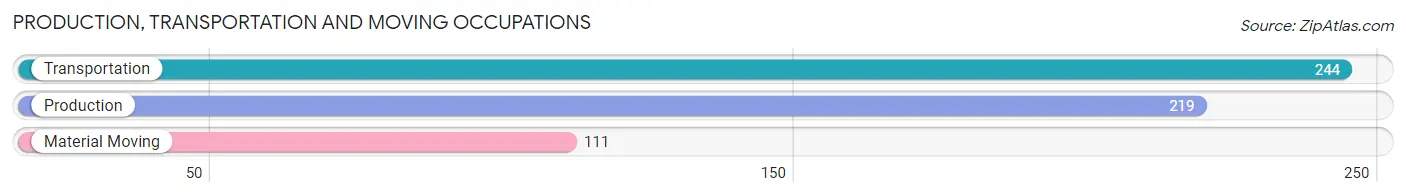
Production, Transportation and Moving Occupations by Sex
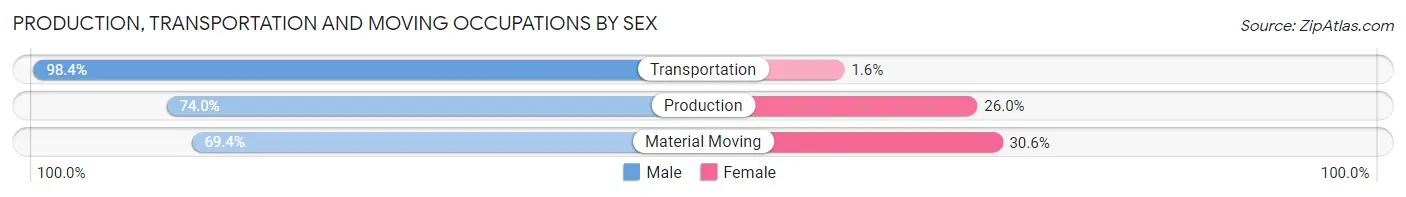
| Occupation | Male | Female |
| Production | 162 (74.0%) | 57 (26.0%) |
| Transportation | 240 (98.4%) | 4 (1.6%) |
| Material Moving | 77 (69.4%) | 34 (30.6%) |
| Total (Category) | 479 (83.5%) | 95 (16.6%) |
| Total (Overall) | 2,607 (59.4%) | 1,780 (40.6%) |
Employment Industries by Sex in Mountrail County
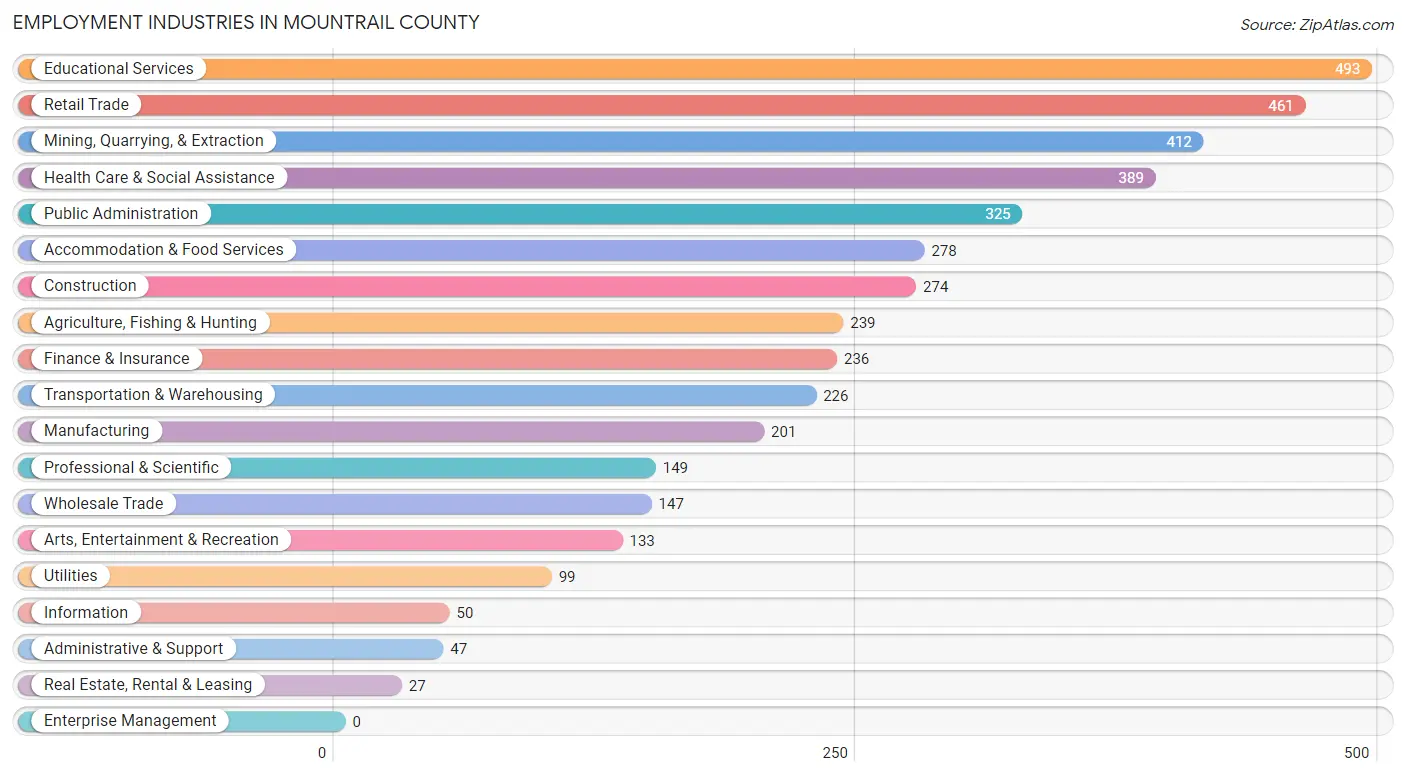
Employment Industries in Mountrail County
The major employment industries in Mountrail County include Educational Services (493 | 11.2%), Retail Trade (461 | 10.5%), Mining, Quarrying, & Extraction (412 | 9.4%), Health Care & Social Assistance (389 | 8.9%), and Public Administration (325 | 7.4%).
Employment Industries by Sex in Mountrail County
The Mountrail County industries that see more men than women are Transportation & Warehousing (95.6%), Mining, Quarrying, & Extraction (94.9%), and Agriculture, Fishing & Hunting (94.6%), whereas the industries that tend to have a higher number of women are Educational Services (83.0%), Finance & Insurance (82.2%), and Health Care & Social Assistance (75.8%).
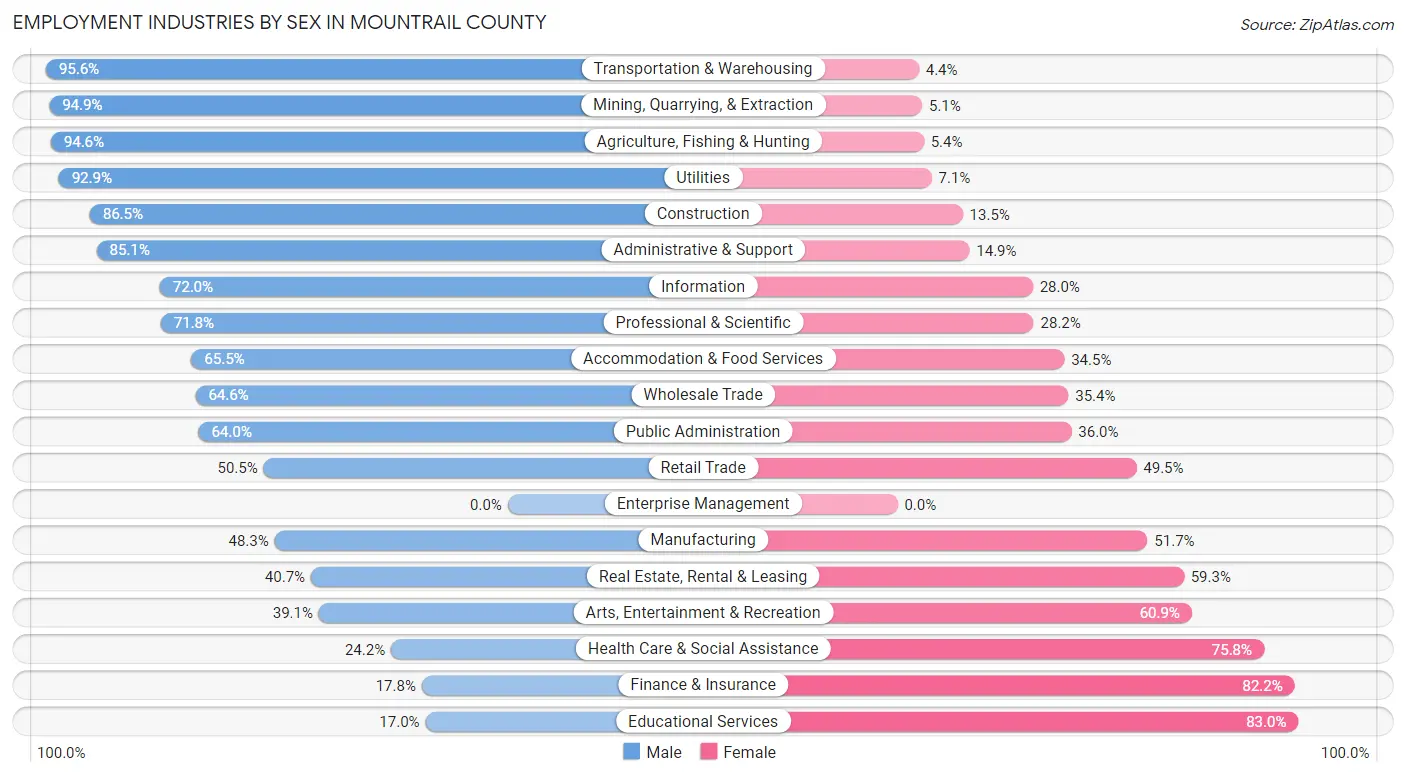
| Industry | Male | Female |
| Agriculture, Fishing & Hunting | 226 (94.6%) | 13 (5.4%) |
| Mining, Quarrying, & Extraction | 391 (94.9%) | 21 (5.1%) |
| Construction | 237 (86.5%) | 37 (13.5%) |
| Manufacturing | 97 (48.3%) | 104 (51.7%) |
| Wholesale Trade | 95 (64.6%) | 52 (35.4%) |
| Retail Trade | 233 (50.5%) | 228 (49.5%) |
| Transportation & Warehousing | 216 (95.6%) | 10 (4.4%) |
| Utilities | 92 (92.9%) | 7 (7.1%) |
| Information | 36 (72.0%) | 14 (28.0%) |
| Finance & Insurance | 42 (17.8%) | 194 (82.2%) |
| Real Estate, Rental & Leasing | 11 (40.7%) | 16 (59.3%) |
| Professional & Scientific | 107 (71.8%) | 42 (28.2%) |
| Enterprise Management | 0 (0.0%) | 0 (0.0%) |
| Administrative & Support | 40 (85.1%) | 7 (14.9%) |
| Educational Services | 84 (17.0%) | 409 (83.0%) |
| Health Care & Social Assistance | 94 (24.2%) | 295 (75.8%) |
| Arts, Entertainment & Recreation | 52 (39.1%) | 81 (60.9%) |
| Accommodation & Food Services | 182 (65.5%) | 96 (34.5%) |
| Public Administration | 208 (64.0%) | 117 (36.0%) |
| Total | 2,607 (59.4%) | 1,780 (40.6%) |
Education in Mountrail County
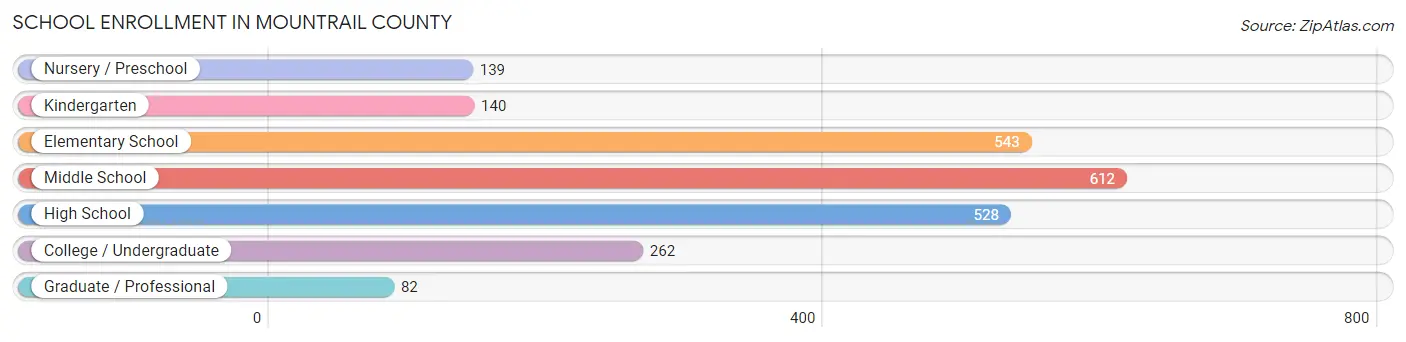
School Enrollment in Mountrail County
The most common levels of schooling among the 2,306 students in Mountrail County are middle school (612 | 26.5%), elementary school (543 | 23.5%), and high school (528 | 22.9%).
| School Level | # Students | % Students |
| Nursery / Preschool | 139 | 6.0% |
| Kindergarten | 140 | 6.1% |
| Elementary School | 543 | 23.5% |
| Middle School | 612 | 26.5% |
| High School | 528 | 22.9% |
| College / Undergraduate | 262 | 11.4% |
| Graduate / Professional | 82 | 3.6% |
| Total | 2,306 | 100.0% |
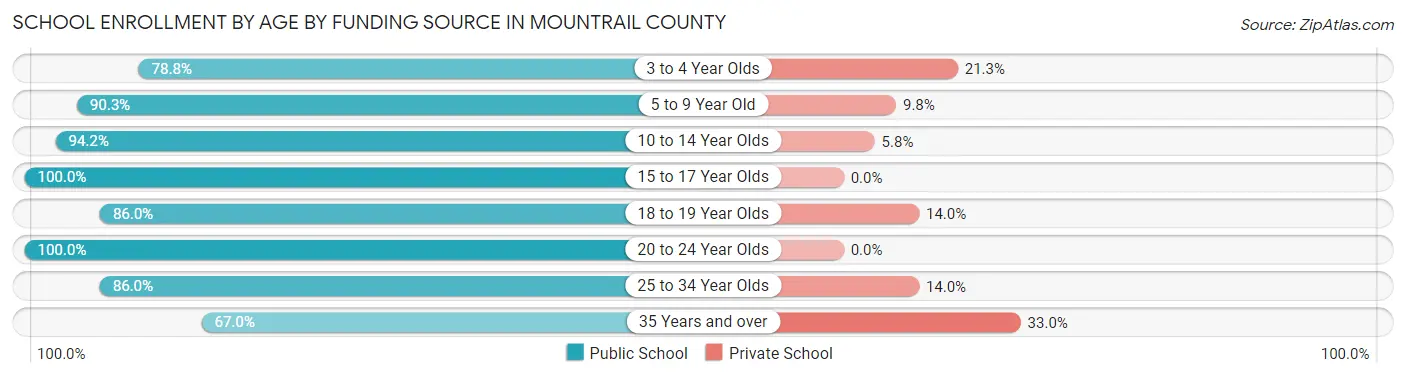
School Enrollment by Age by Funding Source in Mountrail County
Out of a total of 2,306 students who are enrolled in schools in Mountrail County, 191 (8.3%) attend a private institution, while the remaining 2,115 (91.7%) are enrolled in public schools. The age group of 35 years and over has the highest likelihood of being enrolled in private schools, with 30 (33.0% in the age bracket) enrolled. Conversely, the age group of 15 to 17 year olds has the lowest likelihood of being enrolled in a private school, with 358 (100.0% in the age bracket) attending a public institution.
| Age Bracket | Public School | Private School |
| 3 to 4 Year Olds | 63 (78.7%) | 17 (21.2%) |
| 5 to 9 Year Old | 620 (90.2%) | 67 (9.8%) |
| 10 to 14 Year Olds | 637 (94.2%) | 39 (5.8%) |
| 15 to 17 Year Olds | 358 (100.0%) | 0 (0.0%) |
| 18 to 19 Year Olds | 147 (86.0%) | 24 (14.0%) |
| 20 to 24 Year Olds | 136 (100.0%) | 0 (0.0%) |
| 25 to 34 Year Olds | 92 (86.0%) | 15 (14.0%) |
| 35 Years and over | 61 (67.0%) | 30 (33.0%) |
| Total | 2,115 (91.7%) | 191 (8.3%) |
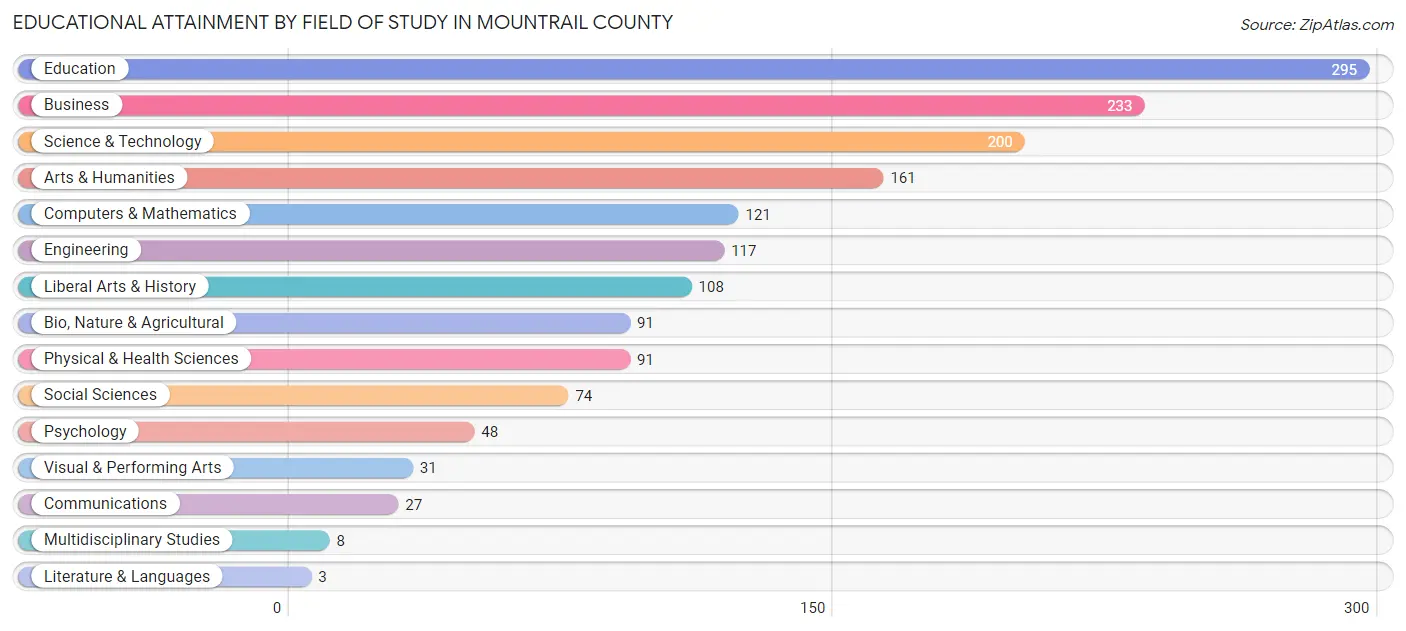
Educational Attainment by Field of Study in Mountrail County
Education (295 | 18.3%), business (233 | 14.5%), science & technology (200 | 12.4%), arts & humanities (161 | 10.0%), and computers & mathematics (121 | 7.5%) are the most common fields of study among 1,608 individuals in Mountrail County who have obtained a bachelor's degree or higher.
| Field of Study | # Graduates | % Graduates |
| Computers & Mathematics | 121 | 7.5% |
| Bio, Nature & Agricultural | 91 | 5.7% |
| Physical & Health Sciences | 91 | 5.7% |
| Psychology | 48 | 3.0% |
| Social Sciences | 74 | 4.6% |
| Engineering | 117 | 7.3% |
| Multidisciplinary Studies | 8 | 0.5% |
| Science & Technology | 200 | 12.4% |
| Business | 233 | 14.5% |
| Education | 295 | 18.3% |
| Literature & Languages | 3 | 0.2% |
| Liberal Arts & History | 108 | 6.7% |
| Visual & Performing Arts | 31 | 1.9% |
| Communications | 27 | 1.7% |
| Arts & Humanities | 161 | 10.0% |
| Total | 1,608 | 100.0% |
Transportation & Commute in Mountrail County
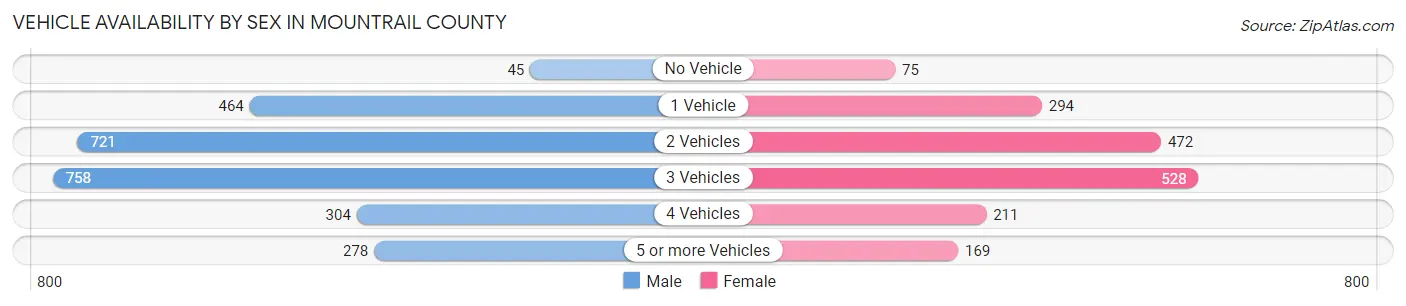
Vehicle Availability by Sex in Mountrail County
The most prevalent vehicle ownership categories in Mountrail County are males with 3 vehicles (758, accounting for 29.5%) and females with 3 vehicles (528, making up 43.3%).
| Vehicles Available | Male | Female |
| No Vehicle | 45 (1.8%) | 75 (4.3%) |
| 1 Vehicle | 464 (18.0%) | 294 (16.8%) |
| 2 Vehicles | 721 (28.1%) | 472 (27.0%) |
| 3 Vehicles | 758 (29.5%) | 528 (30.2%) |
| 4 Vehicles | 304 (11.8%) | 211 (12.1%) |
| 5 or more Vehicles | 278 (10.8%) | 169 (9.7%) |
| Total | 2,570 (100.0%) | 1,749 (100.0%) |
Commute Time in Mountrail County
The most frequently occuring commute durations in Mountrail County are 5 to 9 minutes (917 commuters, 22.3%), less than 5 minutes (760 commuters, 18.5%), and 10 to 14 minutes (521 commuters, 12.7%).
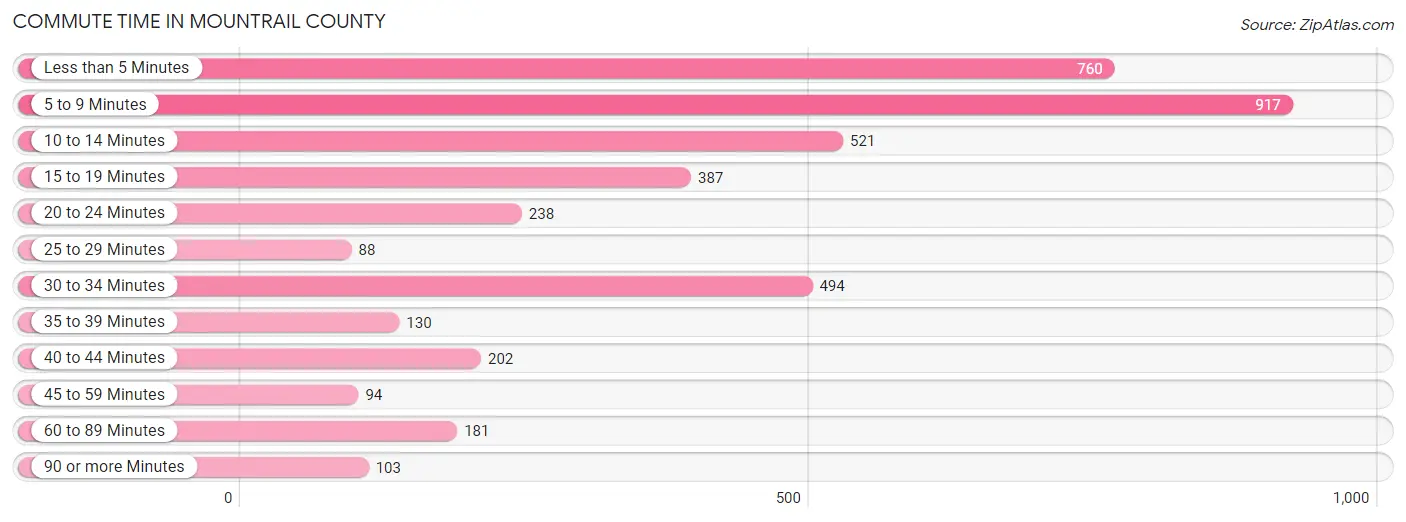
| Commute Time | # Commuters | % Commuters |
| Less than 5 Minutes | 760 | 18.5% |
| 5 to 9 Minutes | 917 | 22.3% |
| 10 to 14 Minutes | 521 | 12.7% |
| 15 to 19 Minutes | 387 | 9.4% |
| 20 to 24 Minutes | 238 | 5.8% |
| 25 to 29 Minutes | 88 | 2.1% |
| 30 to 34 Minutes | 494 | 12.0% |
| 35 to 39 Minutes | 130 | 3.2% |
| 40 to 44 Minutes | 202 | 4.9% |
| 45 to 59 Minutes | 94 | 2.3% |
| 60 to 89 Minutes | 181 | 4.4% |
| 90 or more Minutes | 103 | 2.5% |
Commute Time by Sex in Mountrail County
The most common commute times in Mountrail County are less than 5 minutes (479 commuters, 19.4%) for males and 5 to 9 minutes (455 commuters, 27.6%) for females.
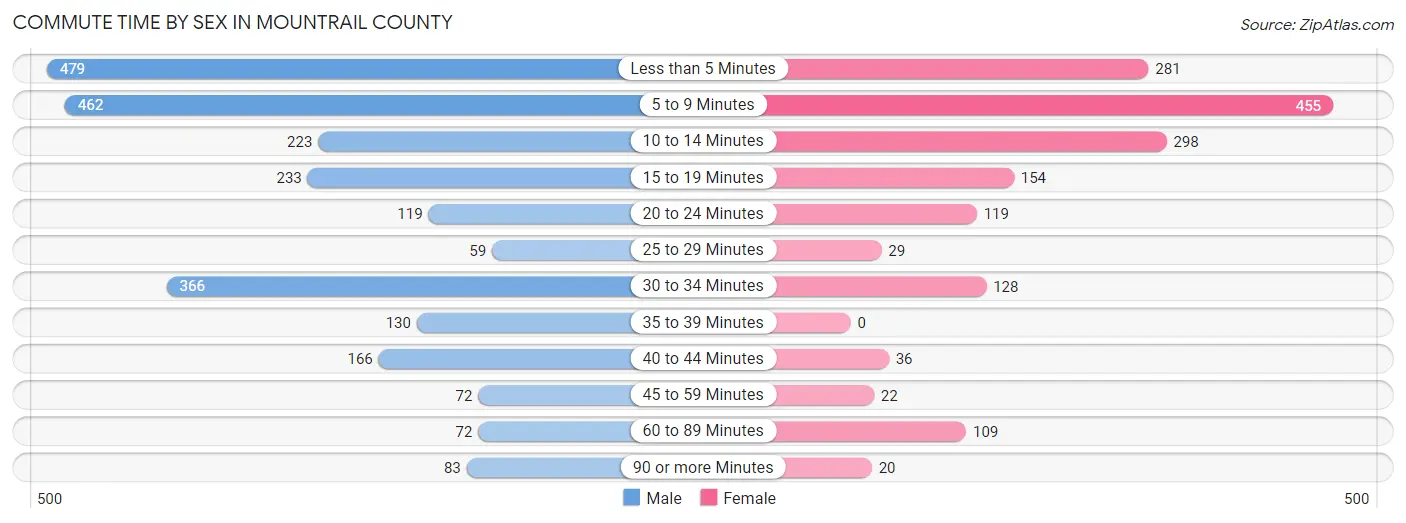
| Commute Time | Male | Female |
| Less than 5 Minutes | 479 (19.4%) | 281 (17.0%) |
| 5 to 9 Minutes | 462 (18.8%) | 455 (27.6%) |
| 10 to 14 Minutes | 223 (9.0%) | 298 (18.0%) |
| 15 to 19 Minutes | 233 (9.5%) | 154 (9.3%) |
| 20 to 24 Minutes | 119 (4.8%) | 119 (7.2%) |
| 25 to 29 Minutes | 59 (2.4%) | 29 (1.8%) |
| 30 to 34 Minutes | 366 (14.8%) | 128 (7.7%) |
| 35 to 39 Minutes | 130 (5.3%) | 0 (0.0%) |
| 40 to 44 Minutes | 166 (6.7%) | 36 (2.2%) |
| 45 to 59 Minutes | 72 (2.9%) | 22 (1.3%) |
| 60 to 89 Minutes | 72 (2.9%) | 109 (6.6%) |
| 90 or more Minutes | 83 (3.4%) | 20 (1.2%) |
Time of Departure to Work by Sex in Mountrail County
The most frequent times of departure to work in Mountrail County are 6:30 AM to 6:59 AM (395, 16.0%) for males and 7:30 AM to 7:59 AM (331, 20.1%) for females.
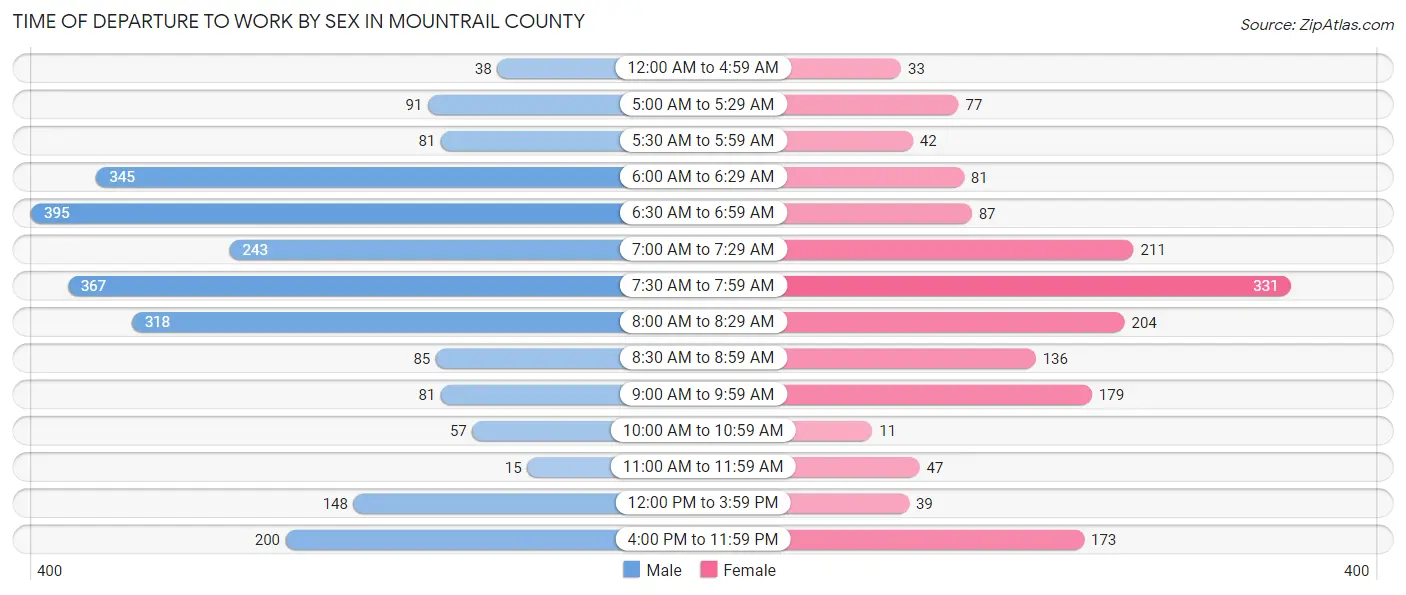
| Time of Departure | Male | Female |
| 12:00 AM to 4:59 AM | 38 (1.5%) | 33 (2.0%) |
| 5:00 AM to 5:29 AM | 91 (3.7%) | 77 (4.7%) |
| 5:30 AM to 5:59 AM | 81 (3.3%) | 42 (2.5%) |
| 6:00 AM to 6:29 AM | 345 (14.0%) | 81 (4.9%) |
| 6:30 AM to 6:59 AM | 395 (16.0%) | 87 (5.3%) |
| 7:00 AM to 7:29 AM | 243 (9.9%) | 211 (12.8%) |
| 7:30 AM to 7:59 AM | 367 (14.9%) | 331 (20.1%) |
| 8:00 AM to 8:29 AM | 318 (12.9%) | 204 (12.4%) |
| 8:30 AM to 8:59 AM | 85 (3.5%) | 136 (8.2%) |
| 9:00 AM to 9:59 AM | 81 (3.3%) | 179 (10.8%) |
| 10:00 AM to 10:59 AM | 57 (2.3%) | 11 (0.7%) |
| 11:00 AM to 11:59 AM | 15 (0.6%) | 47 (2.9%) |
| 12:00 PM to 3:59 PM | 148 (6.0%) | 39 (2.4%) |
| 4:00 PM to 11:59 PM | 200 (8.1%) | 173 (10.5%) |
| Total | 2,464 (100.0%) | 1,651 (100.0%) |
Housing Occupancy in Mountrail County
Occupancy by Ownership in Mountrail County
Of the total 3,539 dwellings in Mountrail County, owner-occupied units account for 2,145 (60.6%), while renter-occupied units make up 1,394 (39.4%).
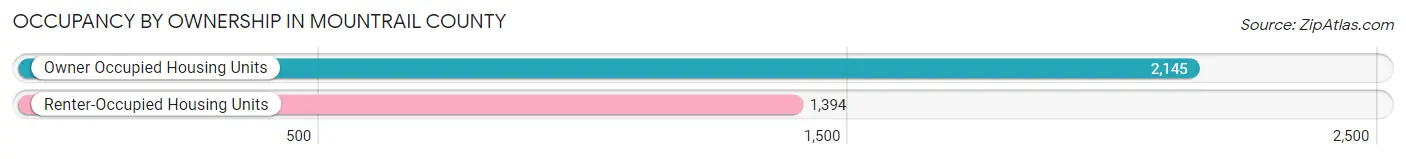
| Occupancy | # Housing Units | % Housing Units |
| Owner Occupied Housing Units | 2,145 | 60.6% |
| Renter-Occupied Housing Units | 1,394 | 39.4% |
| Total Occupied Housing Units | 3,539 | 100.0% |
Occupancy by Household Size in Mountrail County
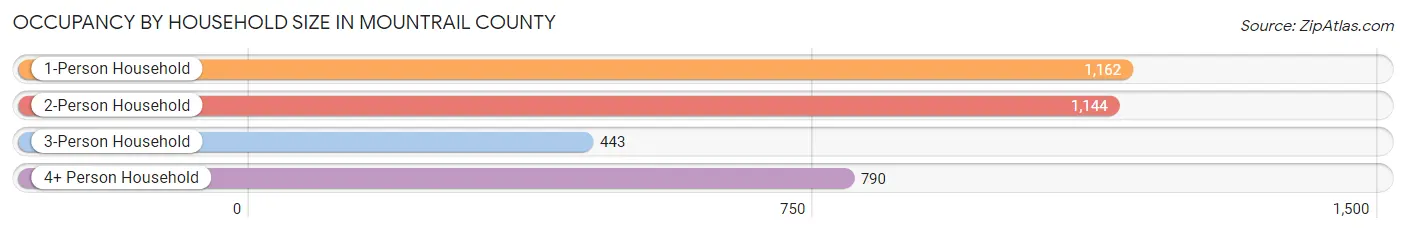
| Household Size | # Housing Units | % Housing Units |
| 1-Person Household | 1,162 | 32.8% |
| 2-Person Household | 1,144 | 32.3% |
| 3-Person Household | 443 | 12.5% |
| 4+ Person Household | 790 | 22.3% |
| Total Housing Units | 3,539 | 100.0% |
Occupancy by Ownership by Household Size in Mountrail County
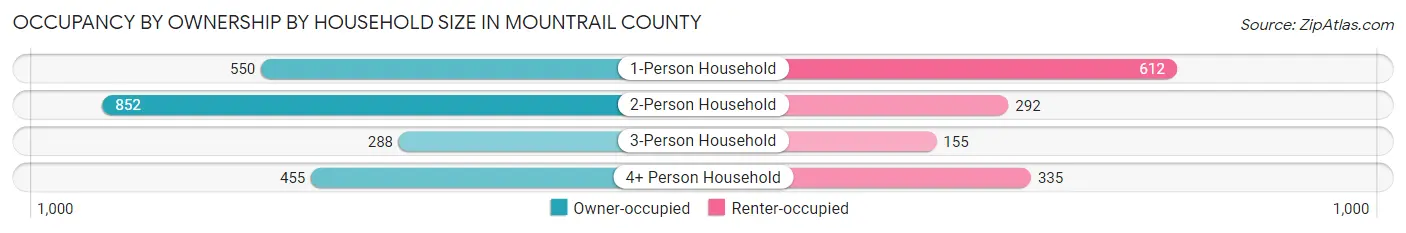
| Household Size | Owner-occupied | Renter-occupied |
| 1-Person Household | 550 (47.3%) | 612 (52.7%) |
| 2-Person Household | 852 (74.5%) | 292 (25.5%) |
| 3-Person Household | 288 (65.0%) | 155 (35.0%) |
| 4+ Person Household | 455 (57.6%) | 335 (42.4%) |
| Total Housing Units | 2,145 (60.6%) | 1,394 (39.4%) |
Occupancy by Educational Attainment in Mountrail County
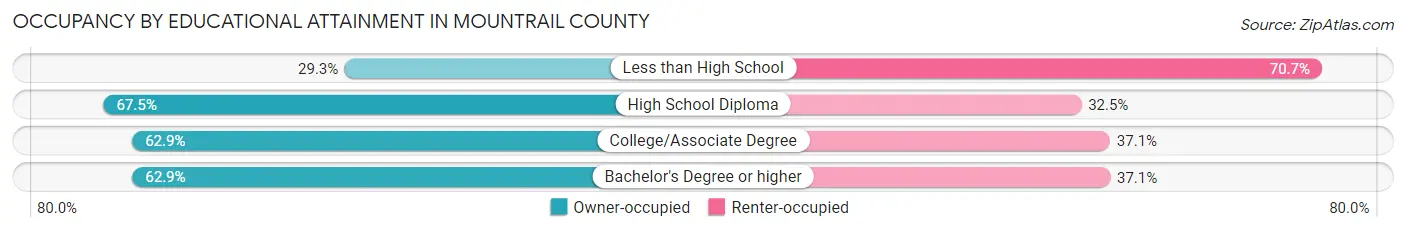
| Household Size | Owner-occupied | Renter-occupied |
| Less than High School | 112 (29.3%) | 270 (70.7%) |
| High School Diploma | 689 (67.5%) | 332 (32.5%) |
| College/Associate Degree | 854 (62.9%) | 503 (37.1%) |
| Bachelor's Degree or higher | 490 (62.9%) | 289 (37.1%) |
Occupancy by Age of Householder in Mountrail County
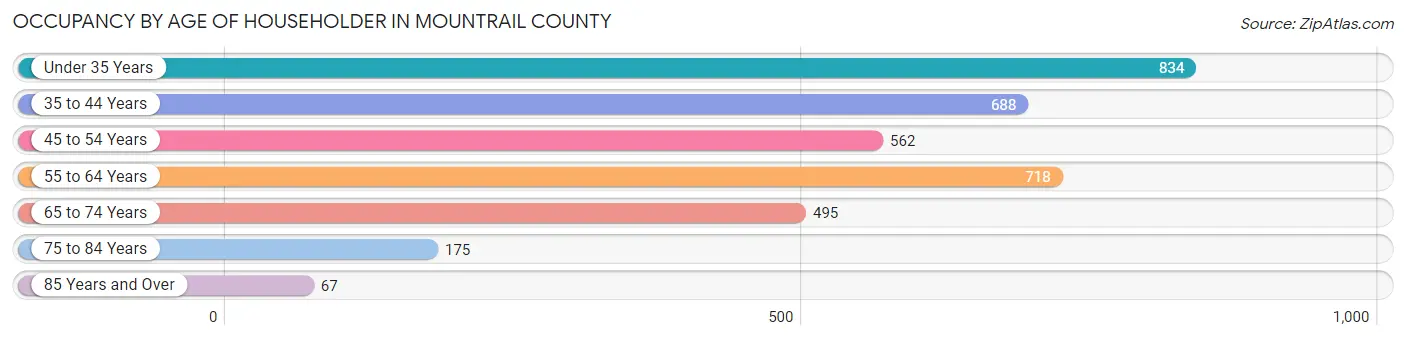
| Age Bracket | # Households | % Households |
| Under 35 Years | 834 | 23.6% |
| 35 to 44 Years | 688 | 19.4% |
| 45 to 54 Years | 562 | 15.9% |
| 55 to 64 Years | 718 | 20.3% |
| 65 to 74 Years | 495 | 14.0% |
| 75 to 84 Years | 175 | 4.9% |
| 85 Years and Over | 67 | 1.9% |
| Total | 3,539 | 100.0% |
Housing Finances in Mountrail County
Median Income by Occupancy in Mountrail County
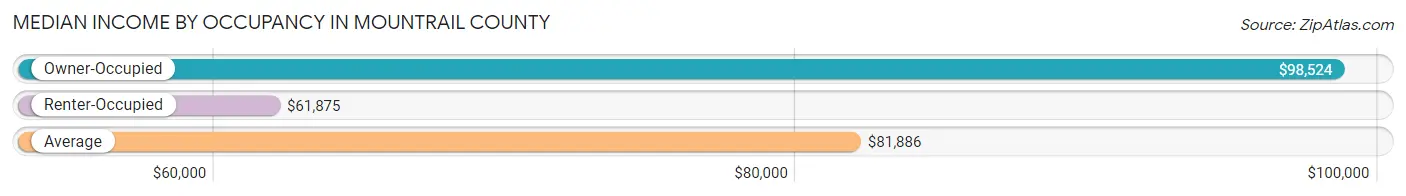
| Occupancy Type | # Households | Median Income |
| Owner-Occupied | 2,145 (60.6%) | $98,524 |
| Renter-Occupied | 1,394 (39.4%) | $61,875 |
| Average | 3,539 (100.0%) | $81,886 |
Occupancy by Householder Income Bracket in Mountrail County
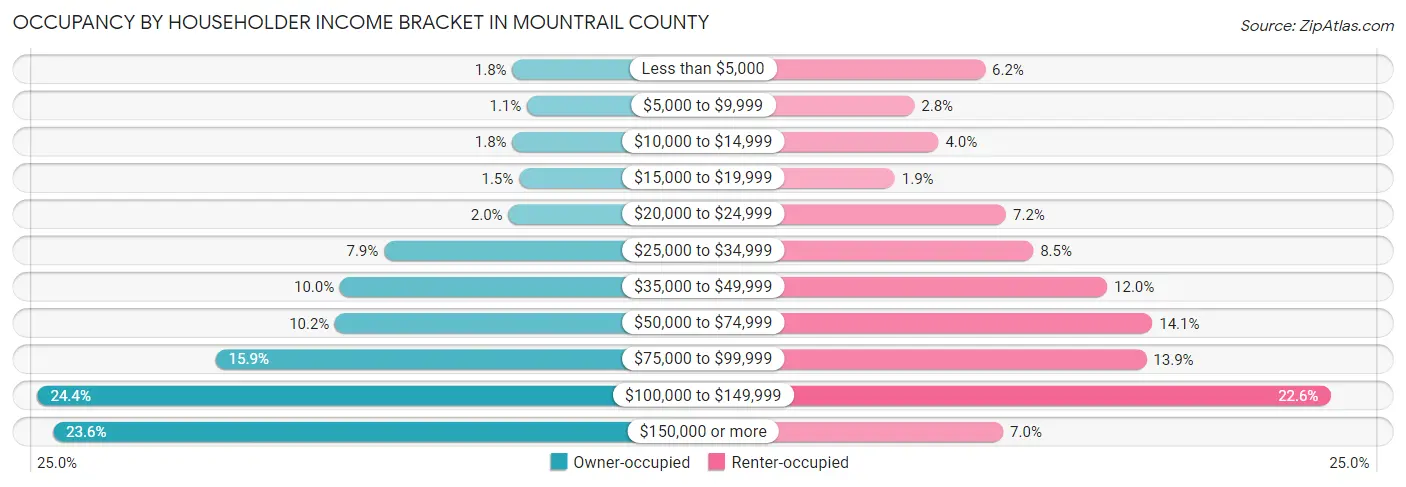
| Income Bracket | Owner-occupied | Renter-occupied |
| Less than $5,000 | 38 (1.8%) | 86 (6.2%) |
| $5,000 to $9,999 | 23 (1.1%) | 39 (2.8%) |
| $10,000 to $14,999 | 38 (1.8%) | 55 (4.0%) |
| $15,000 to $19,999 | 31 (1.5%) | 26 (1.9%) |
| $20,000 to $24,999 | 42 (2.0%) | 100 (7.2%) |
| $25,000 to $34,999 | 169 (7.9%) | 118 (8.5%) |
| $35,000 to $49,999 | 214 (10.0%) | 167 (12.0%) |
| $50,000 to $74,999 | 219 (10.2%) | 197 (14.1%) |
| $75,000 to $99,999 | 341 (15.9%) | 193 (13.9%) |
| $100,000 to $149,999 | 523 (24.4%) | 315 (22.6%) |
| $150,000 or more | 507 (23.6%) | 98 (7.0%) |
| Total | 2,145 (100.0%) | 1,394 (100.0%) |
Monthly Housing Cost Tiers in Mountrail County
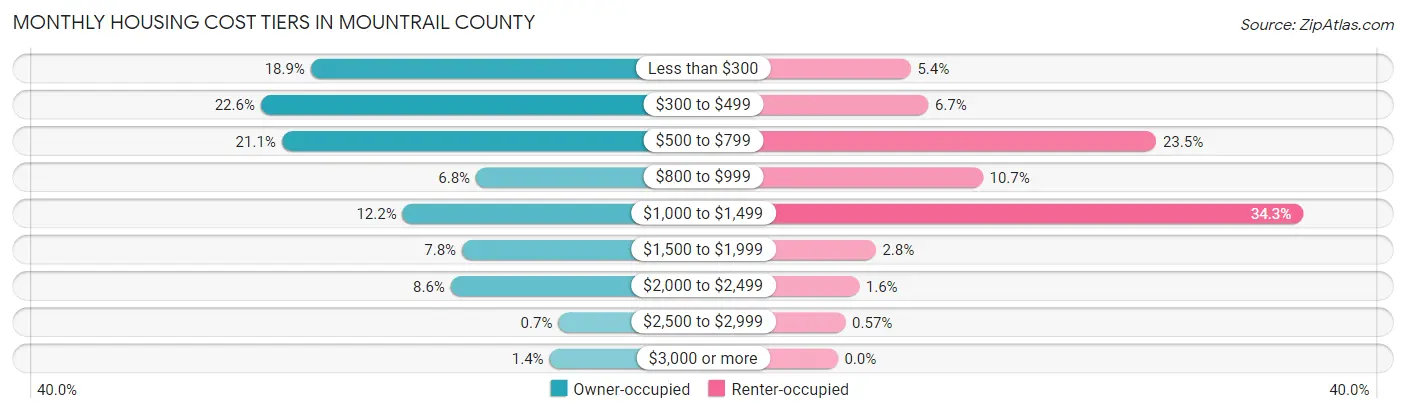
| Monthly Cost | Owner-occupied | Renter-occupied |
| Less than $300 | 406 (18.9%) | 75 (5.4%) |
| $300 to $499 | 485 (22.6%) | 93 (6.7%) |
| $500 to $799 | 452 (21.1%) | 327 (23.5%) |
| $800 to $999 | 145 (6.8%) | 149 (10.7%) |
| $1,000 to $1,499 | 261 (12.2%) | 478 (34.3%) |
| $1,500 to $1,999 | 167 (7.8%) | 39 (2.8%) |
| $2,000 to $2,499 | 185 (8.6%) | 22 (1.6%) |
| $2,500 to $2,999 | 15 (0.7%) | 8 (0.6%) |
| $3,000 or more | 29 (1.3%) | 0 (0.0%) |
| Total | 2,145 (100.0%) | 1,394 (100.0%) |
Physical Housing Characteristics in Mountrail County
Housing Structures in Mountrail County
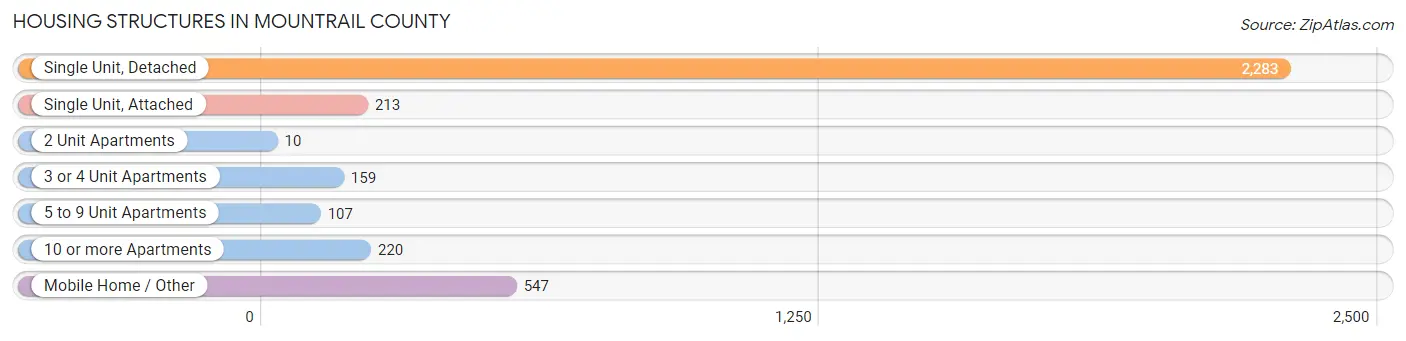
| Structure Type | # Housing Units | % Housing Units |
| Single Unit, Detached | 2,283 | 64.5% |
| Single Unit, Attached | 213 | 6.0% |
| 2 Unit Apartments | 10 | 0.3% |
| 3 or 4 Unit Apartments | 159 | 4.5% |
| 5 to 9 Unit Apartments | 107 | 3.0% |
| 10 or more Apartments | 220 | 6.2% |
| Mobile Home / Other | 547 | 15.5% |
| Total | 3,539 | 100.0% |
Housing Structures by Occupancy in Mountrail County
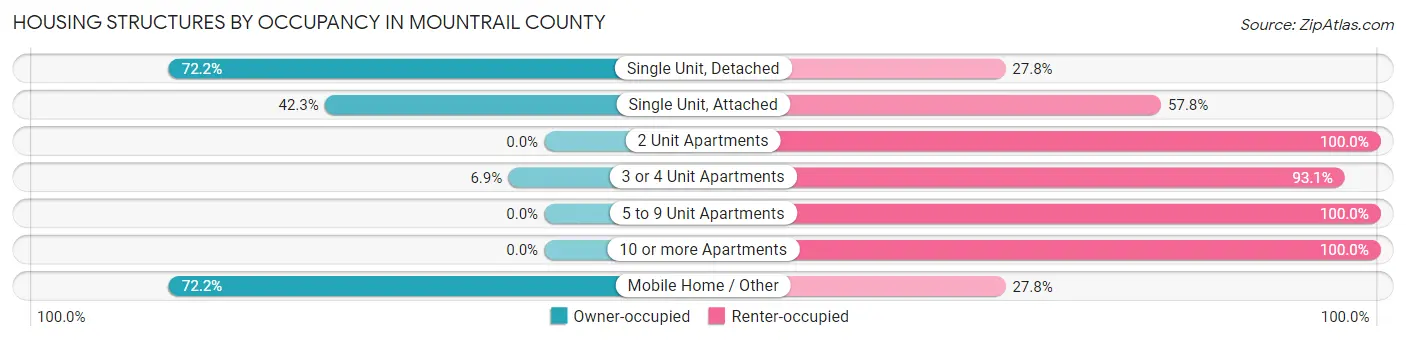
| Structure Type | Owner-occupied | Renter-occupied |
| Single Unit, Detached | 1,649 (72.2%) | 634 (27.8%) |
| Single Unit, Attached | 90 (42.2%) | 123 (57.8%) |
| 2 Unit Apartments | 0 (0.0%) | 10 (100.0%) |
| 3 or 4 Unit Apartments | 11 (6.9%) | 148 (93.1%) |
| 5 to 9 Unit Apartments | 0 (0.0%) | 107 (100.0%) |
| 10 or more Apartments | 0 (0.0%) | 220 (100.0%) |
| Mobile Home / Other | 395 (72.2%) | 152 (27.8%) |
| Total | 2,145 (60.6%) | 1,394 (39.4%) |
Housing Structures by Number of Rooms in Mountrail County
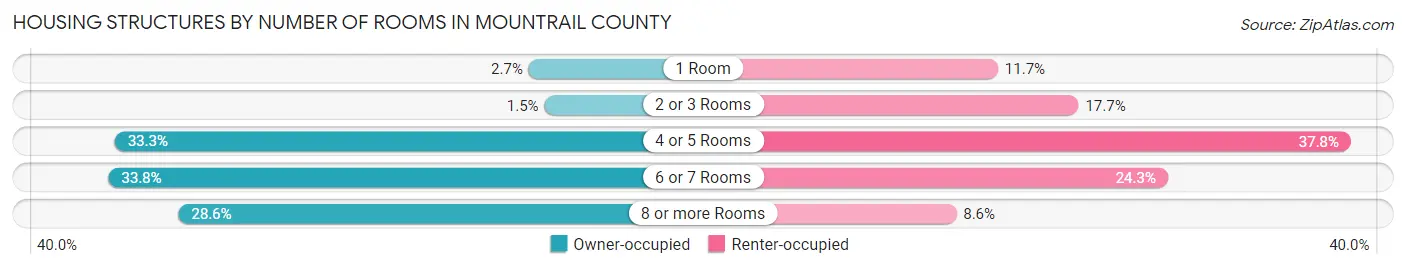
| Number of Rooms | Owner-occupied | Renter-occupied |
| 1 Room | 58 (2.7%) | 163 (11.7%) |
| 2 or 3 Rooms | 33 (1.5%) | 246 (17.6%) |
| 4 or 5 Rooms | 715 (33.3%) | 527 (37.8%) |
| 6 or 7 Rooms | 725 (33.8%) | 338 (24.2%) |
| 8 or more Rooms | 614 (28.6%) | 120 (8.6%) |
| Total | 2,145 (100.0%) | 1,394 (100.0%) |
Housing Structure by Heating Type in Mountrail County
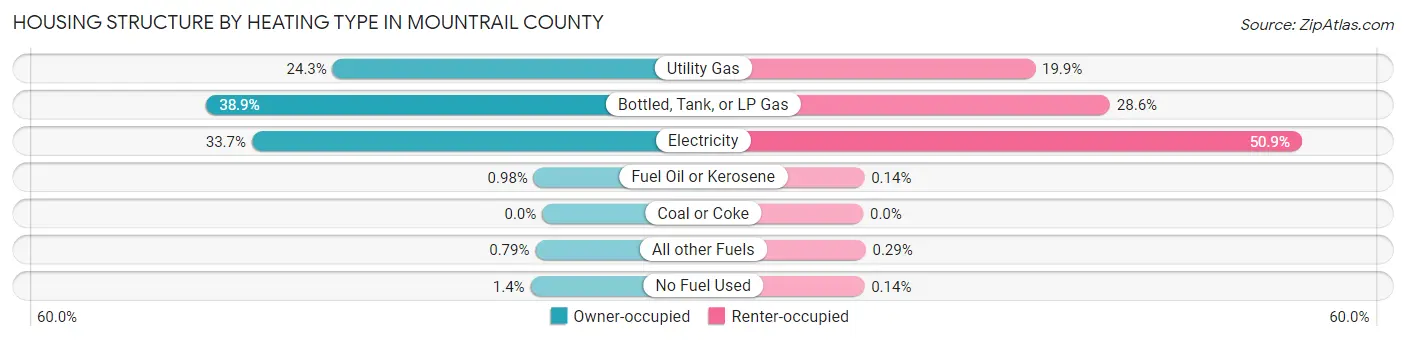
| Heating Type | Owner-occupied | Renter-occupied |
| Utility Gas | 521 (24.3%) | 278 (19.9%) |
| Bottled, Tank, or LP Gas | 835 (38.9%) | 399 (28.6%) |
| Electricity | 722 (33.7%) | 709 (50.9%) |
| Fuel Oil or Kerosene | 21 (1.0%) | 2 (0.1%) |
| Coal or Coke | 0 (0.0%) | 0 (0.0%) |
| All other Fuels | 17 (0.8%) | 4 (0.3%) |
| No Fuel Used | 29 (1.3%) | 2 (0.1%) |
| Total | 2,145 (100.0%) | 1,394 (100.0%) |
Household Vehicle Usage in Mountrail County
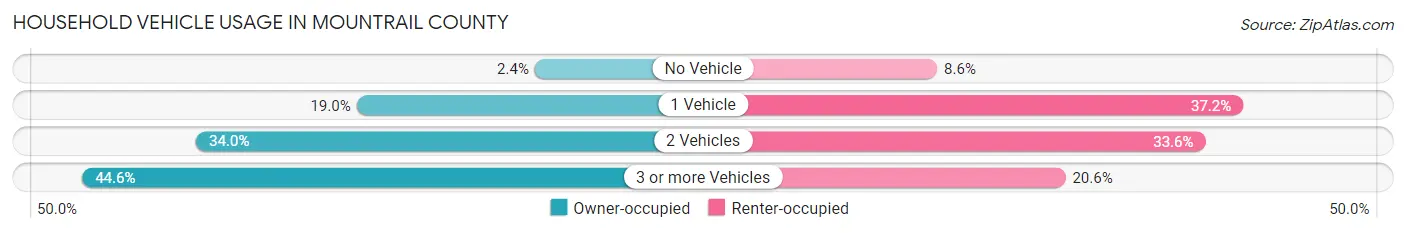
| Vehicles per Household | Owner-occupied | Renter-occupied |
| No Vehicle | 51 (2.4%) | 120 (8.6%) |
| 1 Vehicle | 408 (19.0%) | 518 (37.2%) |
| 2 Vehicles | 729 (34.0%) | 469 (33.6%) |
| 3 or more Vehicles | 957 (44.6%) | 287 (20.6%) |
| Total | 2,145 (100.0%) | 1,394 (100.0%) |
Real Estate & Mortgages in Mountrail County
Real Estate and Mortgage Overview in Mountrail County
| Characteristic | Without Mortgage | With Mortgage |
| Housing Units | 1,442 | 703 |
| Median Property Value | $179,800 | $255,800 |
| Median Household Income | $91,136 | $185 |
| Monthly Housing Costs | $438 | $18 |
| Real Estate Taxes | $798 | $109 |
Property Value by Mortgage Status in Mountrail County
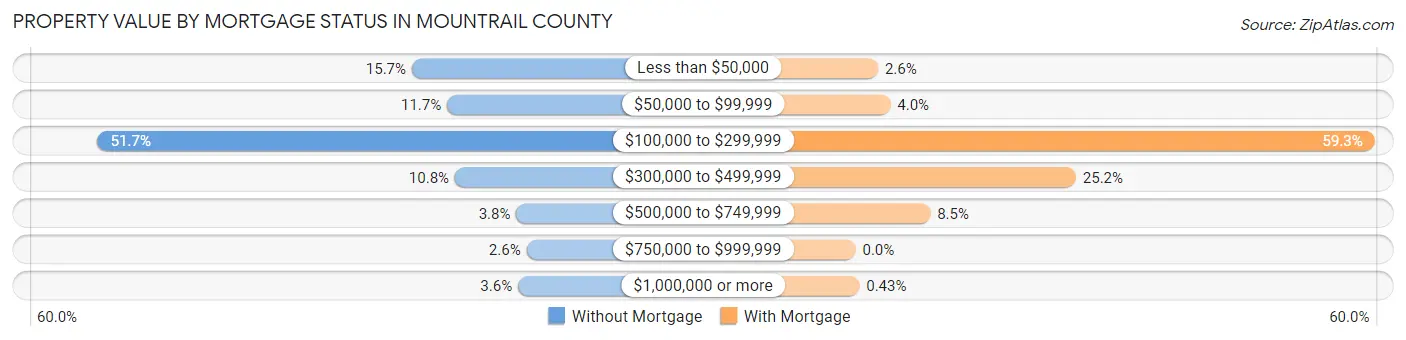
| Property Value | Without Mortgage | With Mortgage |
| Less than $50,000 | 227 (15.7%) | 18 (2.6%) |
| $50,000 to $99,999 | 169 (11.7%) | 28 (4.0%) |
| $100,000 to $299,999 | 745 (51.7%) | 417 (59.3%) |
| $300,000 to $499,999 | 156 (10.8%) | 177 (25.2%) |
| $500,000 to $749,999 | 55 (3.8%) | 60 (8.5%) |
| $750,000 to $999,999 | 38 (2.6%) | 0 (0.0%) |
| $1,000,000 or more | 52 (3.6%) | 3 (0.4%) |
| Total | 1,442 (100.0%) | 703 (100.0%) |
Household Income by Mortgage Status in Mountrail County
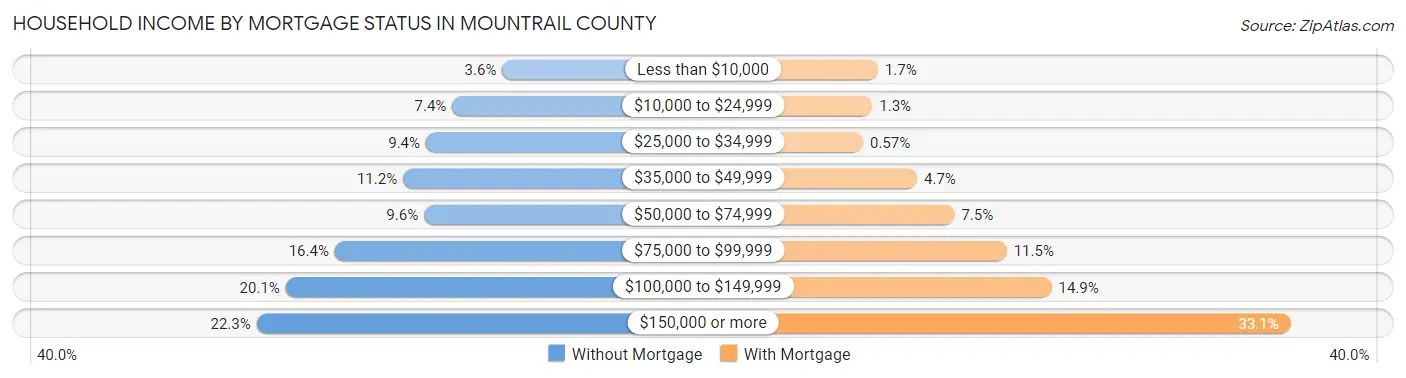
| Household Income | Without Mortgage | With Mortgage |
| Less than $10,000 | 52 (3.6%) | 12 (1.7%) |
| $10,000 to $24,999 | 107 (7.4%) | 9 (1.3%) |
| $25,000 to $34,999 | 136 (9.4%) | 4 (0.6%) |
| $35,000 to $49,999 | 161 (11.2%) | 33 (4.7%) |
| $50,000 to $74,999 | 138 (9.6%) | 53 (7.5%) |
| $75,000 to $99,999 | 236 (16.4%) | 81 (11.5%) |
| $100,000 to $149,999 | 290 (20.1%) | 105 (14.9%) |
| $150,000 or more | 322 (22.3%) | 233 (33.1%) |
| Total | 1,442 (100.0%) | 703 (100.0%) |
Property Value to Household Income Ratio in Mountrail County
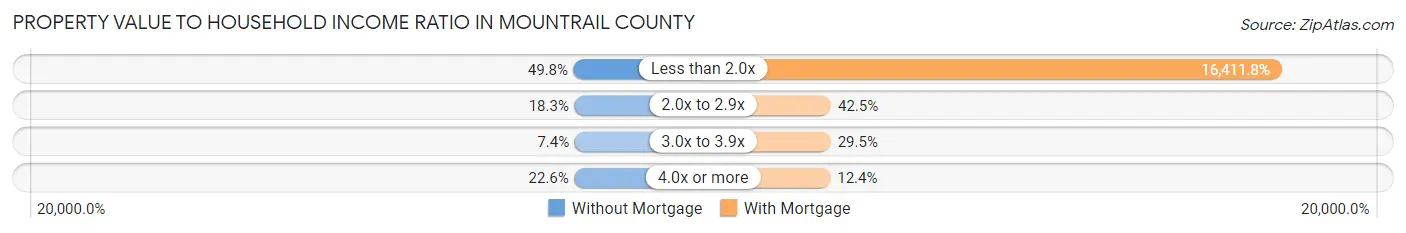
| Value-to-Income Ratio | Without Mortgage | With Mortgage |
| Less than 2.0x | 718 (49.8%) | 115,375 (16,411.8%) |
| 2.0x to 2.9x | 264 (18.3%) | 299 (42.5%) |
| 3.0x to 3.9x | 107 (7.4%) | 207 (29.4%) |
| 4.0x or more | 326 (22.6%) | 87 (12.4%) |
| Total | 1,442 (100.0%) | 703 (100.0%) |
Real Estate Taxes by Mortgage Status in Mountrail County
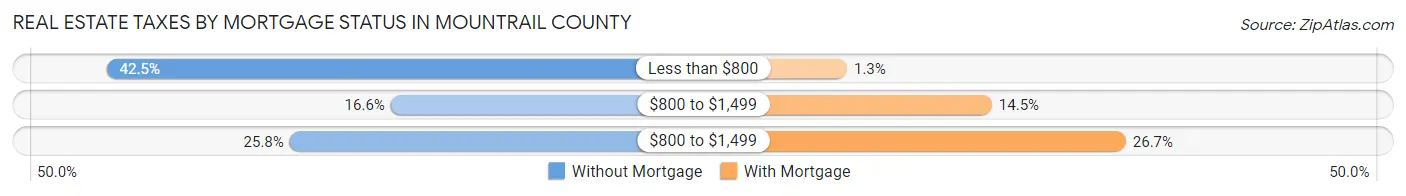
| Property Taxes | Without Mortgage | With Mortgage |
| Less than $800 | 613 (42.5%) | 9 (1.3%) |
| $800 to $1,499 | 239 (16.6%) | 102 (14.5%) |
| $800 to $1,499 | 372 (25.8%) | 188 (26.7%) |
| Total | 1,442 (100.0%) | 703 (100.0%) |
Health & Disability in Mountrail County
Health Insurance Coverage by Age in Mountrail County
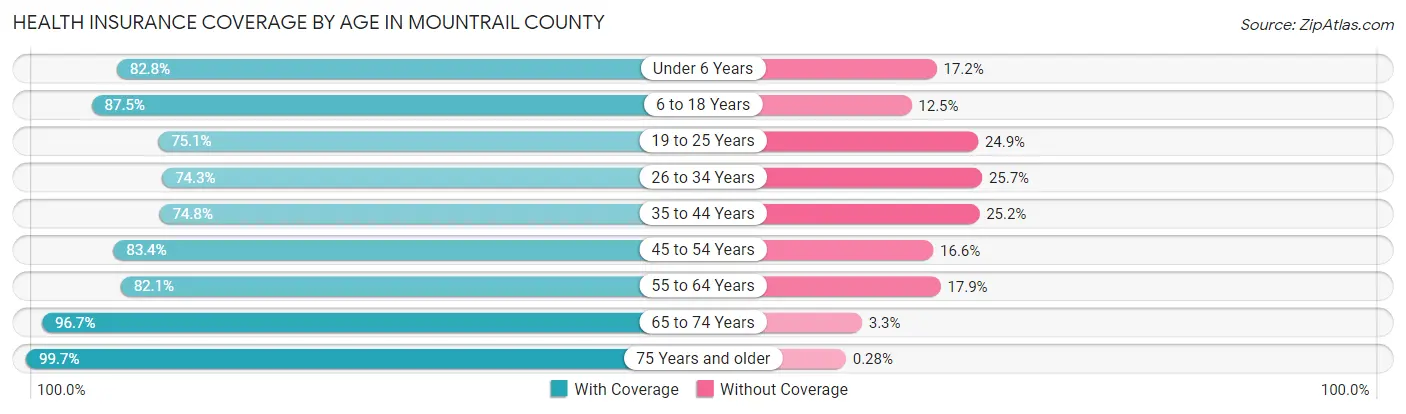
| Age Bracket | With Coverage | Without Coverage |
| Under 6 Years | 852 (82.8%) | 177 (17.2%) |
| 6 to 18 Years | 1,673 (87.5%) | 239 (12.5%) |
| 19 to 25 Years | 461 (75.1%) | 153 (24.9%) |
| 26 to 34 Years | 973 (74.3%) | 336 (25.7%) |
| 35 to 44 Years | 949 (74.8%) | 319 (25.2%) |
| 45 to 54 Years | 907 (83.4%) | 180 (16.6%) |
| 55 to 64 Years | 989 (82.1%) | 216 (17.9%) |
| 65 to 74 Years | 771 (96.7%) | 26 (3.3%) |
| 75 Years and older | 353 (99.7%) | 1 (0.3%) |
| Total | 7,928 (82.8%) | 1,647 (17.2%) |
Health Insurance Coverage by Citizenship Status in Mountrail County
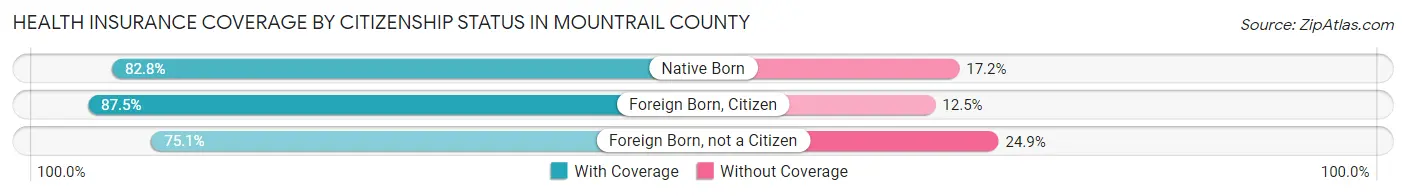
| Citizenship Status | With Coverage | Without Coverage |
| Native Born | 852 (82.8%) | 177 (17.2%) |
| Foreign Born, Citizen | 1,673 (87.5%) | 239 (12.5%) |
| Foreign Born, not a Citizen | 461 (75.1%) | 153 (24.9%) |
Health Insurance Coverage by Household Income in Mountrail County
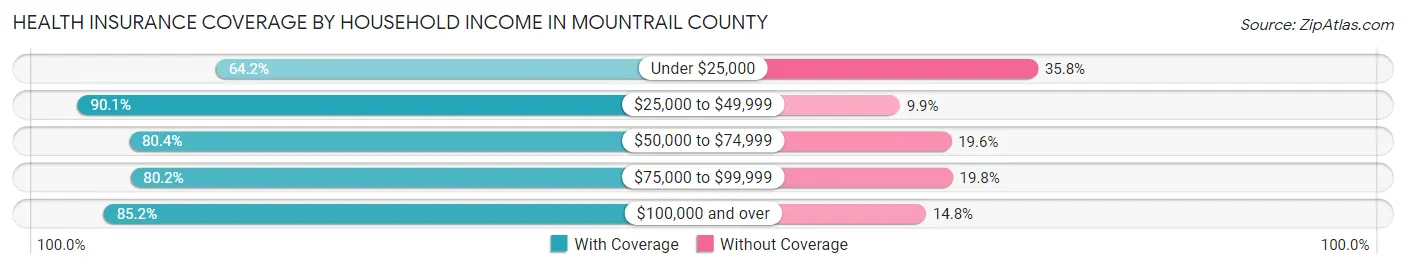
| Household Income | With Coverage | Without Coverage |
| Under $25,000 | 597 (64.2%) | 333 (35.8%) |
| $25,000 to $49,999 | 1,606 (90.1%) | 177 (9.9%) |
| $50,000 to $74,999 | 954 (80.4%) | 232 (19.6%) |
| $75,000 to $99,999 | 1,044 (80.2%) | 258 (19.8%) |
| $100,000 and over | 3,681 (85.2%) | 641 (14.8%) |
Public vs Private Health Insurance Coverage by Age in Mountrail County
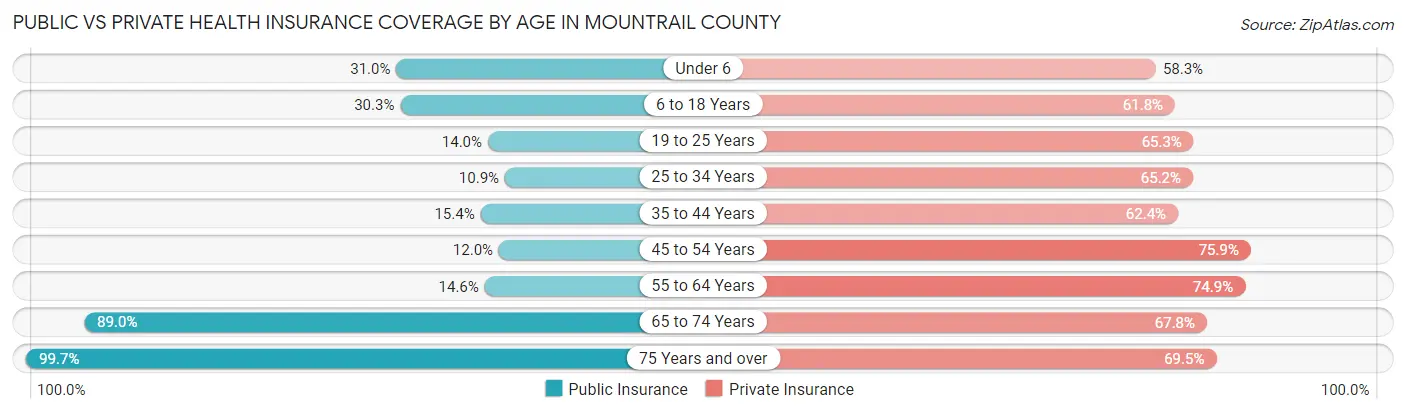
| Age Bracket | Public Insurance | Private Insurance |
| Under 6 | 319 (31.0%) | 600 (58.3%) |
| 6 to 18 Years | 579 (30.3%) | 1,182 (61.8%) |
| 19 to 25 Years | 86 (14.0%) | 401 (65.3%) |
| 25 to 34 Years | 142 (10.8%) | 853 (65.2%) |
| 35 to 44 Years | 195 (15.4%) | 791 (62.4%) |
| 45 to 54 Years | 130 (12.0%) | 825 (75.9%) |
| 55 to 64 Years | 176 (14.6%) | 902 (74.9%) |
| 65 to 74 Years | 709 (89.0%) | 540 (67.7%) |
| 75 Years and over | 353 (99.7%) | 246 (69.5%) |
| Total | 2,689 (28.1%) | 6,340 (66.2%) |
Disability Status by Sex by Age in Mountrail County
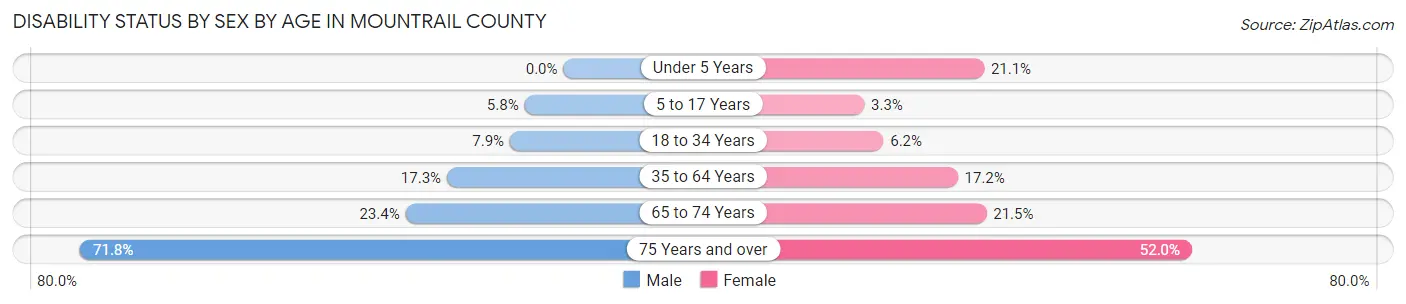
| Age Bracket | Male | Female |
| Under 5 Years | 0 (0.0%) | 80 (21.1%) |
| 5 to 17 Years | 55 (5.8%) | 32 (3.3%) |
| 18 to 34 Years | 91 (7.9%) | 60 (6.2%) |
| 35 to 64 Years | 333 (17.3%) | 281 (17.2%) |
| 65 to 74 Years | 94 (23.4%) | 85 (21.5%) |
| 75 Years and over | 127 (71.8%) | 92 (52.0%) |
Disability Class by Sex by Age in Mountrail County
Disability Class: Hearing Difficulty
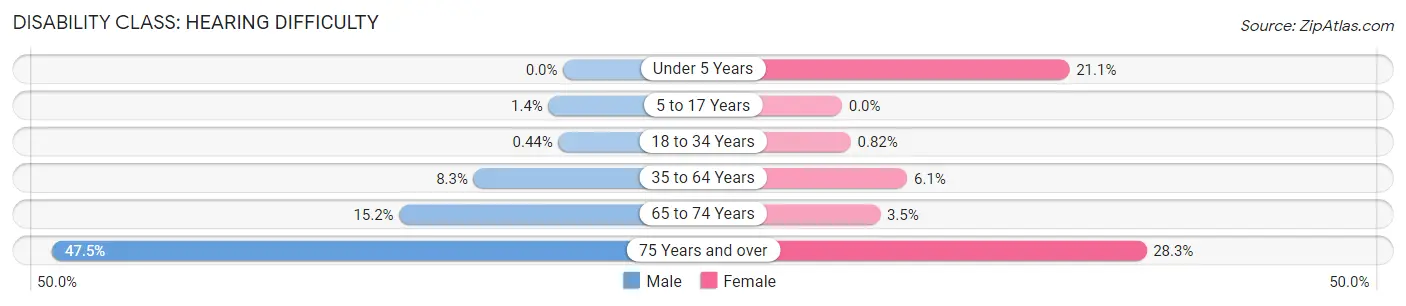
| Age Bracket | Male | Female |
| Under 5 Years | 0 (0.0%) | 80 (21.1%) |
| 5 to 17 Years | 13 (1.4%) | 0 (0.0%) |
| 18 to 34 Years | 5 (0.4%) | 8 (0.8%) |
| 35 to 64 Years | 160 (8.3%) | 99 (6.1%) |
| 65 to 74 Years | 61 (15.2%) | 14 (3.5%) |
| 75 Years and over | 84 (47.5%) | 50 (28.2%) |
Disability Class: Vision Difficulty
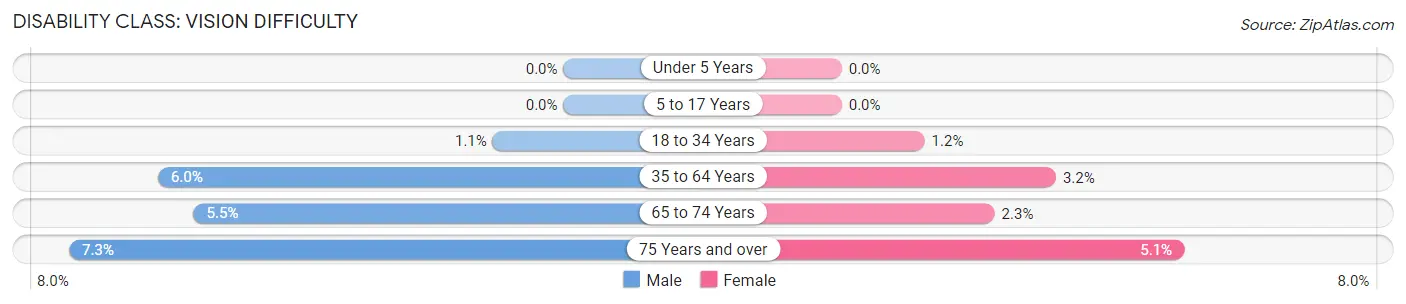
| Age Bracket | Male | Female |
| Under 5 Years | 0 (0.0%) | 0 (0.0%) |
| 5 to 17 Years | 0 (0.0%) | 0 (0.0%) |
| 18 to 34 Years | 12 (1.1%) | 12 (1.2%) |
| 35 to 64 Years | 116 (6.0%) | 52 (3.2%) |
| 65 to 74 Years | 22 (5.5%) | 9 (2.3%) |
| 75 Years and over | 13 (7.3%) | 9 (5.1%) |
Disability Class: Cognitive Difficulty
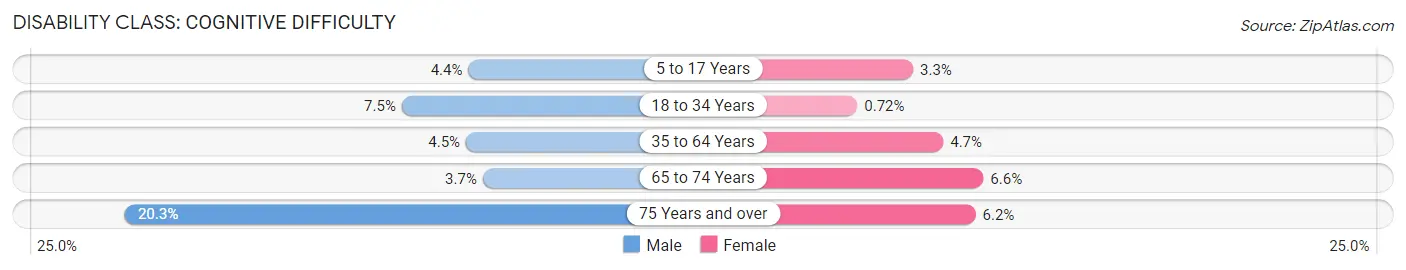
| Age Bracket | Male | Female |
| 5 to 17 Years | 42 (4.4%) | 32 (3.3%) |
| 18 to 34 Years | 86 (7.5%) | 7 (0.7%) |
| 35 to 64 Years | 87 (4.5%) | 77 (4.7%) |
| 65 to 74 Years | 15 (3.7%) | 26 (6.6%) |
| 75 Years and over | 36 (20.3%) | 11 (6.2%) |
Disability Class: Ambulatory Difficulty
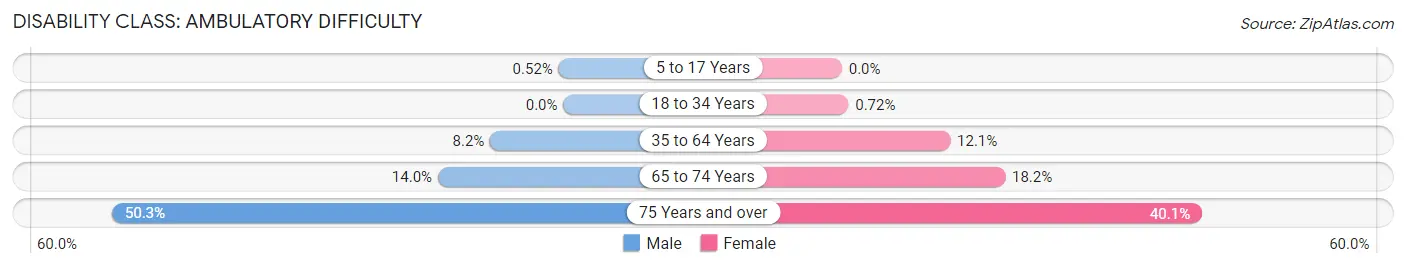
| Age Bracket | Male | Female |
| 5 to 17 Years | 5 (0.5%) | 0 (0.0%) |
| 18 to 34 Years | 0 (0.0%) | 7 (0.7%) |
| 35 to 64 Years | 157 (8.2%) | 197 (12.1%) |
| 65 to 74 Years | 56 (14.0%) | 72 (18.2%) |
| 75 Years and over | 89 (50.3%) | 71 (40.1%) |
Disability Class: Self-Care Difficulty
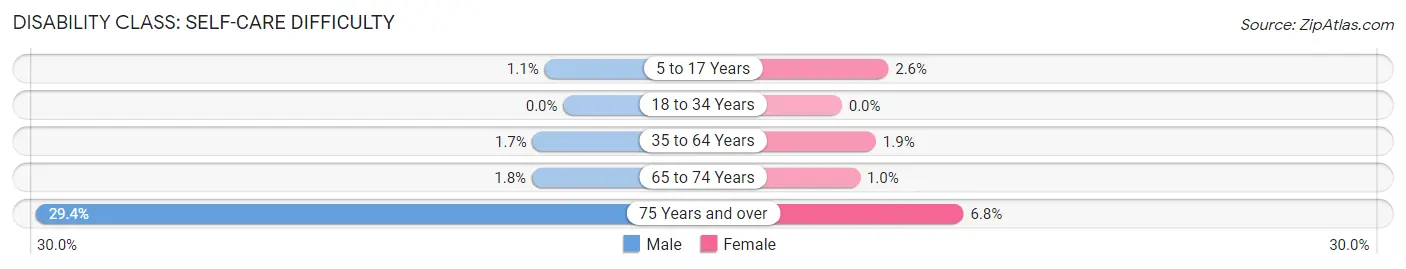
| Age Bracket | Male | Female |
| 5 to 17 Years | 10 (1.1%) | 25 (2.6%) |
| 18 to 34 Years | 0 (0.0%) | 0 (0.0%) |
| 35 to 64 Years | 33 (1.7%) | 31 (1.9%) |
| 65 to 74 Years | 7 (1.8%) | 4 (1.0%) |
| 75 Years and over | 52 (29.4%) | 12 (6.8%) |
Technology Access in Mountrail County
Computing Device Access in Mountrail County
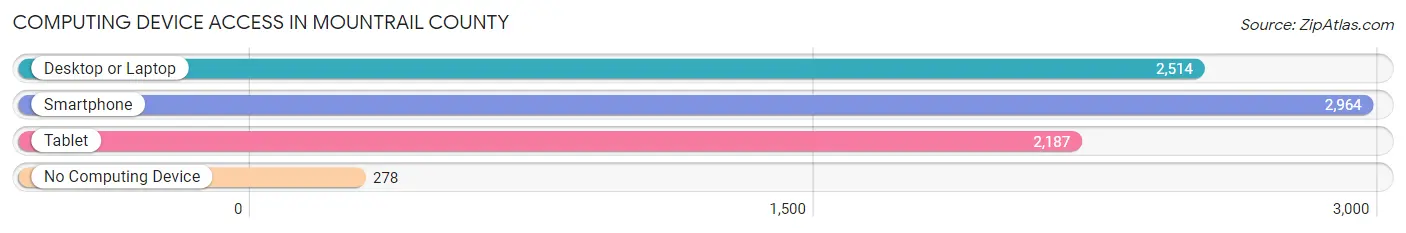
| Device Type | # Households | % Households |
| Desktop or Laptop | 2,514 | 71.0% |
| Smartphone | 2,964 | 83.8% |
| Tablet | 2,187 | 61.8% |
| No Computing Device | 278 | 7.9% |
| Total | 3,539 | 100.0% |
Internet Access in Mountrail County
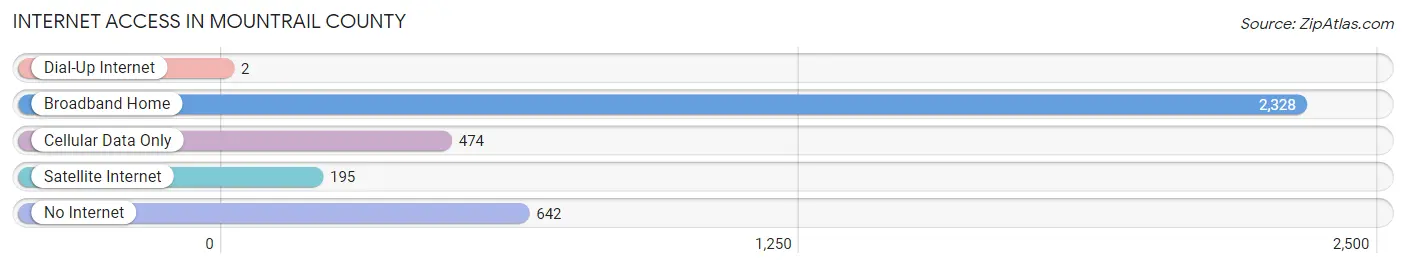
| Internet Type | # Households | % Households |
| Dial-Up Internet | 2 | 0.1% |
| Broadband Home | 2,328 | 65.8% |
| Cellular Data Only | 474 | 13.4% |
| Satellite Internet | 195 | 5.5% |
| No Internet | 642 | 18.1% |
| Total | 3,539 | 100.0% |
Mountrail County Summary
Introduction
Mountrail County is located in the northwestern part of North Dakota, and is the second largest county in the state. It is bordered by Burke County to the north, Williams County to the east, and Ward County to the south. The county seat is Stanley, and the county is named after the Mountrail River, which flows through the county. The county has a population of 8,637 people, according to the 2020 census.
History
Mountrail County was established in 1873, and was named after the Mountrail River, which flows through the county. The county was originally part of the Dakota Territory, and was part of the original land grant given to the Northern Pacific Railroad in 1864. The county was originally populated by Native Americans, and the first white settlers arrived in the area in the late 1800s. The county was officially organized in 1884, and the first county seat was located in the town of Parshall. The county seat was moved to Stanley in 1891.
The county has a rich history of agriculture, and the first settlers were primarily farmers. The county was also home to several coal mines, which provided employment for many of the residents. The county also had a thriving lumber industry, and the first sawmill was built in 1885.
Geography
Mountrail County is located in the northwestern part of North Dakota, and is the second largest county in the state. It is bordered by Burke County to the north, Williams County to the east, and Ward County to the south. The county has a total area of 2,845 square miles, and is mostly rural. The county is located in the Great Plains region of the United States, and is characterized by rolling hills and prairies. The county is home to several lakes, including Lake Sakakawea, which is the largest lake in the state.
Economy
The economy of Mountrail County is largely based on agriculture and energy production. The county is home to several large farms, and the primary crops grown in the county are wheat, barley, and canola. The county is also home to several oil and gas fields, and is one of the leading producers of oil and natural gas in the state. The county is also home to several manufacturing companies, and the largest employer in the county is the Stanley Public School District.
Demographics
According to the 2020 census, Mountrail County has a population of 8,637 people. The population is spread out with a median age of 44.7 years. The racial makeup of the county is 94.3% White, 0.7% Native American, 0.3% Asian, 0.1% Black or African American, 0.1% Pacific Islander, and 4.5% from other races. The county has a median household income of $50,945, and the poverty rate is 11.3%.
Conclusion
Mountrail County is located in the northwestern part of North Dakota, and is the second largest county in the state. It is bordered by Burke County to the north, Williams County to the east, and Ward County to the south. The county has a population of 8,637 people, according to the 2020 census. The economy of Mountrail County is largely based on agriculture and energy production, and the county is home to several large farms and oil and gas fields. The county is also home to several manufacturing companies, and the largest employer in the county is the Stanley Public School District.
Common Questions
What is the Total Population of Mountrail County?
Total Population of Mountrail County is 9,648.
What is the Total Male Population of Mountrail County?
Total Male Population of Mountrail County is 5,066.
What is the Total Female Population of Mountrail County?
Total Female Population of Mountrail County is 4,582.
What is the Ratio of Males per 100 Females in Mountrail County?
There are 110.56 Males per 100 Females in Mountrail County.
What is the Ratio of Females per 100 Males in Mountrail County?
There are 90.45 Females per 100 Males in Mountrail County.
What is the Median Population Age in Mountrail County?
Median Population Age in Mountrail County is 34.7 Years.
What is the Average Family Size in Mountrail County
Average Family Size in Mountrail County is 3.5 People.
What is the Average Household Size in Mountrail County
Average Household Size in Mountrail County is 2.7 People.
What is Per Capita Income in Mountrail County?
Per Capita income in Mountrail County is $39,603.
What is the Median Family Income in Mountrail County?
Median Family Income in Mountrail County is $96,833.
What is the Median Household income in Mountrail County?
Median Household Income in Mountrail County is $81,886.
What is Income or Wage Gap in Mountrail County?
Income or Wage Gap in Mountrail County is 40.0%.
Women in Mountrail County earn 60.0 cents for every dollar earned by a man.
What is Family Income Deficit in Mountrail County?
Family Income Deficit in Mountrail County is $12,271.
Families that are below poverty line in Mountrail County earn $12,271 less on average than the poverty threshold level.
What is Inequality or Gini Index in Mountrail County?
Inequality or Gini Index in Mountrail County is 0.45.
How Large is the Labor Force in Mountrail County?
There are 4,555 People in the Labor Forcein in Mountrail County.
What is the Percentage of People in the Labor Force in Mountrail County?
63.4% of People are in the Labor Force in Mountrail County.
What is the Unemployment Rate in Mountrail County?
Unemployment Rate in Mountrail County is 3.5%.