Morton County, ND
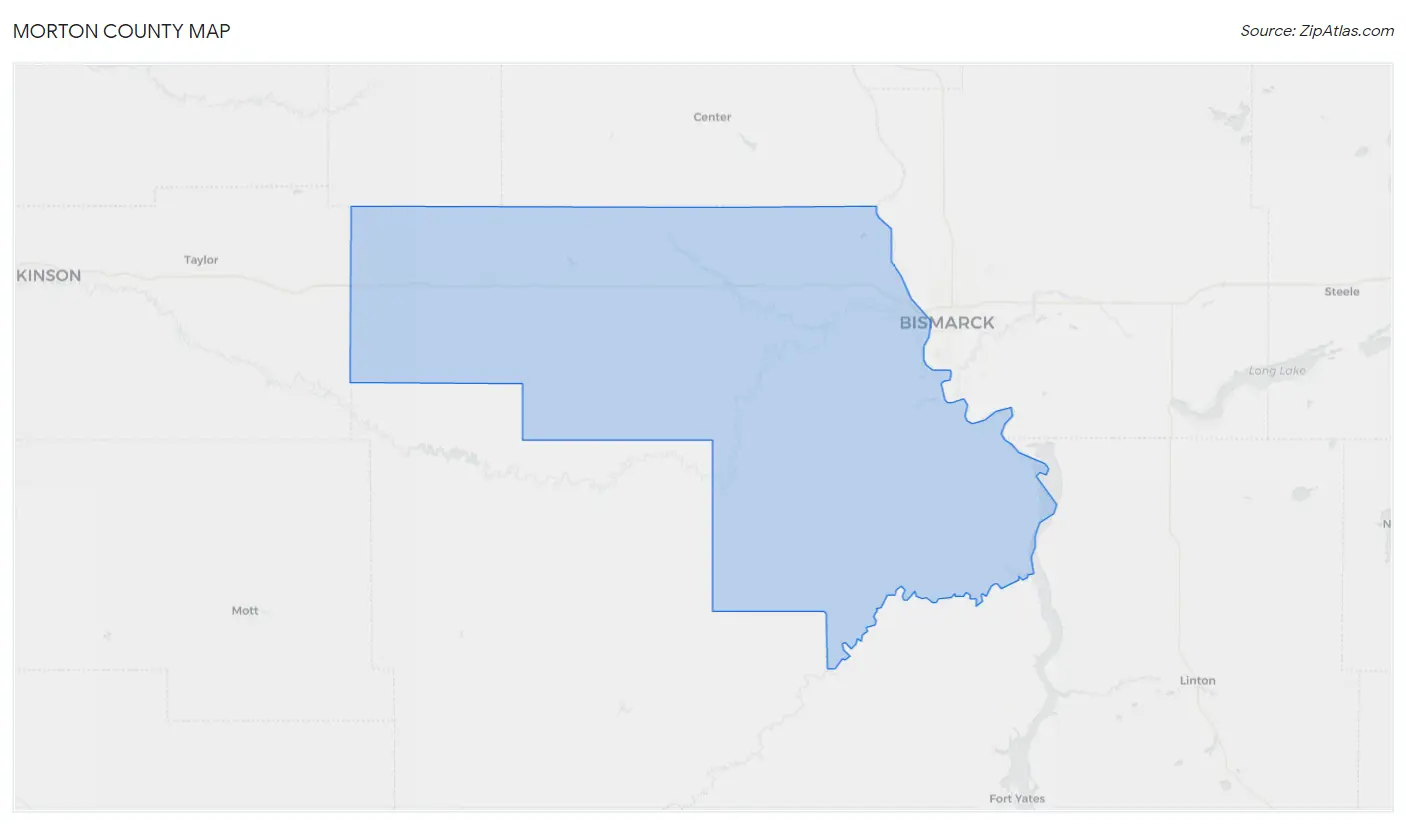
Morton County Map
Morton County Overview
33,192
TOTAL POPULATION
16,895
MALE POPULATION
16,297
FEMALE POPULATION
103.67
MALES / 100 FEMALES
96.46
FEMALES / 100 MALES
36.7
MEDIAN AGE
3.0
AVG FAMILY SIZE
2.5
AVG HOUSEHOLD SIZE
$42,603
PER CAPITA INCOME
$105,513
AVG FAMILY INCOME
$79,555
AVG HOUSEHOLD INCOME
26.0%
WAGE / INCOME GAP [ % ]
74.0¢/ $1
WAGE / INCOME GAP [ $ ]
0.44
INEQUALITY / GINI INDEX
18,663
LABOR FORCE [ PEOPLE ]
71.3%
PERCENT IN LABOR FORCE
2.0%
UNEMPLOYMENT RATE
Morton County Area Codes
Race in Morton County
The most populous races in Morton County are White / Caucasian (29,380 | 88.5%), Hispanic or Latino (1,401 | 4.2%), and Two or more Races (1,195 | 3.6%).
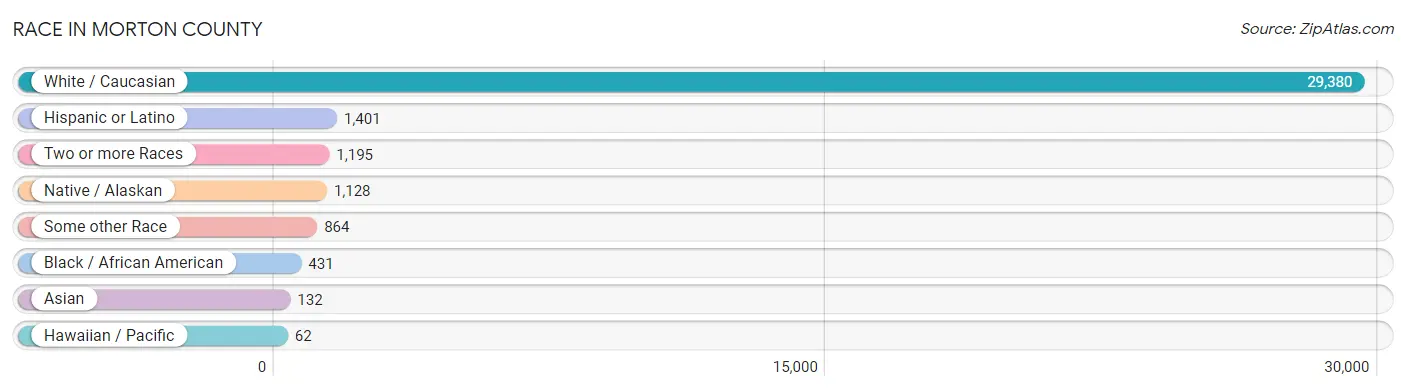
| Race | # Population | % Population |
| Asian | 132 | 0.4% |
| Black / African American | 431 | 1.3% |
| Hawaiian / Pacific | 62 | 0.2% |
| Hispanic or Latino | 1,401 | 4.2% |
| Native / Alaskan | 1,128 | 3.4% |
| White / Caucasian | 29,380 | 88.5% |
| Two or more Races | 1,195 | 3.6% |
| Some other Race | 864 | 2.6% |
| Total | 33,192 | 100.0% |
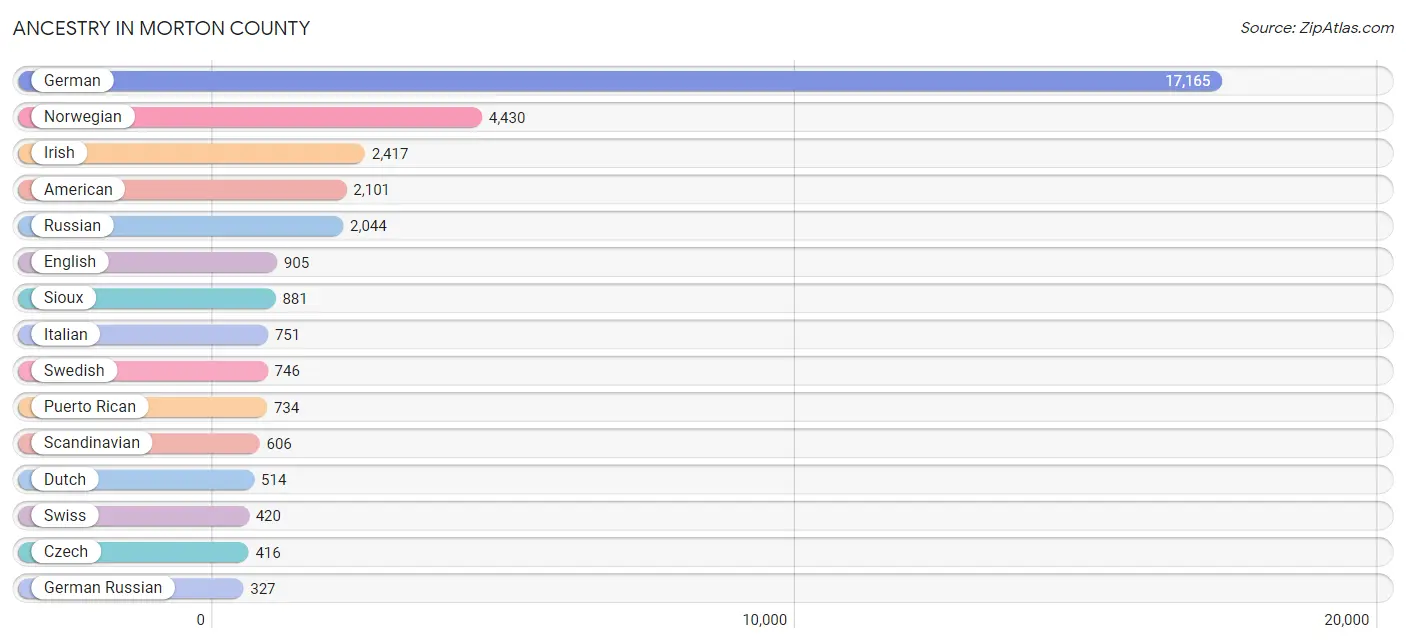
Ancestry in Morton County
The most populous ancestries reported in Morton County are German (17,165 | 51.7%), Norwegian (4,430 | 13.4%), Irish (2,417 | 7.3%), American (2,101 | 6.3%), and Russian (2,044 | 6.2%), together accounting for 84.8% of all Morton County residents.
| Ancestry | # Population | % Population |
| American | 2,101 | 6.3% |
| Arab | 156 | 0.5% |
| Argentinean | 2 | 0.0% |
| Austrian | 20 | 0.1% |
| Basque | 11 | 0.0% |
| Bhutanese | 10 | 0.0% |
| British | 274 | 0.8% |
| Burmese | 92 | 0.3% |
| Canadian | 2 | 0.0% |
| Celtic | 3 | 0.0% |
| Central American | 5 | 0.0% |
| Cherokee | 21 | 0.1% |
| Chippewa | 190 | 0.6% |
| Colombian | 114 | 0.3% |
| Croatian | 2 | 0.0% |
| Czech | 416 | 1.3% |
| Czechoslovakian | 21 | 0.1% |
| Danish | 134 | 0.4% |
| Dutch | 514 | 1.5% |
| Eastern European | 23 | 0.1% |
| Ecuadorian | 27 | 0.1% |
| English | 905 | 2.7% |
| European | 312 | 0.9% |
| Fijian | 4 | 0.0% |
| Finnish | 23 | 0.1% |
| French | 273 | 0.8% |
| French Canadian | 288 | 0.9% |
| German | 17,165 | 51.7% |
| German Russian | 327 | 1.0% |
| Greek | 35 | 0.1% |
| Guatemalan | 1 | 0.0% |
| Hungarian | 144 | 0.4% |
| Icelander | 49 | 0.2% |
| Iraqi | 109 | 0.3% |
| Irish | 2,417 | 7.3% |
| Italian | 751 | 2.3% |
| Jamaican | 42 | 0.1% |
| Korean | 16 | 0.1% |
| Latvian | 4 | 0.0% |
| Lebanese | 47 | 0.1% |
| Liberian | 3 | 0.0% |
| Luxembourger | 40 | 0.1% |
| Menominee | 1 | 0.0% |
| Mexican | 204 | 0.6% |
| Norwegian | 4,430 | 13.4% |
| Panamanian | 4 | 0.0% |
| Polish | 293 | 0.9% |
| Portuguese | 19 | 0.1% |
| Puerto Rican | 734 | 2.2% |
| Russian | 2,044 | 6.2% |
| Samoan | 9 | 0.0% |
| Scandinavian | 606 | 1.8% |
| Scotch-Irish | 234 | 0.7% |
| Scottish | 57 | 0.2% |
| Senegalese | 18 | 0.1% |
| Sioux | 881 | 2.6% |
| Slovak | 5 | 0.0% |
| South American | 143 | 0.4% |
| Spaniard | 5 | 0.0% |
| Spanish American | 25 | 0.1% |
| Subsaharan African | 21 | 0.1% |
| Swedish | 746 | 2.2% |
| Swiss | 420 | 1.3% |
| Thai | 1 | 0.0% |
| Ukrainian | 72 | 0.2% |
| Vietnamese | 4 | 0.0% |
| Welsh | 38 | 0.1% | View All 67 Rows |
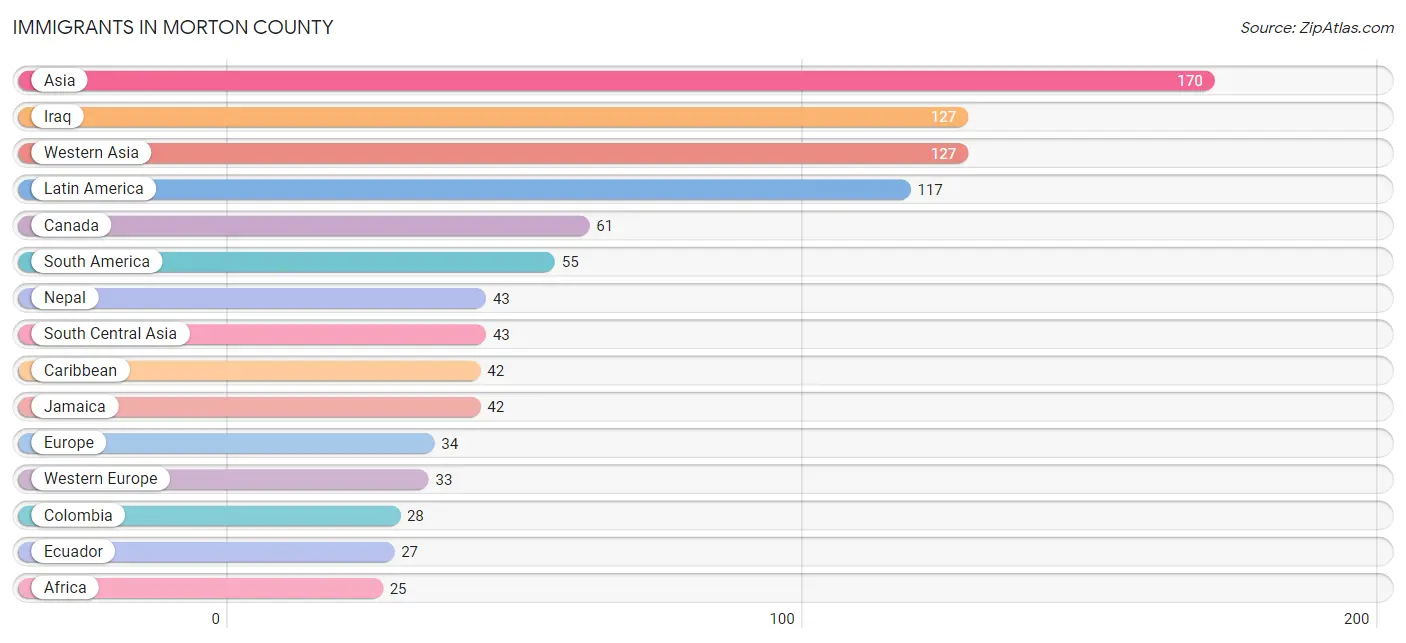
Immigrants in Morton County
The most numerous immigrant groups reported in Morton County came from Asia (170 | 0.5%), Iraq (127 | 0.4%), Western Asia (127 | 0.4%), Latin America (117 | 0.4%), and Canada (61 | 0.2%), together accounting for 1.8% of all Morton County residents.
| Immigration Origin | # Population | % Population |
| Africa | 25 | 0.1% |
| Asia | 170 | 0.5% |
| Belgium | 10 | 0.0% |
| Canada | 61 | 0.2% |
| Caribbean | 42 | 0.1% |
| Central America | 20 | 0.1% |
| Colombia | 28 | 0.1% |
| Ecuador | 27 | 0.1% |
| Europe | 34 | 0.1% |
| Germany | 23 | 0.1% |
| Ghana | 4 | 0.0% |
| Iraq | 127 | 0.4% |
| Jamaica | 42 | 0.1% |
| Latin America | 117 | 0.4% |
| Liberia | 20 | 0.1% |
| Mexico | 16 | 0.1% |
| Nepal | 43 | 0.1% |
| Nigeria | 1 | 0.0% |
| Northern Europe | 1 | 0.0% |
| Norway | 1 | 0.0% |
| Oceania | 14 | 0.0% |
| Panama | 4 | 0.0% |
| South America | 55 | 0.2% |
| South Central Asia | 43 | 0.1% |
| Western Africa | 25 | 0.1% |
| Western Asia | 127 | 0.4% |
| Western Europe | 33 | 0.1% | View All 27 Rows |
Sex and Age in Morton County
Sex and Age in Morton County
The most populous age groups in Morton County are 30 to 34 Years (1,441 | 8.5%) for men and 35 to 39 Years (1,330 | 8.2%) for women.
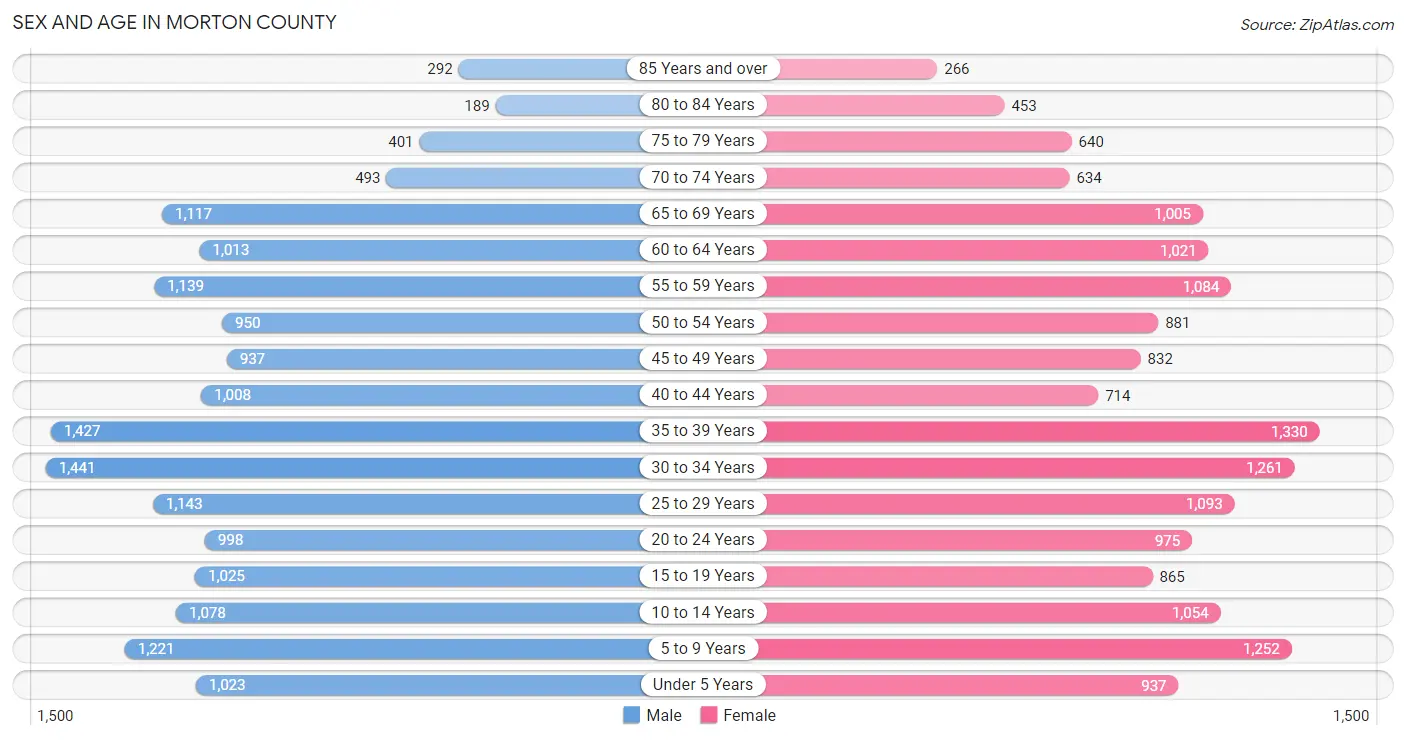
| Age Bracket | Male | Female |
| Under 5 Years | 1,023 (6.1%) | 937 (5.8%) |
| 5 to 9 Years | 1,221 (7.2%) | 1,252 (7.7%) |
| 10 to 14 Years | 1,078 (6.4%) | 1,054 (6.5%) |
| 15 to 19 Years | 1,025 (6.1%) | 865 (5.3%) |
| 20 to 24 Years | 998 (5.9%) | 975 (6.0%) |
| 25 to 29 Years | 1,143 (6.8%) | 1,093 (6.7%) |
| 30 to 34 Years | 1,441 (8.5%) | 1,261 (7.7%) |
| 35 to 39 Years | 1,427 (8.5%) | 1,330 (8.2%) |
| 40 to 44 Years | 1,008 (6.0%) | 714 (4.4%) |
| 45 to 49 Years | 937 (5.6%) | 832 (5.1%) |
| 50 to 54 Years | 950 (5.6%) | 881 (5.4%) |
| 55 to 59 Years | 1,139 (6.7%) | 1,084 (6.7%) |
| 60 to 64 Years | 1,013 (6.0%) | 1,021 (6.3%) |
| 65 to 69 Years | 1,117 (6.6%) | 1,005 (6.2%) |
| 70 to 74 Years | 493 (2.9%) | 634 (3.9%) |
| 75 to 79 Years | 401 (2.4%) | 640 (3.9%) |
| 80 to 84 Years | 189 (1.1%) | 453 (2.8%) |
| 85 Years and over | 292 (1.7%) | 266 (1.6%) |
| Total | 16,895 (100.0%) | 16,297 (100.0%) |
Families and Households in Morton County
Median Family Size in Morton County
The median family size in Morton County is 2.96 persons per family, with single male/father families (437 | 4.9%) accounting for the largest median family size of 3.32 persons per family. On the other hand, single female/mother families (1,069 | 12.0%) represent the smallest median family size with 2.59 persons per family.
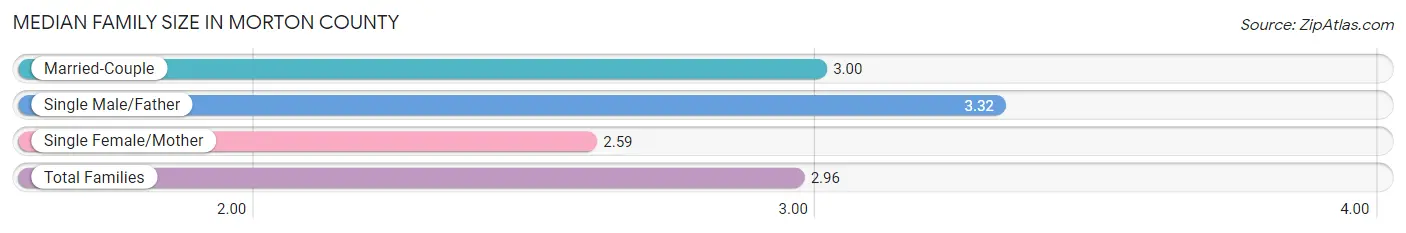
| Family Type | # Families | Family Size |
| Married-Couple | 7,364 (83.0%) | 3.00 |
| Single Male/Father | 437 (4.9%) | 3.32 |
| Single Female/Mother | 1,069 (12.0%) | 2.59 |
| Total Families | 8,870 (100.0%) | 2.96 |
Median Household Size in Morton County
The median household size in Morton County is 2.47 persons per household, with single male/father households (437 | 3.3%) accounting for the largest median household size of 3.66 persons per household. non-family households (4,307 | 32.7%) represent the smallest median household size with 1.33 persons per household.
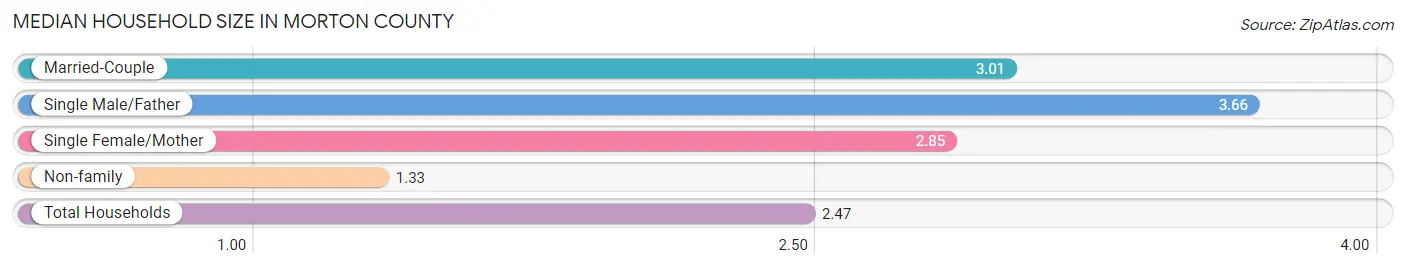
| Household Type | # Households | Household Size |
| Married-Couple | 7,364 (55.9%) | 3.01 |
| Single Male/Father | 437 (3.3%) | 3.66 |
| Single Female/Mother | 1,069 (8.1%) | 2.85 |
| Non-family | 4,307 (32.7%) | 1.33 |
| Total Households | 13,177 (100.0%) | 2.47 |
Household Size by Marriage Status in Morton County
Out of a total of 13,177 households in Morton County, 8,870 (67.3%) are family households, while 4,307 (32.7%) are nonfamily households. The most numerous type of family households are 2-person households, comprising 4,350, and the most common type of nonfamily households are 1-person households, comprising 3,328.
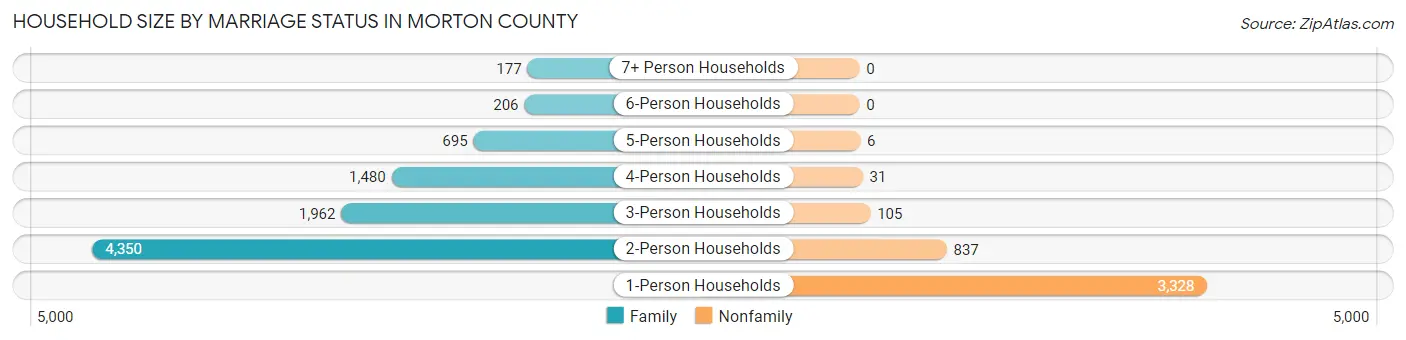
| Household Size | Family Households | Nonfamily Households |
| 1-Person Households | - | 3,328 (25.3%) |
| 2-Person Households | 4,350 (33.0%) | 837 (6.4%) |
| 3-Person Households | 1,962 (14.9%) | 105 (0.8%) |
| 4-Person Households | 1,480 (11.2%) | 31 (0.2%) |
| 5-Person Households | 695 (5.3%) | 6 (0.1%) |
| 6-Person Households | 206 (1.6%) | 0 (0.0%) |
| 7+ Person Households | 177 (1.3%) | 0 (0.0%) |
| Total | 8,870 (67.3%) | 4,307 (32.7%) |
Female Fertility in Morton County
Fertility by Age in Morton County
Average fertility rate in Morton County is 65.0 births per 1,000 women. Women in the age bracket of 20 to 34 years have the highest fertility rate with 132.0 births per 1,000 women. Women in the age bracket of 20 to 34 years acount for 91.6% of all women with births.
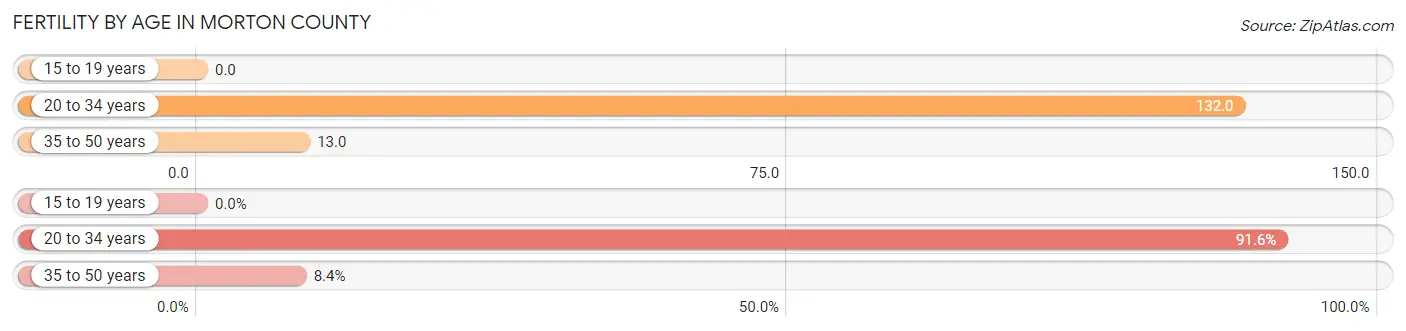
| Age Bracket | Women with Births | Births / 1,000 Women |
| 15 to 19 years | 0 (0.0%) | 0.0 |
| 20 to 34 years | 438 (91.6%) | 132.0 |
| 35 to 50 years | 40 (8.4%) | 13.0 |
| Total | 478 (100.0%) | 65.0 |
Fertility by Age by Marriage Status in Morton County
79.7% of women with births (478) in Morton County are married. The highest percentage of unmarried women with births falls into 35 to 50 years age bracket with 45.0% of them unmarried at the time of birth, while the lowest percentage of unmarried women with births belong to 20 to 34 years age bracket with 18.0% of them unmarried.
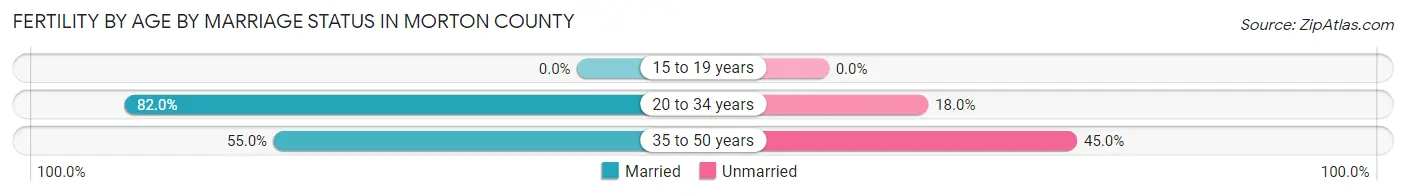
| Age Bracket | Married | Unmarried |
| 15 to 19 years | 0 (0.0%) | 0 (0.0%) |
| 20 to 34 years | 359 (82.0%) | 79 (18.0%) |
| 35 to 50 years | 22 (55.0%) | 18 (45.0%) |
| Total | 381 (79.7%) | 97 (20.3%) |
Fertility by Education in Morton County
Average fertility rate in Morton County is 65.0 births per 1,000 women. Women with the education attainment of less than high school have the highest fertility rate of 107.0 births per 1,000 women, while women with the education attainment of college or associate's degree have the lowest fertility at 38.0 births per 1,000 women. Women with the education attainment of bachelor's degree represent 38.1% of all women with births.
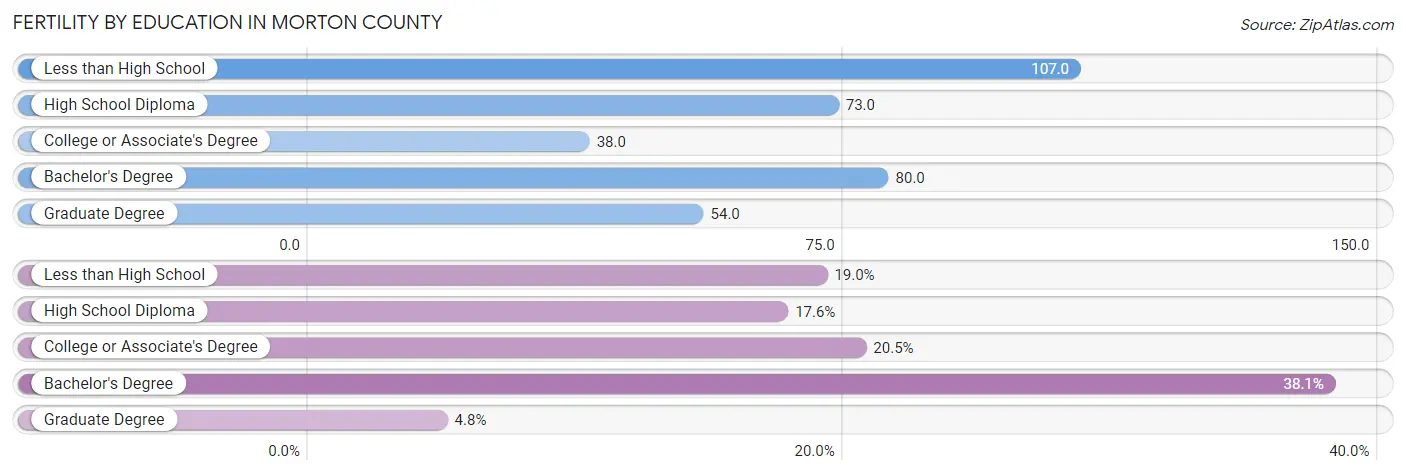
| Educational Attainment | Women with Births | Births / 1,000 Women |
| Less than High School | 91 (19.0%) | 107.0 |
| High School Diploma | 84 (17.6%) | 73.0 |
| College or Associate's Degree | 98 (20.5%) | 38.0 |
| Bachelor's Degree | 182 (38.1%) | 80.0 |
| Graduate Degree | 23 (4.8%) | 54.0 |
| Total | 478 (100.0%) | 65.0 |
Fertility by Education by Marriage Status in Morton County
20.3% of women with births in Morton County are unmarried. Women with the educational attainment of college or associate's degree are most likely to be married with 100.0% of them married at childbirth, while women with the educational attainment of less than high school are least likely to be married with 36.3% of them unmarried at childbirth.
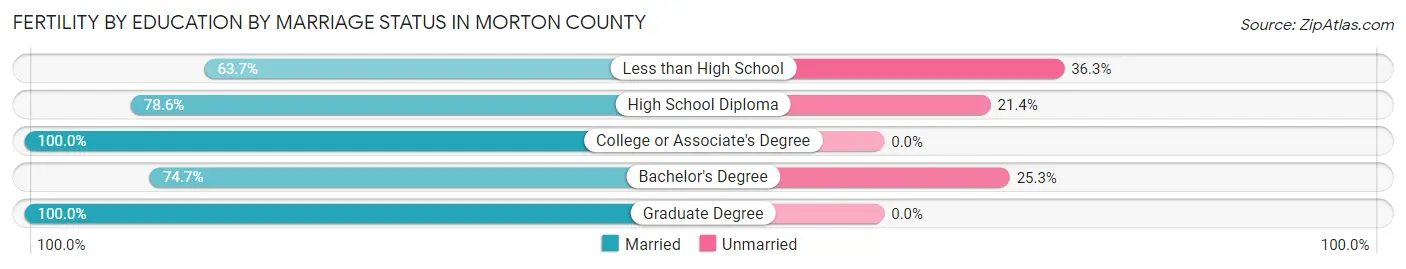
| Educational Attainment | Married | Unmarried |
| Less than High School | 58 (63.7%) | 33 (36.3%) |
| High School Diploma | 66 (78.6%) | 18 (21.4%) |
| College or Associate's Degree | 98 (100.0%) | 0 (0.0%) |
| Bachelor's Degree | 136 (74.7%) | 46 (25.3%) |
| Graduate Degree | 23 (100.0%) | 0 (0.0%) |
| Total | 381 (79.7%) | 97 (20.3%) |
Income in Morton County
Income Overview in Morton County
Per Capita Income in Morton County is $42,603, while median incomes of families and households are $105,513 and $79,555 respectively.
| Characteristic | Number | Measure |
| Per Capita Income | 33,192 | $42,603 |
| Median Family Income | 8,870 | $105,513 |
| Mean Family Income | 8,870 | $127,113 |
| Median Household Income | 13,177 | $79,555 |
| Mean Household Income | 13,177 | $104,894 |
| Income Deficit | 8,870 | $0 |
| Wage / Income Gap (%) | 33,192 | 25.99% |
| Wage / Income Gap ($) | 33,192 | 74.01¢ per $1 |
| Gini / Inequality Index | 33,192 | 0.44 |
Earnings by Sex in Morton County
Average Earnings in Morton County are $44,028, $52,069 for men and $38,535 for women, a difference of 26.0%.
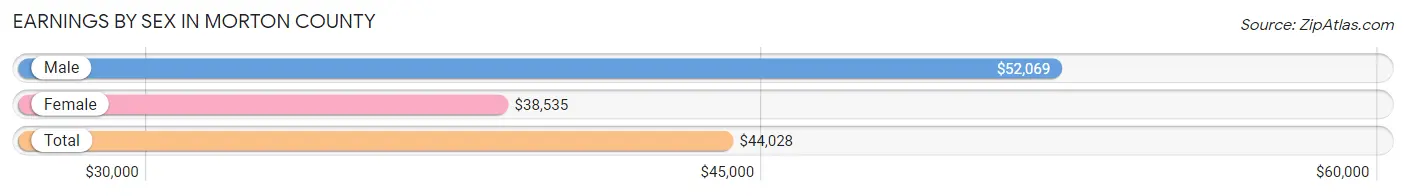
| Sex | Number | Average Earnings |
| Male | 10,829 (54.4%) | $52,069 |
| Female | 9,092 (45.6%) | $38,535 |
| Total | 19,921 (100.0%) | $44,028 |
Earnings by Sex by Income Bracket in Morton County
The most common earnings brackets in Morton County are $100,000+ for men (1,907 | 17.6%) and $55,000 to $64,999 for women (829 | 9.1%).
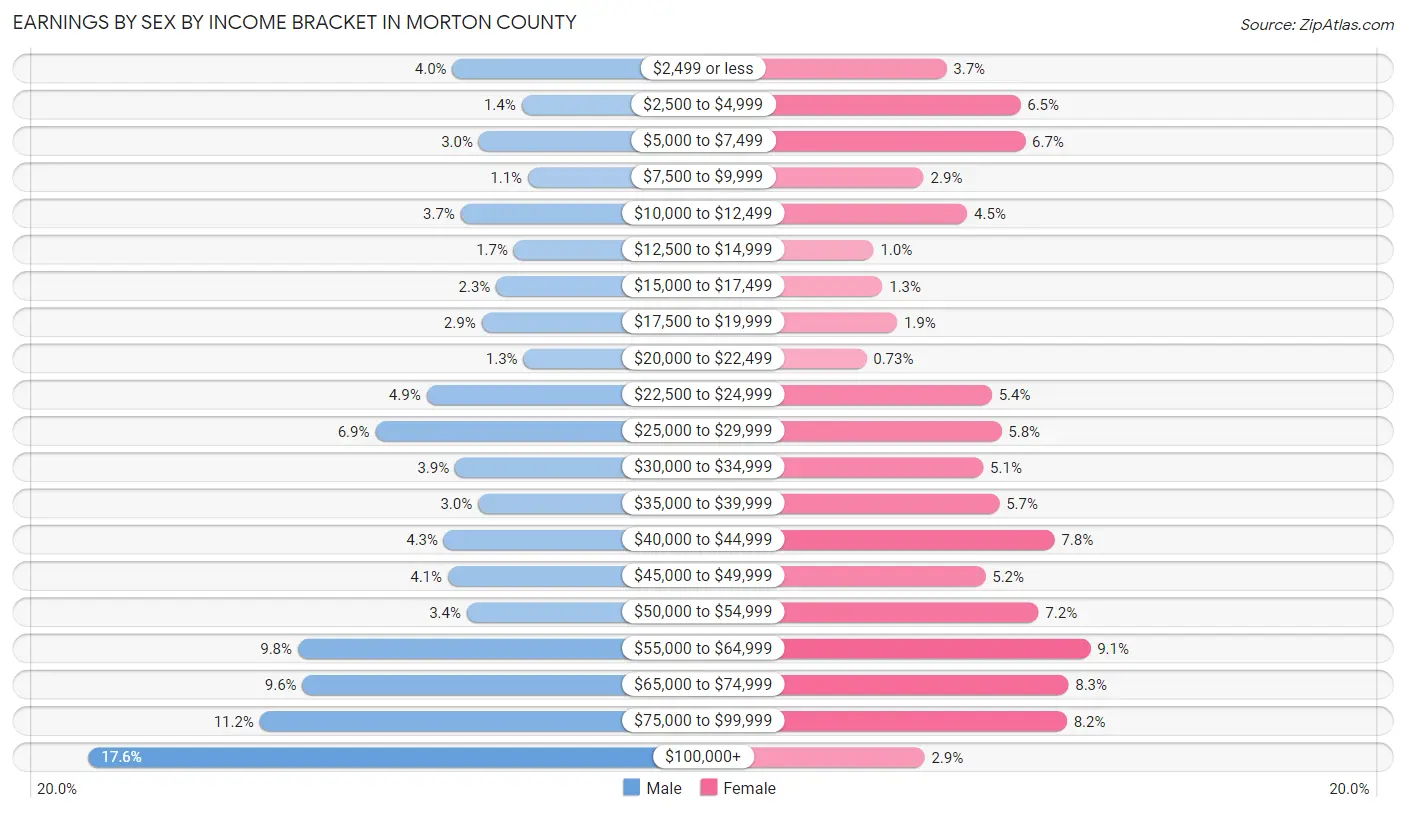
| Income | Male | Female |
| $2,499 or less | 430 (4.0%) | 339 (3.7%) |
| $2,500 to $4,999 | 149 (1.4%) | 591 (6.5%) |
| $5,000 to $7,499 | 323 (3.0%) | 607 (6.7%) |
| $7,500 to $9,999 | 123 (1.1%) | 262 (2.9%) |
| $10,000 to $12,499 | 396 (3.7%) | 410 (4.5%) |
| $12,500 to $14,999 | 181 (1.7%) | 91 (1.0%) |
| $15,000 to $17,499 | 252 (2.3%) | 121 (1.3%) |
| $17,500 to $19,999 | 312 (2.9%) | 171 (1.9%) |
| $20,000 to $22,499 | 142 (1.3%) | 66 (0.7%) |
| $22,500 to $24,999 | 535 (4.9%) | 494 (5.4%) |
| $25,000 to $29,999 | 743 (6.9%) | 526 (5.8%) |
| $30,000 to $34,999 | 419 (3.9%) | 465 (5.1%) |
| $35,000 to $39,999 | 326 (3.0%) | 519 (5.7%) |
| $40,000 to $44,999 | 465 (4.3%) | 707 (7.8%) |
| $45,000 to $49,999 | 448 (4.1%) | 472 (5.2%) |
| $50,000 to $54,999 | 371 (3.4%) | 653 (7.2%) |
| $55,000 to $64,999 | 1,057 (9.8%) | 829 (9.1%) |
| $65,000 to $74,999 | 1,038 (9.6%) | 755 (8.3%) |
| $75,000 to $99,999 | 1,212 (11.2%) | 749 (8.2%) |
| $100,000+ | 1,907 (17.6%) | 265 (2.9%) |
| Total | 10,829 (100.0%) | 9,092 (100.0%) |
Earnings by Sex by Educational Attainment in Morton County
Average earnings in Morton County are $59,121 for men and $43,386 for women, a difference of 26.6%. Men with an educational attainment of graduate degree enjoy the highest average annual earnings of $108,074, while those with less than high school education earn the least with $24,066. Women with an educational attainment of graduate degree earn the most with the average annual earnings of $69,302, while those with less than high school education have the smallest earnings of $8,125.
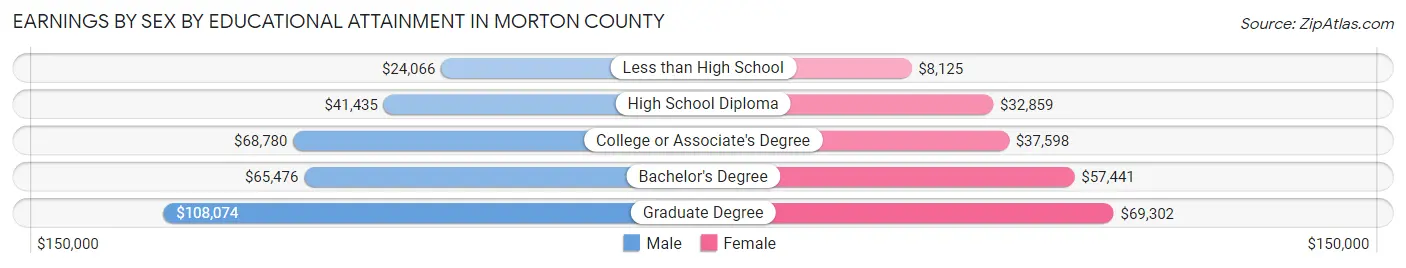
| Educational Attainment | Male Income | Female Income |
| Less than High School | $24,066 | $8,125 |
| High School Diploma | $41,435 | $32,859 |
| College or Associate's Degree | $68,780 | $37,598 |
| Bachelor's Degree | $65,476 | $57,441 |
| Graduate Degree | $108,074 | $69,302 |
| Total | $59,121 | $43,386 |
Family Income in Morton County
Family Income Brackets in Morton County
According to the Morton County family income data, there are 2,688 families falling into the $100,000 to $149,999 income range, which is the most common income bracket and makes up 30.3% of all families. Conversely, the $10,000 to $14,999 income bracket is the least frequent group with only 71 families (0.8%) belonging to this category.
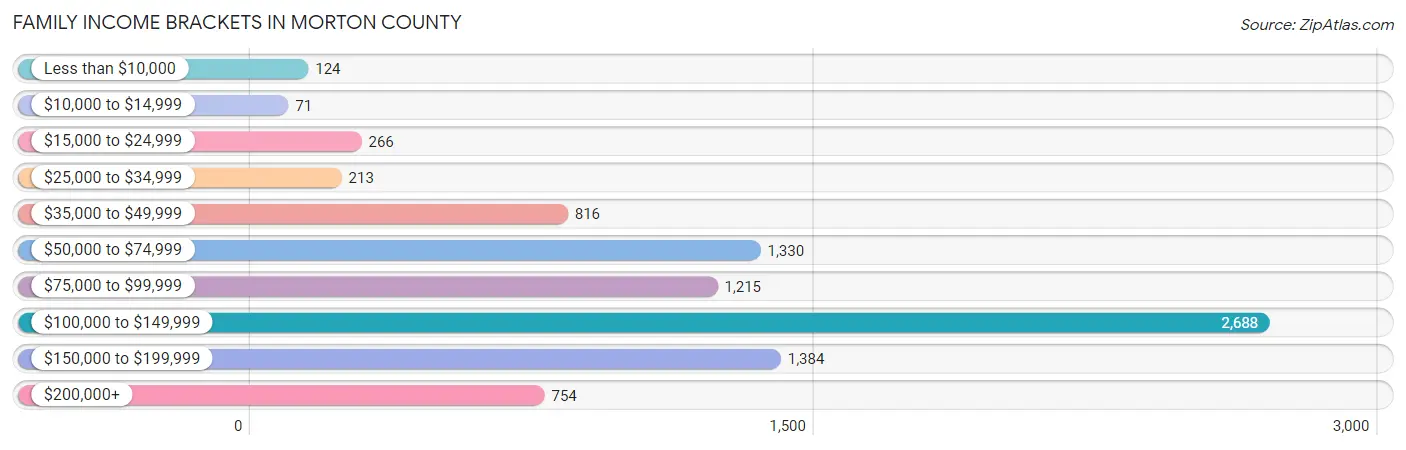
| Income Bracket | # Families | % Families |
| Less than $10,000 | 124 | 1.4% |
| $10,000 to $14,999 | 71 | 0.8% |
| $15,000 to $24,999 | 266 | 3.0% |
| $25,000 to $34,999 | 213 | 2.4% |
| $35,000 to $49,999 | 816 | 9.2% |
| $50,000 to $74,999 | 1,330 | 15.0% |
| $75,000 to $99,999 | 1,215 | 13.7% |
| $100,000 to $149,999 | 2,688 | 30.3% |
| $150,000 to $199,999 | 1,384 | 15.6% |
| $200,000+ | 754 | 8.5% |
Family Income by Famaliy Size in Morton County
5-person families (674 | 7.6%) account for the highest median family income in Morton County with $149,167 per family, while 2-person families (4,639 | 52.3%) have the highest median income of $48,026 per family member.
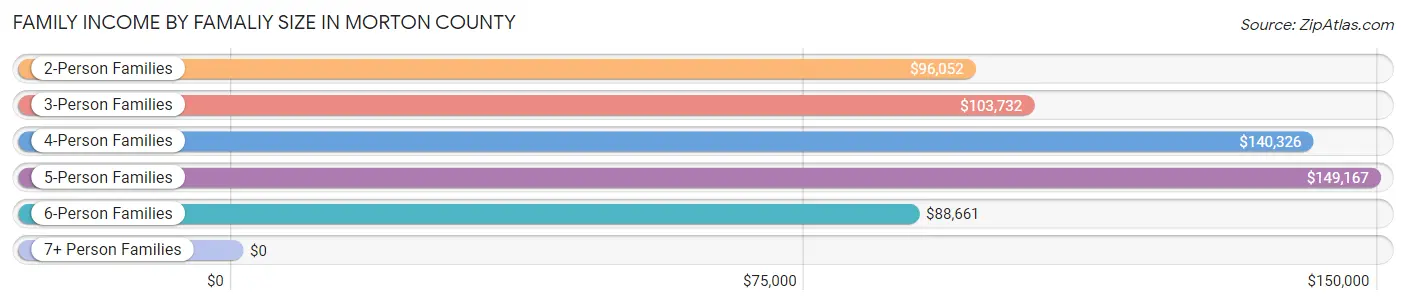
| Income Bracket | # Families | Median Income |
| 2-Person Families | 4,639 (52.3%) | $96,052 |
| 3-Person Families | 1,848 (20.8%) | $103,732 |
| 4-Person Families | 1,342 (15.1%) | $140,326 |
| 5-Person Families | 674 (7.6%) | $149,167 |
| 6-Person Families | 227 (2.6%) | $88,661 |
| 7+ Person Families | 140 (1.6%) | $0 |
| Total | 8,870 (100.0%) | $105,513 |
Family Income by Number of Earners in Morton County
The median family income in Morton County is $105,513, with families comprising 3+ earners (1,033) having the highest median family income of $158,202, while families with no earners (962) have the lowest median family income of $49,735, accounting for 11.7% and 10.8% of families, respectively.
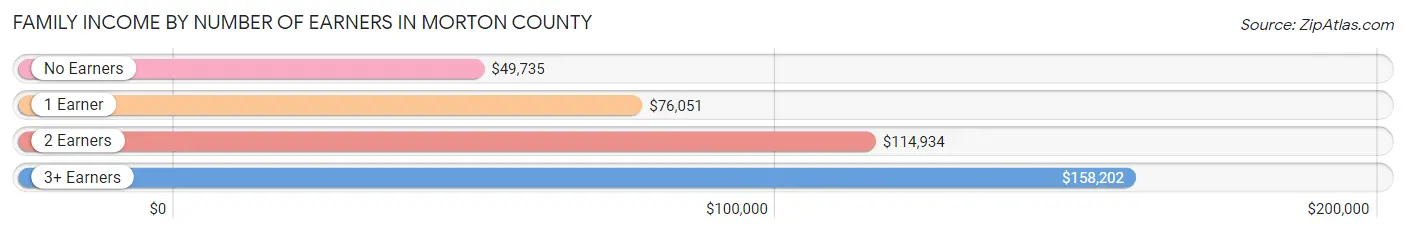
| Number of Earners | # Families | Median Income |
| No Earners | 962 (10.8%) | $49,735 |
| 1 Earner | 2,252 (25.4%) | $76,051 |
| 2 Earners | 4,623 (52.1%) | $114,934 |
| 3+ Earners | 1,033 (11.7%) | $158,202 |
| Total | 8,870 (100.0%) | $105,513 |
Household Income in Morton County
Household Income Brackets in Morton County
With 2,965 households falling in the category, the $100,000 to $149,999 income range is the most frequent in Morton County, accounting for 22.5% of all households. In contrast, only 264 households (2.0%) fall into the less than $10,000 income bracket, making it the least populous group.
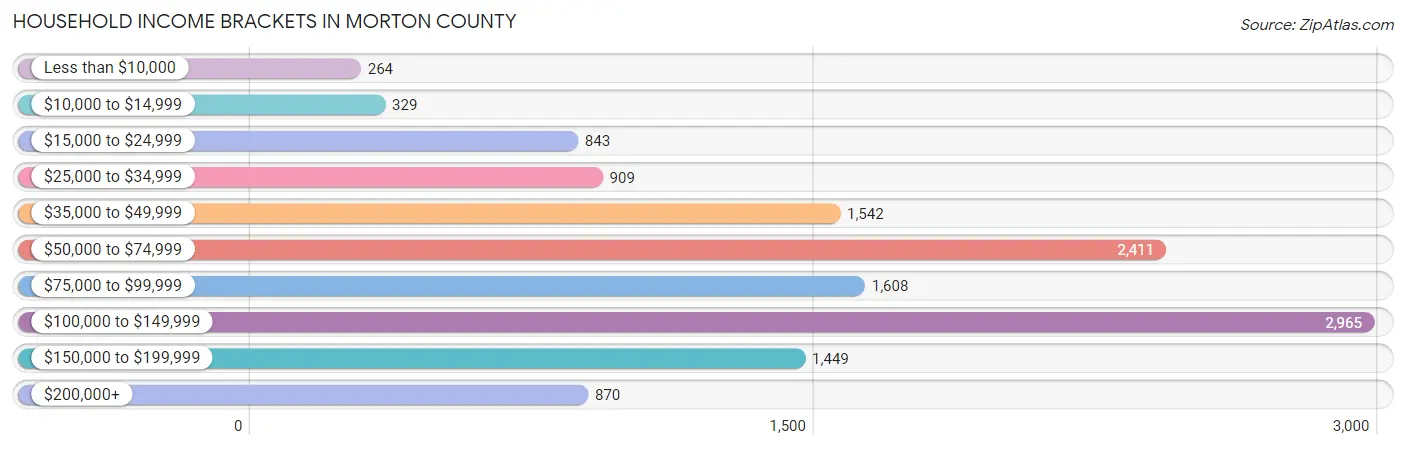
| Income Bracket | # Households | % Households |
| Less than $10,000 | 264 | 2.0% |
| $10,000 to $14,999 | 329 | 2.5% |
| $15,000 to $24,999 | 843 | 6.4% |
| $25,000 to $34,999 | 909 | 6.9% |
| $35,000 to $49,999 | 1,542 | 11.7% |
| $50,000 to $74,999 | 2,411 | 18.3% |
| $75,000 to $99,999 | 1,608 | 12.2% |
| $100,000 to $149,999 | 2,965 | 22.5% |
| $150,000 to $199,999 | 1,449 | 11.0% |
| $200,000+ | 870 | 6.6% |
Household Income by Householder Age in Morton County
The median household income in Morton County is $79,555, with the highest median household income of $100,185 found in the 45 to 64 years age bracket for the primary householder. A total of 4,447 households (33.8%) fall into this category. Meanwhile, the 15 to 24 years age bracket for the primary householder has the lowest median household income of $49,960, with 685 households (5.2%) in this group.
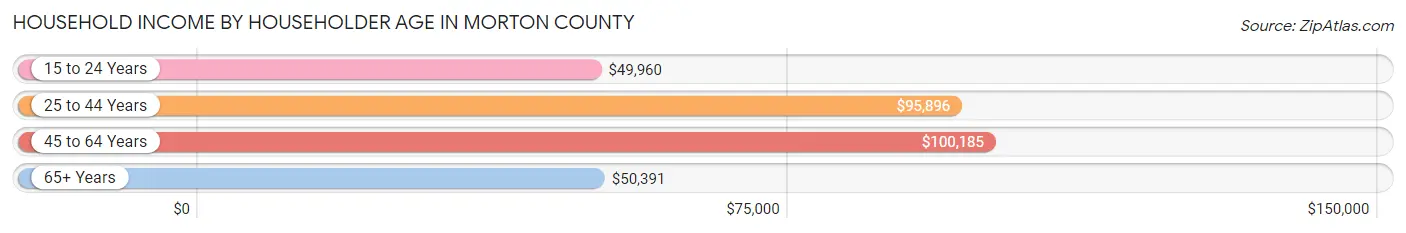
| Income Bracket | # Households | Median Income |
| 15 to 24 Years | 685 (5.2%) | $49,960 |
| 25 to 44 Years | 4,581 (34.8%) | $95,896 |
| 45 to 64 Years | 4,447 (33.8%) | $100,185 |
| 65+ Years | 3,464 (26.3%) | $50,391 |
| Total | 13,177 (100.0%) | $79,555 |
Poverty in Morton County
Income Below Poverty by Sex and Age in Morton County
With 6.8% poverty level for males and 9.6% for females among the residents of Morton County, 12 to 14 year old males and 18 to 24 year old females are the most vulnerable to poverty, with 157 males (24.2%) and 575 females (46.3%) in their respective age groups living below the poverty level.
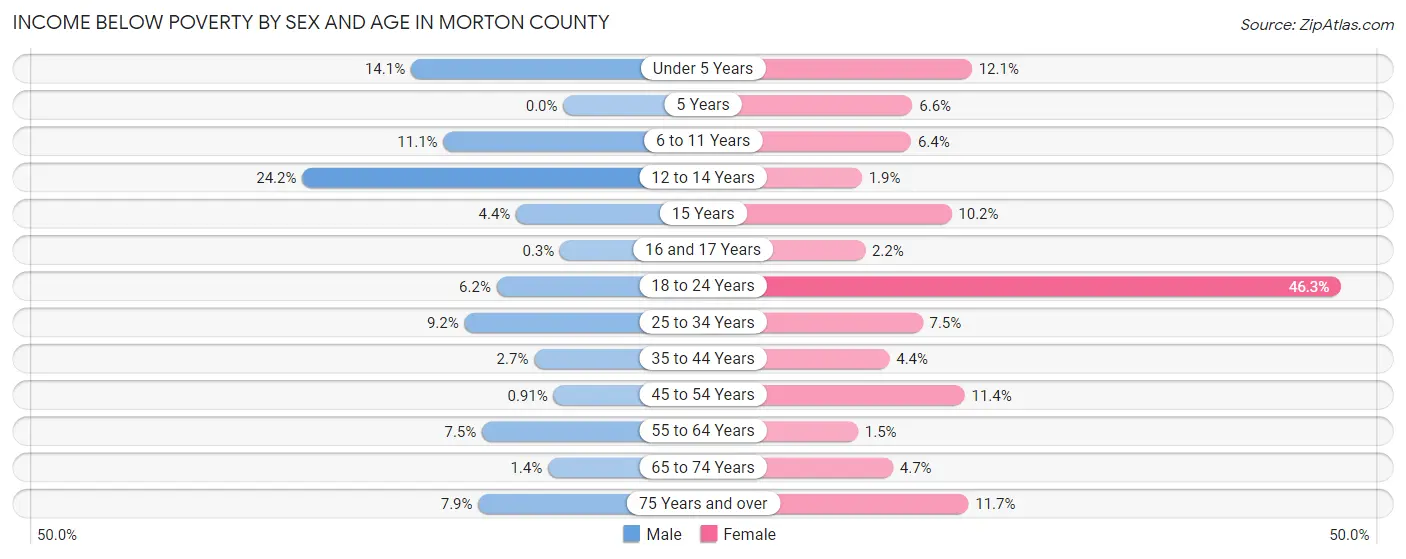
| Age Bracket | Male | Female |
| Under 5 Years | 140 (14.1%) | 113 (12.1%) |
| 5 Years | 0 (0.0%) | 22 (6.6%) |
| 6 to 11 Years | 164 (11.1%) | 69 (6.4%) |
| 12 to 14 Years | 157 (24.2%) | 16 (1.8%) |
| 15 Years | 12 (4.4%) | 18 (10.2%) |
| 16 and 17 Years | 1 (0.3%) | 9 (2.1%) |
| 18 to 24 Years | 86 (6.2%) | 575 (46.3%) |
| 25 to 34 Years | 236 (9.2%) | 175 (7.5%) |
| 35 to 44 Years | 65 (2.7%) | 90 (4.4%) |
| 45 to 54 Years | 17 (0.9%) | 195 (11.4%) |
| 55 to 64 Years | 161 (7.5%) | 31 (1.5%) |
| 65 to 74 Years | 22 (1.4%) | 75 (4.7%) |
| 75 Years and over | 61 (7.9%) | 137 (11.7%) |
| Total | 1,122 (6.8%) | 1,525 (9.6%) |
Income Above Poverty by Sex and Age in Morton County
According to the poverty statistics in Morton County, males aged 5 years and females aged 55 to 64 years are the age groups that are most secure financially, with 100.0% of males and 98.5% of females in these age groups living above the poverty line.
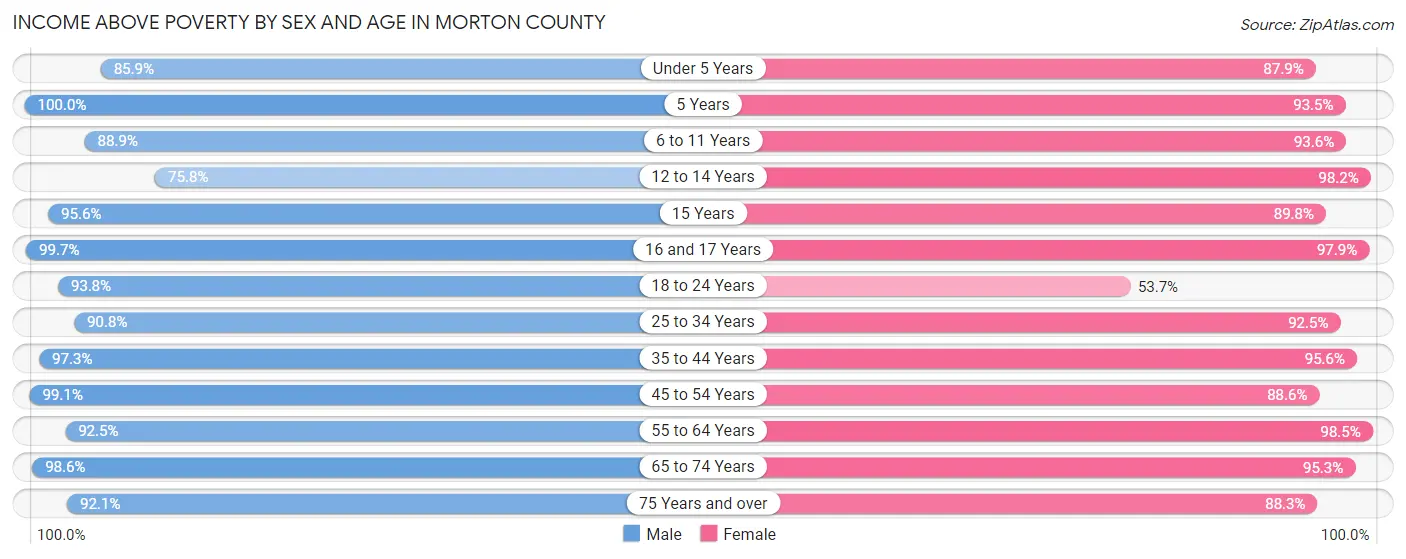
| Age Bracket | Male | Female |
| Under 5 Years | 850 (85.9%) | 824 (87.9%) |
| 5 Years | 156 (100.0%) | 314 (93.4%) |
| 6 to 11 Years | 1,309 (88.9%) | 1,005 (93.6%) |
| 12 to 14 Years | 491 (75.8%) | 850 (98.2%) |
| 15 Years | 262 (95.6%) | 159 (89.8%) |
| 16 and 17 Years | 327 (99.7%) | 410 (97.9%) |
| 18 to 24 Years | 1,306 (93.8%) | 666 (53.7%) |
| 25 to 34 Years | 2,338 (90.8%) | 2,161 (92.5%) |
| 35 to 44 Years | 2,346 (97.3%) | 1,952 (95.6%) |
| 45 to 54 Years | 1,852 (99.1%) | 1,517 (88.6%) |
| 55 to 64 Years | 1,975 (92.5%) | 2,044 (98.5%) |
| 65 to 74 Years | 1,528 (98.6%) | 1,507 (95.3%) |
| 75 Years and over | 712 (92.1%) | 1,030 (88.3%) |
| Total | 15,452 (93.2%) | 14,439 (90.4%) |
Income Below Poverty Among Married-Couple Families in Morton County
The poverty statistics for married-couple families in Morton County show that 2.0% or 149 of the total 7,364 families live below the poverty line. Families with 3 or 4 children have the highest poverty rate of 13.8%, comprising of 94 families. On the other hand, families with 5 or more children have the lowest poverty rate of 0.0%, which includes 0 families.
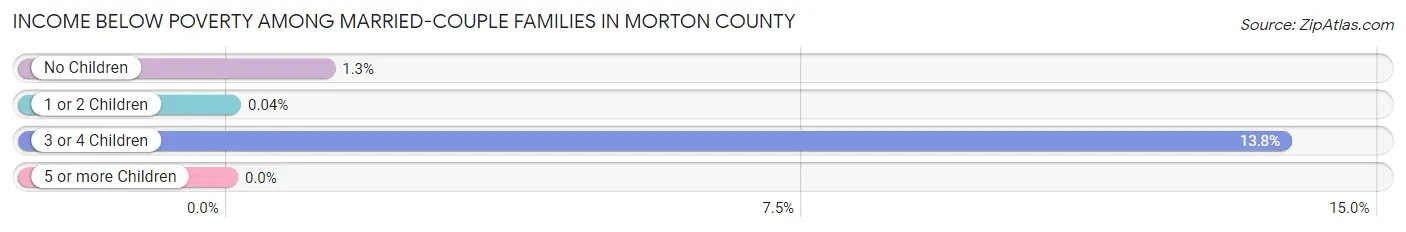
| Children | Above Poverty | Below Poverty |
| No Children | 4,197 (98.7%) | 54 (1.3%) |
| 1 or 2 Children | 2,326 (100.0%) | 1 (0.0%) |
| 3 or 4 Children | 589 (86.2%) | 94 (13.8%) |
| 5 or more Children | 103 (100.0%) | 0 (0.0%) |
| Total | 7,215 (98.0%) | 149 (2.0%) |
Income Below Poverty Among Single-Parent Households in Morton County
According to the poverty data in Morton County, 2.1% or 9 single-father households and 17.4% or 186 single-mother households are living below the poverty line. Among single-father households, those with 1 or 2 children have the highest poverty rate, with 6 households (3.3%) experiencing poverty. Likewise, among single-mother households, those with 5 or more children have the highest poverty rate, with 37 households (52.1%) falling below the poverty line.
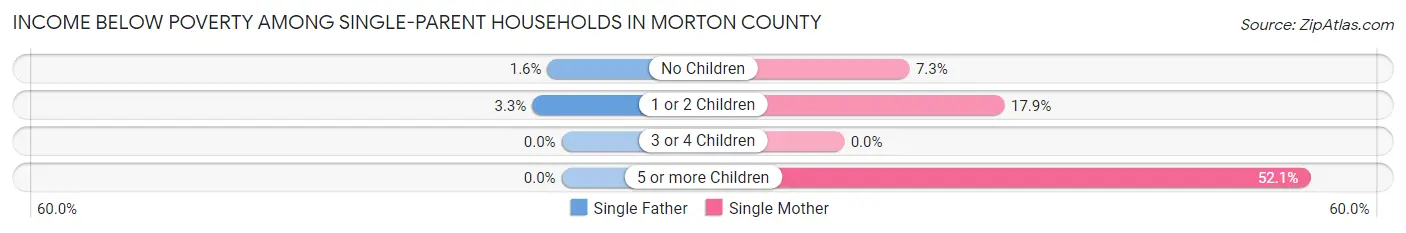
| Children | Single Father | Single Mother |
| No Children | 3 (1.6%) | 20 (7.3%) |
| 1 or 2 Children | 6 (3.3%) | 129 (17.9%) |
| 3 or 4 Children | 0 (0.0%) | 0 (0.0%) |
| 5 or more Children | 0 (0.0%) | 37 (52.1%) |
| Total | 9 (2.1%) | 186 (17.4%) |
Income Below Poverty Among Married-Couple vs Single-Parent Households in Morton County
The poverty data for Morton County shows that 149 of the married-couple family households (2.0%) and 195 of the single-parent households (13.0%) are living below the poverty level. Within the married-couple family households, those with 3 or 4 children have the highest poverty rate, with 94 households (13.8%) falling below the poverty line. Among the single-parent households, those with 5 or more children have the highest poverty rate, with 37 household (52.1%) living below poverty.
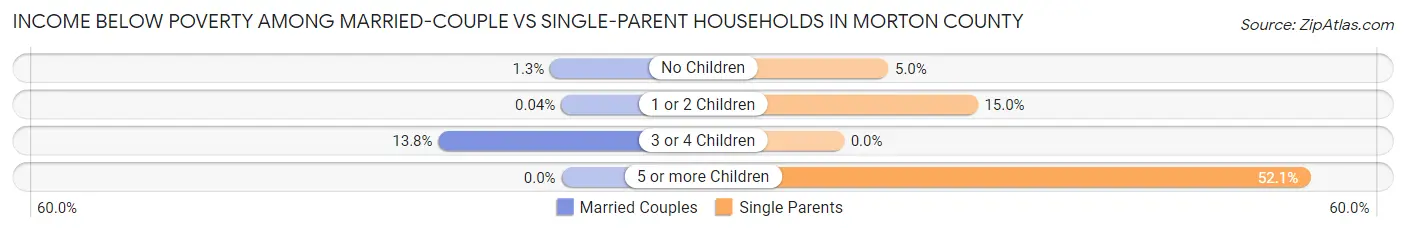
| Children | Married-Couple Families | Single-Parent Households |
| No Children | 54 (1.3%) | 23 (5.0%) |
| 1 or 2 Children | 1 (0.0%) | 135 (14.9%) |
| 3 or 4 Children | 94 (13.8%) | 0 (0.0%) |
| 5 or more Children | 0 (0.0%) | 37 (52.1%) |
| Total | 149 (2.0%) | 195 (13.0%) |
Employment Characteristics in Morton County
Employment by Class of Employer in Morton County
Among the 18,192 employed individuals in Morton County, private company employees (11,223 | 61.7%), local government employees (1,659 | 9.1%), and self-employed (not incorporated) (1,465 | 8.1%) make up the most common classes of employment.
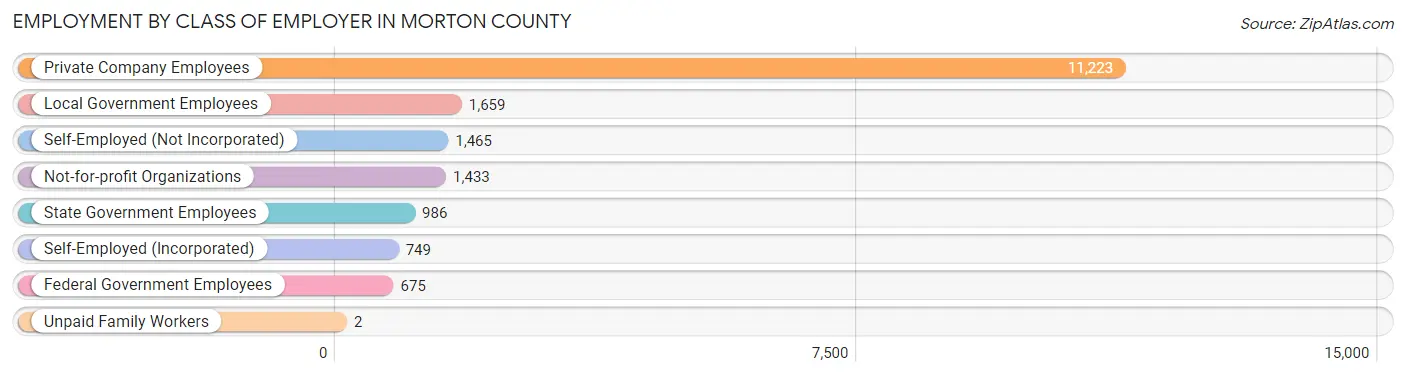
| Employer Class | # Employees | % Employees |
| Private Company Employees | 11,223 | 61.7% |
| Self-Employed (Incorporated) | 749 | 4.1% |
| Self-Employed (Not Incorporated) | 1,465 | 8.1% |
| Not-for-profit Organizations | 1,433 | 7.9% |
| Local Government Employees | 1,659 | 9.1% |
| State Government Employees | 986 | 5.4% |
| Federal Government Employees | 675 | 3.7% |
| Unpaid Family Workers | 2 | 0.0% |
| Total | 18,192 | 100.0% |
Employment Status by Age in Morton County
According to the labor force statistics for Morton County, out of the total population over 16 years of age (26,175), 71.3% or 18,663 individuals are in the labor force, with 2.0% or 373 of them unemployed. The age group with the highest labor force participation rate is 25 to 29 years, with 97.3% or 2,176 individuals in the labor force. Within the labor force, the 60 to 64 years age range has the highest percentage of unemployed individuals, with 4.3% or 51 of them being unemployed.
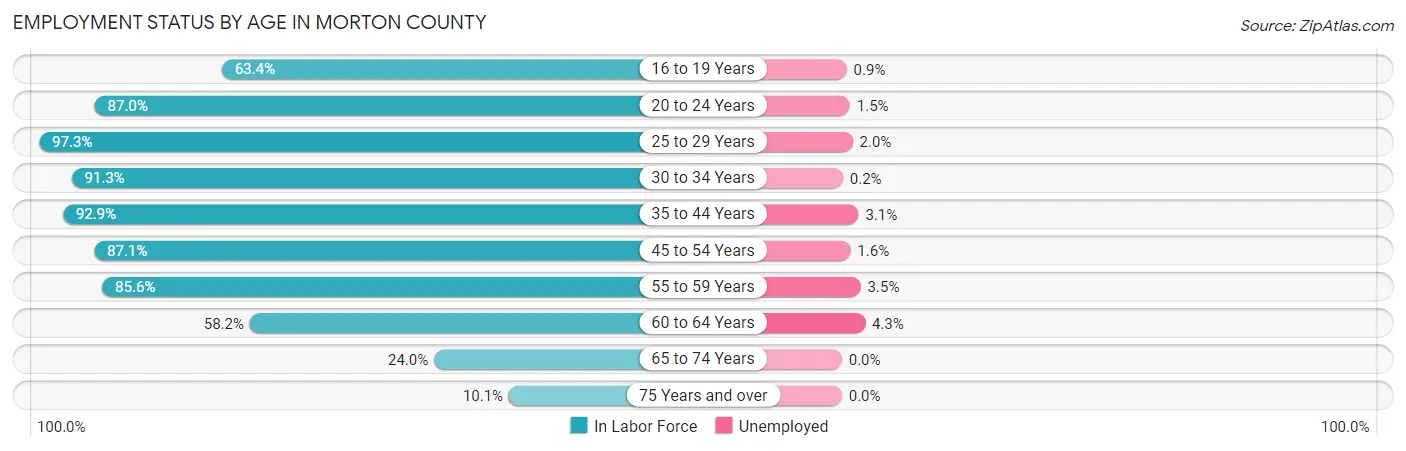
| Age Bracket | In Labor Force | Unemployed |
| 16 to 19 Years | 912 (63.4%) | 8 (0.9%) |
| 20 to 24 Years | 1,717 (87.0%) | 26 (1.5%) |
| 25 to 29 Years | 2,176 (97.3%) | 44 (2.0%) |
| 30 to 34 Years | 2,467 (91.3%) | 5 (0.2%) |
| 35 to 44 Years | 4,161 (92.9%) | 129 (3.1%) |
| 45 to 54 Years | 3,136 (87.1%) | 50 (1.6%) |
| 55 to 59 Years | 1,903 (85.6%) | 67 (3.5%) |
| 60 to 64 Years | 1,184 (58.2%) | 51 (4.3%) |
| 65 to 74 Years | 780 (24.0%) | 0 (0.0%) |
| 75 Years and over | 226 (10.1%) | 0 (0.0%) |
| Total | 18,663 (71.3%) | 373 (2.0%) |
Employment Status by Educational Attainment in Morton County
According to labor force statistics for Morton County, 87.0% of individuals (15,028) out of the total population between 25 and 64 years of age (17,274) are in the labor force, with 2.3% or 346 of them being unemployed. The group with the highest labor force participation rate are those with the educational attainment of bachelor's degree or higher, with 93.4% or 4,602 individuals in the labor force. Within the labor force, individuals with less than high school education have the highest percentage of unemployment, with 3.9% or 22 of them being unemployed.
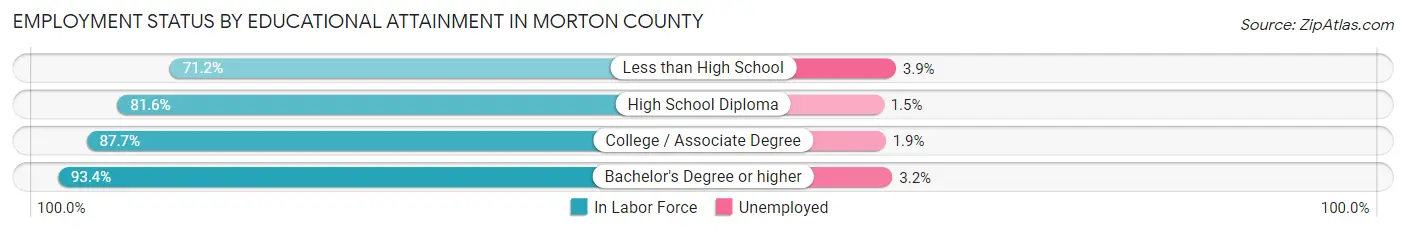
| Educational Attainment | In Labor Force | Unemployed |
| Less than High School | 558 (71.2%) | 31 (3.9%) |
| High School Diploma | 3,634 (81.6%) | 67 (1.5%) |
| College / Associate Degree | 6,235 (87.7%) | 135 (1.9%) |
| Bachelor's Degree or higher | 4,602 (93.4%) | 158 (3.2%) |
| Total | 15,028 (87.0%) | 397 (2.3%) |
Employment Occupations by Sex in Morton County
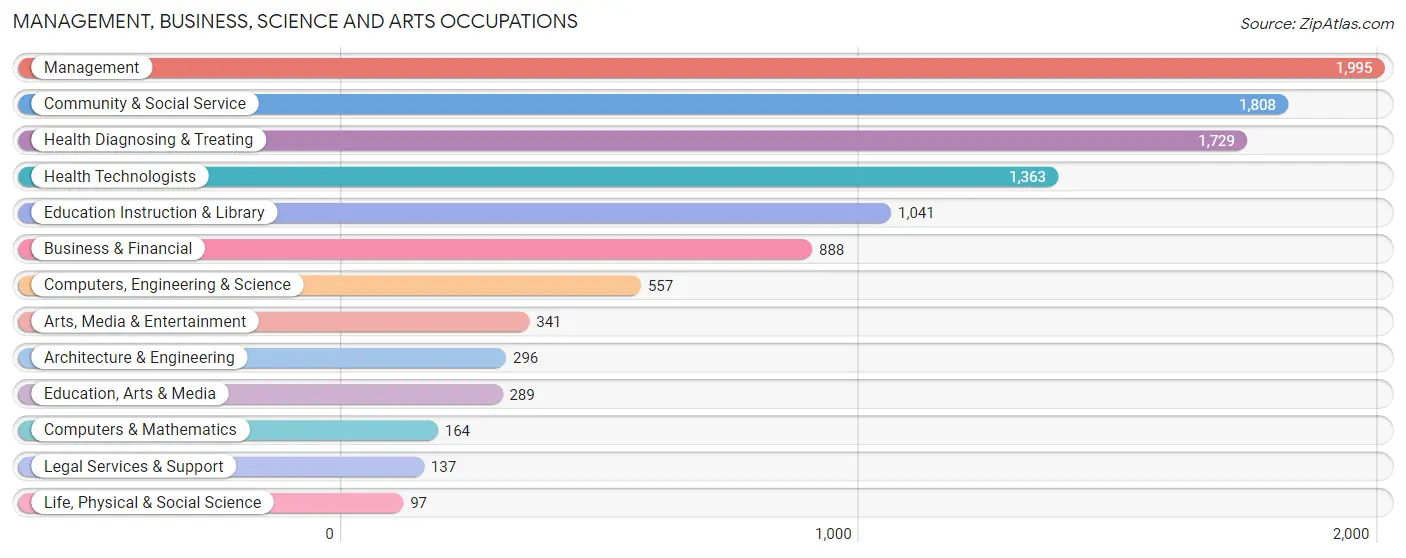
Management, Business, Science and Arts Occupations
The most common Management, Business, Science and Arts occupations in Morton County are Management (1,995 | 11.0%), Community & Social Service (1,808 | 9.9%), Health Diagnosing & Treating (1,729 | 9.5%), Health Technologists (1,363 | 7.5%), and Education Instruction & Library (1,041 | 5.7%).
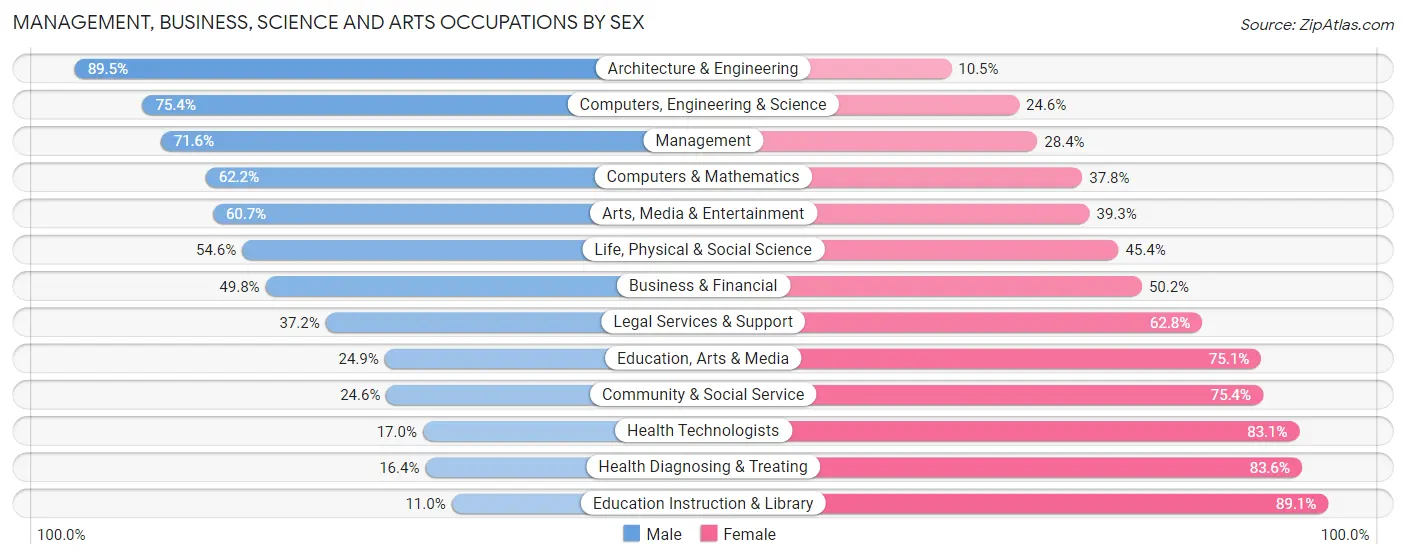
Management, Business, Science and Arts Occupations by Sex
Within the Management, Business, Science and Arts occupations in Morton County, the most male-oriented occupations are Architecture & Engineering (89.5%), Computers, Engineering & Science (75.4%), and Management (71.6%), while the most female-oriented occupations are Education Instruction & Library (89.0%), Health Diagnosing & Treating (83.6%), and Health Technologists (83.1%).
| Occupation | Male | Female |
| Management | 1,428 (71.6%) | 567 (28.4%) |
| Business & Financial | 442 (49.8%) | 446 (50.2%) |
| Computers, Engineering & Science | 420 (75.4%) | 137 (24.6%) |
| Computers & Mathematics | 102 (62.2%) | 62 (37.8%) |
| Architecture & Engineering | 265 (89.5%) | 31 (10.5%) |
| Life, Physical & Social Science | 53 (54.6%) | 44 (45.4%) |
| Community & Social Service | 444 (24.6%) | 1,364 (75.4%) |
| Education, Arts & Media | 72 (24.9%) | 217 (75.1%) |
| Legal Services & Support | 51 (37.2%) | 86 (62.8%) |
| Education Instruction & Library | 114 (11.0%) | 927 (89.0%) |
| Arts, Media & Entertainment | 207 (60.7%) | 134 (39.3%) |
| Health Diagnosing & Treating | 284 (16.4%) | 1,445 (83.6%) |
| Health Technologists | 231 (17.0%) | 1,132 (83.1%) |
| Total (Category) | 3,018 (43.3%) | 3,959 (56.7%) |
| Total (Overall) | 9,734 (53.5%) | 8,474 (46.5%) |
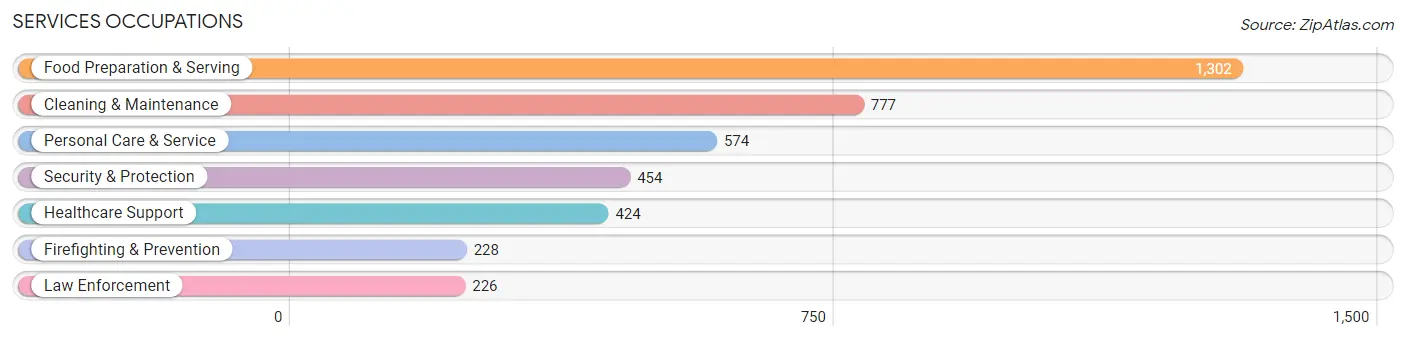
Services Occupations
The most common Services occupations in Morton County are Food Preparation & Serving (1,302 | 7.1%), Cleaning & Maintenance (777 | 4.3%), Personal Care & Service (574 | 3.2%), Security & Protection (454 | 2.5%), and Healthcare Support (424 | 2.3%).
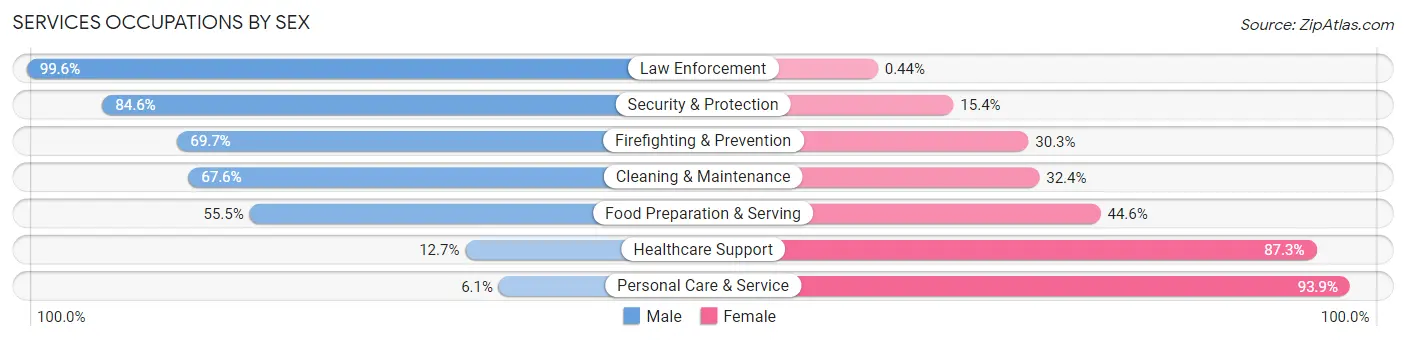
Services Occupations by Sex
Within the Services occupations in Morton County, the most male-oriented occupations are Law Enforcement (99.6%), Security & Protection (84.6%), and Firefighting & Prevention (69.7%), while the most female-oriented occupations are Personal Care & Service (93.9%), Healthcare Support (87.3%), and Food Preparation & Serving (44.6%).
| Occupation | Male | Female |
| Healthcare Support | 54 (12.7%) | 370 (87.3%) |
| Security & Protection | 384 (84.6%) | 70 (15.4%) |
| Firefighting & Prevention | 159 (69.7%) | 69 (30.3%) |
| Law Enforcement | 225 (99.6%) | 1 (0.4%) |
| Food Preparation & Serving | 722 (55.4%) | 580 (44.6%) |
| Cleaning & Maintenance | 525 (67.6%) | 252 (32.4%) |
| Personal Care & Service | 35 (6.1%) | 539 (93.9%) |
| Total (Category) | 1,720 (48.7%) | 1,811 (51.3%) |
| Total (Overall) | 9,734 (53.5%) | 8,474 (46.5%) |
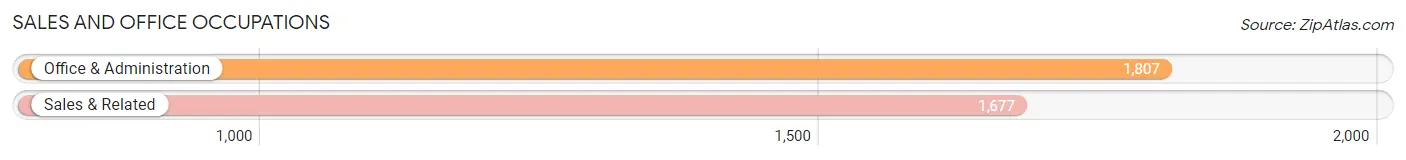
Sales and Office Occupations
The most common Sales and Office occupations in Morton County are Office & Administration (1,807 | 9.9%), and Sales & Related (1,677 | 9.2%).
Sales and Office Occupations by Sex
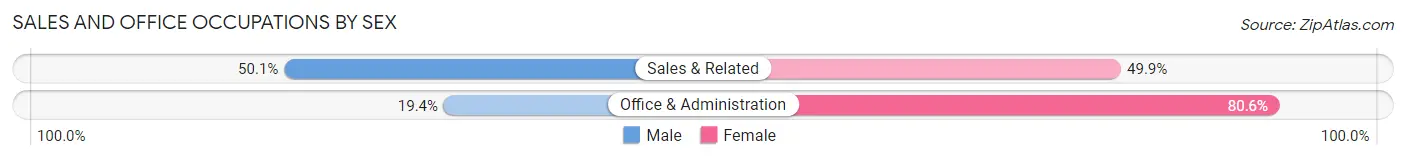
| Occupation | Male | Female |
| Sales & Related | 840 (50.1%) | 837 (49.9%) |
| Office & Administration | 350 (19.4%) | 1,457 (80.6%) |
| Total (Category) | 1,190 (34.2%) | 2,294 (65.8%) |
| Total (Overall) | 9,734 (53.5%) | 8,474 (46.5%) |
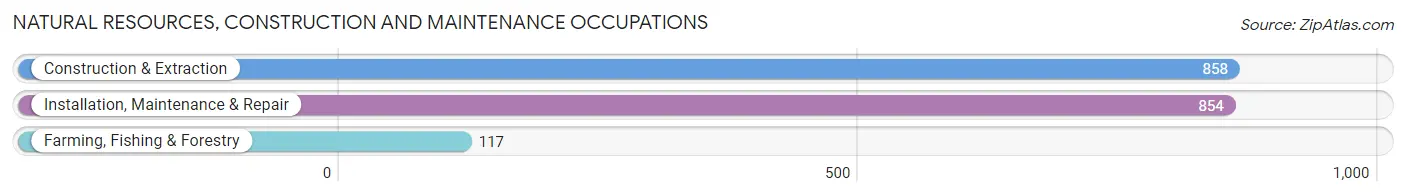
Natural Resources, Construction and Maintenance Occupations
The most common Natural Resources, Construction and Maintenance occupations in Morton County are Construction & Extraction (858 | 4.7%), Installation, Maintenance & Repair (854 | 4.7%), and Farming, Fishing & Forestry (117 | 0.6%).
Natural Resources, Construction and Maintenance Occupations by Sex
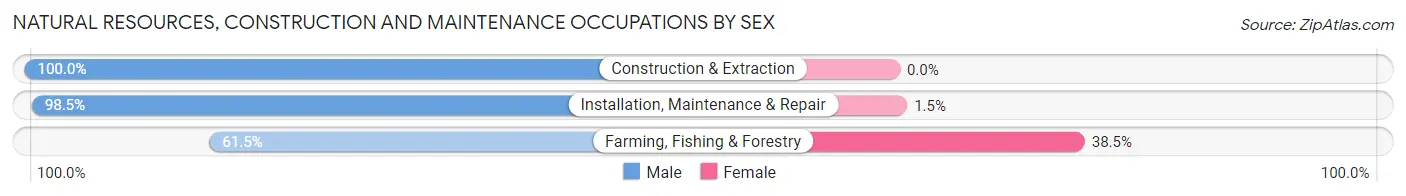
| Occupation | Male | Female |
| Farming, Fishing & Forestry | 72 (61.5%) | 45 (38.5%) |
| Construction & Extraction | 858 (100.0%) | 0 (0.0%) |
| Installation, Maintenance & Repair | 841 (98.5%) | 13 (1.5%) |
| Total (Category) | 1,771 (96.8%) | 58 (3.2%) |
| Total (Overall) | 9,734 (53.5%) | 8,474 (46.5%) |
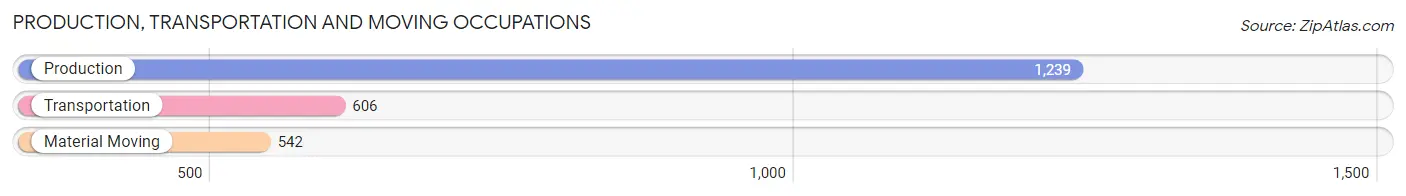
Production, Transportation and Moving Occupations
The most common Production, Transportation and Moving occupations in Morton County are Production (1,239 | 6.8%), Transportation (606 | 3.3%), and Material Moving (542 | 3.0%).
Production, Transportation and Moving Occupations by Sex
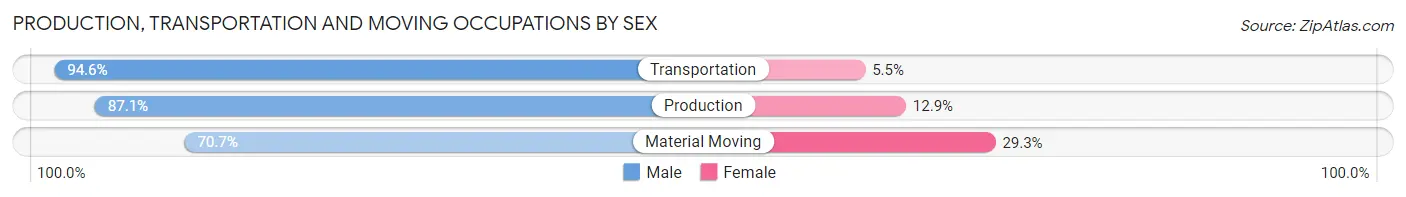
| Occupation | Male | Female |
| Production | 1,079 (87.1%) | 160 (12.9%) |
| Transportation | 573 (94.6%) | 33 (5.4%) |
| Material Moving | 383 (70.7%) | 159 (29.3%) |
| Total (Category) | 2,035 (85.3%) | 352 (14.7%) |
| Total (Overall) | 9,734 (53.5%) | 8,474 (46.5%) |
Employment Industries by Sex in Morton County
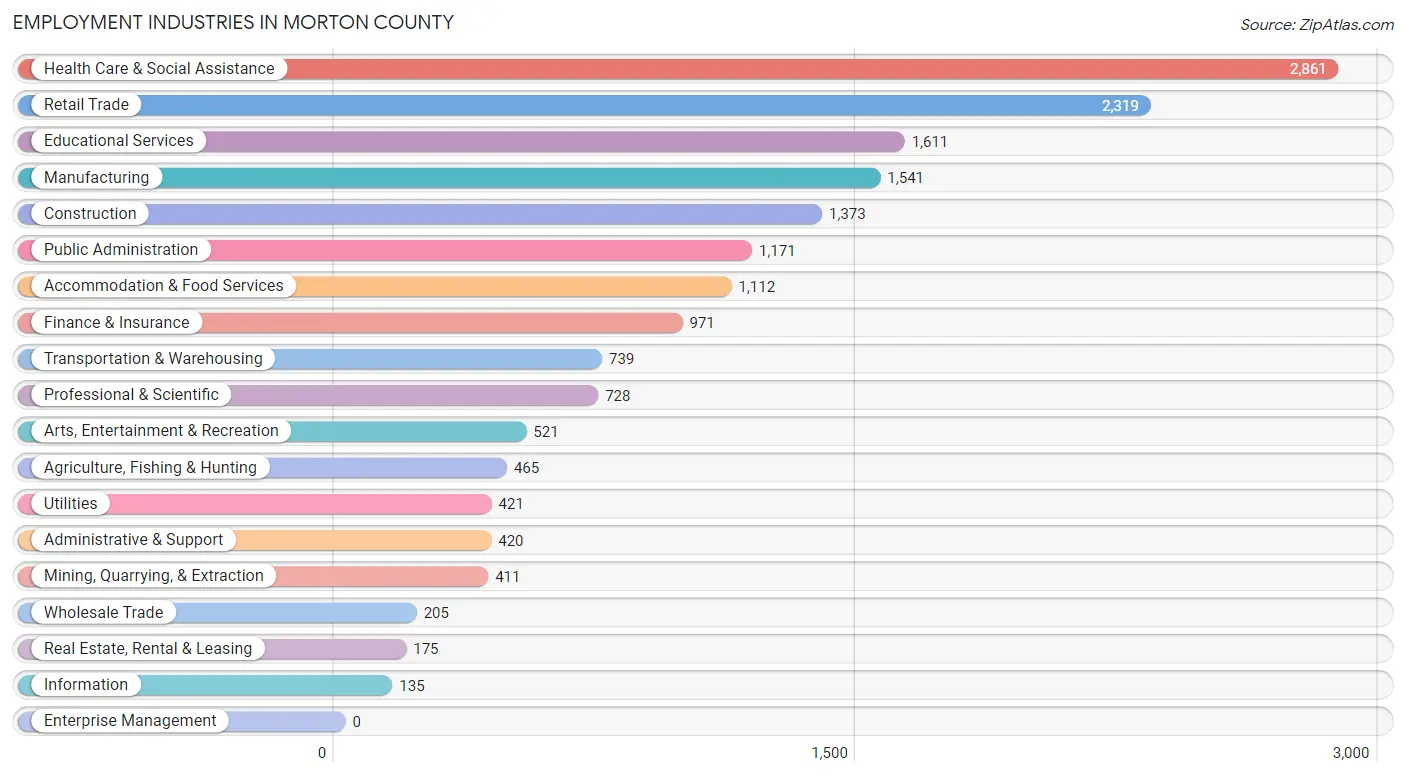
Employment Industries in Morton County
The major employment industries in Morton County include Health Care & Social Assistance (2,861 | 15.7%), Retail Trade (2,319 | 12.7%), Educational Services (1,611 | 8.8%), Manufacturing (1,541 | 8.5%), and Construction (1,373 | 7.5%).
Employment Industries by Sex in Morton County
The Morton County industries that see more men than women are Mining, Quarrying, & Extraction (99.3%), Construction (93.4%), and Utilities (87.2%), whereas the industries that tend to have a higher number of women are Health Care & Social Assistance (84.6%), Educational Services (70.8%), and Finance & Insurance (70.0%).
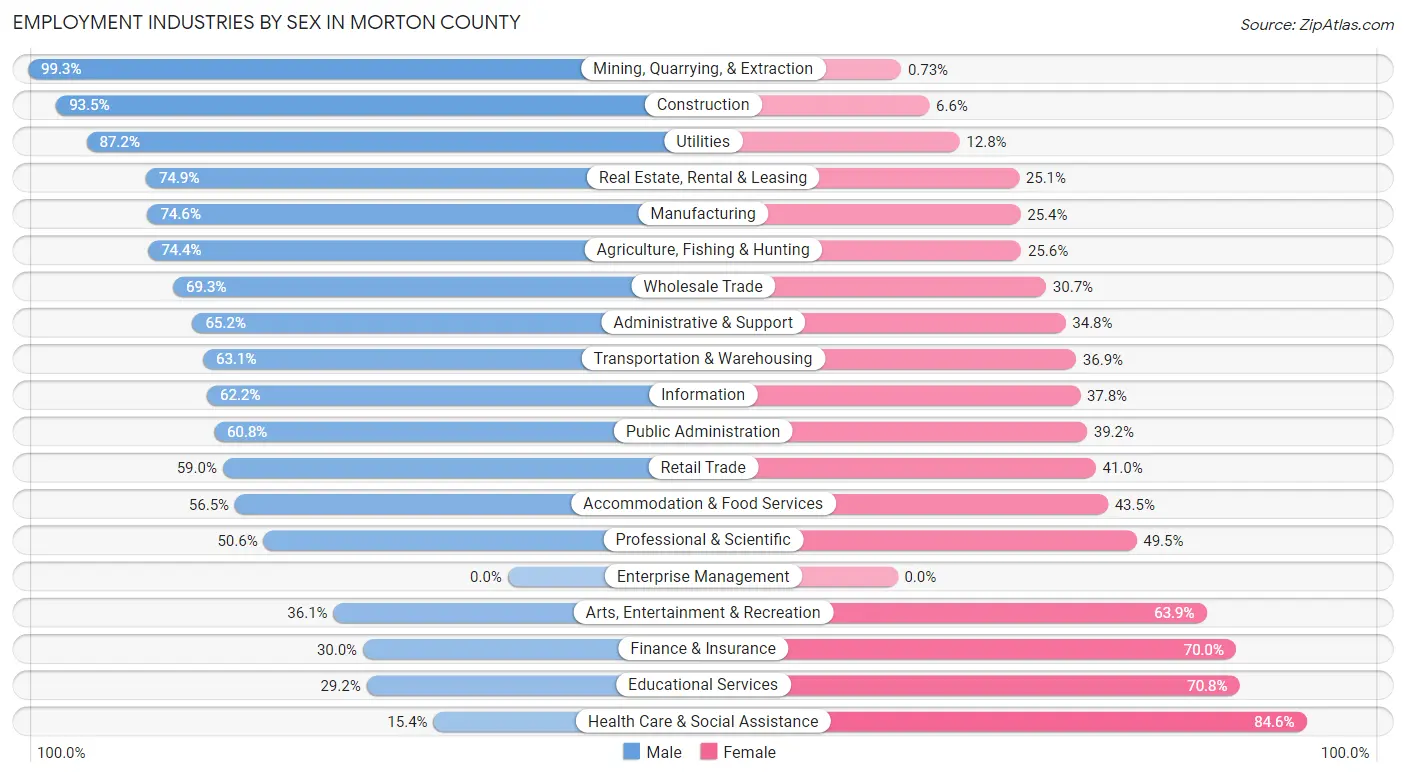
| Industry | Male | Female |
| Agriculture, Fishing & Hunting | 346 (74.4%) | 119 (25.6%) |
| Mining, Quarrying, & Extraction | 408 (99.3%) | 3 (0.7%) |
| Construction | 1,283 (93.4%) | 90 (6.6%) |
| Manufacturing | 1,149 (74.6%) | 392 (25.4%) |
| Wholesale Trade | 142 (69.3%) | 63 (30.7%) |
| Retail Trade | 1,368 (59.0%) | 951 (41.0%) |
| Transportation & Warehousing | 466 (63.1%) | 273 (36.9%) |
| Utilities | 367 (87.2%) | 54 (12.8%) |
| Information | 84 (62.2%) | 51 (37.8%) |
| Finance & Insurance | 291 (30.0%) | 680 (70.0%) |
| Real Estate, Rental & Leasing | 131 (74.9%) | 44 (25.1%) |
| Professional & Scientific | 368 (50.5%) | 360 (49.4%) |
| Enterprise Management | 0 (0.0%) | 0 (0.0%) |
| Administrative & Support | 274 (65.2%) | 146 (34.8%) |
| Educational Services | 471 (29.2%) | 1,140 (70.8%) |
| Health Care & Social Assistance | 440 (15.4%) | 2,421 (84.6%) |
| Arts, Entertainment & Recreation | 188 (36.1%) | 333 (63.9%) |
| Accommodation & Food Services | 628 (56.5%) | 484 (43.5%) |
| Public Administration | 712 (60.8%) | 459 (39.2%) |
| Total | 9,734 (53.5%) | 8,474 (46.5%) |
Education in Morton County
School Enrollment in Morton County
The most common levels of schooling among the 7,307 students in Morton County are middle school (1,940 | 26.6%), elementary school (1,338 | 18.3%), and high school (1,330 | 18.2%).
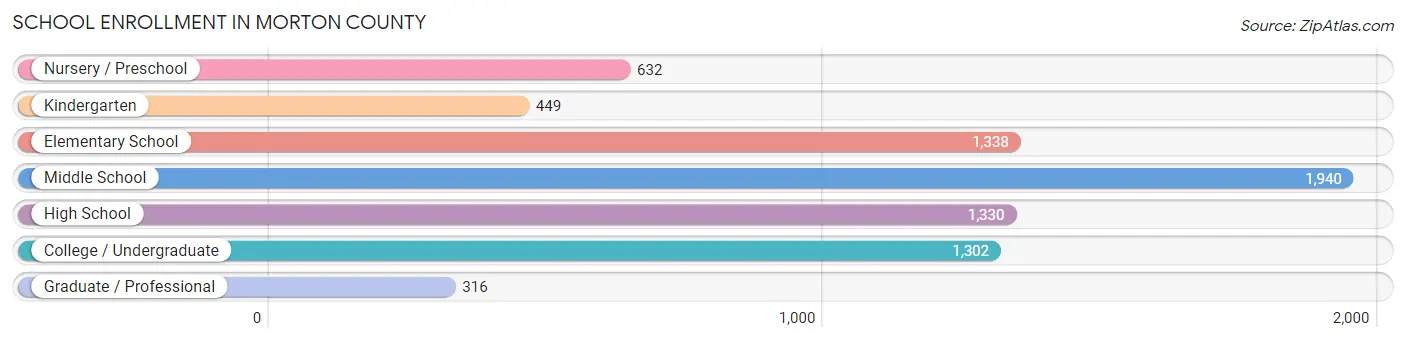
| School Level | # Students | % Students |
| Nursery / Preschool | 632 | 8.6% |
| Kindergarten | 449 | 6.1% |
| Elementary School | 1,338 | 18.3% |
| Middle School | 1,940 | 26.6% |
| High School | 1,330 | 18.2% |
| College / Undergraduate | 1,302 | 17.8% |
| Graduate / Professional | 316 | 4.3% |
| Total | 7,307 | 100.0% |
School Enrollment by Age by Funding Source in Morton County
Out of a total of 7,307 students who are enrolled in schools in Morton County, 738 (10.1%) attend a private institution, while the remaining 6,569 (89.9%) are enrolled in public schools. The age group of 25 to 34 year olds has the highest likelihood of being enrolled in private schools, with 113 (36.6% in the age bracket) enrolled. Conversely, the age group of 15 to 17 year olds has the lowest likelihood of being enrolled in a private school, with 1,114 (96.9% in the age bracket) attending a public institution.
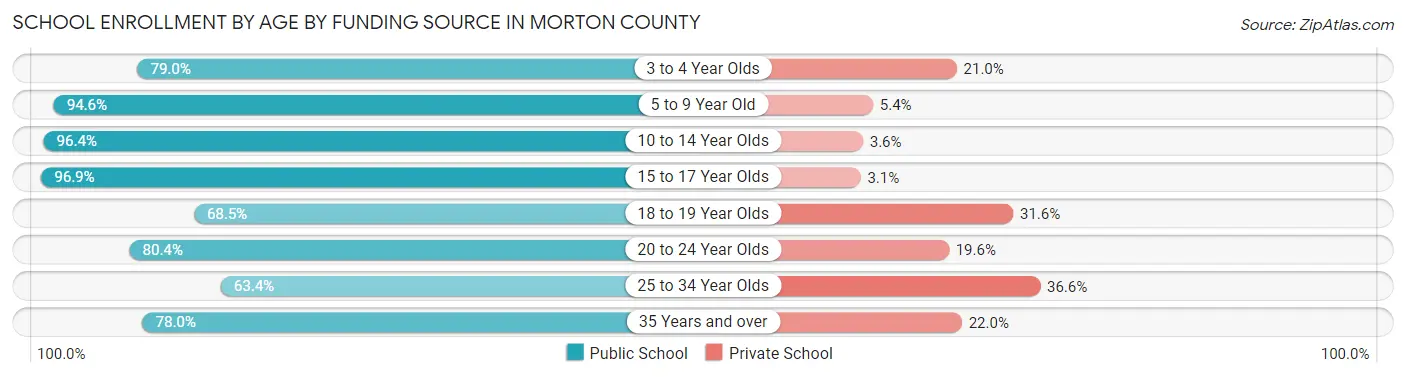
| Age Bracket | Public School | Private School |
| 3 to 4 Year Olds | 244 (79.0%) | 65 (21.0%) |
| 5 to 9 Year Old | 1,894 (94.6%) | 109 (5.4%) |
| 10 to 14 Year Olds | 2,004 (96.4%) | 74 (3.6%) |
| 15 to 17 Year Olds | 1,114 (96.9%) | 36 (3.1%) |
| 18 to 19 Year Olds | 282 (68.4%) | 130 (31.6%) |
| 20 to 24 Year Olds | 567 (80.4%) | 138 (19.6%) |
| 25 to 34 Year Olds | 196 (63.4%) | 113 (36.6%) |
| 35 Years and over | 266 (78.0%) | 75 (22.0%) |
| Total | 6,569 (89.9%) | 738 (10.1%) |
Educational Attainment by Field of Study in Morton County
Science & technology (1,670 | 25.2%), business (1,140 | 17.2%), education (1,060 | 16.0%), arts & humanities (662 | 10.0%), and bio, nature & agricultural (484 | 7.3%) are the most common fields of study among 6,626 individuals in Morton County who have obtained a bachelor's degree or higher.
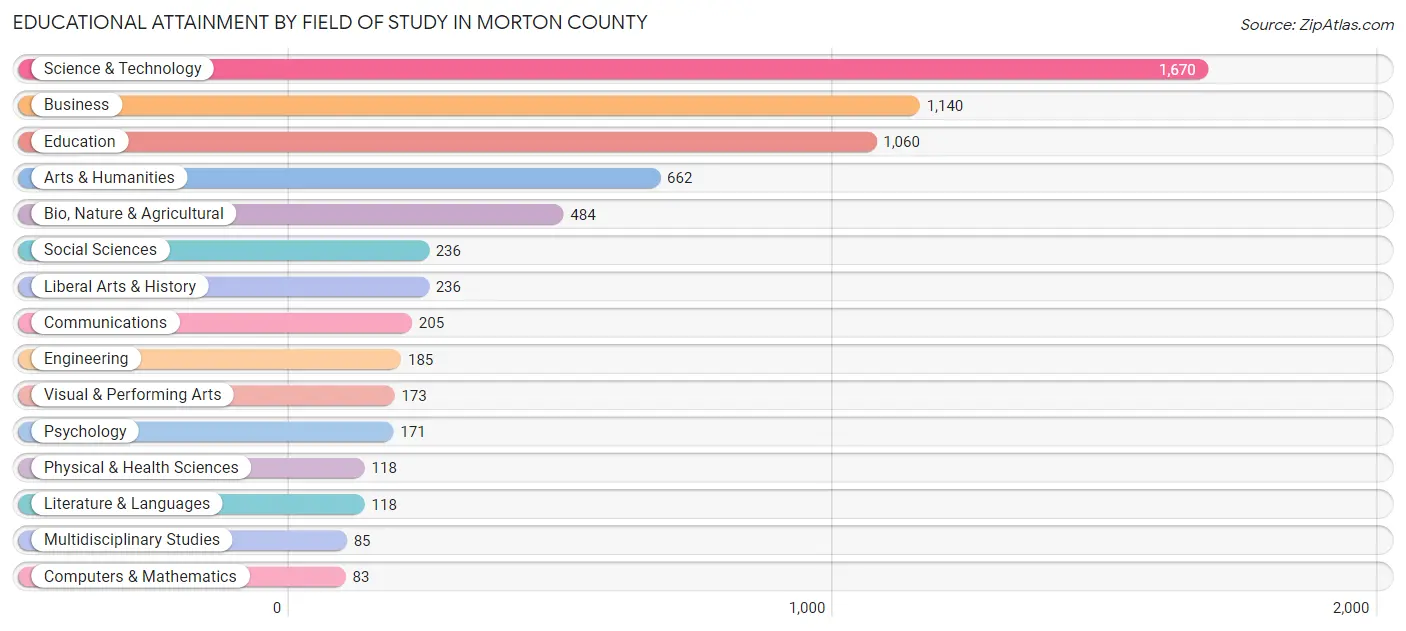
| Field of Study | # Graduates | % Graduates |
| Computers & Mathematics | 83 | 1.3% |
| Bio, Nature & Agricultural | 484 | 7.3% |
| Physical & Health Sciences | 118 | 1.8% |
| Psychology | 171 | 2.6% |
| Social Sciences | 236 | 3.6% |
| Engineering | 185 | 2.8% |
| Multidisciplinary Studies | 85 | 1.3% |
| Science & Technology | 1,670 | 25.2% |
| Business | 1,140 | 17.2% |
| Education | 1,060 | 16.0% |
| Literature & Languages | 118 | 1.8% |
| Liberal Arts & History | 236 | 3.6% |
| Visual & Performing Arts | 173 | 2.6% |
| Communications | 205 | 3.1% |
| Arts & Humanities | 662 | 10.0% |
| Total | 6,626 | 100.0% |
Transportation & Commute in Morton County
Vehicle Availability by Sex in Morton County
The most prevalent vehicle ownership categories in Morton County are males with 2 vehicles (3,439, accounting for 35.3%) and females with 2 vehicles (2,862, making up 40.7%).
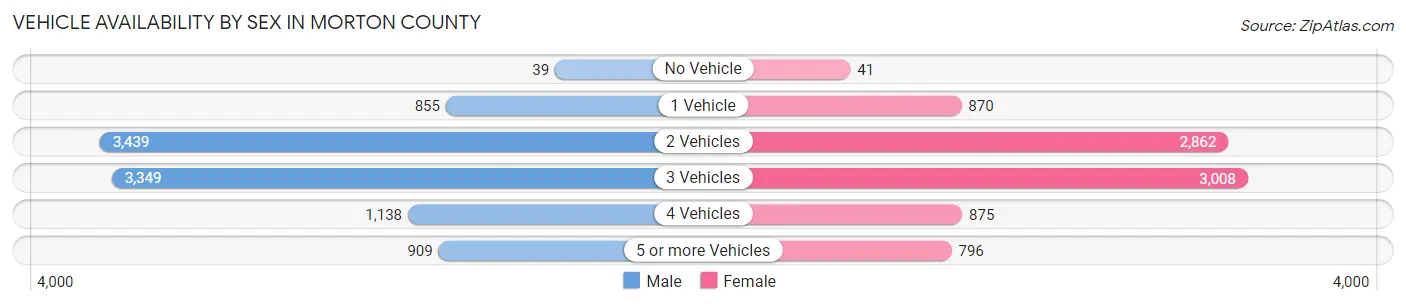
| Vehicles Available | Male | Female |
| No Vehicle | 39 (0.4%) | 41 (0.5%) |
| 1 Vehicle | 855 (8.8%) | 870 (10.3%) |
| 2 Vehicles | 3,439 (35.3%) | 2,862 (33.9%) |
| 3 Vehicles | 3,349 (34.4%) | 3,008 (35.6%) |
| 4 Vehicles | 1,138 (11.7%) | 875 (10.3%) |
| 5 or more Vehicles | 909 (9.3%) | 796 (9.4%) |
| Total | 9,729 (100.0%) | 8,452 (100.0%) |
Commute Time in Morton County
The most frequently occuring commute durations in Morton County are 15 to 19 minutes (4,687 commuters, 27.8%), 10 to 14 minutes (3,502 commuters, 20.7%), and 20 to 24 minutes (2,200 commuters, 13.0%).
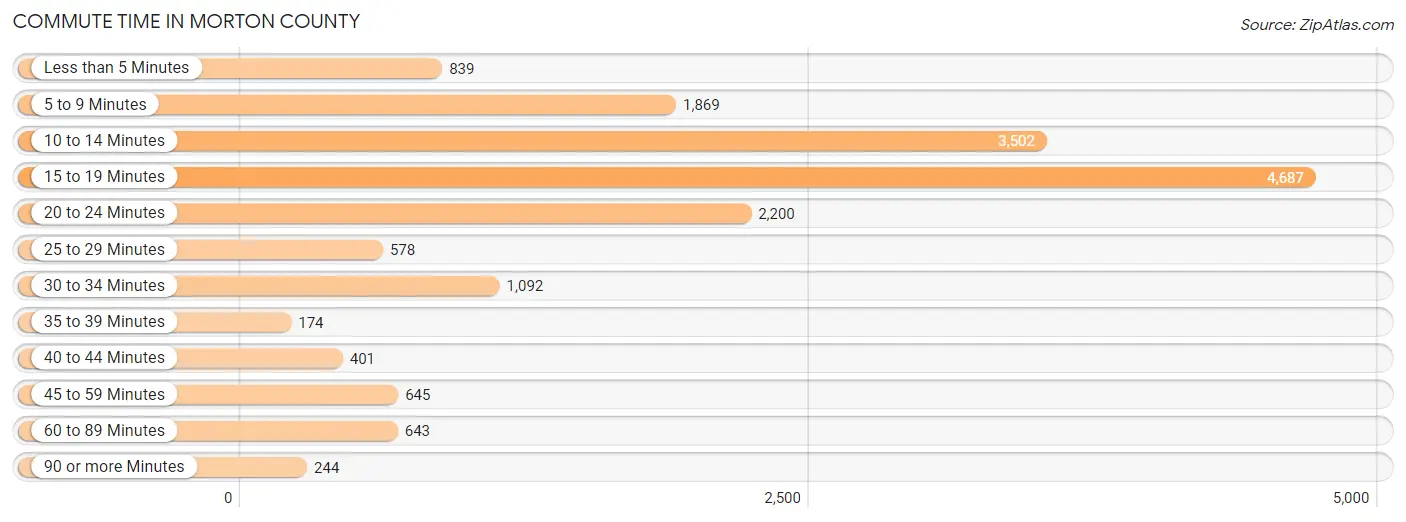
| Commute Time | # Commuters | % Commuters |
| Less than 5 Minutes | 839 | 5.0% |
| 5 to 9 Minutes | 1,869 | 11.1% |
| 10 to 14 Minutes | 3,502 | 20.7% |
| 15 to 19 Minutes | 4,687 | 27.8% |
| 20 to 24 Minutes | 2,200 | 13.0% |
| 25 to 29 Minutes | 578 | 3.4% |
| 30 to 34 Minutes | 1,092 | 6.5% |
| 35 to 39 Minutes | 174 | 1.0% |
| 40 to 44 Minutes | 401 | 2.4% |
| 45 to 59 Minutes | 645 | 3.8% |
| 60 to 89 Minutes | 643 | 3.8% |
| 90 or more Minutes | 244 | 1.5% |
Commute Time by Sex in Morton County
The most common commute times in Morton County are 15 to 19 minutes (2,480 commuters, 27.3%) for males and 15 to 19 minutes (2,207 commuters, 28.4%) for females.
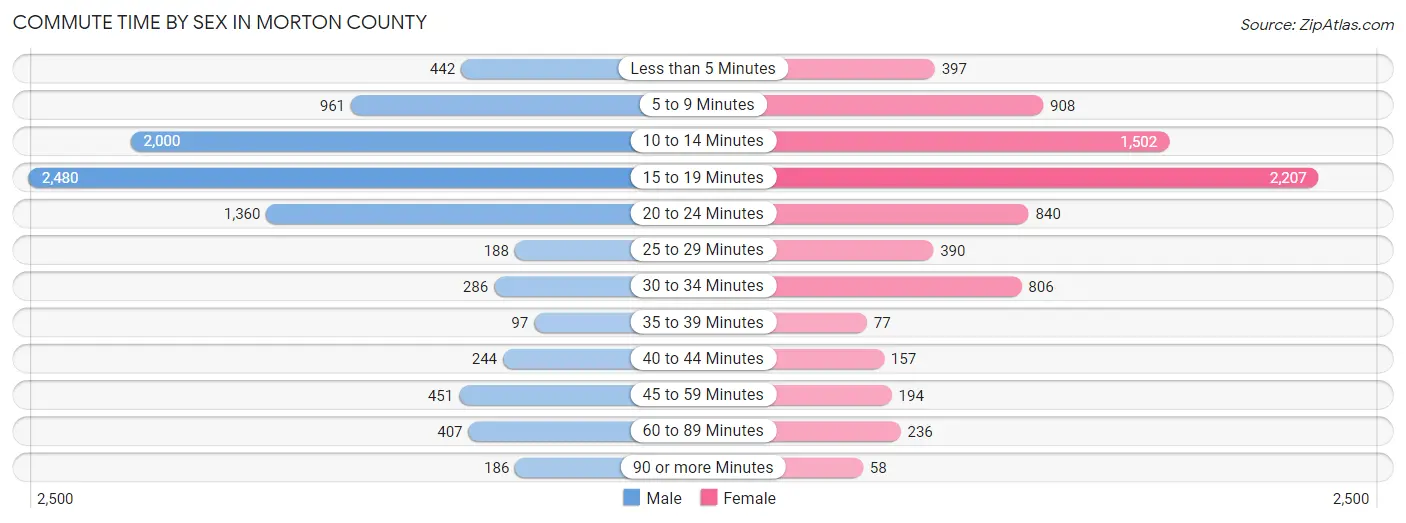
| Commute Time | Male | Female |
| Less than 5 Minutes | 442 (4.9%) | 397 (5.1%) |
| 5 to 9 Minutes | 961 (10.6%) | 908 (11.7%) |
| 10 to 14 Minutes | 2,000 (22.0%) | 1,502 (19.3%) |
| 15 to 19 Minutes | 2,480 (27.3%) | 2,207 (28.4%) |
| 20 to 24 Minutes | 1,360 (14.9%) | 840 (10.8%) |
| 25 to 29 Minutes | 188 (2.1%) | 390 (5.0%) |
| 30 to 34 Minutes | 286 (3.1%) | 806 (10.4%) |
| 35 to 39 Minutes | 97 (1.1%) | 77 (1.0%) |
| 40 to 44 Minutes | 244 (2.7%) | 157 (2.0%) |
| 45 to 59 Minutes | 451 (5.0%) | 194 (2.5%) |
| 60 to 89 Minutes | 407 (4.5%) | 236 (3.0%) |
| 90 or more Minutes | 186 (2.0%) | 58 (0.7%) |
Time of Departure to Work by Sex in Morton County
The most frequent times of departure to work in Morton County are 7:00 AM to 7:29 AM (1,546, 17.0%) for males and 7:30 AM to 7:59 AM (1,637, 21.1%) for females.
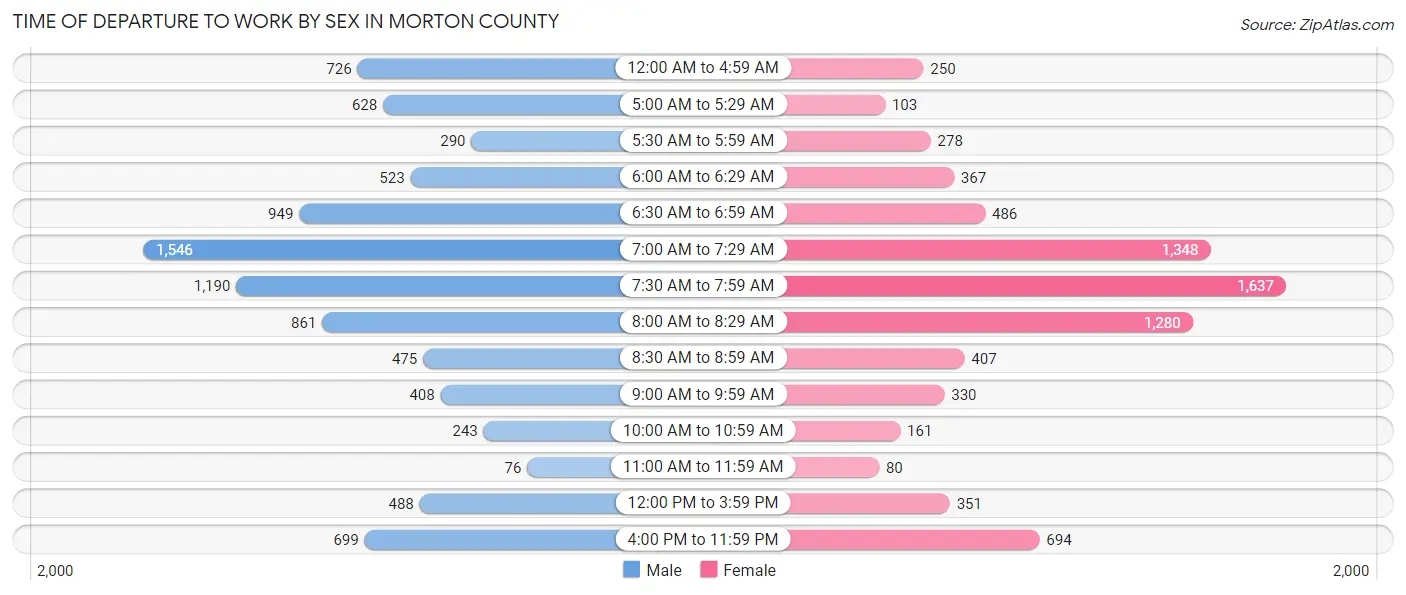
| Time of Departure | Male | Female |
| 12:00 AM to 4:59 AM | 726 (8.0%) | 250 (3.2%) |
| 5:00 AM to 5:29 AM | 628 (6.9%) | 103 (1.3%) |
| 5:30 AM to 5:59 AM | 290 (3.2%) | 278 (3.6%) |
| 6:00 AM to 6:29 AM | 523 (5.8%) | 367 (4.7%) |
| 6:30 AM to 6:59 AM | 949 (10.4%) | 486 (6.2%) |
| 7:00 AM to 7:29 AM | 1,546 (17.0%) | 1,348 (17.3%) |
| 7:30 AM to 7:59 AM | 1,190 (13.1%) | 1,637 (21.1%) |
| 8:00 AM to 8:29 AM | 861 (9.5%) | 1,280 (16.5%) |
| 8:30 AM to 8:59 AM | 475 (5.2%) | 407 (5.2%) |
| 9:00 AM to 9:59 AM | 408 (4.5%) | 330 (4.3%) |
| 10:00 AM to 10:59 AM | 243 (2.7%) | 161 (2.1%) |
| 11:00 AM to 11:59 AM | 76 (0.8%) | 80 (1.0%) |
| 12:00 PM to 3:59 PM | 488 (5.4%) | 351 (4.5%) |
| 4:00 PM to 11:59 PM | 699 (7.7%) | 694 (8.9%) |
| Total | 9,102 (100.0%) | 7,772 (100.0%) |
Housing Occupancy in Morton County
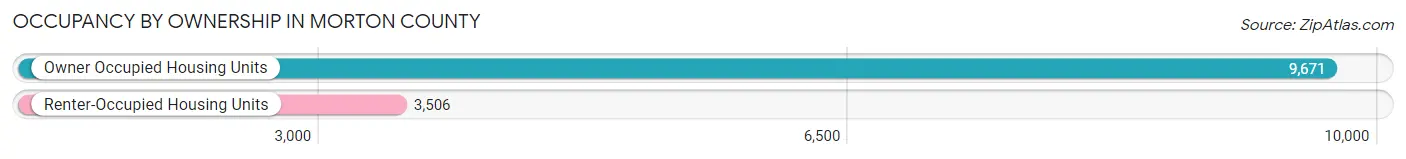
Occupancy by Ownership in Morton County
Of the total 13,177 dwellings in Morton County, owner-occupied units account for 9,671 (73.4%), while renter-occupied units make up 3,506 (26.6%).
| Occupancy | # Housing Units | % Housing Units |
| Owner Occupied Housing Units | 9,671 | 73.4% |
| Renter-Occupied Housing Units | 3,506 | 26.6% |
| Total Occupied Housing Units | 13,177 | 100.0% |
Occupancy by Household Size in Morton County
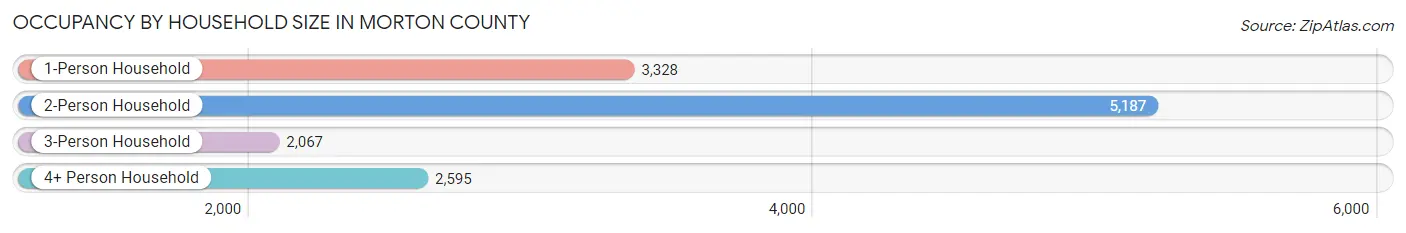
| Household Size | # Housing Units | % Housing Units |
| 1-Person Household | 3,328 | 25.3% |
| 2-Person Household | 5,187 | 39.4% |
| 3-Person Household | 2,067 | 15.7% |
| 4+ Person Household | 2,595 | 19.7% |
| Total Housing Units | 13,177 | 100.0% |
Occupancy by Ownership by Household Size in Morton County
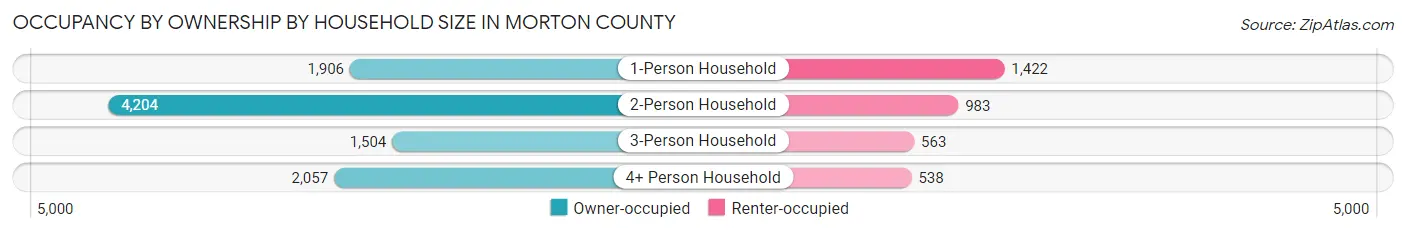
| Household Size | Owner-occupied | Renter-occupied |
| 1-Person Household | 1,906 (57.3%) | 1,422 (42.7%) |
| 2-Person Household | 4,204 (81.0%) | 983 (19.0%) |
| 3-Person Household | 1,504 (72.8%) | 563 (27.2%) |
| 4+ Person Household | 2,057 (79.3%) | 538 (20.7%) |
| Total Housing Units | 9,671 (73.4%) | 3,506 (26.6%) |
Occupancy by Educational Attainment in Morton County
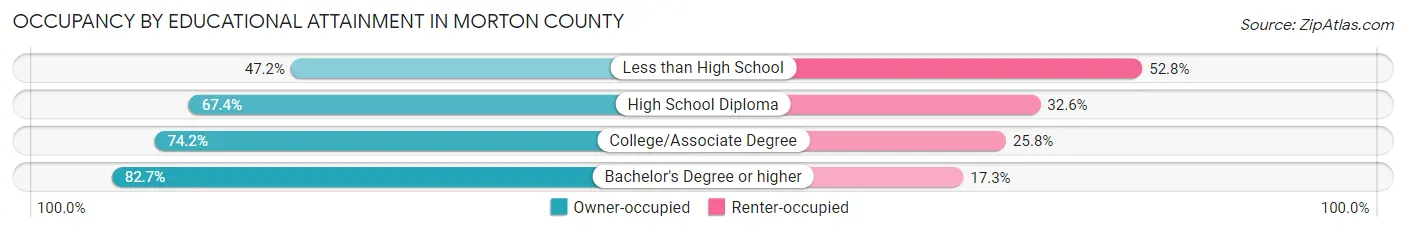
| Household Size | Owner-occupied | Renter-occupied |
| Less than High School | 367 (47.2%) | 410 (52.8%) |
| High School Diploma | 2,274 (67.4%) | 1,098 (32.6%) |
| College/Associate Degree | 3,822 (74.2%) | 1,327 (25.8%) |
| Bachelor's Degree or higher | 3,208 (82.7%) | 671 (17.3%) |
Occupancy by Age of Householder in Morton County
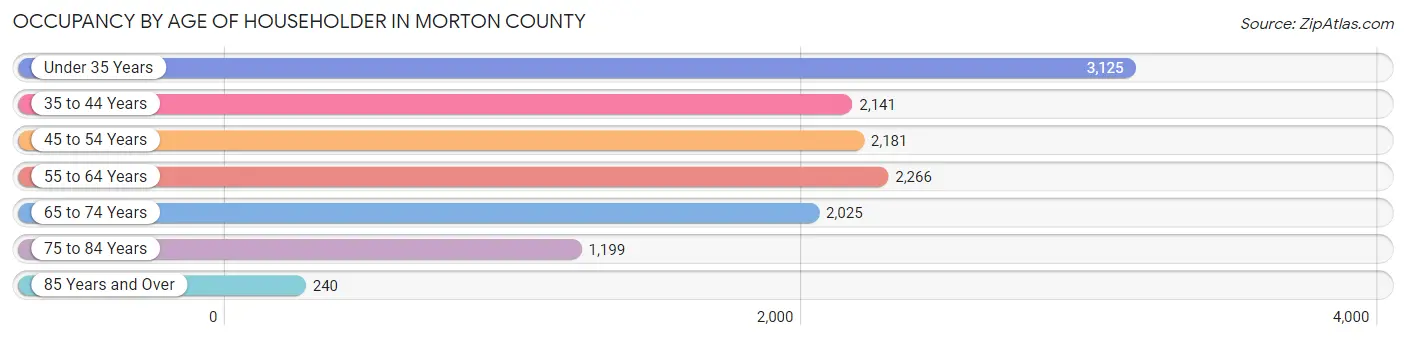
| Age Bracket | # Households | % Households |
| Under 35 Years | 3,125 | 23.7% |
| 35 to 44 Years | 2,141 | 16.3% |
| 45 to 54 Years | 2,181 | 16.6% |
| 55 to 64 Years | 2,266 | 17.2% |
| 65 to 74 Years | 2,025 | 15.4% |
| 75 to 84 Years | 1,199 | 9.1% |
| 85 Years and Over | 240 | 1.8% |
| Total | 13,177 | 100.0% |
Housing Finances in Morton County
Median Income by Occupancy in Morton County
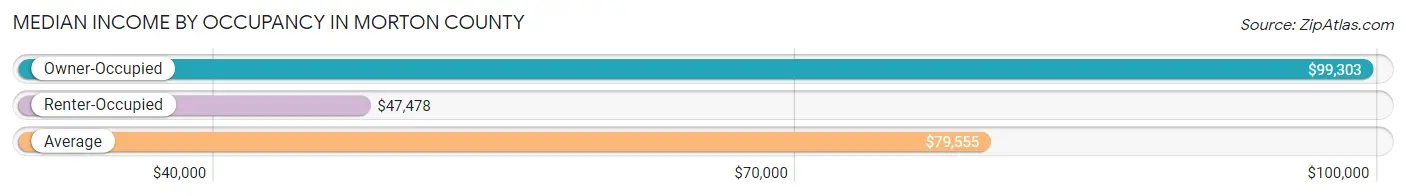
| Occupancy Type | # Households | Median Income |
| Owner-Occupied | 9,671 (73.4%) | $99,303 |
| Renter-Occupied | 3,506 (26.6%) | $47,478 |
| Average | 13,177 (100.0%) | $79,555 |
Occupancy by Householder Income Bracket in Morton County
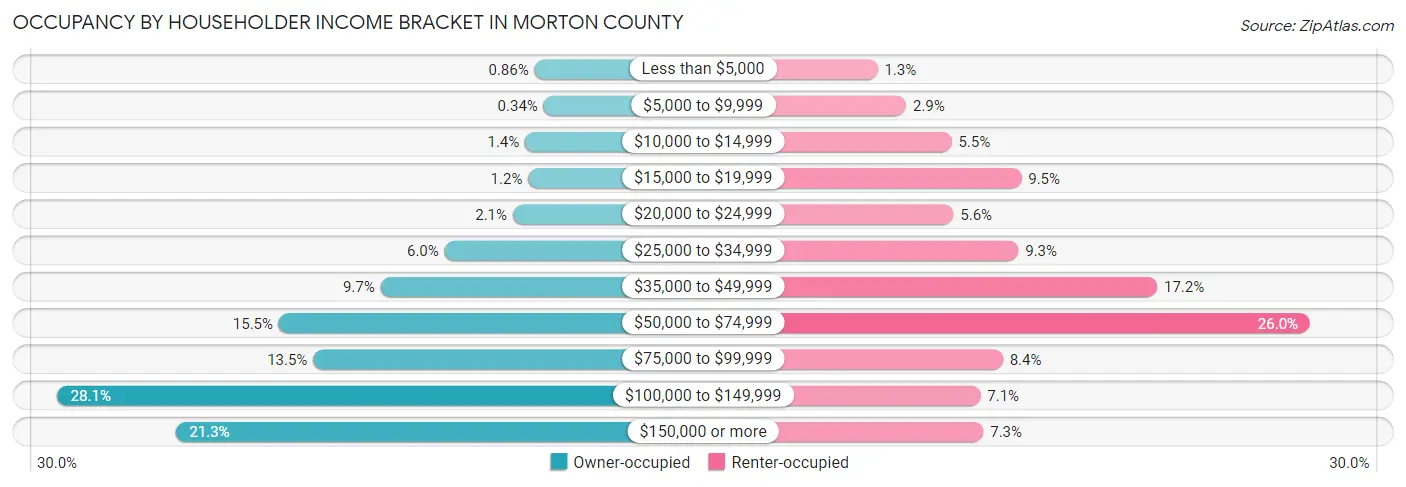
| Income Bracket | Owner-occupied | Renter-occupied |
| Less than $5,000 | 83 (0.9%) | 44 (1.3%) |
| $5,000 to $9,999 | 33 (0.3%) | 101 (2.9%) |
| $10,000 to $14,999 | 135 (1.4%) | 192 (5.5%) |
| $15,000 to $19,999 | 118 (1.2%) | 332 (9.5%) |
| $20,000 to $24,999 | 203 (2.1%) | 196 (5.6%) |
| $25,000 to $34,999 | 580 (6.0%) | 326 (9.3%) |
| $35,000 to $49,999 | 934 (9.7%) | 604 (17.2%) |
| $50,000 to $74,999 | 1,496 (15.5%) | 910 (26.0%) |
| $75,000 to $99,999 | 1,307 (13.5%) | 295 (8.4%) |
| $100,000 to $149,999 | 2,719 (28.1%) | 250 (7.1%) |
| $150,000 or more | 2,063 (21.3%) | 256 (7.3%) |
| Total | 9,671 (100.0%) | 3,506 (100.0%) |
Monthly Housing Cost Tiers in Morton County
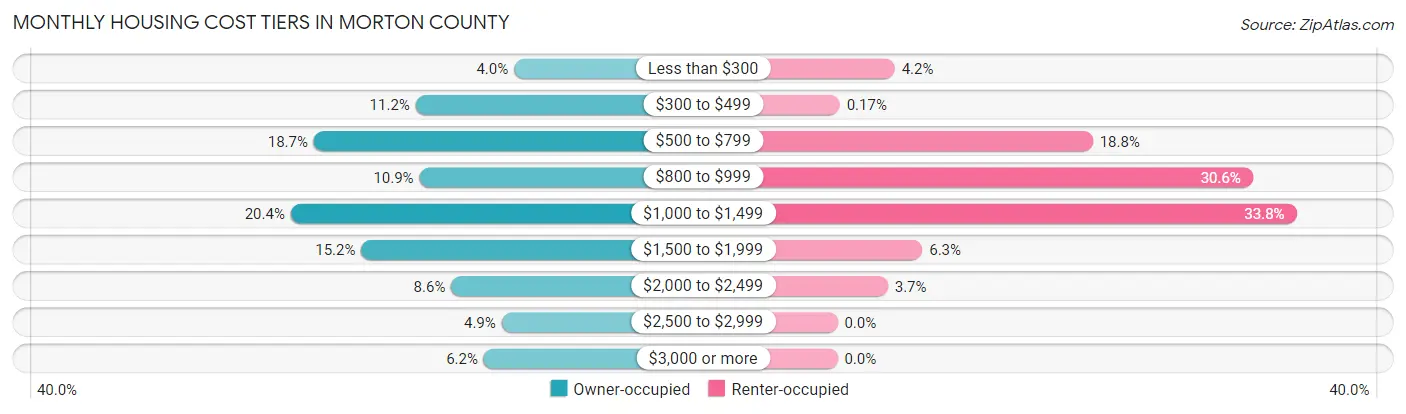
| Monthly Cost | Owner-occupied | Renter-occupied |
| Less than $300 | 382 (4.0%) | 148 (4.2%) |
| $300 to $499 | 1,083 (11.2%) | 6 (0.2%) |
| $500 to $799 | 1,808 (18.7%) | 659 (18.8%) |
| $800 to $999 | 1,056 (10.9%) | 1,072 (30.6%) |
| $1,000 to $1,499 | 1,973 (20.4%) | 1,185 (33.8%) |
| $1,500 to $1,999 | 1,470 (15.2%) | 219 (6.2%) |
| $2,000 to $2,499 | 830 (8.6%) | 130 (3.7%) |
| $2,500 to $2,999 | 471 (4.9%) | 0 (0.0%) |
| $3,000 or more | 598 (6.2%) | 0 (0.0%) |
| Total | 9,671 (100.0%) | 3,506 (100.0%) |
Physical Housing Characteristics in Morton County
Housing Structures in Morton County
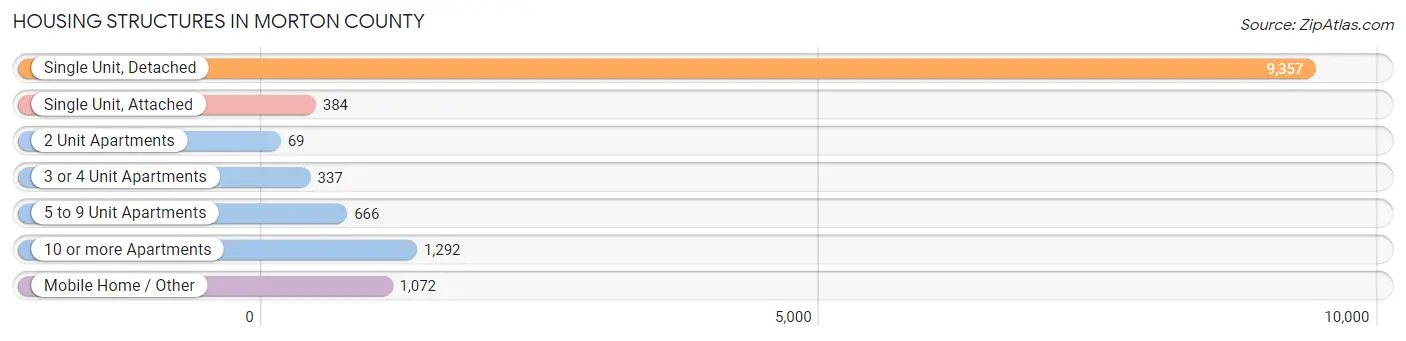
| Structure Type | # Housing Units | % Housing Units |
| Single Unit, Detached | 9,357 | 71.0% |
| Single Unit, Attached | 384 | 2.9% |
| 2 Unit Apartments | 69 | 0.5% |
| 3 or 4 Unit Apartments | 337 | 2.6% |
| 5 to 9 Unit Apartments | 666 | 5.1% |
| 10 or more Apartments | 1,292 | 9.8% |
| Mobile Home / Other | 1,072 | 8.1% |
| Total | 13,177 | 100.0% |
Housing Structures by Occupancy in Morton County
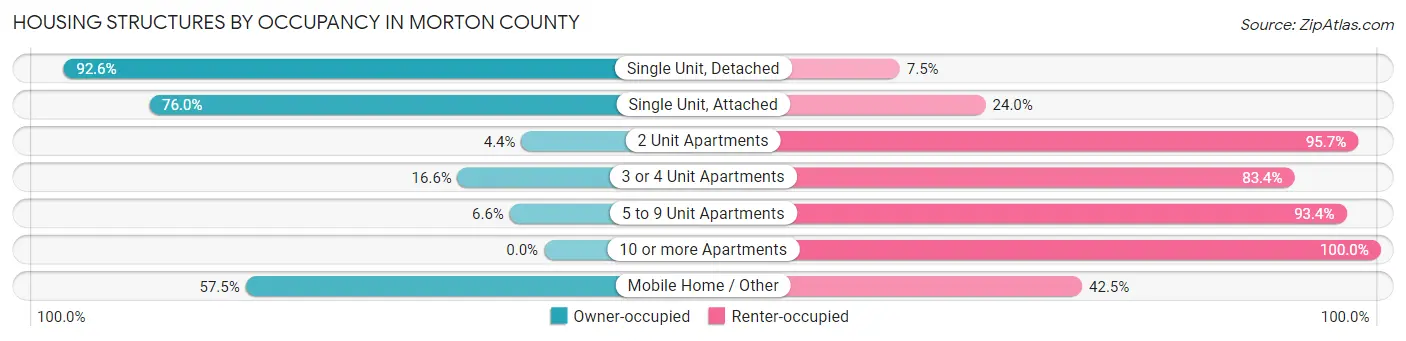
| Structure Type | Owner-occupied | Renter-occupied |
| Single Unit, Detached | 8,660 (92.5%) | 697 (7.4%) |
| Single Unit, Attached | 292 (76.0%) | 92 (24.0%) |
| 2 Unit Apartments | 3 (4.3%) | 66 (95.7%) |
| 3 or 4 Unit Apartments | 56 (16.6%) | 281 (83.4%) |
| 5 to 9 Unit Apartments | 44 (6.6%) | 622 (93.4%) |
| 10 or more Apartments | 0 (0.0%) | 1,292 (100.0%) |
| Mobile Home / Other | 616 (57.5%) | 456 (42.5%) |
| Total | 9,671 (73.4%) | 3,506 (26.6%) |
Housing Structures by Number of Rooms in Morton County
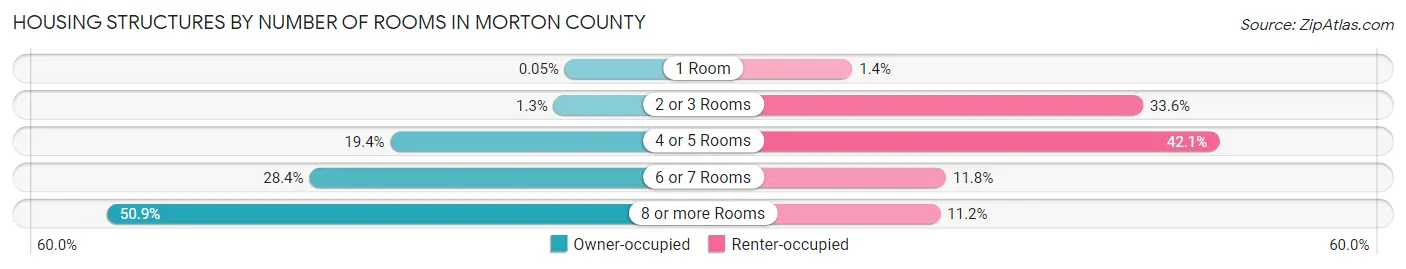
| Number of Rooms | Owner-occupied | Renter-occupied |
| 1 Room | 5 (0.1%) | 48 (1.4%) |
| 2 or 3 Rooms | 124 (1.3%) | 1,179 (33.6%) |
| 4 or 5 Rooms | 1,876 (19.4%) | 1,475 (42.1%) |
| 6 or 7 Rooms | 2,747 (28.4%) | 413 (11.8%) |
| 8 or more Rooms | 4,919 (50.9%) | 391 (11.2%) |
| Total | 9,671 (100.0%) | 3,506 (100.0%) |
Housing Structure by Heating Type in Morton County
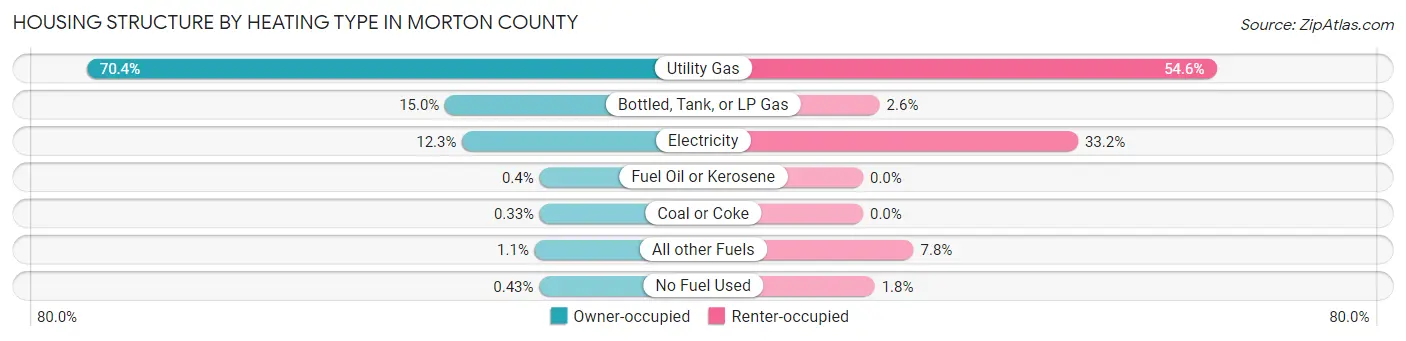
| Heating Type | Owner-occupied | Renter-occupied |
| Utility Gas | 6,806 (70.4%) | 1,914 (54.6%) |
| Bottled, Tank, or LP Gas | 1,449 (15.0%) | 90 (2.6%) |
| Electricity | 1,193 (12.3%) | 1,165 (33.2%) |
| Fuel Oil or Kerosene | 39 (0.4%) | 0 (0.0%) |
| Coal or Coke | 32 (0.3%) | 0 (0.0%) |
| All other Fuels | 110 (1.1%) | 274 (7.8%) |
| No Fuel Used | 42 (0.4%) | 63 (1.8%) |
| Total | 9,671 (100.0%) | 3,506 (100.0%) |
Household Vehicle Usage in Morton County
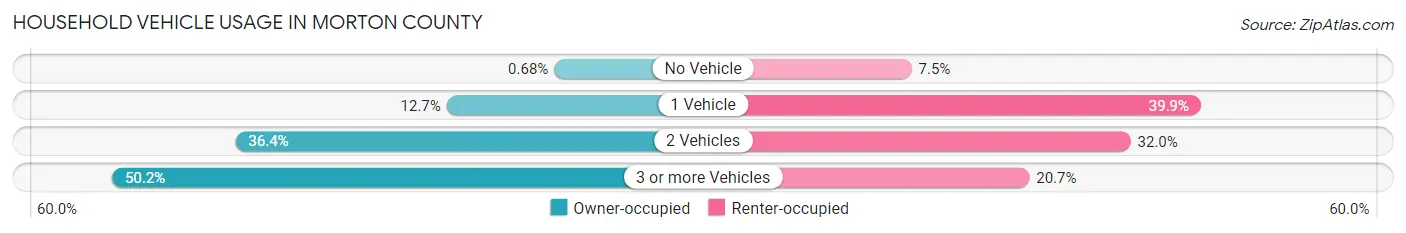
| Vehicles per Household | Owner-occupied | Renter-occupied |
| No Vehicle | 66 (0.7%) | 262 (7.5%) |
| 1 Vehicle | 1,231 (12.7%) | 1,398 (39.9%) |
| 2 Vehicles | 3,518 (36.4%) | 1,122 (32.0%) |
| 3 or more Vehicles | 4,856 (50.2%) | 724 (20.6%) |
| Total | 9,671 (100.0%) | 3,506 (100.0%) |
Real Estate & Mortgages in Morton County
Real Estate and Mortgage Overview in Morton County
| Characteristic | Without Mortgage | With Mortgage |
| Housing Units | 4,015 | 5,656 |
| Median Property Value | $214,400 | $273,200 |
| Median Household Income | $73,430 | $1,404 |
| Monthly Housing Costs | $583 | $598 |
| Real Estate Taxes | $2,241 | $78 |
Property Value by Mortgage Status in Morton County
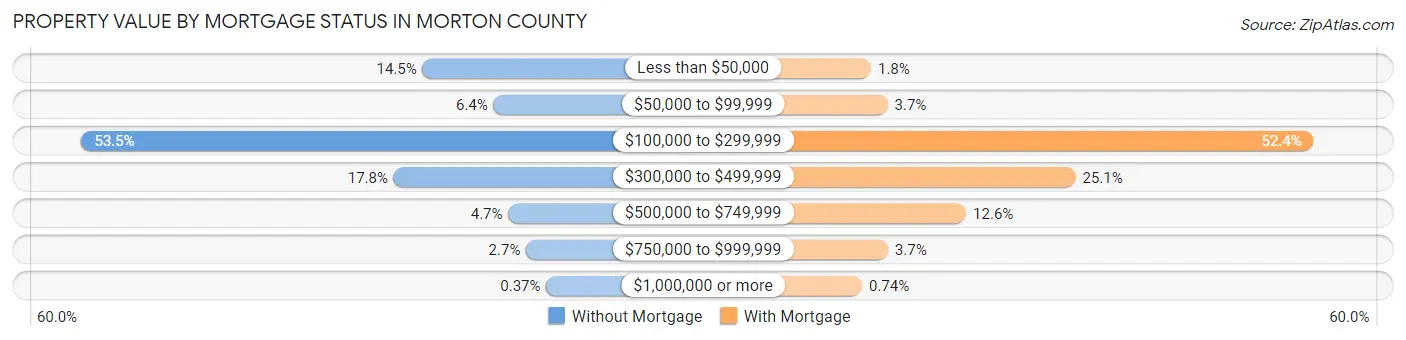
| Property Value | Without Mortgage | With Mortgage |
| Less than $50,000 | 583 (14.5%) | 100 (1.8%) |
| $50,000 to $99,999 | 257 (6.4%) | 207 (3.7%) |
| $100,000 to $299,999 | 2,149 (53.5%) | 2,961 (52.3%) |
| $300,000 to $499,999 | 715 (17.8%) | 1,422 (25.1%) |
| $500,000 to $749,999 | 189 (4.7%) | 715 (12.6%) |
| $750,000 to $999,999 | 107 (2.7%) | 209 (3.7%) |
| $1,000,000 or more | 15 (0.4%) | 42 (0.7%) |
| Total | 4,015 (100.0%) | 5,656 (100.0%) |
Household Income by Mortgage Status in Morton County
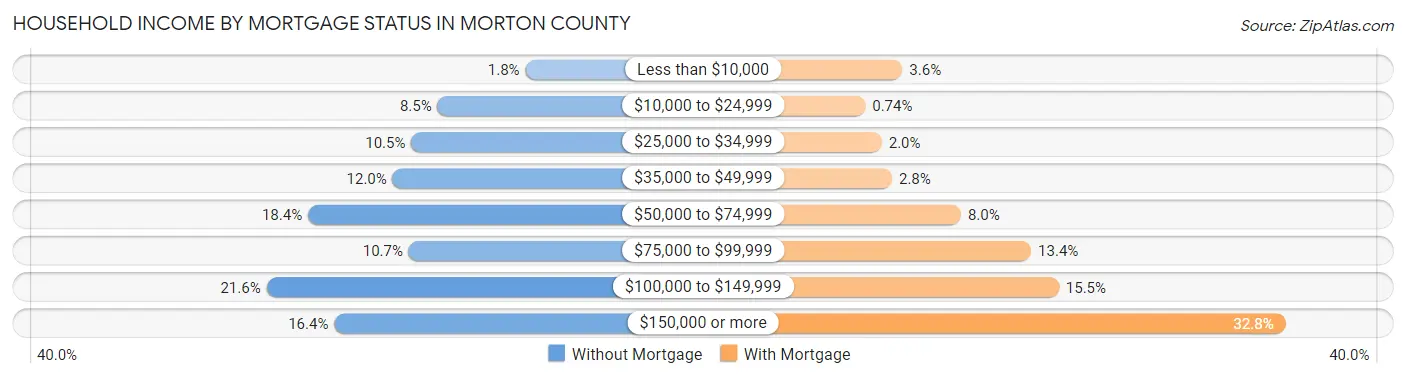
| Household Income | Without Mortgage | With Mortgage |
| Less than $10,000 | 74 (1.8%) | 202 (3.6%) |
| $10,000 to $24,999 | 343 (8.5%) | 42 (0.7%) |
| $25,000 to $34,999 | 423 (10.5%) | 113 (2.0%) |
| $35,000 to $49,999 | 480 (12.0%) | 157 (2.8%) |
| $50,000 to $74,999 | 739 (18.4%) | 454 (8.0%) |
| $75,000 to $99,999 | 431 (10.7%) | 757 (13.4%) |
| $100,000 to $149,999 | 866 (21.6%) | 876 (15.5%) |
| $150,000 or more | 659 (16.4%) | 1,853 (32.8%) |
| Total | 4,015 (100.0%) | 5,656 (100.0%) |
Property Value to Household Income Ratio in Morton County
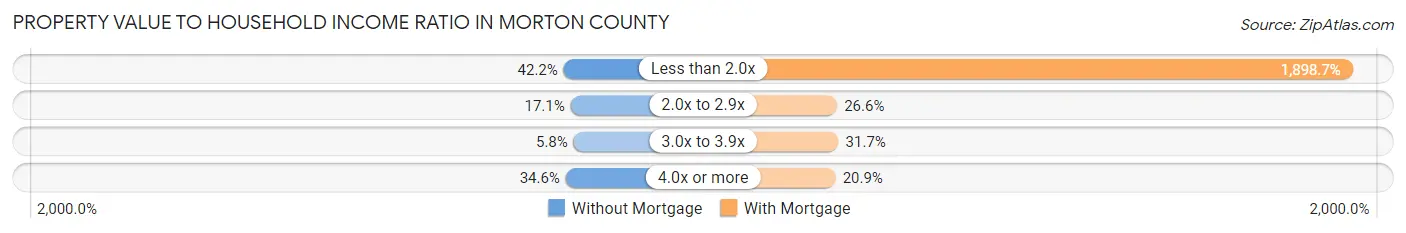
| Value-to-Income Ratio | Without Mortgage | With Mortgage |
| Less than 2.0x | 1,695 (42.2%) | 107,391 (1,898.7%) |
| 2.0x to 2.9x | 685 (17.1%) | 1,507 (26.6%) |
| 3.0x to 3.9x | 234 (5.8%) | 1,795 (31.7%) |
| 4.0x or more | 1,389 (34.6%) | 1,184 (20.9%) |
| Total | 4,015 (100.0%) | 5,656 (100.0%) |
Real Estate Taxes by Mortgage Status in Morton County
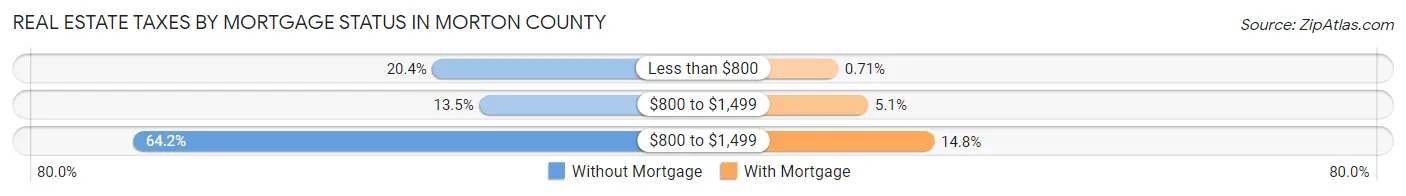
| Property Taxes | Without Mortgage | With Mortgage |
| Less than $800 | 818 (20.4%) | 40 (0.7%) |
| $800 to $1,499 | 543 (13.5%) | 290 (5.1%) |
| $800 to $1,499 | 2,577 (64.2%) | 835 (14.8%) |
| Total | 4,015 (100.0%) | 5,656 (100.0%) |
Health & Disability in Morton County
Health Insurance Coverage by Age in Morton County
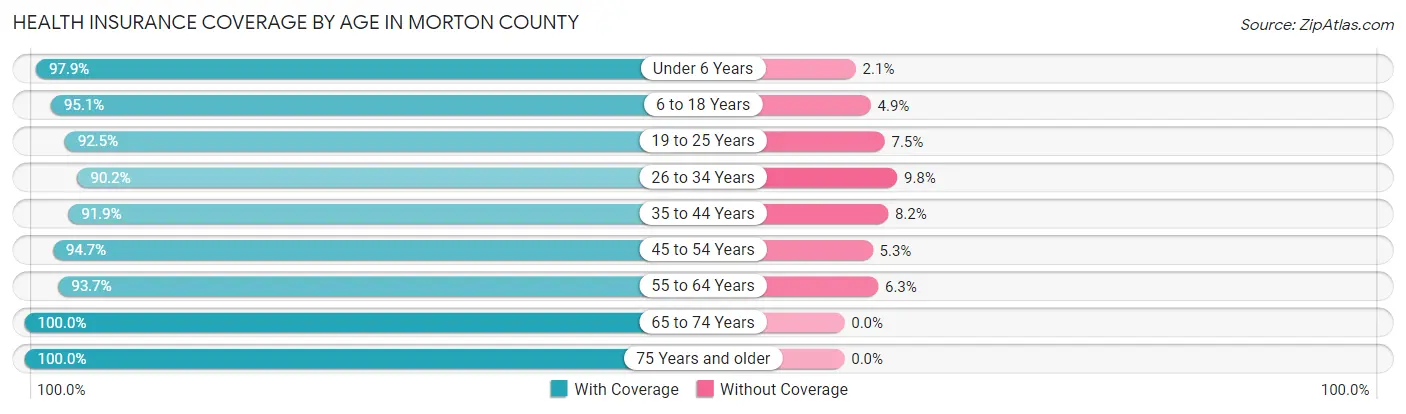
| Age Bracket | With Coverage | Without Coverage |
| Under 6 Years | 2,400 (97.9%) | 52 (2.1%) |
| 6 to 18 Years | 5,292 (95.1%) | 273 (4.9%) |
| 19 to 25 Years | 2,751 (92.5%) | 223 (7.5%) |
| 26 to 34 Years | 3,801 (90.2%) | 415 (9.8%) |
| 35 to 44 Years | 4,090 (91.8%) | 363 (8.2%) |
| 45 to 54 Years | 3,392 (94.7%) | 189 (5.3%) |
| 55 to 64 Years | 3,946 (93.7%) | 265 (6.3%) |
| 65 to 74 Years | 3,132 (100.0%) | 0 (0.0%) |
| 75 Years and older | 1,940 (100.0%) | 0 (0.0%) |
| Total | 30,744 (94.5%) | 1,780 (5.5%) |
Health Insurance Coverage by Citizenship Status in Morton County
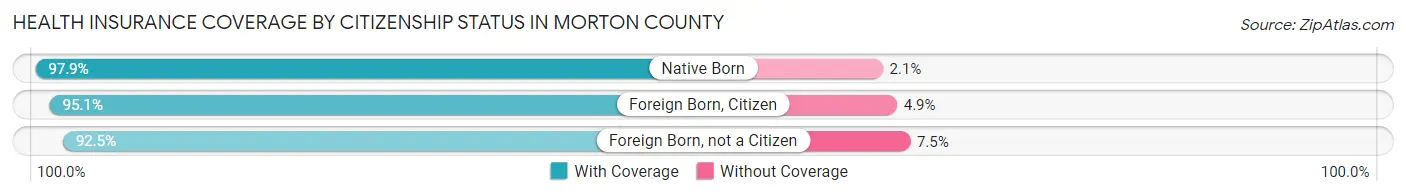
| Citizenship Status | With Coverage | Without Coverage |
| Native Born | 2,400 (97.9%) | 52 (2.1%) |
| Foreign Born, Citizen | 5,292 (95.1%) | 273 (4.9%) |
| Foreign Born, not a Citizen | 2,751 (92.5%) | 223 (7.5%) |
Health Insurance Coverage by Household Income in Morton County
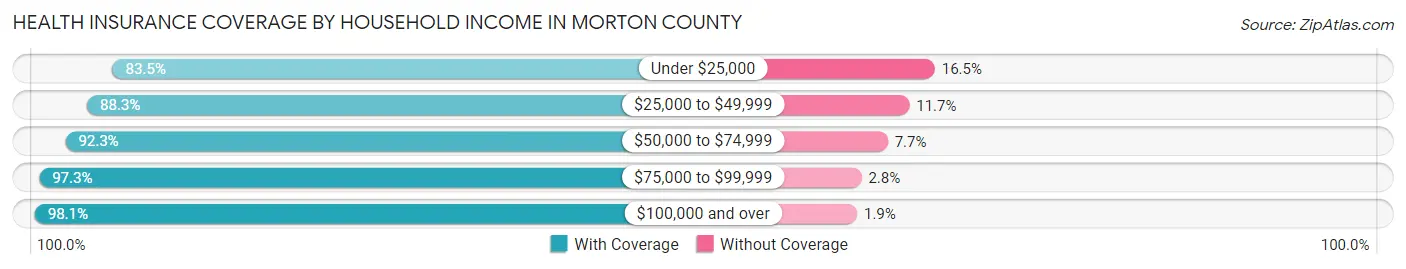
| Household Income | With Coverage | Without Coverage |
| Under $25,000 | 2,041 (83.5%) | 403 (16.5%) |
| $25,000 to $49,999 | 4,168 (88.3%) | 553 (11.7%) |
| $50,000 to $74,999 | 4,808 (92.3%) | 399 (7.7%) |
| $75,000 to $99,999 | 4,314 (97.3%) | 122 (2.8%) |
| $100,000 and over | 15,334 (98.1%) | 300 (1.9%) |
Public vs Private Health Insurance Coverage by Age in Morton County
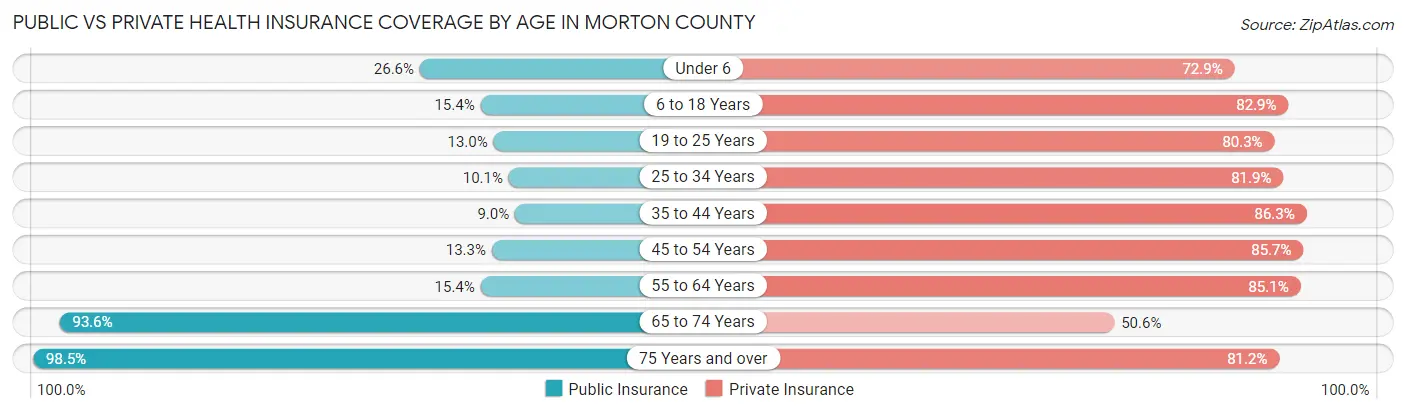
| Age Bracket | Public Insurance | Private Insurance |
| Under 6 | 653 (26.6%) | 1,787 (72.9%) |
| 6 to 18 Years | 856 (15.4%) | 4,612 (82.9%) |
| 19 to 25 Years | 385 (13.0%) | 2,388 (80.3%) |
| 25 to 34 Years | 427 (10.1%) | 3,454 (81.9%) |
| 35 to 44 Years | 399 (9.0%) | 3,841 (86.3%) |
| 45 to 54 Years | 476 (13.3%) | 3,068 (85.7%) |
| 55 to 64 Years | 647 (15.4%) | 3,585 (85.1%) |
| 65 to 74 Years | 2,930 (93.5%) | 1,584 (50.6%) |
| 75 Years and over | 1,910 (98.5%) | 1,575 (81.2%) |
| Total | 8,683 (26.7%) | 25,894 (79.6%) |
Disability Status by Sex by Age in Morton County
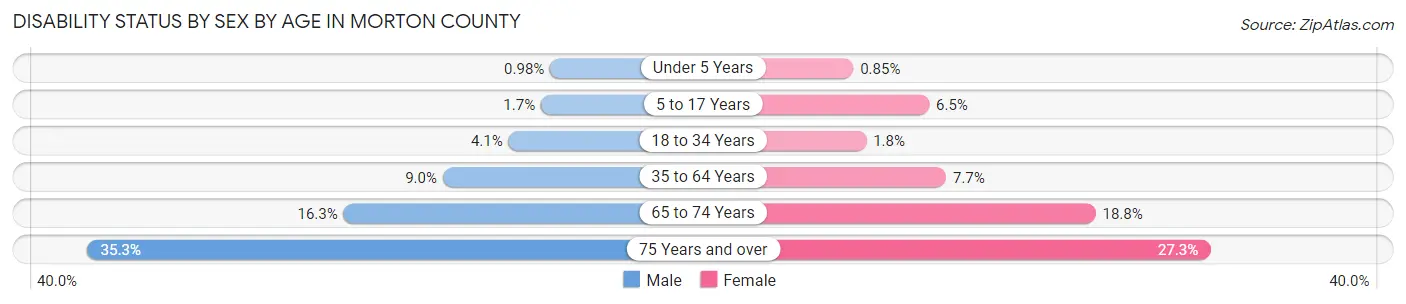
| Age Bracket | Male | Female |
| Under 5 Years | 10 (1.0%) | 8 (0.9%) |
| 5 to 17 Years | 48 (1.7%) | 188 (6.5%) |
| 18 to 34 Years | 160 (4.1%) | 64 (1.8%) |
| 35 to 64 Years | 574 (8.9%) | 451 (7.7%) |
| 65 to 74 Years | 253 (16.3%) | 298 (18.8%) |
| 75 Years and over | 273 (35.3%) | 319 (27.3%) |
Disability Class by Sex by Age in Morton County
Disability Class: Hearing Difficulty
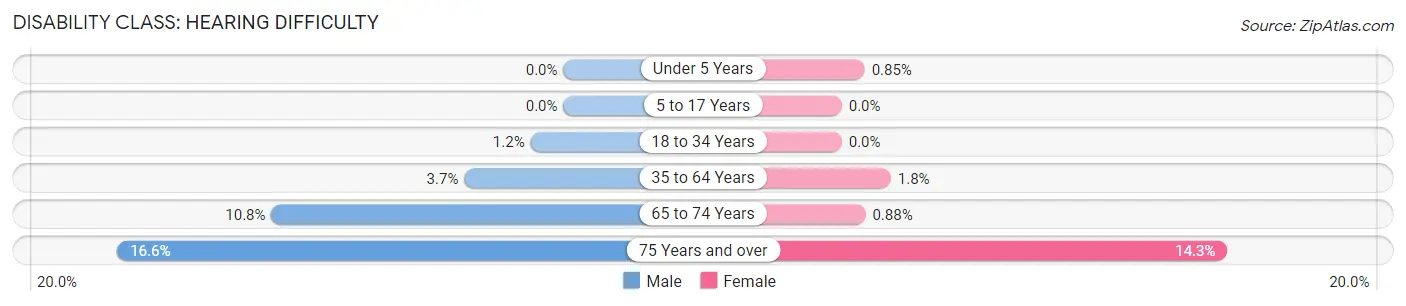
| Age Bracket | Male | Female |
| Under 5 Years | 0 (0.0%) | 8 (0.9%) |
| 5 to 17 Years | 0 (0.0%) | 0 (0.0%) |
| 18 to 34 Years | 48 (1.2%) | 0 (0.0%) |
| 35 to 64 Years | 236 (3.7%) | 106 (1.8%) |
| 65 to 74 Years | 168 (10.8%) | 14 (0.9%) |
| 75 Years and over | 128 (16.6%) | 167 (14.3%) |
Disability Class: Vision Difficulty
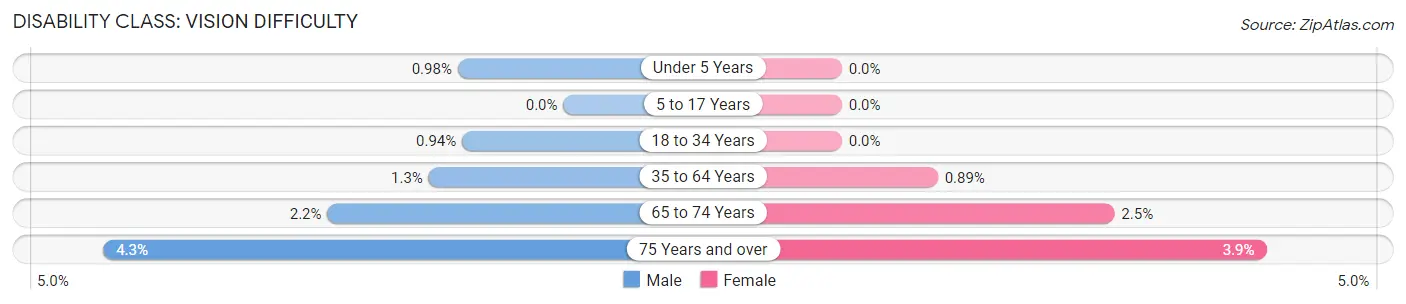
| Age Bracket | Male | Female |
| Under 5 Years | 10 (1.0%) | 0 (0.0%) |
| 5 to 17 Years | 0 (0.0%) | 0 (0.0%) |
| 18 to 34 Years | 37 (0.9%) | 0 (0.0%) |
| 35 to 64 Years | 80 (1.3%) | 52 (0.9%) |
| 65 to 74 Years | 34 (2.2%) | 40 (2.5%) |
| 75 Years and over | 33 (4.3%) | 46 (3.9%) |
Disability Class: Cognitive Difficulty
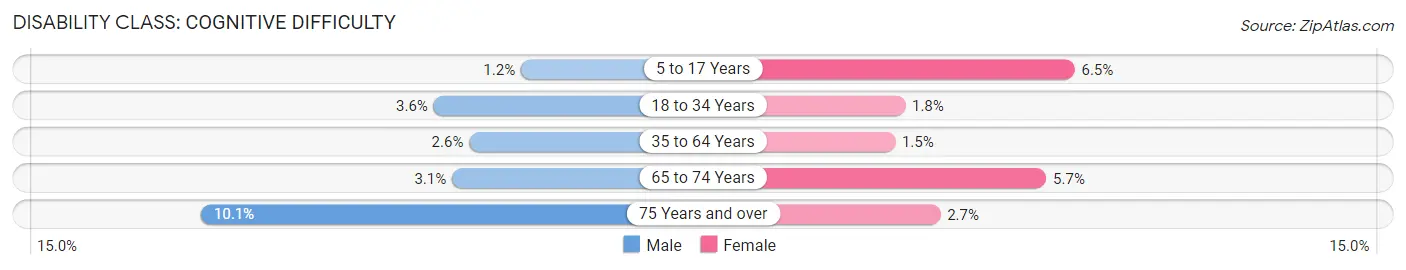
| Age Bracket | Male | Female |
| 5 to 17 Years | 34 (1.2%) | 188 (6.5%) |
| 18 to 34 Years | 142 (3.6%) | 62 (1.8%) |
| 35 to 64 Years | 168 (2.6%) | 86 (1.5%) |
| 65 to 74 Years | 48 (3.1%) | 90 (5.7%) |
| 75 Years and over | 78 (10.1%) | 32 (2.7%) |
Disability Class: Ambulatory Difficulty
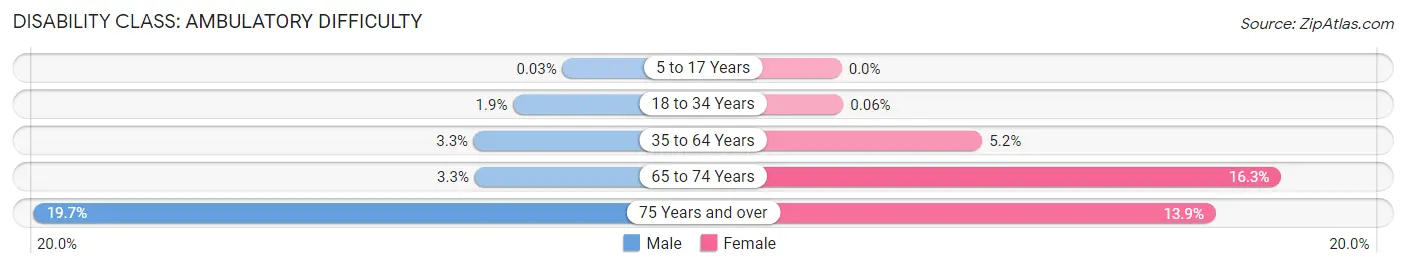
| Age Bracket | Male | Female |
| 5 to 17 Years | 1 (0.0%) | 0 (0.0%) |
| 18 to 34 Years | 73 (1.9%) | 2 (0.1%) |
| 35 to 64 Years | 213 (3.3%) | 304 (5.2%) |
| 65 to 74 Years | 51 (3.3%) | 258 (16.3%) |
| 75 Years and over | 152 (19.7%) | 162 (13.9%) |
Disability Class: Self-Care Difficulty
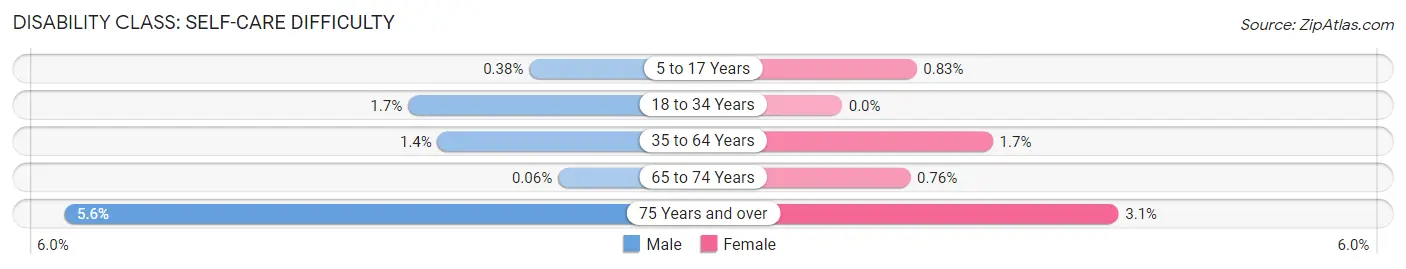
| Age Bracket | Male | Female |
| 5 to 17 Years | 11 (0.4%) | 24 (0.8%) |
| 18 to 34 Years | 68 (1.7%) | 0 (0.0%) |
| 35 to 64 Years | 90 (1.4%) | 98 (1.7%) |
| 65 to 74 Years | 1 (0.1%) | 12 (0.8%) |
| 75 Years and over | 43 (5.6%) | 36 (3.1%) |
Technology Access in Morton County
Computing Device Access in Morton County
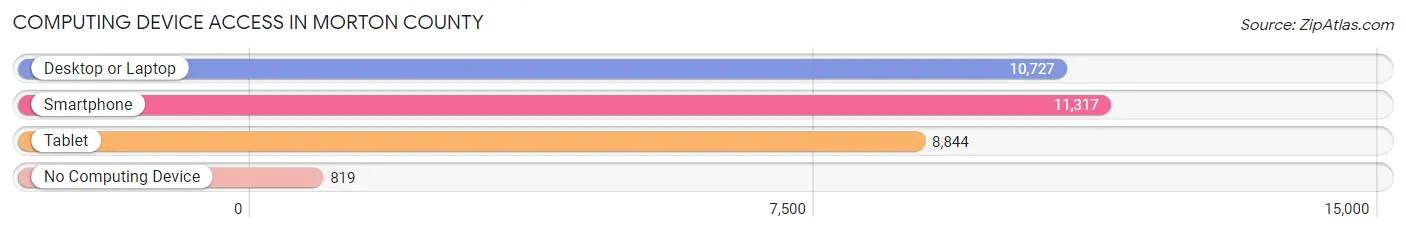
| Device Type | # Households | % Households |
| Desktop or Laptop | 10,727 | 81.4% |
| Smartphone | 11,317 | 85.9% |
| Tablet | 8,844 | 67.1% |
| No Computing Device | 819 | 6.2% |
| Total | 13,177 | 100.0% |
Internet Access in Morton County
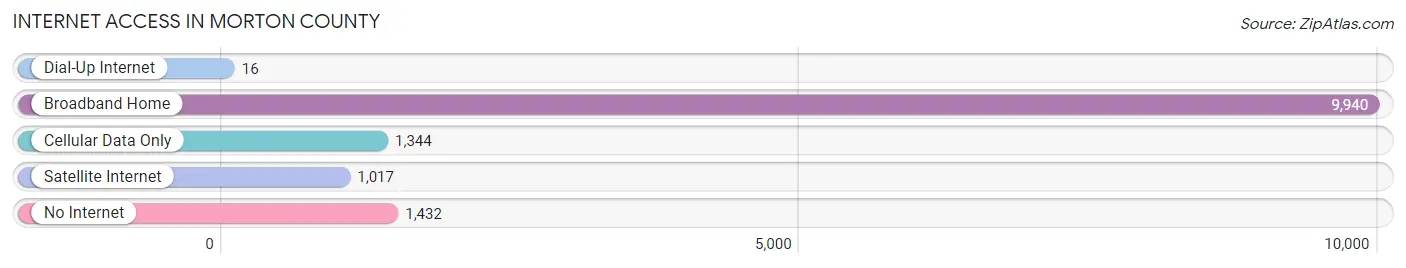
| Internet Type | # Households | % Households |
| Dial-Up Internet | 16 | 0.1% |
| Broadband Home | 9,940 | 75.4% |
| Cellular Data Only | 1,344 | 10.2% |
| Satellite Internet | 1,017 | 7.7% |
| No Internet | 1,432 | 10.9% |
| Total | 13,177 | 100.0% |
Morton County Summary
Morton County is located in the U.S. state of North Dakota. It is the sixth largest county in the state, with an area of 2,845 square miles. The county seat is Mandan, and the largest city is Bismarck. As of the 2010 census, the population was 27,471.
History
Morton County was created in 1873 from parts of Burleigh and Stark counties. It was named for Oliver Morton, the Governor of Indiana from 1861 to 1867. The county was originally populated by Native Americans, including the Mandan, Hidatsa, and Arikara tribes.
The first permanent settlement in the county was established in 1872, when the Northern Pacific Railroad arrived in the area. The railroad brought settlers from the east, and the population of the county began to grow.
In 1883, the county seat was moved from Fort Rice to Mandan. The city of Bismarck was founded in 1872, and it quickly became the largest city in the county.
Geography
Morton County is located in the north-central part of North Dakota. It is bordered by Burleigh County to the north, Stark County to the east, Grant County to the south, and Emmons County to the west.
The county is mostly flat, with rolling hills in the east and south. The Missouri River forms the northern border of the county. The Heart River flows through the county, and there are several small lakes and ponds.
The county is mostly covered in grassland, with some areas of forest. The climate is semi-arid, with cold winters and hot summers.
Economy
Morton County's economy is largely based on agriculture. The county is a major producer of wheat, corn, soybeans, and other crops. Cattle and sheep are also raised in the county.
The county is also home to several oil and gas fields, and there are several oil refineries in the area. The county is also home to several manufacturing companies, including a large paper mill in Bismarck.
Demographics
As of the 2010 census, there were 27,471 people, 10,845 households, and 7,541 families living in the county. The population density was 9.6 people per square mile. There were 11,845 housing units, with an average density of 4.1 per square mile.
The racial makeup of the county was 94.2% White, 0.7% African American, 2.2% Native American, 0.7% Asian, 0.1% Pacific Islander, 0.7% from other races, and 1.4% from two or more races. Hispanic or Latino of any race were 2.2% of the population.
The median income for a household in the county was $50,945, and the median income for a family was $60,945. The per capita income for the county was $25,945. About 6.2% of families and 8.2% of the population were below the poverty line, including 10.2% of those under age 18 and 6.2% of those age 65 or over.
Common Questions
What is the Total Population of Morton County?
Total Population of Morton County is 33,192.
What is the Total Male Population of Morton County?
Total Male Population of Morton County is 16,895.
What is the Total Female Population of Morton County?
Total Female Population of Morton County is 16,297.
What is the Ratio of Males per 100 Females in Morton County?
There are 103.67 Males per 100 Females in Morton County.
What is the Ratio of Females per 100 Males in Morton County?
There are 96.46 Females per 100 Males in Morton County.
What is the Median Population Age in Morton County?
Median Population Age in Morton County is 36.7 Years.
What is the Average Family Size in Morton County
Average Family Size in Morton County is 3.0 People.
What is the Average Household Size in Morton County
Average Household Size in Morton County is 2.5 People.
What is Per Capita Income in Morton County?
Per Capita income in Morton County is $42,603.
What is the Median Family Income in Morton County?
Median Family Income in Morton County is $105,513.
What is the Median Household income in Morton County?
Median Household Income in Morton County is $79,555.
What is Income or Wage Gap in Morton County?
Income or Wage Gap in Morton County is 26.0%.
Women in Morton County earn 74.0 cents for every dollar earned by a man.
What is Inequality or Gini Index in Morton County?
Inequality or Gini Index in Morton County is 0.44.
How Large is the Labor Force in Morton County?
There are 18,663 People in the Labor Forcein in Morton County.
What is the Percentage of People in the Labor Force in Morton County?
71.3% of People are in the Labor Force in Morton County.
What is the Unemployment Rate in Morton County?
Unemployment Rate in Morton County is 2.0%.