Mercer County, ND
Mercer County Map
Mercer County Overview
8,366
TOTAL POPULATION
4,241
MALE POPULATION
4,125
FEMALE POPULATION
102.81
MALES / 100 FEMALES
97.26
FEMALES / 100 MALES
44.0
MEDIAN AGE
2.8
AVG FAMILY SIZE
2.3
AVG HOUSEHOLD SIZE
$39,783
PER CAPITA INCOME
$105,944
AVG FAMILY INCOME
$82,155
AVG HOUSEHOLD INCOME
55.4%
WAGE / INCOME GAP [ % ]
44.6¢/ $1
WAGE / INCOME GAP [ $ ]
0.38
INEQUALITY / GINI INDEX
3,865
LABOR FORCE [ PEOPLE ]
57.1%
PERCENT IN LABOR FORCE
2.7%
UNEMPLOYMENT RATE
Mercer County Area Codes
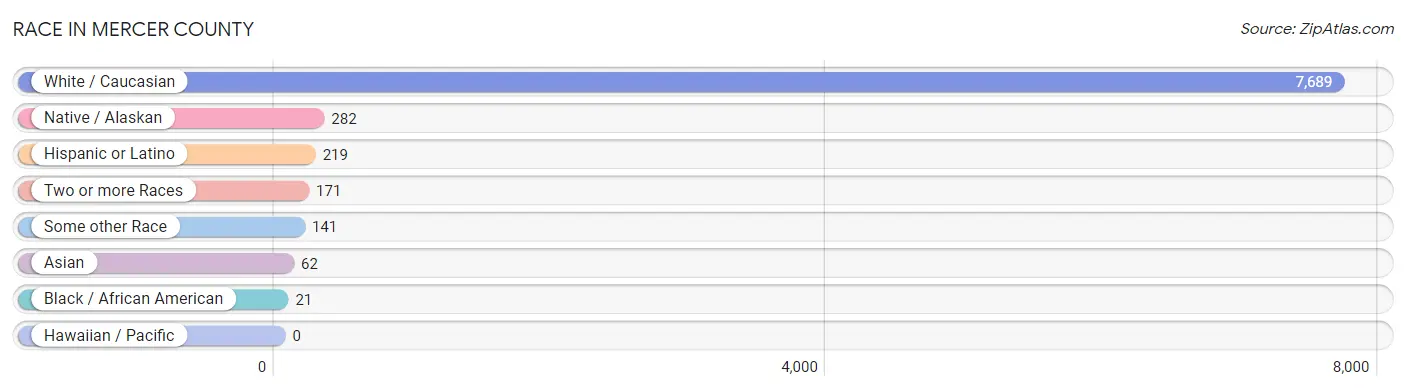
Race in Mercer County
The most populous races in Mercer County are White / Caucasian (7,689 | 91.9%), Native / Alaskan (282 | 3.4%), and Hispanic or Latino (219 | 2.6%).
| Race | # Population | % Population |
| Asian | 62 | 0.7% |
| Black / African American | 21 | 0.3% |
| Hawaiian / Pacific | 0 | 0.0% |
| Hispanic or Latino | 219 | 2.6% |
| Native / Alaskan | 282 | 3.4% |
| White / Caucasian | 7,689 | 91.9% |
| Two or more Races | 171 | 2.0% |
| Some other Race | 141 | 1.7% |
| Total | 8,366 | 100.0% |
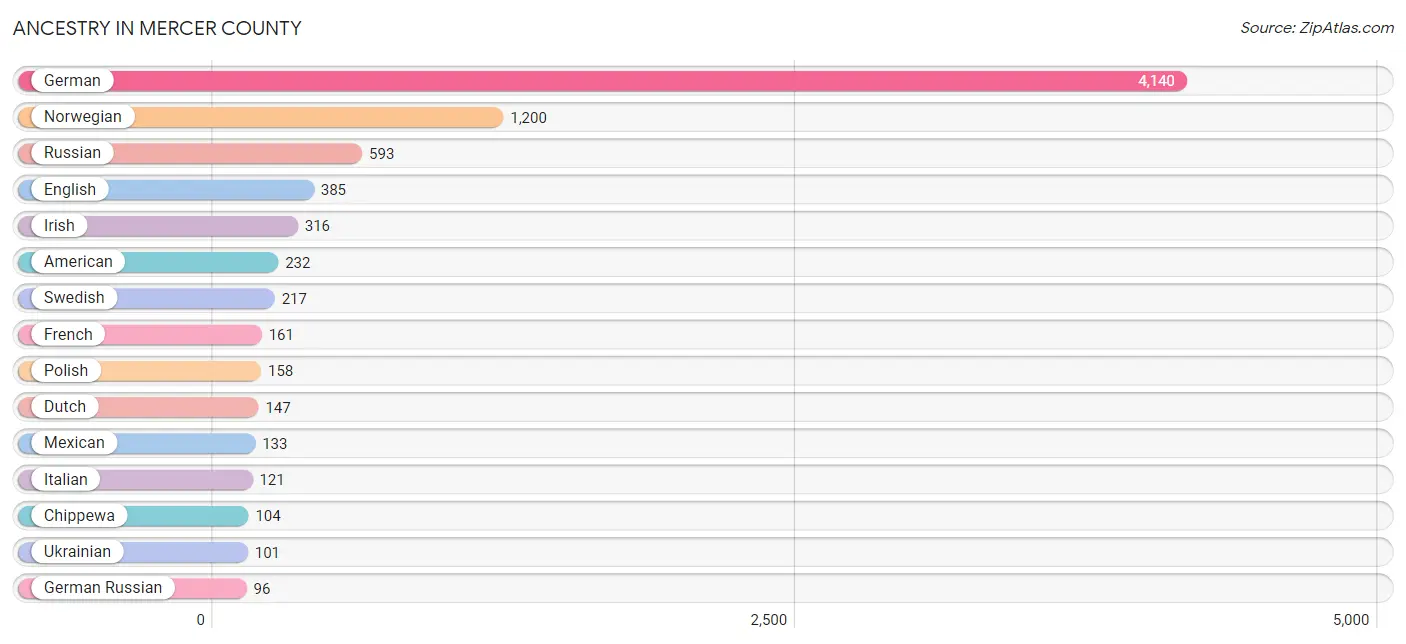
Ancestry in Mercer County
The most populous ancestries reported in Mercer County are German (4,140 | 49.5%), Norwegian (1,200 | 14.3%), Russian (593 | 7.1%), English (385 | 4.6%), and Irish (316 | 3.8%), together accounting for 79.3% of all Mercer County residents.
| Ancestry | # Population | % Population |
| American | 232 | 2.8% |
| Austrian | 1 | 0.0% |
| Brazilian | 10 | 0.1% |
| British | 24 | 0.3% |
| Central American | 53 | 0.6% |
| Cherokee | 6 | 0.1% |
| Chippewa | 104 | 1.2% |
| Creek | 33 | 0.4% |
| Croatian | 26 | 0.3% |
| Cuban | 6 | 0.1% |
| Czech | 28 | 0.3% |
| Czechoslovakian | 21 | 0.3% |
| Danish | 37 | 0.4% |
| Dutch | 147 | 1.8% |
| English | 385 | 4.6% |
| European | 11 | 0.1% |
| Finnish | 7 | 0.1% |
| French | 161 | 1.9% |
| French Canadian | 18 | 0.2% |
| German | 4,140 | 49.5% |
| German Russian | 96 | 1.1% |
| Hungarian | 44 | 0.5% |
| Icelander | 3 | 0.0% |
| Irish | 316 | 3.8% |
| Israeli | 1 | 0.0% |
| Italian | 121 | 1.5% |
| Korean | 62 | 0.7% |
| Luxembourger | 1 | 0.0% |
| Mexican | 133 | 1.6% |
| Nicaraguan | 53 | 0.6% |
| Northern European | 6 | 0.1% |
| Norwegian | 1,200 | 14.3% |
| Polish | 158 | 1.9% |
| Puerto Rican | 7 | 0.1% |
| Russian | 593 | 7.1% |
| Scandinavian | 25 | 0.3% |
| Scotch-Irish | 47 | 0.6% |
| Scottish | 64 | 0.8% |
| Sioux | 27 | 0.3% |
| Swedish | 217 | 2.6% |
| Swiss | 10 | 0.1% |
| Ukrainian | 101 | 1.2% |
| Welsh | 45 | 0.5% | View All 43 Rows |
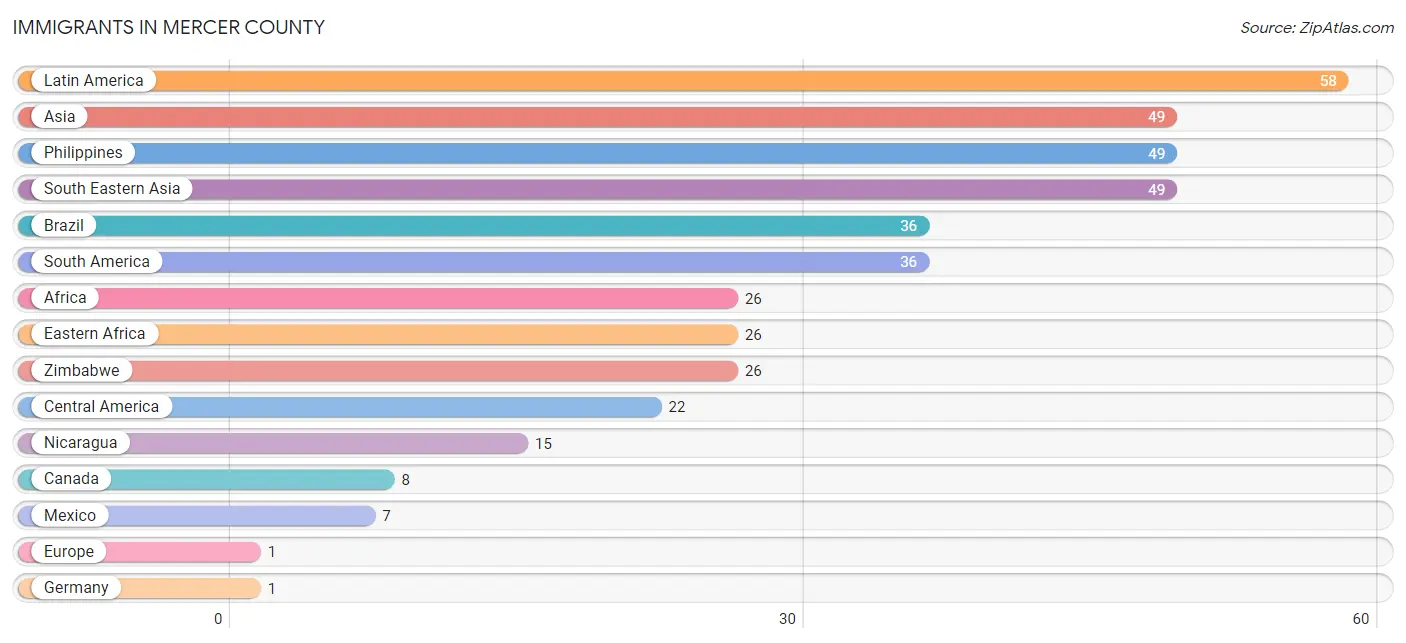
Immigrants in Mercer County
The most numerous immigrant groups reported in Mercer County came from Latin America (58 | 0.7%), Asia (49 | 0.6%), Philippines (49 | 0.6%), South Eastern Asia (49 | 0.6%), and Brazil (36 | 0.4%), together accounting for 2.9% of all Mercer County residents.
| Immigration Origin | # Population | % Population |
| Africa | 26 | 0.3% |
| Asia | 49 | 0.6% |
| Brazil | 36 | 0.4% |
| Canada | 8 | 0.1% |
| Central America | 22 | 0.3% |
| Eastern Africa | 26 | 0.3% |
| Europe | 1 | 0.0% |
| Germany | 1 | 0.0% |
| Latin America | 58 | 0.7% |
| Mexico | 7 | 0.1% |
| Nicaragua | 15 | 0.2% |
| Philippines | 49 | 0.6% |
| South America | 36 | 0.4% |
| South Eastern Asia | 49 | 0.6% |
| Western Europe | 1 | 0.0% |
| Zimbabwe | 26 | 0.3% | View All 16 Rows |
Sex and Age in Mercer County
Sex and Age in Mercer County
The most populous age groups in Mercer County are 60 to 64 Years (372 | 8.8%) for men and 60 to 64 Years (358 | 8.7%) for women.
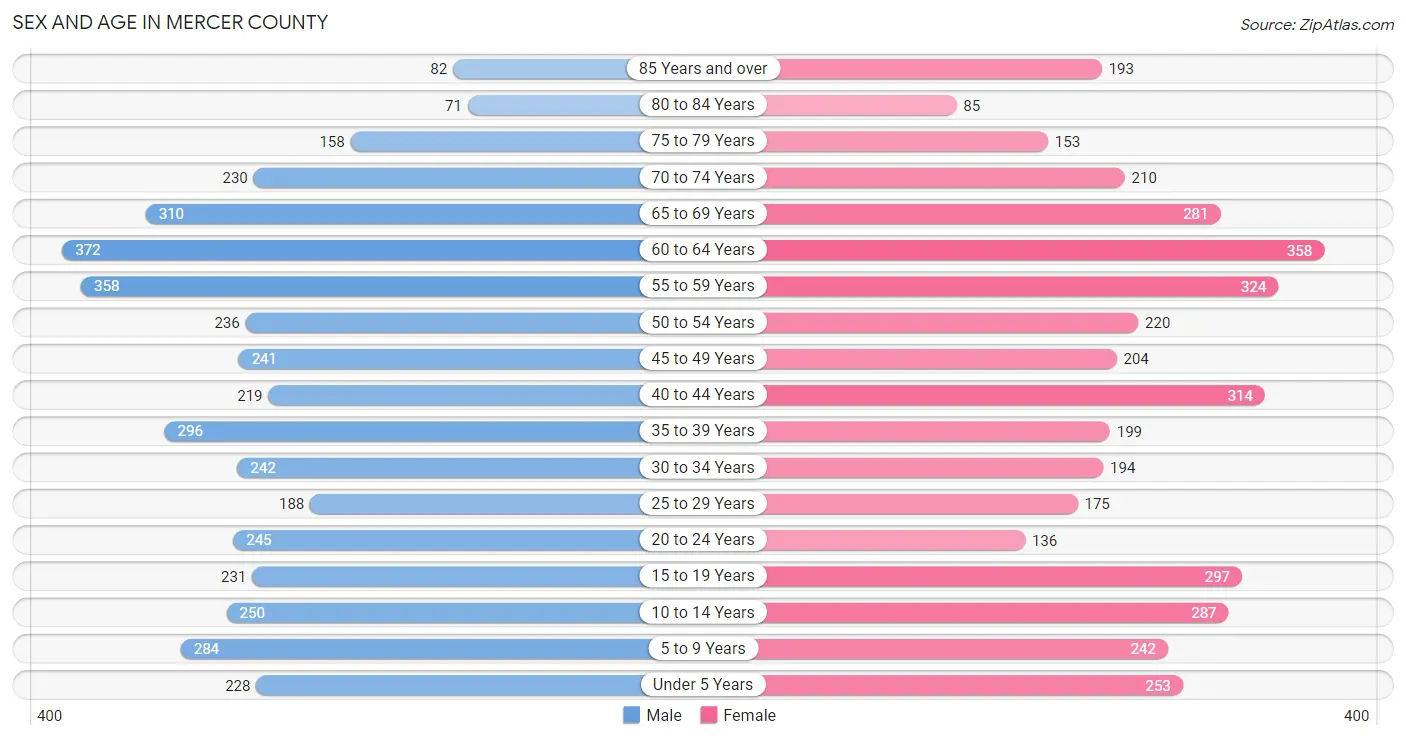
| Age Bracket | Male | Female |
| Under 5 Years | 228 (5.4%) | 253 (6.1%) |
| 5 to 9 Years | 284 (6.7%) | 242 (5.9%) |
| 10 to 14 Years | 250 (5.9%) | 287 (7.0%) |
| 15 to 19 Years | 231 (5.4%) | 297 (7.2%) |
| 20 to 24 Years | 245 (5.8%) | 136 (3.3%) |
| 25 to 29 Years | 188 (4.4%) | 175 (4.2%) |
| 30 to 34 Years | 242 (5.7%) | 194 (4.7%) |
| 35 to 39 Years | 296 (7.0%) | 199 (4.8%) |
| 40 to 44 Years | 219 (5.2%) | 314 (7.6%) |
| 45 to 49 Years | 241 (5.7%) | 204 (5.0%) |
| 50 to 54 Years | 236 (5.6%) | 220 (5.3%) |
| 55 to 59 Years | 358 (8.4%) | 324 (7.9%) |
| 60 to 64 Years | 372 (8.8%) | 358 (8.7%) |
| 65 to 69 Years | 310 (7.3%) | 281 (6.8%) |
| 70 to 74 Years | 230 (5.4%) | 210 (5.1%) |
| 75 to 79 Years | 158 (3.7%) | 153 (3.7%) |
| 80 to 84 Years | 71 (1.7%) | 85 (2.1%) |
| 85 Years and over | 82 (1.9%) | 193 (4.7%) |
| Total | 4,241 (100.0%) | 4,125 (100.0%) |
Families and Households in Mercer County
Median Family Size in Mercer County
The median family size in Mercer County is 2.78 persons per family, with single male/father families (149 | 6.2%) accounting for the largest median family size of 3.14 persons per family. On the other hand, single female/mother families (194 | 8.1%) represent the smallest median family size with 2.53 persons per family.
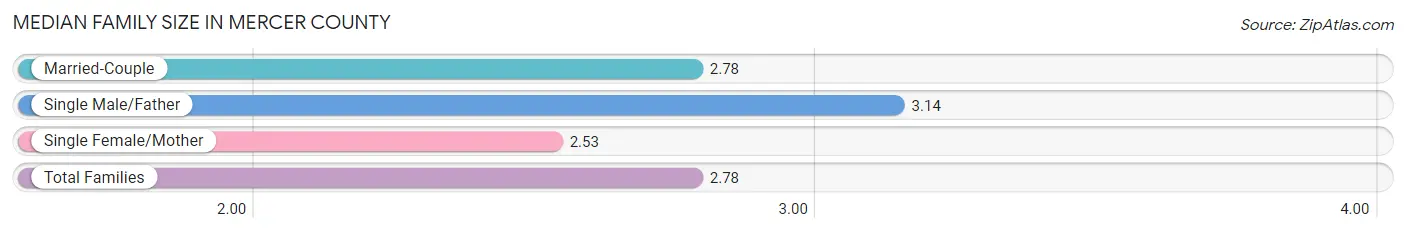
| Family Type | # Families | Family Size |
| Married-Couple | 2,051 (85.7%) | 2.78 |
| Single Male/Father | 149 (6.2%) | 3.14 |
| Single Female/Mother | 194 (8.1%) | 2.53 |
| Total Families | 2,394 (100.0%) | 2.78 |
Median Household Size in Mercer County
The median household size in Mercer County is 2.32 persons per household, with single male/father households (149 | 4.2%) accounting for the largest median household size of 3.52 persons per household. non-family households (1,142 | 32.3%) represent the smallest median household size with 1.24 persons per household.
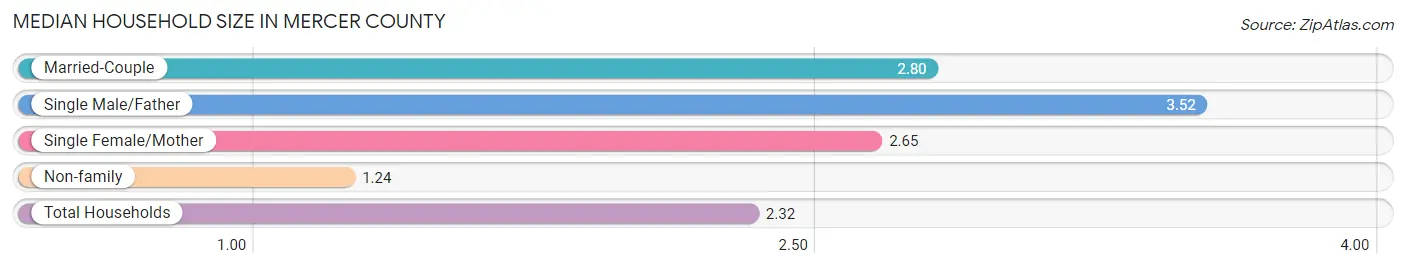
| Household Type | # Households | Household Size |
| Married-Couple | 2,051 (58.0%) | 2.80 |
| Single Male/Father | 149 (4.2%) | 3.52 |
| Single Female/Mother | 194 (5.5%) | 2.65 |
| Non-family | 1,142 (32.3%) | 1.24 |
| Total Households | 3,536 (100.0%) | 2.32 |
Household Size by Marriage Status in Mercer County
Out of a total of 3,536 households in Mercer County, 2,394 (67.7%) are family households, while 1,142 (32.3%) are nonfamily households. The most numerous type of family households are 2-person households, comprising 1,414, and the most common type of nonfamily households are 1-person households, comprising 954.
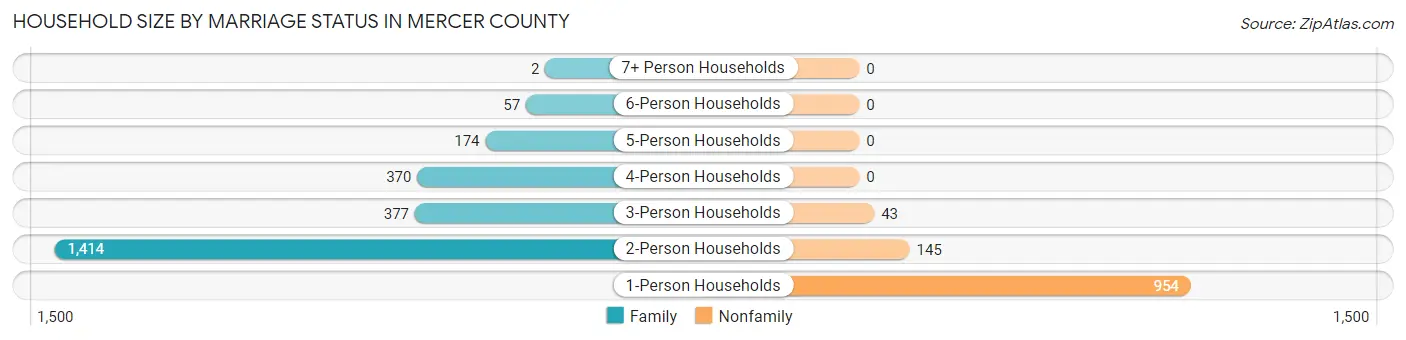
| Household Size | Family Households | Nonfamily Households |
| 1-Person Households | - | 954 (27.0%) |
| 2-Person Households | 1,414 (40.0%) | 145 (4.1%) |
| 3-Person Households | 377 (10.7%) | 43 (1.2%) |
| 4-Person Households | 370 (10.5%) | 0 (0.0%) |
| 5-Person Households | 174 (4.9%) | 0 (0.0%) |
| 6-Person Households | 57 (1.6%) | 0 (0.0%) |
| 7+ Person Households | 2 (0.1%) | 0 (0.0%) |
| Total | 2,394 (67.7%) | 1,142 (32.3%) |
Female Fertility in Mercer County
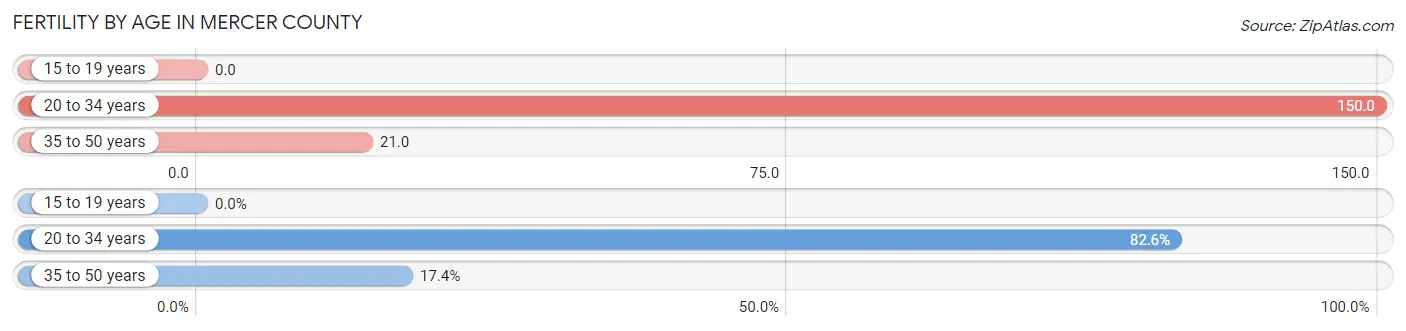
Fertility by Age in Mercer County
Average fertility rate in Mercer County is 59.0 births per 1,000 women. Women in the age bracket of 20 to 34 years have the highest fertility rate with 150.0 births per 1,000 women. Women in the age bracket of 20 to 34 years acount for 82.6% of all women with births.
| Age Bracket | Women with Births | Births / 1,000 Women |
| 15 to 19 years | 0 (0.0%) | 0.0 |
| 20 to 34 years | 76 (82.6%) | 150.0 |
| 35 to 50 years | 16 (17.4%) | 21.0 |
| Total | 92 (100.0%) | 59.0 |
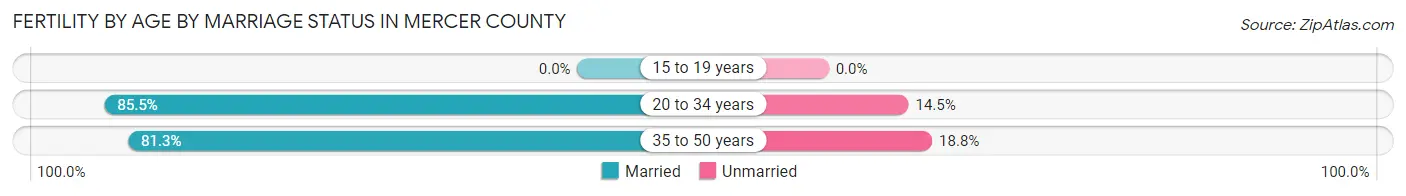
Fertility by Age by Marriage Status in Mercer County
84.8% of women with births (92) in Mercer County are married. The highest percentage of unmarried women with births falls into 35 to 50 years age bracket with 18.8% of them unmarried at the time of birth, while the lowest percentage of unmarried women with births belong to 20 to 34 years age bracket with 14.5% of them unmarried.
| Age Bracket | Married | Unmarried |
| 15 to 19 years | 0 (0.0%) | 0 (0.0%) |
| 20 to 34 years | 65 (85.5%) | 11 (14.5%) |
| 35 to 50 years | 13 (81.2%) | 3 (18.8%) |
| Total | 78 (84.8%) | 14 (15.2%) |
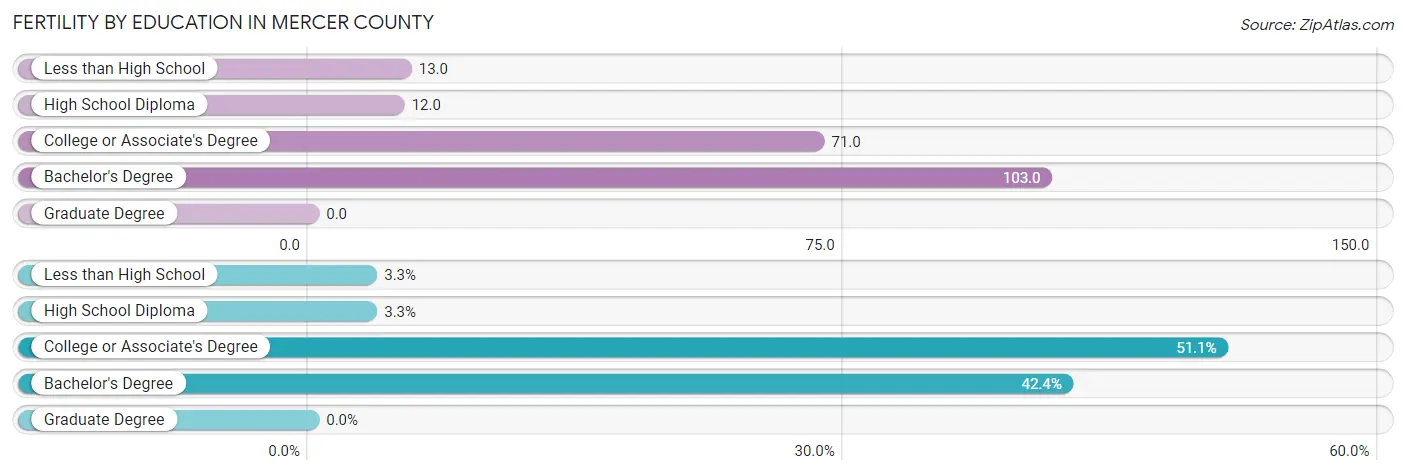
Fertility by Education in Mercer County
| Educational Attainment | Women with Births | Births / 1,000 Women |
| Less than High School | 3 (3.3%) | 13.0 |
| High School Diploma | 3 (3.3%) | 12.0 |
| College or Associate's Degree | 47 (51.1%) | 71.0 |
| Bachelor's Degree | 39 (42.4%) | 103.0 |
| Graduate Degree | 0 (0.0%) | 0.0 |
| Total | 92 (100.0%) | 59.0 |
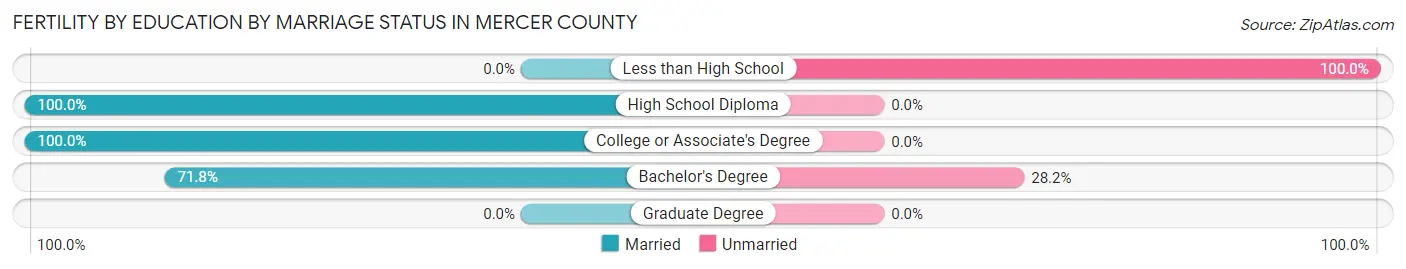
Fertility by Education by Marriage Status in Mercer County
15.2% of women with births in Mercer County are unmarried. Women with the educational attainment of high school diploma are most likely to be married with 100.0% of them married at childbirth, while women with the educational attainment of less than high school are least likely to be married with 100.0% of them unmarried at childbirth.
| Educational Attainment | Married | Unmarried |
| Less than High School | 0 (0.0%) | 3 (100.0%) |
| High School Diploma | 3 (100.0%) | 0 (0.0%) |
| College or Associate's Degree | 47 (100.0%) | 0 (0.0%) |
| Bachelor's Degree | 28 (71.8%) | 11 (28.2%) |
| Graduate Degree | 0 (0.0%) | 0 (0.0%) |
| Total | 78 (84.8%) | 14 (15.2%) |
Income in Mercer County
Income Overview in Mercer County
Per Capita Income in Mercer County is $39,783, while median incomes of families and households are $105,944 and $82,155 respectively.
| Characteristic | Number | Measure |
| Per Capita Income | 8,366 | $39,783 |
| Median Family Income | 2,394 | $105,944 |
| Mean Family Income | 2,394 | $108,124 |
| Median Household Income | 3,536 | $82,155 |
| Mean Household Income | 3,536 | $94,760 |
| Income Deficit | 2,394 | $0 |
| Wage / Income Gap (%) | 8,366 | 55.42% |
| Wage / Income Gap ($) | 8,366 | 44.58¢ per $1 |
| Gini / Inequality Index | 8,366 | 0.38 |
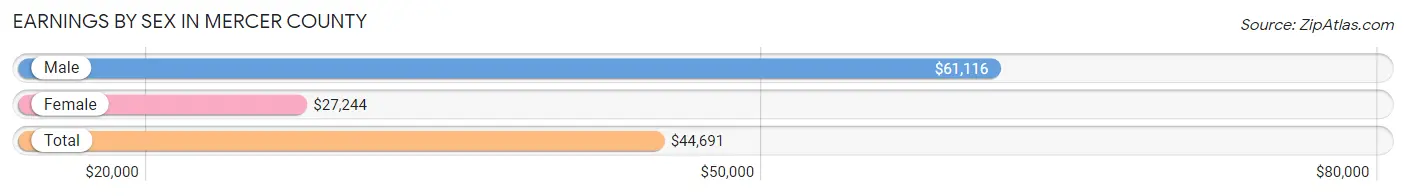
Earnings by Sex in Mercer County
Average Earnings in Mercer County are $44,691, $61,116 for men and $27,244 for women, a difference of 55.4%.
| Sex | Number | Average Earnings |
| Male | 2,413 (57.3%) | $61,116 |
| Female | 1,799 (42.7%) | $27,244 |
| Total | 4,212 (100.0%) | $44,691 |
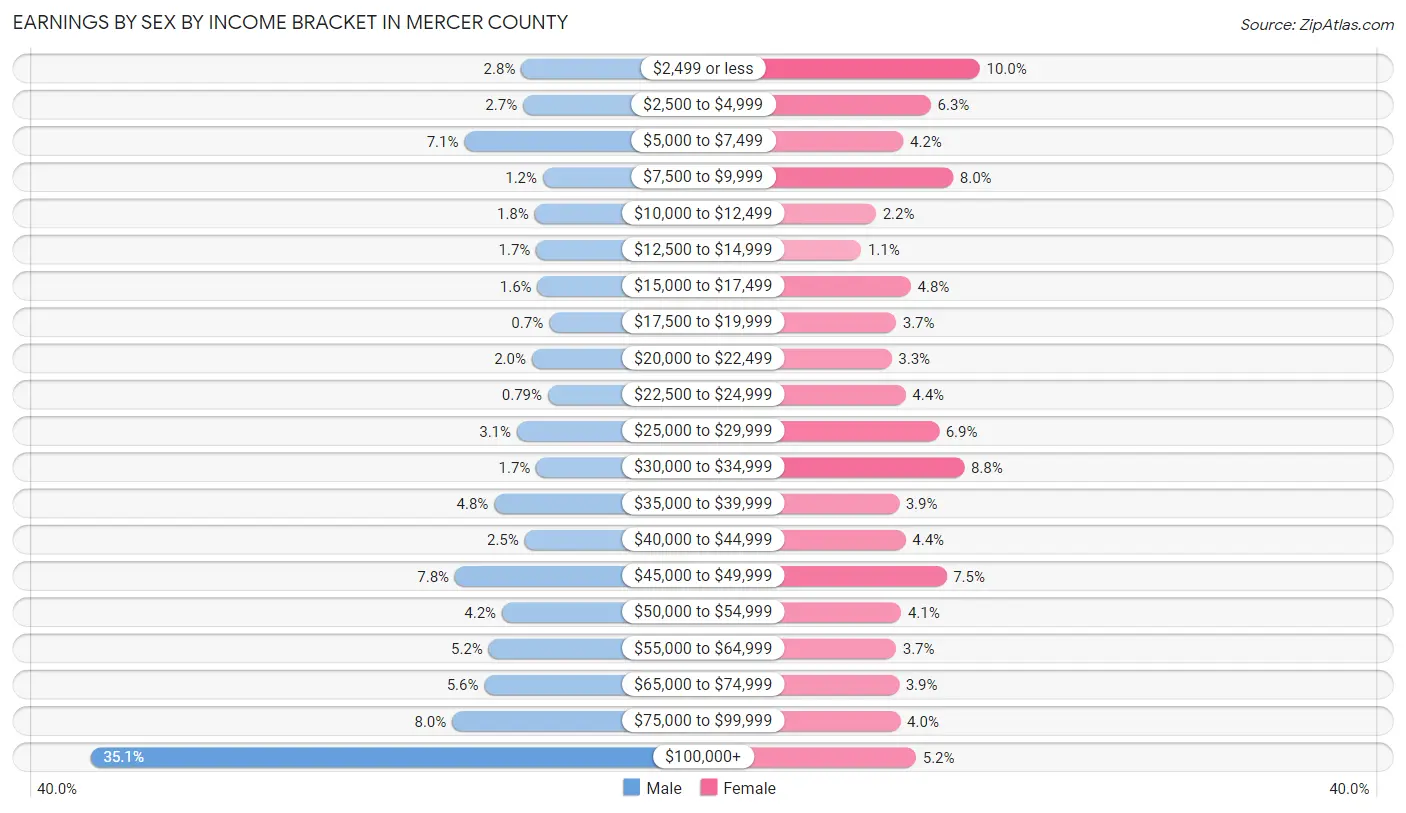
Earnings by Sex by Income Bracket in Mercer County
The most common earnings brackets in Mercer County are $100,000+ for men (846 | 35.1%) and $2,499 or less for women (179 | 10.0%).
| Income | Male | Female |
| $2,499 or less | 67 (2.8%) | 179 (10.0%) |
| $2,500 to $4,999 | 64 (2.6%) | 113 (6.3%) |
| $5,000 to $7,499 | 170 (7.0%) | 76 (4.2%) |
| $7,500 to $9,999 | 28 (1.2%) | 143 (8.0%) |
| $10,000 to $12,499 | 43 (1.8%) | 39 (2.2%) |
| $12,500 to $14,999 | 40 (1.7%) | 19 (1.1%) |
| $15,000 to $17,499 | 38 (1.6%) | 86 (4.8%) |
| $17,500 to $19,999 | 17 (0.7%) | 66 (3.7%) |
| $20,000 to $22,499 | 48 (2.0%) | 60 (3.3%) |
| $22,500 to $24,999 | 19 (0.8%) | 79 (4.4%) |
| $25,000 to $29,999 | 75 (3.1%) | 124 (6.9%) |
| $30,000 to $34,999 | 40 (1.7%) | 158 (8.8%) |
| $35,000 to $39,999 | 116 (4.8%) | 70 (3.9%) |
| $40,000 to $44,999 | 61 (2.5%) | 79 (4.4%) |
| $45,000 to $49,999 | 187 (7.7%) | 134 (7.4%) |
| $50,000 to $54,999 | 102 (4.2%) | 73 (4.1%) |
| $55,000 to $64,999 | 126 (5.2%) | 66 (3.7%) |
| $65,000 to $74,999 | 134 (5.6%) | 70 (3.9%) |
| $75,000 to $99,999 | 192 (8.0%) | 72 (4.0%) |
| $100,000+ | 846 (35.1%) | 93 (5.2%) |
| Total | 2,413 (100.0%) | 1,799 (100.0%) |
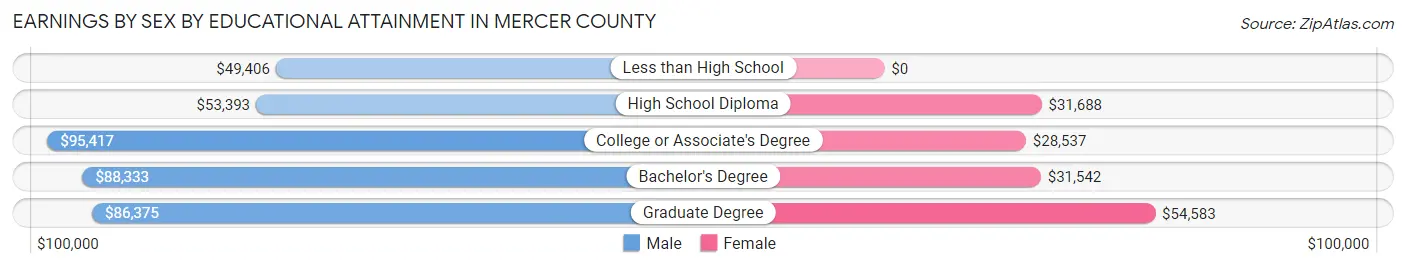
Earnings by Sex by Educational Attainment in Mercer County
Average earnings in Mercer County are $71,524 for men and $31,113 for women, a difference of 56.5%. Men with an educational attainment of college or associate's degree enjoy the highest average annual earnings of $95,417, while those with less than high school education earn the least with $49,406. Women with an educational attainment of graduate degree earn the most with the average annual earnings of $54,583, while those with college or associate's degree education have the smallest earnings of $28,537.
| Educational Attainment | Male Income | Female Income |
| Less than High School | $49,406 | $0 |
| High School Diploma | $53,393 | $31,688 |
| College or Associate's Degree | $95,417 | $28,537 |
| Bachelor's Degree | $88,333 | $31,542 |
| Graduate Degree | $86,375 | $54,583 |
| Total | $71,524 | $31,113 |
Family Income in Mercer County
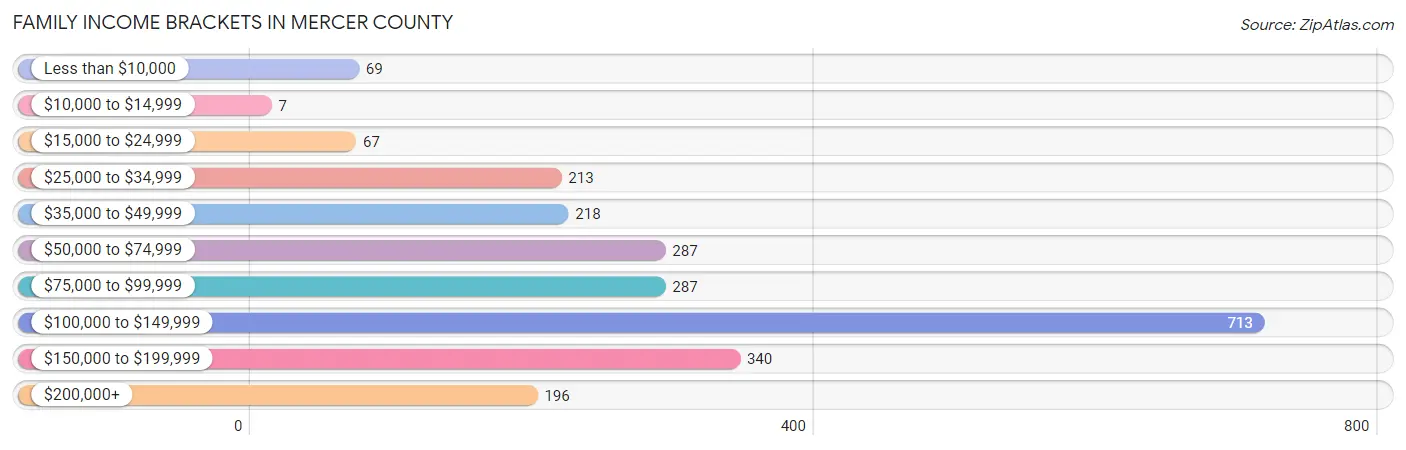
Family Income Brackets in Mercer County
According to the Mercer County family income data, there are 713 families falling into the $100,000 to $149,999 income range, which is the most common income bracket and makes up 29.8% of all families. Conversely, the $10,000 to $14,999 income bracket is the least frequent group with only 7 families (0.3%) belonging to this category.
| Income Bracket | # Families | % Families |
| Less than $10,000 | 69 | 2.9% |
| $10,000 to $14,999 | 7 | 0.3% |
| $15,000 to $24,999 | 67 | 2.8% |
| $25,000 to $34,999 | 213 | 8.9% |
| $35,000 to $49,999 | 218 | 9.1% |
| $50,000 to $74,999 | 287 | 12.0% |
| $75,000 to $99,999 | 287 | 12.0% |
| $100,000 to $149,999 | 713 | 29.8% |
| $150,000 to $199,999 | 340 | 14.2% |
| $200,000+ | 196 | 8.2% |
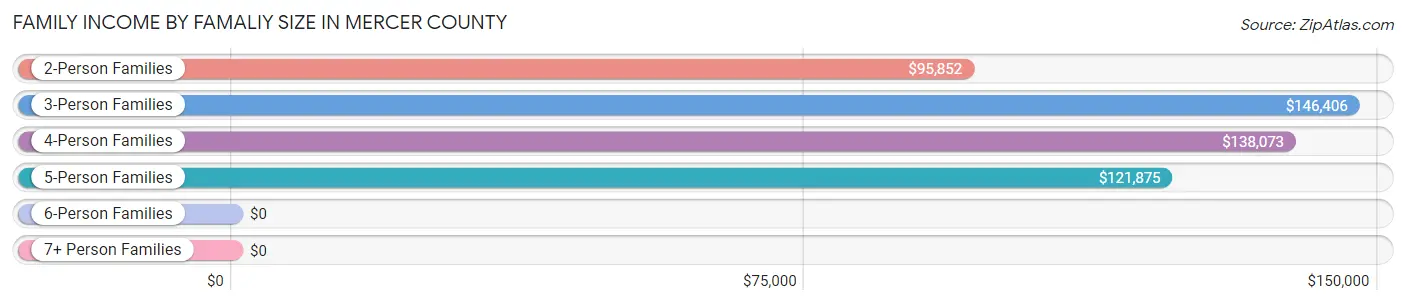
Family Income by Famaliy Size in Mercer County
3-person families (337 | 14.1%) account for the highest median family income in Mercer County with $146,406 per family, while 3-person families (337 | 14.1%) have the highest median income of $48,802 per family member.
| Income Bracket | # Families | Median Income |
| 2-Person Families | 1,481 (61.9%) | $95,852 |
| 3-Person Families | 337 (14.1%) | $146,406 |
| 4-Person Families | 359 (15.0%) | $138,073 |
| 5-Person Families | 175 (7.3%) | $121,875 |
| 6-Person Families | 40 (1.7%) | $0 |
| 7+ Person Families | 2 (0.1%) | $0 |
| Total | 2,394 (100.0%) | $105,944 |
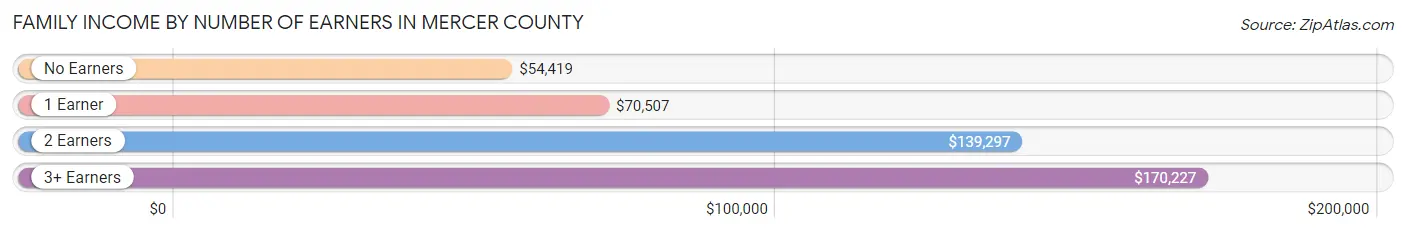
Family Income by Number of Earners in Mercer County
The median family income in Mercer County is $105,944, with families comprising 3+ earners (196) having the highest median family income of $170,227, while families with no earners (536) have the lowest median family income of $54,419, accounting for 8.2% and 22.4% of families, respectively.
| Number of Earners | # Families | Median Income |
| No Earners | 536 (22.4%) | $54,419 |
| 1 Earner | 699 (29.2%) | $70,507 |
| 2 Earners | 963 (40.2%) | $139,297 |
| 3+ Earners | 196 (8.2%) | $170,227 |
| Total | 2,394 (100.0%) | $105,944 |
Household Income in Mercer County
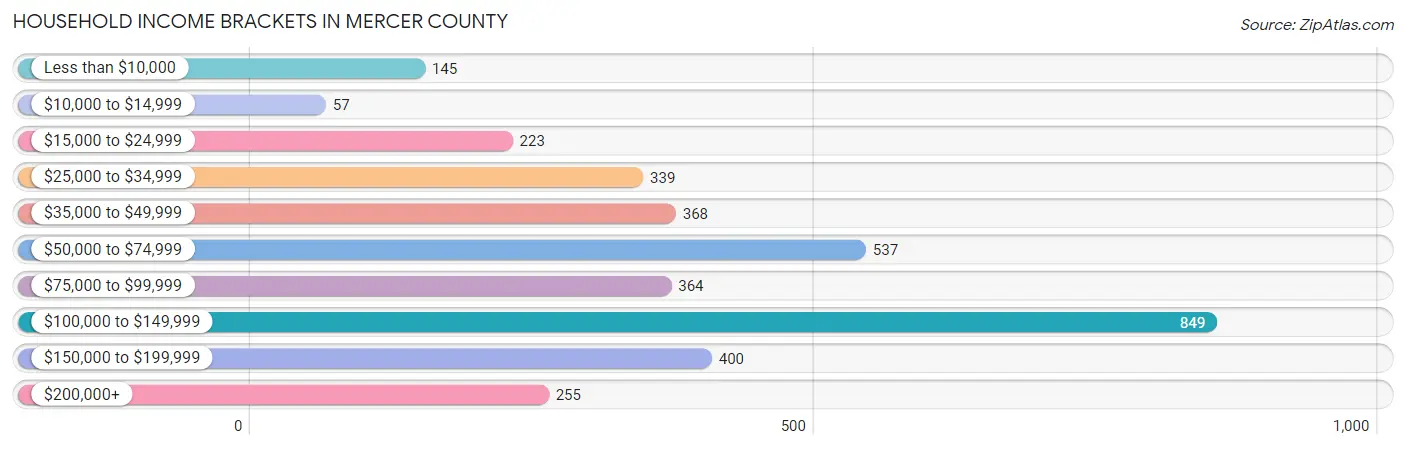
Household Income Brackets in Mercer County
With 849 households falling in the category, the $100,000 to $149,999 income range is the most frequent in Mercer County, accounting for 24.0% of all households. In contrast, only 57 households (1.6%) fall into the $10,000 to $14,999 income bracket, making it the least populous group.
| Income Bracket | # Households | % Households |
| Less than $10,000 | 145 | 4.1% |
| $10,000 to $14,999 | 57 | 1.6% |
| $15,000 to $24,999 | 223 | 6.3% |
| $25,000 to $34,999 | 339 | 9.6% |
| $35,000 to $49,999 | 368 | 10.4% |
| $50,000 to $74,999 | 537 | 15.2% |
| $75,000 to $99,999 | 364 | 10.3% |
| $100,000 to $149,999 | 849 | 24.0% |
| $150,000 to $199,999 | 400 | 11.3% |
| $200,000+ | 255 | 7.2% |
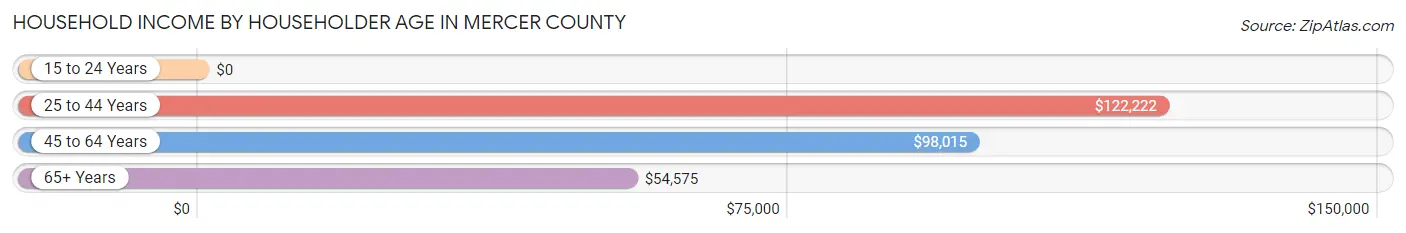
Household Income by Householder Age in Mercer County
The median household income in Mercer County is $82,155, with the highest median household income of $122,222 found in the 25 to 44 years age bracket for the primary householder. A total of 1,034 households (29.2%) fall into this category. Meanwhile, the 15 to 24 years age bracket for the primary householder has the lowest median household income of $0, with 155 households (4.4%) in this group.
| Income Bracket | # Households | Median Income |
| 15 to 24 Years | 155 (4.4%) | $0 |
| 25 to 44 Years | 1,034 (29.2%) | $122,222 |
| 45 to 64 Years | 1,229 (34.8%) | $98,015 |
| 65+ Years | 1,118 (31.6%) | $54,575 |
| Total | 3,536 (100.0%) | $82,155 |
Poverty in Mercer County
Income Below Poverty by Sex and Age in Mercer County
With 6.8% poverty level for males and 12.5% for females among the residents of Mercer County, 5 year old males and 5 year old females are the most vulnerable to poverty, with 32 males (43.2%) and 39 females (84.8%) in their respective age groups living below the poverty level.
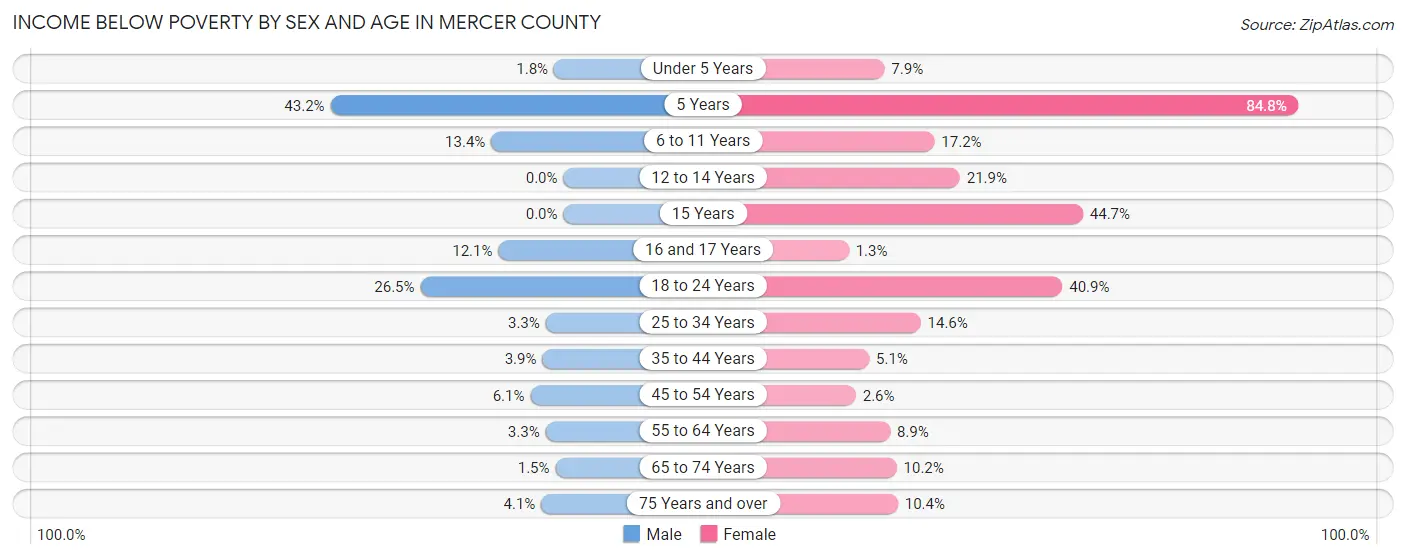
| Age Bracket | Male | Female |
| Under 5 Years | 4 (1.8%) | 20 (7.9%) |
| 5 Years | 32 (43.2%) | 39 (84.8%) |
| 6 to 11 Years | 41 (13.4%) | 44 (17.2%) |
| 12 to 14 Years | 0 (0.0%) | 46 (21.9%) |
| 15 Years | 0 (0.0%) | 17 (44.7%) |
| 16 and 17 Years | 18 (12.1%) | 2 (1.3%) |
| 18 to 24 Years | 82 (26.5%) | 97 (40.9%) |
| 25 to 34 Years | 14 (3.3%) | 54 (14.6%) |
| 35 to 44 Years | 20 (3.9%) | 26 (5.1%) |
| 45 to 54 Years | 29 (6.1%) | 11 (2.6%) |
| 55 to 64 Years | 24 (3.3%) | 61 (8.9%) |
| 65 to 74 Years | 8 (1.5%) | 48 (10.2%) |
| 75 Years and over | 11 (4.1%) | 37 (10.4%) |
| Total | 283 (6.8%) | 502 (12.5%) |
Income Above Poverty by Sex and Age in Mercer County
According to the poverty statistics in Mercer County, males aged 12 to 14 years and females aged 16 and 17 years are the age groups that are most secure financially, with 100.0% of males and 98.7% of females in these age groups living above the poverty line.
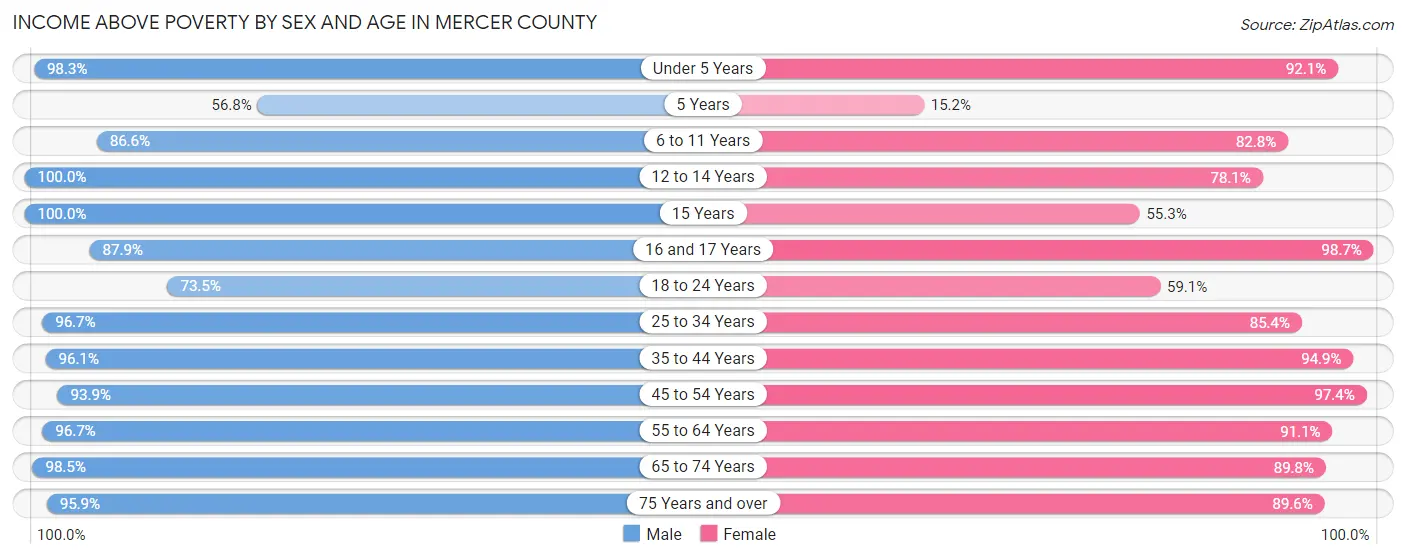
| Age Bracket | Male | Female |
| Under 5 Years | 224 (98.3%) | 233 (92.1%) |
| 5 Years | 42 (56.8%) | 7 (15.2%) |
| 6 to 11 Years | 265 (86.6%) | 212 (82.8%) |
| 12 to 14 Years | 137 (100.0%) | 164 (78.1%) |
| 15 Years | 16 (100.0%) | 21 (55.3%) |
| 16 and 17 Years | 131 (87.9%) | 154 (98.7%) |
| 18 to 24 Years | 227 (73.5%) | 140 (59.1%) |
| 25 to 34 Years | 411 (96.7%) | 315 (85.4%) |
| 35 to 44 Years | 491 (96.1%) | 487 (94.9%) |
| 45 to 54 Years | 443 (93.9%) | 412 (97.4%) |
| 55 to 64 Years | 700 (96.7%) | 621 (91.1%) |
| 65 to 74 Years | 532 (98.5%) | 424 (89.8%) |
| 75 Years and over | 256 (95.9%) | 319 (89.6%) |
| Total | 3,875 (93.2%) | 3,509 (87.5%) |
Income Below Poverty Among Married-Couple Families in Mercer County
The poverty statistics for married-couple families in Mercer County show that 1.7% or 35 of the total 2,051 families live below the poverty line. Families with no children have the highest poverty rate of 2.4%, comprising of 33 families. On the other hand, families with 5 or more children have the lowest poverty rate of 0.0%, which includes 0 families.
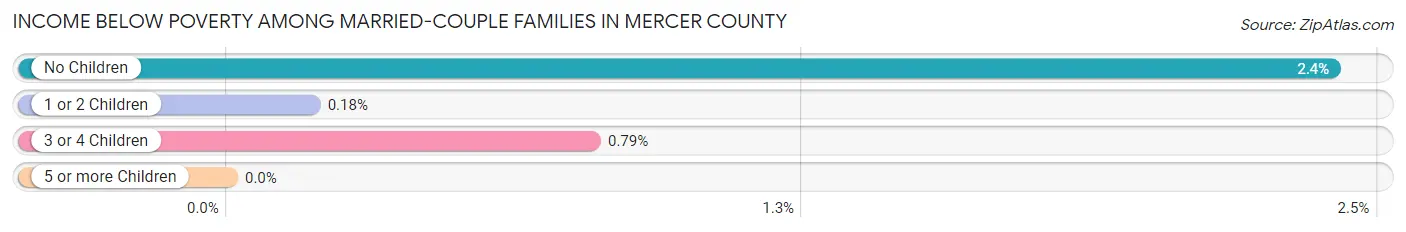
| Children | Above Poverty | Below Poverty |
| No Children | 1,341 (97.6%) | 33 (2.4%) |
| 1 or 2 Children | 547 (99.8%) | 1 (0.2%) |
| 3 or 4 Children | 126 (99.2%) | 1 (0.8%) |
| 5 or more Children | 2 (100.0%) | 0 (0.0%) |
| Total | 2,016 (98.3%) | 35 (1.7%) |
Income Below Poverty Among Single-Parent Households in Mercer County
According to the poverty data in Mercer County, 20.1% or 30 single-father households and 35.0% or 68 single-mother households are living below the poverty line. Among single-father households, those with 3 or 4 children have the highest poverty rate, with 30 households (90.9%) experiencing poverty. Likewise, among single-mother households, those with 3 or 4 children have the highest poverty rate, with 49 households (86.0%) falling below the poverty line.
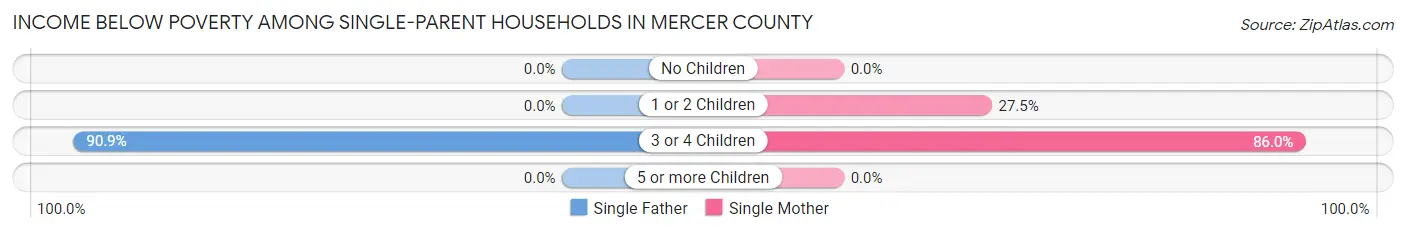
| Children | Single Father | Single Mother |
| No Children | 0 (0.0%) | 0 (0.0%) |
| 1 or 2 Children | 0 (0.0%) | 19 (27.5%) |
| 3 or 4 Children | 30 (90.9%) | 49 (86.0%) |
| 5 or more Children | 0 (0.0%) | 0 (0.0%) |
| Total | 30 (20.1%) | 68 (35.0%) |
Income Below Poverty Among Married-Couple vs Single-Parent Households in Mercer County
The poverty data for Mercer County shows that 35 of the married-couple family households (1.7%) and 98 of the single-parent households (28.6%) are living below the poverty level. Within the married-couple family households, those with no children have the highest poverty rate, with 33 households (2.4%) falling below the poverty line. Among the single-parent households, those with 3 or 4 children have the highest poverty rate, with 79 household (87.8%) living below poverty.
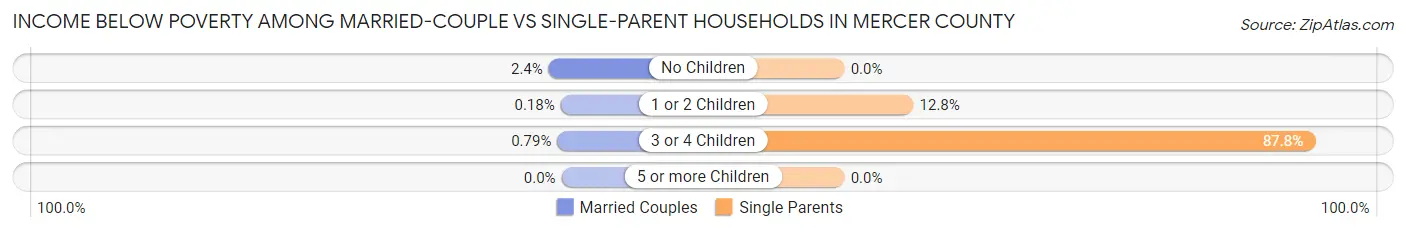
| Children | Married-Couple Families | Single-Parent Households |
| No Children | 33 (2.4%) | 0 (0.0%) |
| 1 or 2 Children | 1 (0.2%) | 19 (12.8%) |
| 3 or 4 Children | 1 (0.8%) | 79 (87.8%) |
| 5 or more Children | 0 (0.0%) | 0 (0.0%) |
| Total | 35 (1.7%) | 98 (28.6%) |
Employment Characteristics in Mercer County
Employment by Class of Employer in Mercer County
Among the 3,756 employed individuals in Mercer County, private company employees (2,970 | 79.1%), local government employees (241 | 6.4%), and not-for-profit organizations (199 | 5.3%) make up the most common classes of employment.
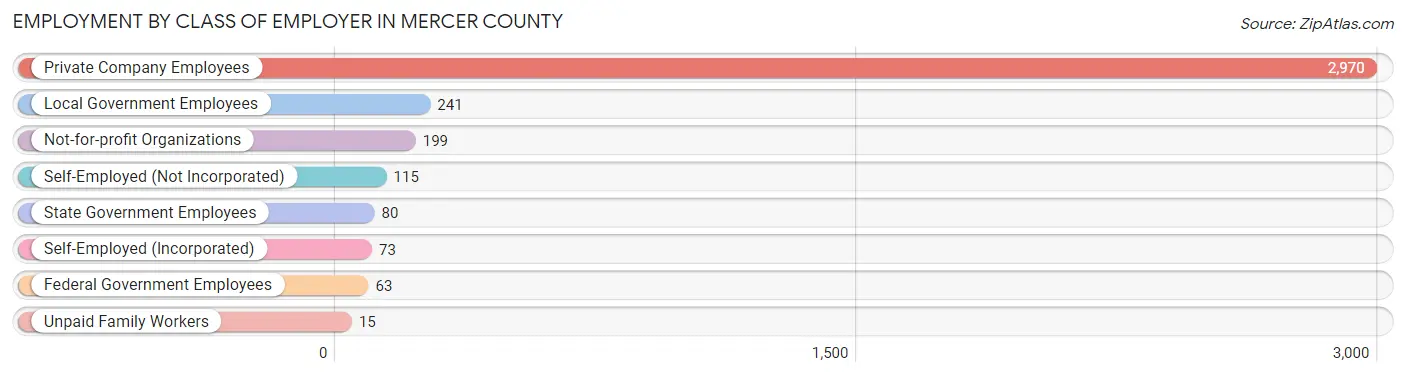
| Employer Class | # Employees | % Employees |
| Private Company Employees | 2,970 | 79.1% |
| Self-Employed (Incorporated) | 73 | 1.9% |
| Self-Employed (Not Incorporated) | 115 | 3.1% |
| Not-for-profit Organizations | 199 | 5.3% |
| Local Government Employees | 241 | 6.4% |
| State Government Employees | 80 | 2.1% |
| Federal Government Employees | 63 | 1.7% |
| Unpaid Family Workers | 15 | 0.4% |
| Total | 3,756 | 100.0% |
Employment Status by Age in Mercer County
According to the labor force statistics for Mercer County, out of the total population over 16 years of age (6,768), 57.1% or 3,865 individuals are in the labor force, with 2.7% or 104 of them unemployed. The age group with the highest labor force participation rate is 30 to 34 years, with 90.1% or 393 individuals in the labor force. Within the labor force, the 65 to 74 years age range has the highest percentage of unemployed individuals, with 8.4% or 19 of them being unemployed.
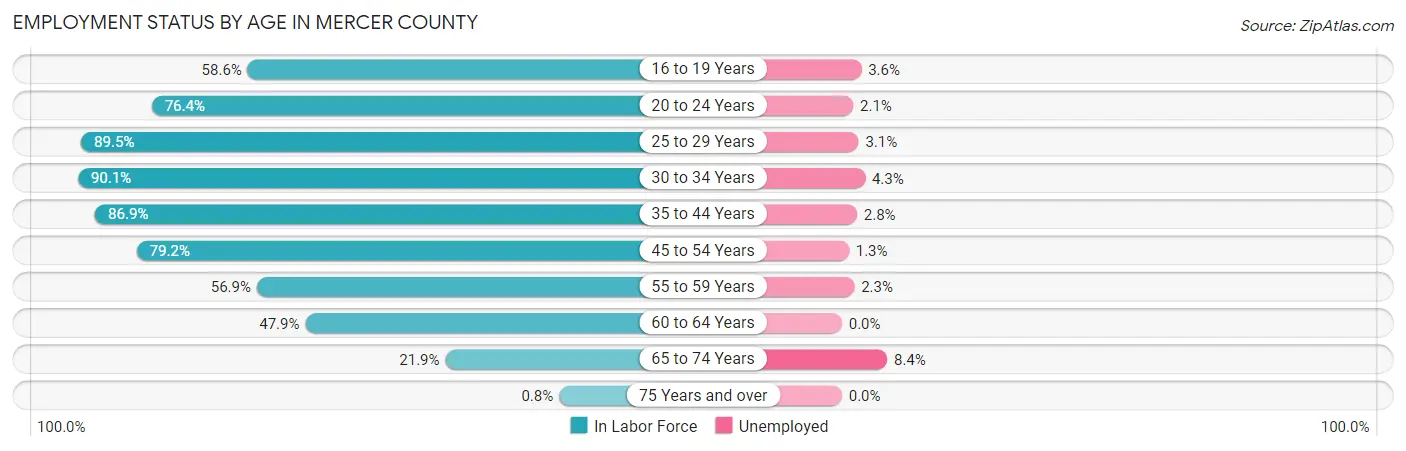
| Age Bracket | In Labor Force | Unemployed |
| 16 to 19 Years | 278 (58.6%) | 10 (3.6%) |
| 20 to 24 Years | 291 (76.4%) | 6 (2.1%) |
| 25 to 29 Years | 325 (89.5%) | 10 (3.1%) |
| 30 to 34 Years | 393 (90.1%) | 17 (4.3%) |
| 35 to 44 Years | 893 (86.9%) | 25 (2.8%) |
| 45 to 54 Years | 714 (79.2%) | 9 (1.3%) |
| 55 to 59 Years | 388 (56.9%) | 9 (2.3%) |
| 60 to 64 Years | 350 (47.9%) | 0 (0.0%) |
| 65 to 74 Years | 226 (21.9%) | 19 (8.4%) |
| 75 Years and over | 6 (0.8%) | 0 (0.0%) |
| Total | 3,865 (57.1%) | 104 (2.7%) |
Employment Status by Educational Attainment in Mercer County
According to labor force statistics for Mercer County, 74.0% of individuals (3,064) out of the total population between 25 and 64 years of age (4,140) are in the labor force, with 2.3% or 70 of them being unemployed. The group with the highest labor force participation rate are those with the educational attainment of bachelor's degree or higher, with 81.9% or 694 individuals in the labor force. Within the labor force, individuals with college / associate degree education have the highest percentage of unemployment, with 2.8% or 43 of them being unemployed.
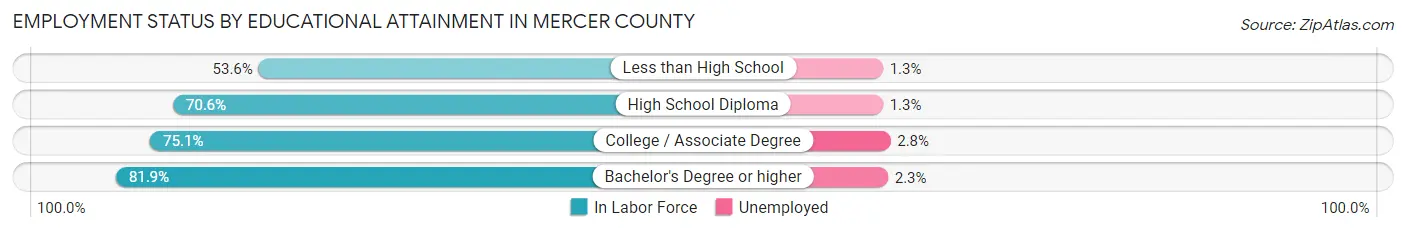
| Educational Attainment | In Labor Force | Unemployed |
| Less than High School | 149 (53.6%) | 4 (1.3%) |
| High School Diploma | 692 (70.6%) | 13 (1.3%) |
| College / Associate Degree | 1,528 (75.1%) | 57 (2.8%) |
| Bachelor's Degree or higher | 694 (81.9%) | 19 (2.3%) |
| Total | 3,064 (74.0%) | 95 (2.3%) |
Employment Occupations by Sex in Mercer County
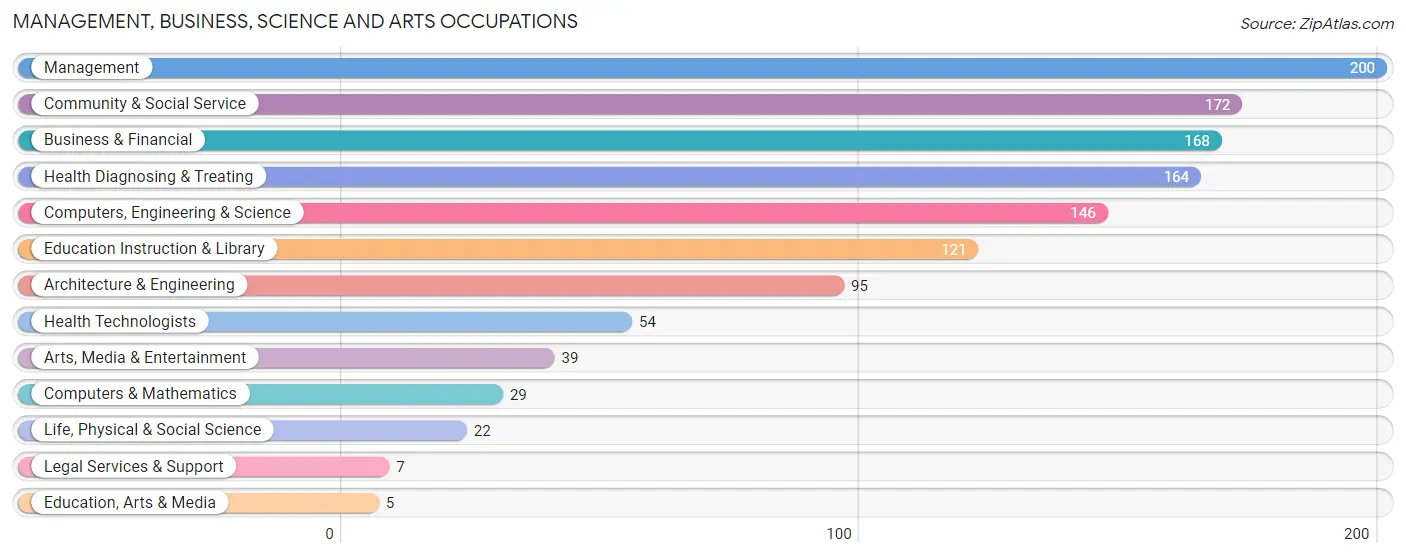
Management, Business, Science and Arts Occupations
The most common Management, Business, Science and Arts occupations in Mercer County are Management (200 | 5.3%), Community & Social Service (172 | 4.6%), Business & Financial (168 | 4.5%), Health Diagnosing & Treating (164 | 4.4%), and Computers, Engineering & Science (146 | 3.9%).
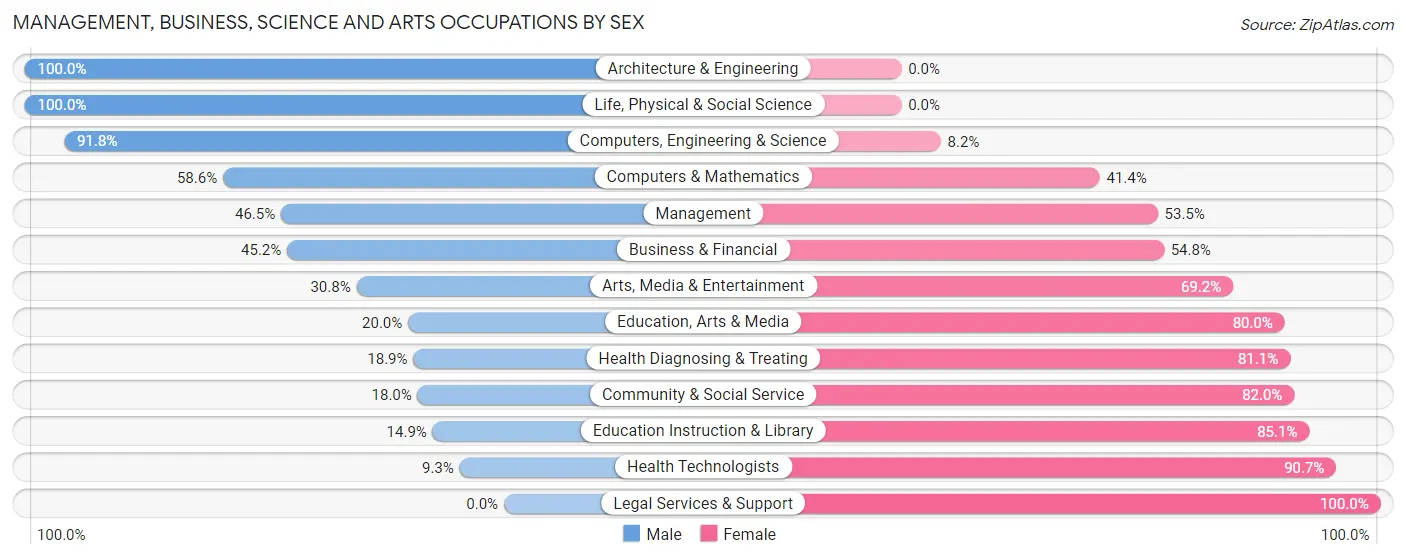
Management, Business, Science and Arts Occupations by Sex
Within the Management, Business, Science and Arts occupations in Mercer County, the most male-oriented occupations are Architecture & Engineering (100.0%), Life, Physical & Social Science (100.0%), and Computers, Engineering & Science (91.8%), while the most female-oriented occupations are Legal Services & Support (100.0%), Health Technologists (90.7%), and Education Instruction & Library (85.1%).
| Occupation | Male | Female |
| Management | 93 (46.5%) | 107 (53.5%) |
| Business & Financial | 76 (45.2%) | 92 (54.8%) |
| Computers, Engineering & Science | 134 (91.8%) | 12 (8.2%) |
| Computers & Mathematics | 17 (58.6%) | 12 (41.4%) |
| Architecture & Engineering | 95 (100.0%) | 0 (0.0%) |
| Life, Physical & Social Science | 22 (100.0%) | 0 (0.0%) |
| Community & Social Service | 31 (18.0%) | 141 (82.0%) |
| Education, Arts & Media | 1 (20.0%) | 4 (80.0%) |
| Legal Services & Support | 0 (0.0%) | 7 (100.0%) |
| Education Instruction & Library | 18 (14.9%) | 103 (85.1%) |
| Arts, Media & Entertainment | 12 (30.8%) | 27 (69.2%) |
| Health Diagnosing & Treating | 31 (18.9%) | 133 (81.1%) |
| Health Technologists | 5 (9.3%) | 49 (90.7%) |
| Total (Category) | 365 (42.9%) | 485 (57.1%) |
| Total (Overall) | 2,114 (56.2%) | 1,645 (43.8%) |
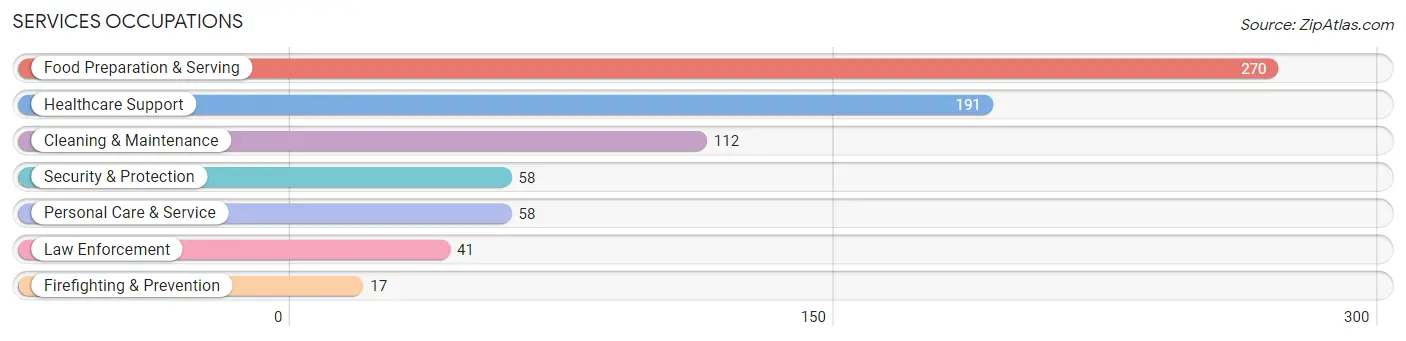
Services Occupations
The most common Services occupations in Mercer County are Food Preparation & Serving (270 | 7.2%), Healthcare Support (191 | 5.1%), Cleaning & Maintenance (112 | 3.0%), Security & Protection (58 | 1.5%), and Personal Care & Service (58 | 1.5%).
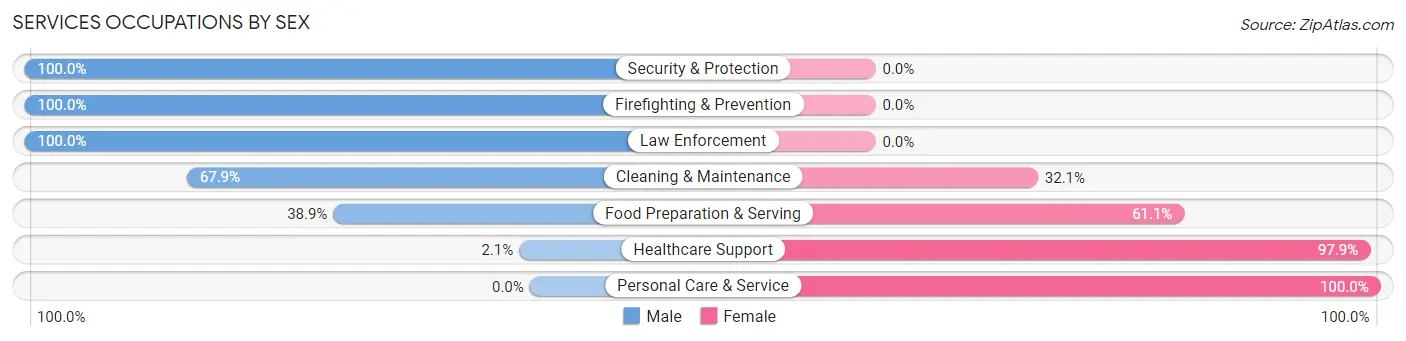
Services Occupations by Sex
Within the Services occupations in Mercer County, the most male-oriented occupations are Security & Protection (100.0%), Firefighting & Prevention (100.0%), and Law Enforcement (100.0%), while the most female-oriented occupations are Personal Care & Service (100.0%), Healthcare Support (97.9%), and Food Preparation & Serving (61.1%).
| Occupation | Male | Female |
| Healthcare Support | 4 (2.1%) | 187 (97.9%) |
| Security & Protection | 58 (100.0%) | 0 (0.0%) |
| Firefighting & Prevention | 17 (100.0%) | 0 (0.0%) |
| Law Enforcement | 41 (100.0%) | 0 (0.0%) |
| Food Preparation & Serving | 105 (38.9%) | 165 (61.1%) |
| Cleaning & Maintenance | 76 (67.9%) | 36 (32.1%) |
| Personal Care & Service | 0 (0.0%) | 58 (100.0%) |
| Total (Category) | 243 (35.3%) | 446 (64.7%) |
| Total (Overall) | 2,114 (56.2%) | 1,645 (43.8%) |
Sales and Office Occupations
The most common Sales and Office occupations in Mercer County are Office & Administration (505 | 13.4%), and Sales & Related (386 | 10.3%).
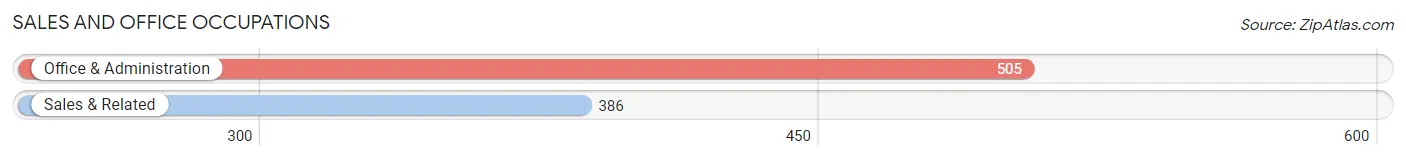
Sales and Office Occupations by Sex

| Occupation | Male | Female |
| Sales & Related | 169 (43.8%) | 217 (56.2%) |
| Office & Administration | 72 (14.3%) | 433 (85.7%) |
| Total (Category) | 241 (27.1%) | 650 (73.0%) |
| Total (Overall) | 2,114 (56.2%) | 1,645 (43.8%) |
Natural Resources, Construction and Maintenance Occupations
The most common Natural Resources, Construction and Maintenance occupations in Mercer County are Installation, Maintenance & Repair (415 | 11.0%), Construction & Extraction (412 | 11.0%), and Farming, Fishing & Forestry (26 | 0.7%).

Natural Resources, Construction and Maintenance Occupations by Sex
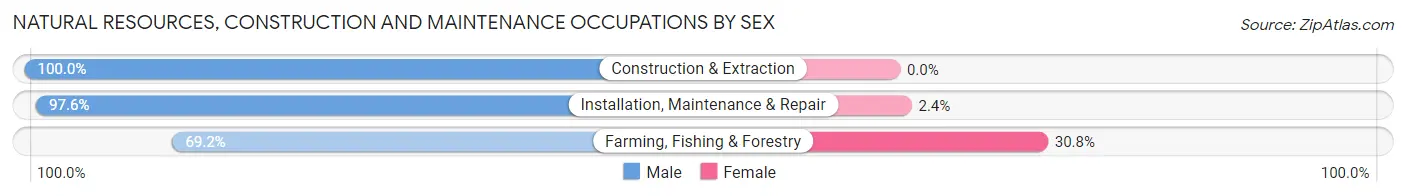
| Occupation | Male | Female |
| Farming, Fishing & Forestry | 18 (69.2%) | 8 (30.8%) |
| Construction & Extraction | 412 (100.0%) | 0 (0.0%) |
| Installation, Maintenance & Repair | 405 (97.6%) | 10 (2.4%) |
| Total (Category) | 835 (97.9%) | 18 (2.1%) |
| Total (Overall) | 2,114 (56.2%) | 1,645 (43.8%) |
Production, Transportation and Moving Occupations
The most common Production, Transportation and Moving occupations in Mercer County are Production (258 | 6.9%), Material Moving (137 | 3.6%), and Transportation (81 | 2.1%).
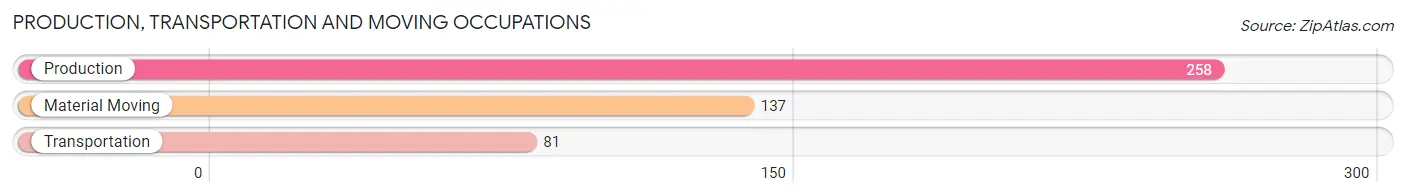
Production, Transportation and Moving Occupations by Sex
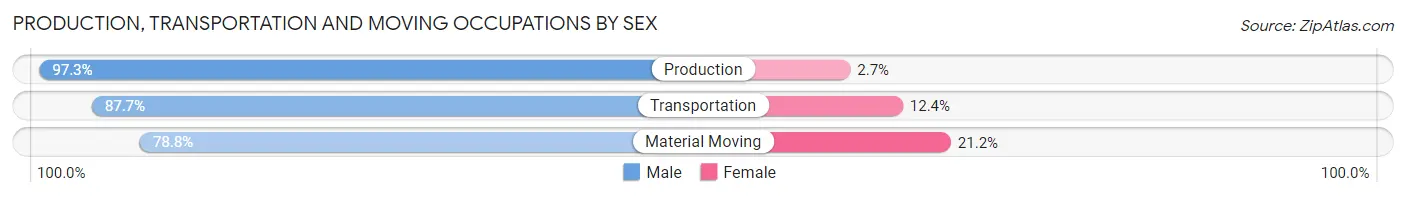
| Occupation | Male | Female |
| Production | 251 (97.3%) | 7 (2.7%) |
| Transportation | 71 (87.6%) | 10 (12.3%) |
| Material Moving | 108 (78.8%) | 29 (21.2%) |
| Total (Category) | 430 (90.3%) | 46 (9.7%) |
| Total (Overall) | 2,114 (56.2%) | 1,645 (43.8%) |
Employment Industries by Sex in Mercer County
Employment Industries in Mercer County
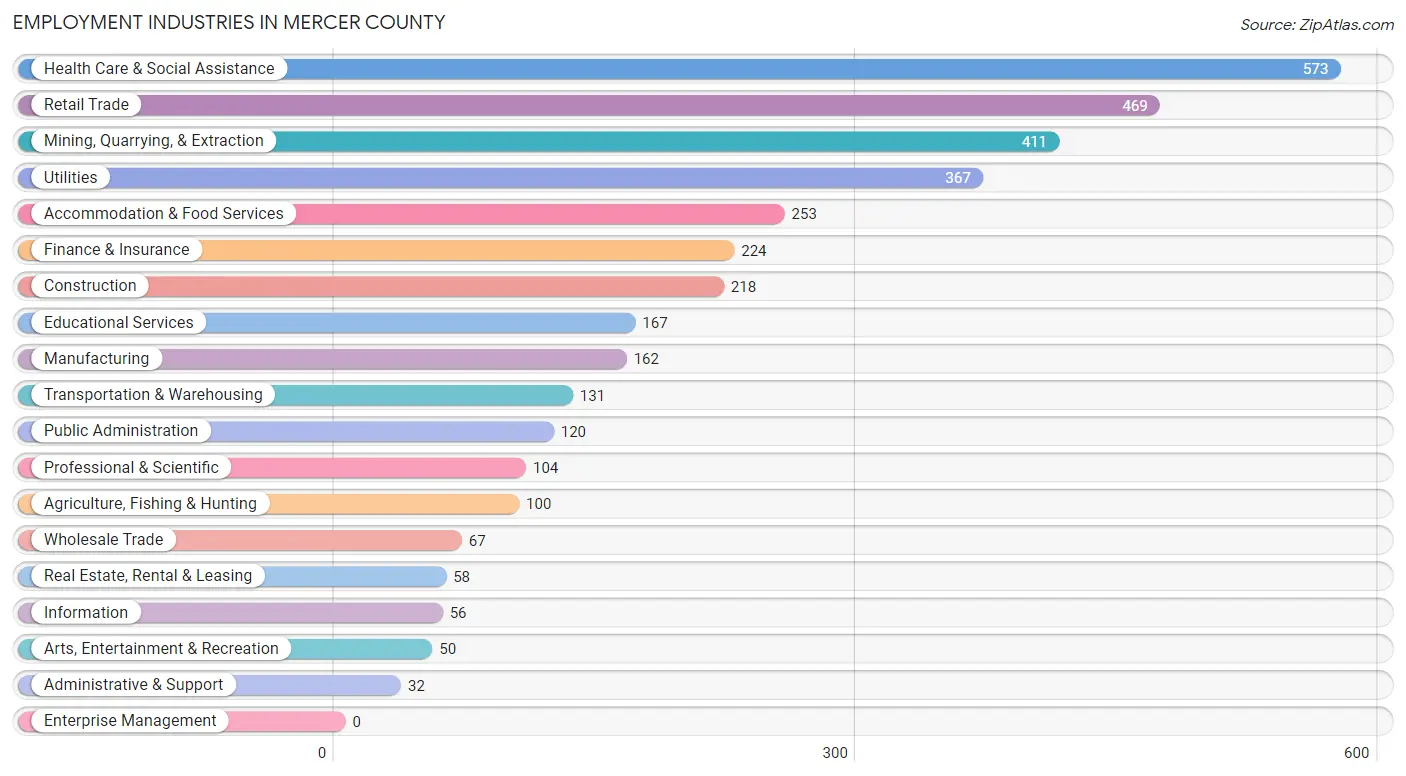
The major employment industries in Mercer County include Health Care & Social Assistance (573 | 15.2%), Retail Trade (469 | 12.5%), Mining, Quarrying, & Extraction (411 | 10.9%), Utilities (367 | 9.8%), and Accommodation & Food Services (253 | 6.7%).
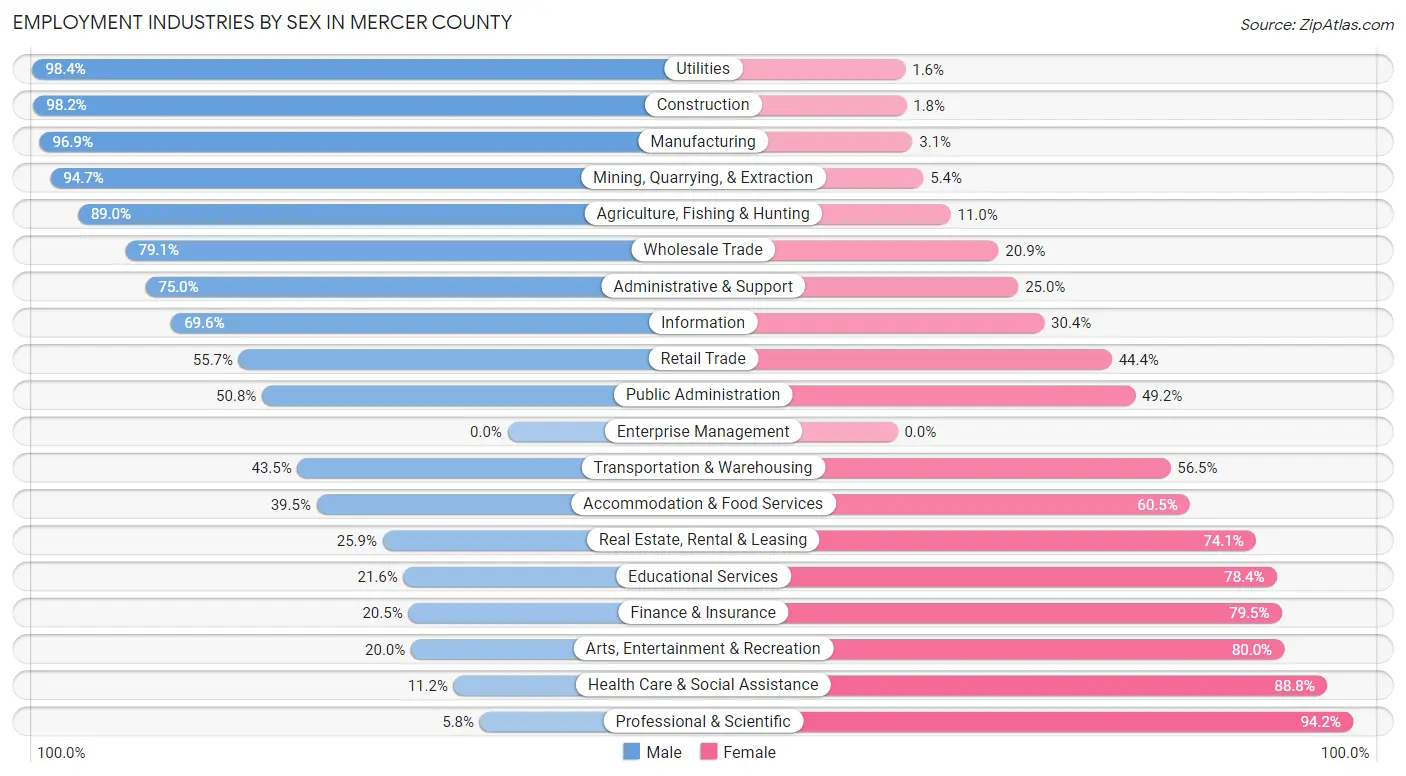
Employment Industries by Sex in Mercer County
The Mercer County industries that see more men than women are Utilities (98.4%), Construction (98.2%), and Manufacturing (96.9%), whereas the industries that tend to have a higher number of women are Professional & Scientific (94.2%), Health Care & Social Assistance (88.8%), and Arts, Entertainment & Recreation (80.0%).
| Industry | Male | Female |
| Agriculture, Fishing & Hunting | 89 (89.0%) | 11 (11.0%) |
| Mining, Quarrying, & Extraction | 389 (94.7%) | 22 (5.3%) |
| Construction | 214 (98.2%) | 4 (1.8%) |
| Manufacturing | 157 (96.9%) | 5 (3.1%) |
| Wholesale Trade | 53 (79.1%) | 14 (20.9%) |
| Retail Trade | 261 (55.6%) | 208 (44.4%) |
| Transportation & Warehousing | 57 (43.5%) | 74 (56.5%) |
| Utilities | 361 (98.4%) | 6 (1.6%) |
| Information | 39 (69.6%) | 17 (30.4%) |
| Finance & Insurance | 46 (20.5%) | 178 (79.5%) |
| Real Estate, Rental & Leasing | 15 (25.9%) | 43 (74.1%) |
| Professional & Scientific | 6 (5.8%) | 98 (94.2%) |
| Enterprise Management | 0 (0.0%) | 0 (0.0%) |
| Administrative & Support | 24 (75.0%) | 8 (25.0%) |
| Educational Services | 36 (21.6%) | 131 (78.4%) |
| Health Care & Social Assistance | 64 (11.2%) | 509 (88.8%) |
| Arts, Entertainment & Recreation | 10 (20.0%) | 40 (80.0%) |
| Accommodation & Food Services | 100 (39.5%) | 153 (60.5%) |
| Public Administration | 61 (50.8%) | 59 (49.2%) |
| Total | 2,114 (56.2%) | 1,645 (43.8%) |
Education in Mercer County
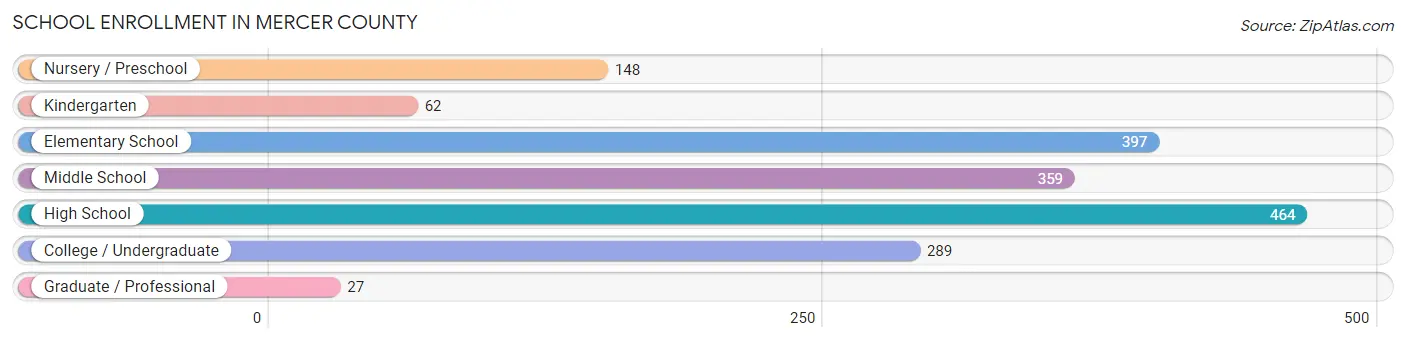
School Enrollment in Mercer County
The most common levels of schooling among the 1,746 students in Mercer County are high school (464 | 26.6%), elementary school (397 | 22.7%), and middle school (359 | 20.6%).
| School Level | # Students | % Students |
| Nursery / Preschool | 148 | 8.5% |
| Kindergarten | 62 | 3.5% |
| Elementary School | 397 | 22.7% |
| Middle School | 359 | 20.6% |
| High School | 464 | 26.6% |
| College / Undergraduate | 289 | 16.6% |
| Graduate / Professional | 27 | 1.5% |
| Total | 1,746 | 100.0% |
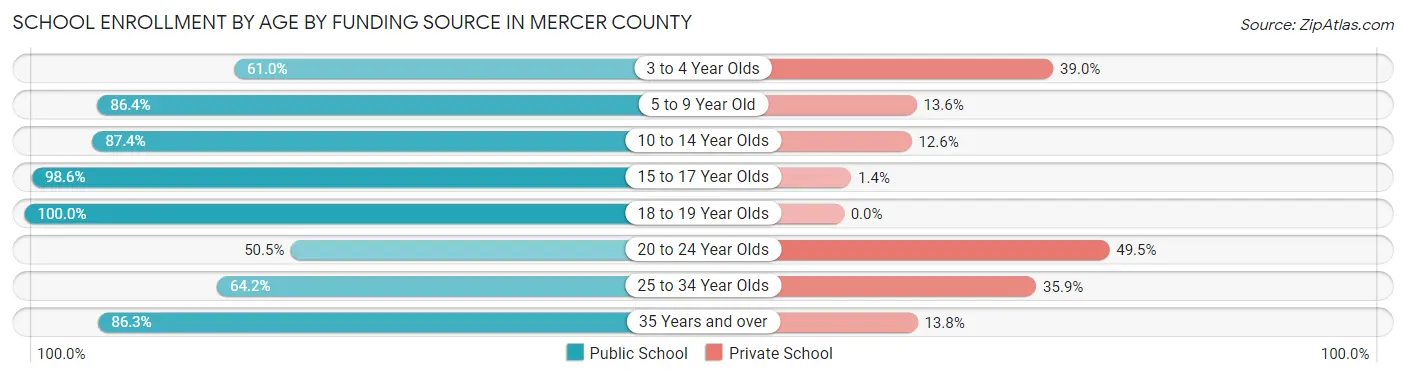
School Enrollment by Age by Funding Source in Mercer County
Out of a total of 1,746 students who are enrolled in schools in Mercer County, 236 (13.5%) attend a private institution, while the remaining 1,510 (86.5%) are enrolled in public schools. The age group of 20 to 24 year olds has the highest likelihood of being enrolled in private schools, with 48 (49.5% in the age bracket) enrolled. Conversely, the age group of 18 to 19 year olds has the lowest likelihood of being enrolled in a private school, with 149 (100.0% in the age bracket) attending a public institution.
| Age Bracket | Public School | Private School |
| 3 to 4 Year Olds | 50 (61.0%) | 32 (39.0%) |
| 5 to 9 Year Old | 376 (86.4%) | 59 (13.6%) |
| 10 to 14 Year Olds | 429 (87.4%) | 62 (12.6%) |
| 15 to 17 Year Olds | 354 (98.6%) | 5 (1.4%) |
| 18 to 19 Year Olds | 149 (100.0%) | 0 (0.0%) |
| 20 to 24 Year Olds | 49 (50.5%) | 48 (49.5%) |
| 25 to 34 Year Olds | 34 (64.1%) | 19 (35.8%) |
| 35 Years and over | 69 (86.3%) | 11 (13.8%) |
| Total | 1,510 (86.5%) | 236 (13.5%) |
Educational Attainment by Field of Study in Mercer County
Business (346 | 28.8%), education (320 | 26.6%), science & technology (150 | 12.5%), engineering (103 | 8.6%), and arts & humanities (66 | 5.5%) are the most common fields of study among 1,201 individuals in Mercer County who have obtained a bachelor's degree or higher.
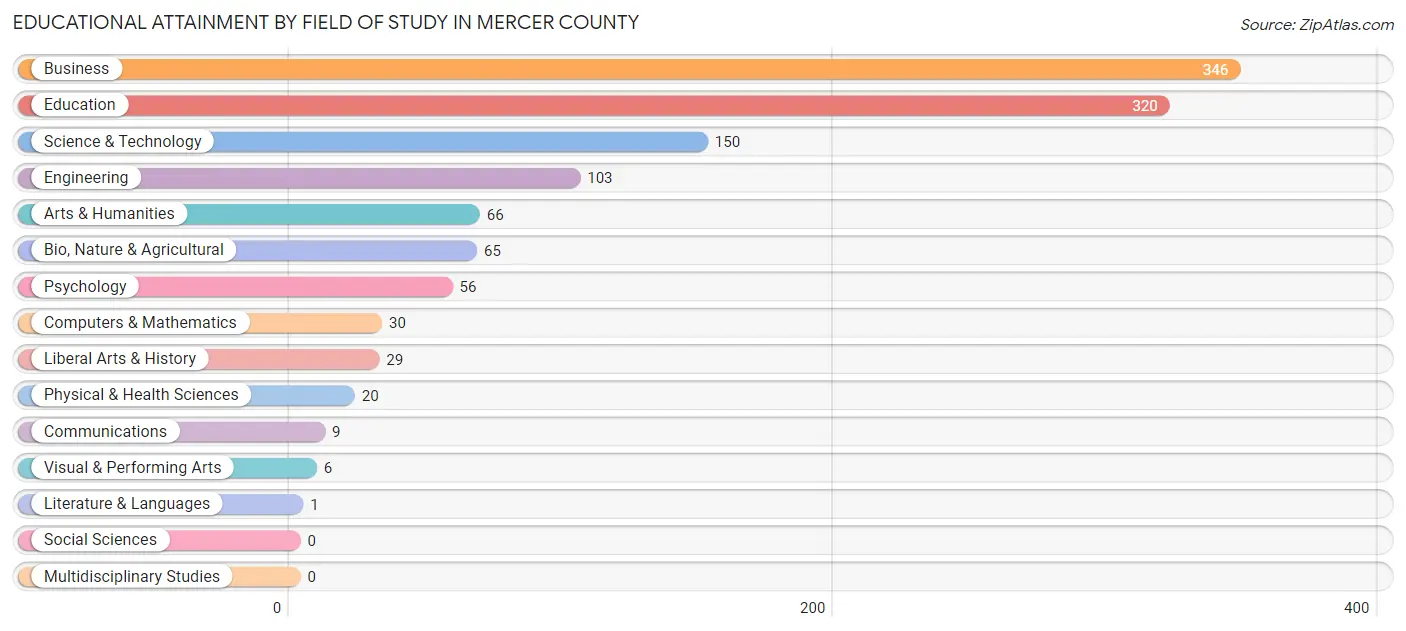
| Field of Study | # Graduates | % Graduates |
| Computers & Mathematics | 30 | 2.5% |
| Bio, Nature & Agricultural | 65 | 5.4% |
| Physical & Health Sciences | 20 | 1.7% |
| Psychology | 56 | 4.7% |
| Social Sciences | 0 | 0.0% |
| Engineering | 103 | 8.6% |
| Multidisciplinary Studies | 0 | 0.0% |
| Science & Technology | 150 | 12.5% |
| Business | 346 | 28.8% |
| Education | 320 | 26.6% |
| Literature & Languages | 1 | 0.1% |
| Liberal Arts & History | 29 | 2.4% |
| Visual & Performing Arts | 6 | 0.5% |
| Communications | 9 | 0.7% |
| Arts & Humanities | 66 | 5.5% |
| Total | 1,201 | 100.0% |
Transportation & Commute in Mercer County
Vehicle Availability by Sex in Mercer County
The most prevalent vehicle ownership categories in Mercer County are males with 3 vehicles (713, accounting for 33.7%) and females with 3 vehicles (507, making up 43.5%).
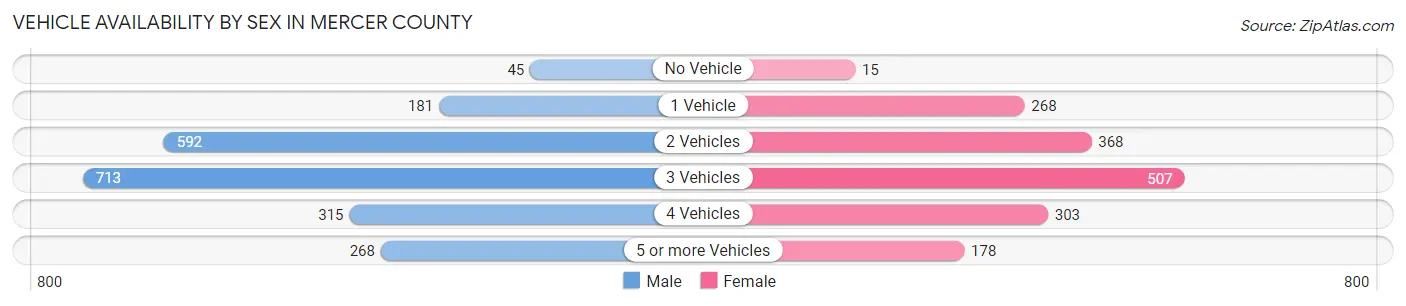
| Vehicles Available | Male | Female |
| No Vehicle | 45 (2.1%) | 15 (0.9%) |
| 1 Vehicle | 181 (8.6%) | 268 (16.4%) |
| 2 Vehicles | 592 (28.0%) | 368 (22.5%) |
| 3 Vehicles | 713 (33.7%) | 507 (30.9%) |
| 4 Vehicles | 315 (14.9%) | 303 (18.5%) |
| 5 or more Vehicles | 268 (12.7%) | 178 (10.9%) |
| Total | 2,114 (100.0%) | 1,639 (100.0%) |
Commute Time in Mercer County
The most frequently occuring commute durations in Mercer County are 5 to 9 minutes (868 commuters, 24.3%), 15 to 19 minutes (590 commuters, 16.5%), and less than 5 minutes (546 commuters, 15.3%).
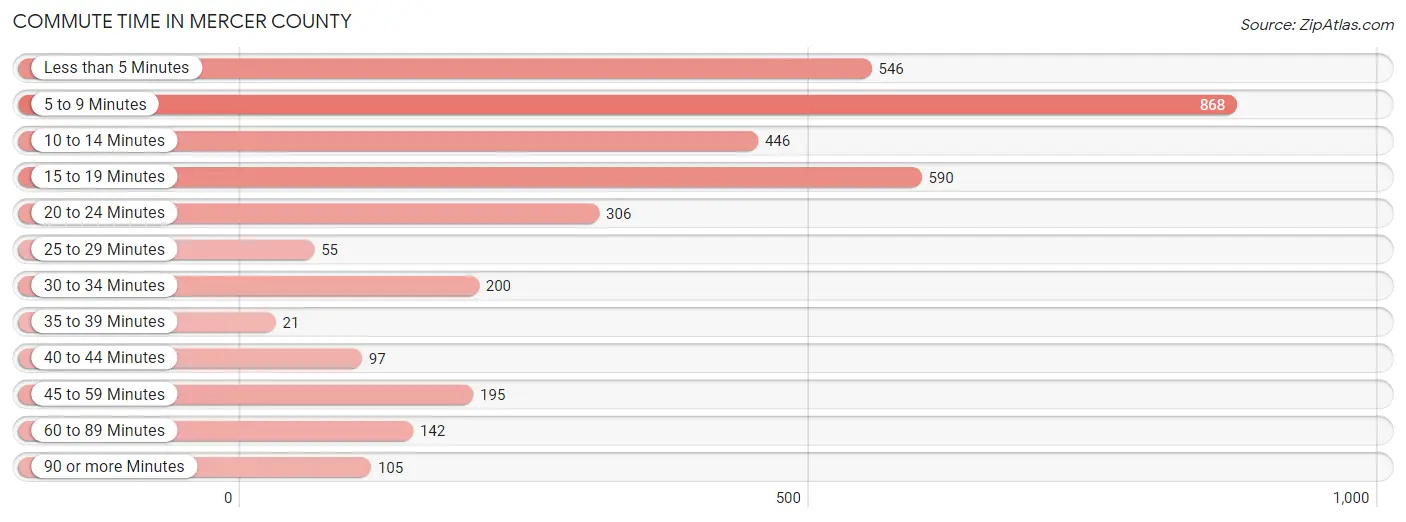
| Commute Time | # Commuters | % Commuters |
| Less than 5 Minutes | 546 | 15.3% |
| 5 to 9 Minutes | 868 | 24.3% |
| 10 to 14 Minutes | 446 | 12.5% |
| 15 to 19 Minutes | 590 | 16.5% |
| 20 to 24 Minutes | 306 | 8.6% |
| 25 to 29 Minutes | 55 | 1.5% |
| 30 to 34 Minutes | 200 | 5.6% |
| 35 to 39 Minutes | 21 | 0.6% |
| 40 to 44 Minutes | 97 | 2.7% |
| 45 to 59 Minutes | 195 | 5.5% |
| 60 to 89 Minutes | 142 | 4.0% |
| 90 or more Minutes | 105 | 2.9% |
Commute Time by Sex in Mercer County
The most common commute times in Mercer County are 5 to 9 minutes (455 commuters, 22.0%) for males and 5 to 9 minutes (413 commuters, 27.5%) for females.
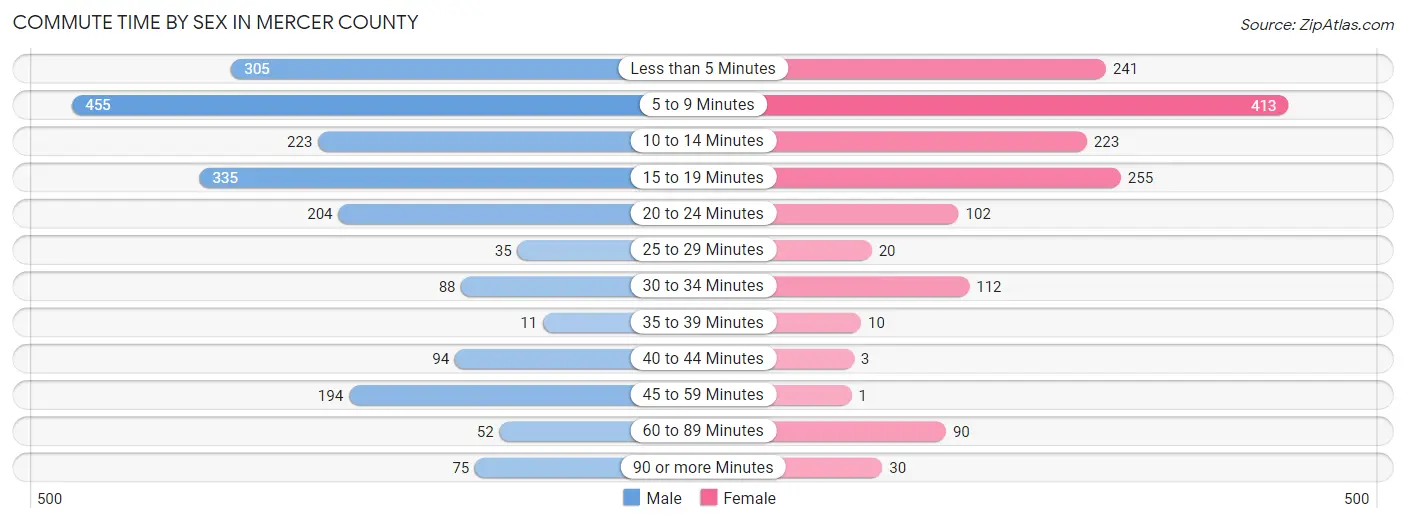
| Commute Time | Male | Female |
| Less than 5 Minutes | 305 (14.7%) | 241 (16.1%) |
| 5 to 9 Minutes | 455 (22.0%) | 413 (27.5%) |
| 10 to 14 Minutes | 223 (10.8%) | 223 (14.9%) |
| 15 to 19 Minutes | 335 (16.2%) | 255 (17.0%) |
| 20 to 24 Minutes | 204 (9.9%) | 102 (6.8%) |
| 25 to 29 Minutes | 35 (1.7%) | 20 (1.3%) |
| 30 to 34 Minutes | 88 (4.3%) | 112 (7.5%) |
| 35 to 39 Minutes | 11 (0.5%) | 10 (0.7%) |
| 40 to 44 Minutes | 94 (4.5%) | 3 (0.2%) |
| 45 to 59 Minutes | 194 (9.4%) | 1 (0.1%) |
| 60 to 89 Minutes | 52 (2.5%) | 90 (6.0%) |
| 90 or more Minutes | 75 (3.6%) | 30 (2.0%) |
Time of Departure to Work by Sex in Mercer County
The most frequent times of departure to work in Mercer County are 6:00 AM to 6:29 AM (341, 16.5%) for males and 7:00 AM to 7:29 AM (340, 22.7%) for females.
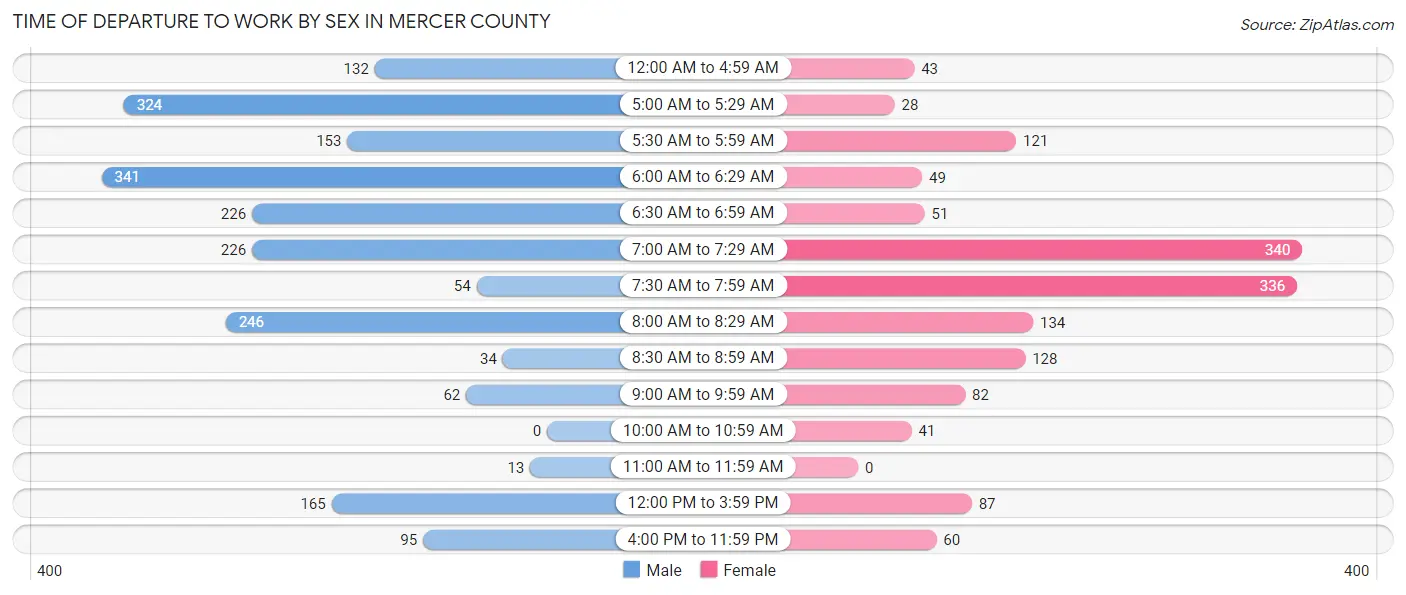
| Time of Departure | Male | Female |
| 12:00 AM to 4:59 AM | 132 (6.4%) | 43 (2.9%) |
| 5:00 AM to 5:29 AM | 324 (15.6%) | 28 (1.9%) |
| 5:30 AM to 5:59 AM | 153 (7.4%) | 121 (8.1%) |
| 6:00 AM to 6:29 AM | 341 (16.5%) | 49 (3.3%) |
| 6:30 AM to 6:59 AM | 226 (10.9%) | 51 (3.4%) |
| 7:00 AM to 7:29 AM | 226 (10.9%) | 340 (22.7%) |
| 7:30 AM to 7:59 AM | 54 (2.6%) | 336 (22.4%) |
| 8:00 AM to 8:29 AM | 246 (11.9%) | 134 (8.9%) |
| 8:30 AM to 8:59 AM | 34 (1.6%) | 128 (8.5%) |
| 9:00 AM to 9:59 AM | 62 (3.0%) | 82 (5.5%) |
| 10:00 AM to 10:59 AM | 0 (0.0%) | 41 (2.7%) |
| 11:00 AM to 11:59 AM | 13 (0.6%) | 0 (0.0%) |
| 12:00 PM to 3:59 PM | 165 (8.0%) | 87 (5.8%) |
| 4:00 PM to 11:59 PM | 95 (4.6%) | 60 (4.0%) |
| Total | 2,071 (100.0%) | 1,500 (100.0%) |
Housing Occupancy in Mercer County
Occupancy by Ownership in Mercer County
Of the total 3,536 dwellings in Mercer County, owner-occupied units account for 2,963 (83.8%), while renter-occupied units make up 573 (16.2%).
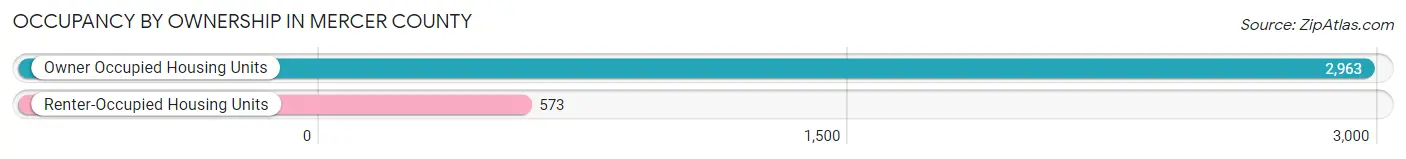
| Occupancy | # Housing Units | % Housing Units |
| Owner Occupied Housing Units | 2,963 | 83.8% |
| Renter-Occupied Housing Units | 573 | 16.2% |
| Total Occupied Housing Units | 3,536 | 100.0% |
Occupancy by Household Size in Mercer County
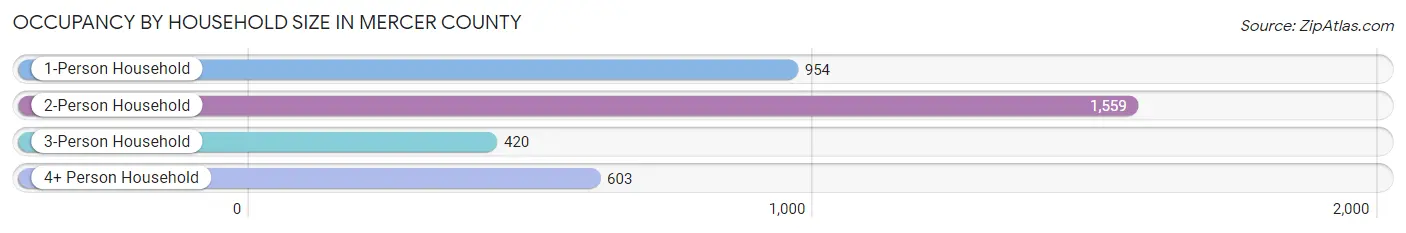
| Household Size | # Housing Units | % Housing Units |
| 1-Person Household | 954 | 27.0% |
| 2-Person Household | 1,559 | 44.1% |
| 3-Person Household | 420 | 11.9% |
| 4+ Person Household | 603 | 17.1% |
| Total Housing Units | 3,536 | 100.0% |
Occupancy by Ownership by Household Size in Mercer County
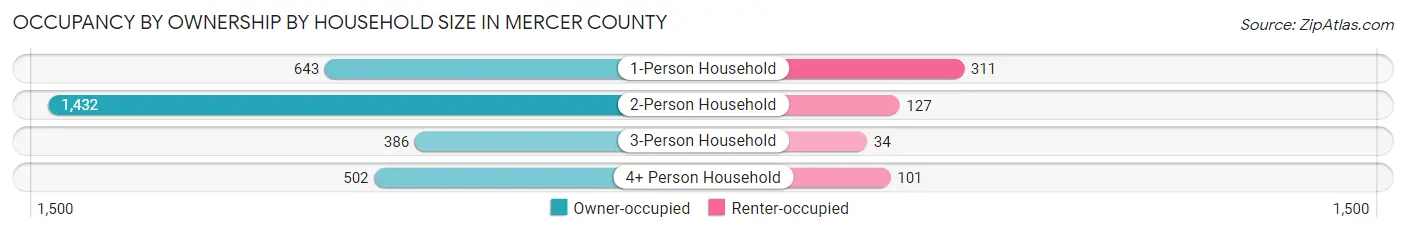
| Household Size | Owner-occupied | Renter-occupied |
| 1-Person Household | 643 (67.4%) | 311 (32.6%) |
| 2-Person Household | 1,432 (91.8%) | 127 (8.2%) |
| 3-Person Household | 386 (91.9%) | 34 (8.1%) |
| 4+ Person Household | 502 (83.3%) | 101 (16.8%) |
| Total Housing Units | 2,963 (83.8%) | 573 (16.2%) |
Occupancy by Educational Attainment in Mercer County
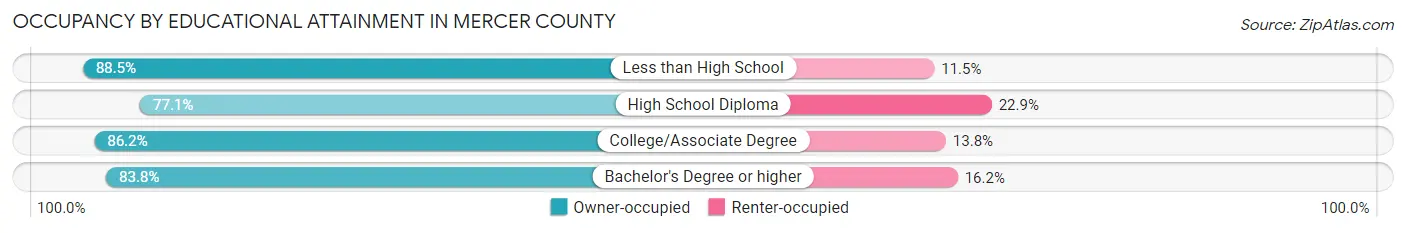
| Household Size | Owner-occupied | Renter-occupied |
| Less than High School | 376 (88.5%) | 49 (11.5%) |
| High School Diploma | 656 (77.1%) | 195 (22.9%) |
| College/Associate Degree | 1,340 (86.2%) | 215 (13.8%) |
| Bachelor's Degree or higher | 591 (83.8%) | 114 (16.2%) |
Occupancy by Age of Householder in Mercer County
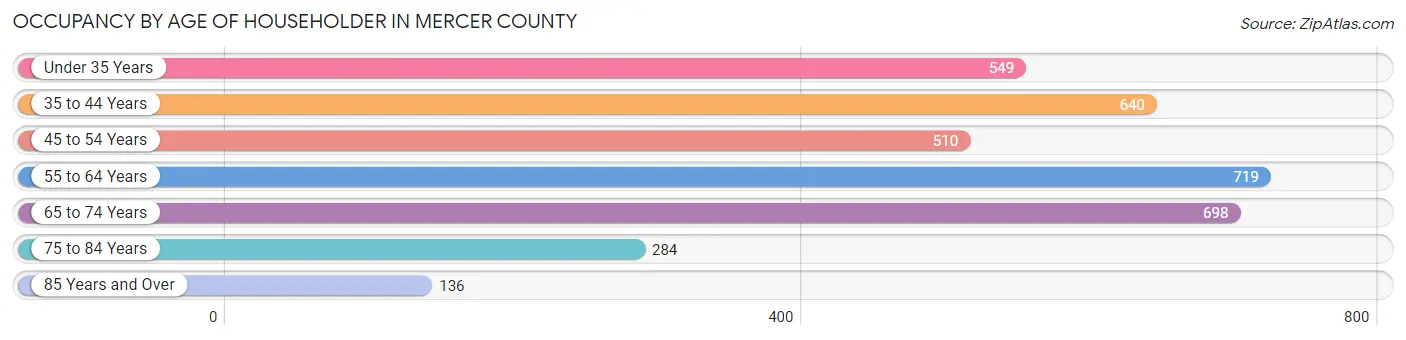
| Age Bracket | # Households | % Households |
| Under 35 Years | 549 | 15.5% |
| 35 to 44 Years | 640 | 18.1% |
| 45 to 54 Years | 510 | 14.4% |
| 55 to 64 Years | 719 | 20.3% |
| 65 to 74 Years | 698 | 19.7% |
| 75 to 84 Years | 284 | 8.0% |
| 85 Years and Over | 136 | 3.8% |
| Total | 3,536 | 100.0% |
Housing Finances in Mercer County
Median Income by Occupancy in Mercer County
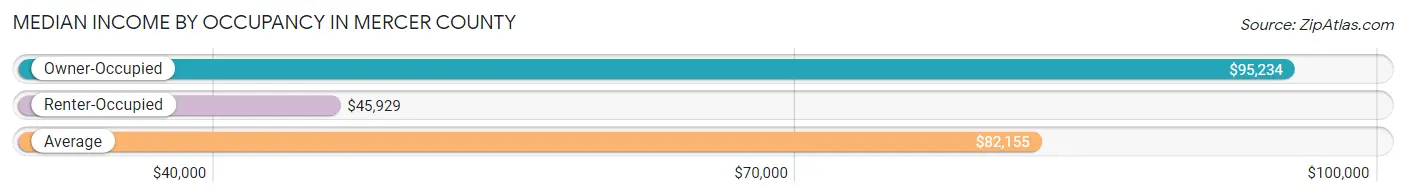
| Occupancy Type | # Households | Median Income |
| Owner-Occupied | 2,963 (83.8%) | $95,234 |
| Renter-Occupied | 573 (16.2%) | $45,929 |
| Average | 3,536 (100.0%) | $82,155 |
Occupancy by Householder Income Bracket in Mercer County
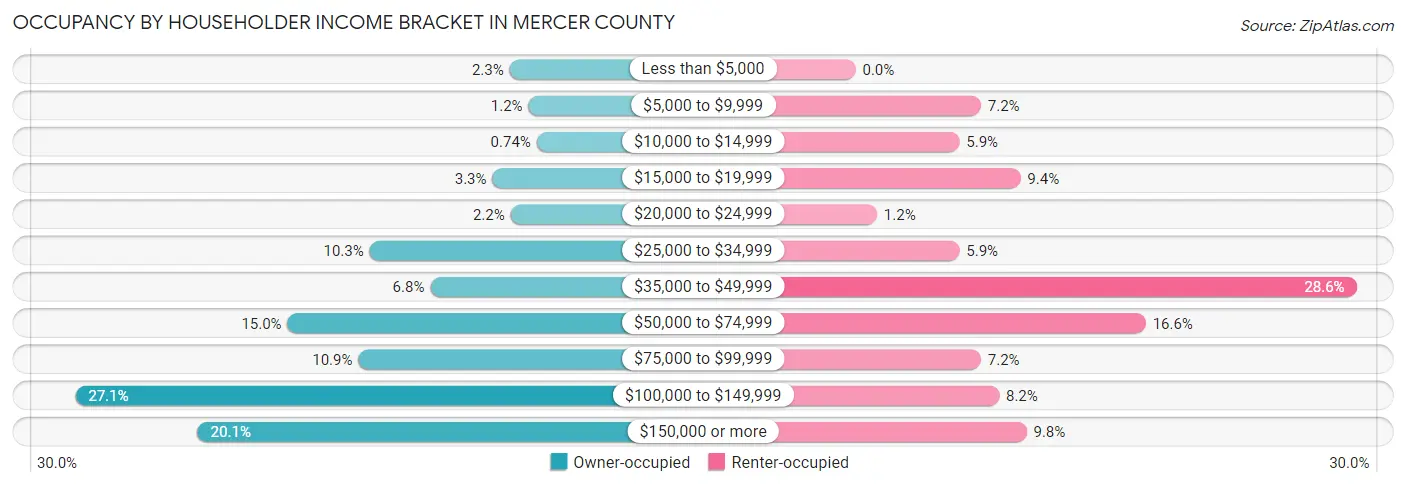
| Income Bracket | Owner-occupied | Renter-occupied |
| Less than $5,000 | 68 (2.3%) | 0 (0.0%) |
| $5,000 to $9,999 | 36 (1.2%) | 41 (7.2%) |
| $10,000 to $14,999 | 22 (0.7%) | 34 (5.9%) |
| $15,000 to $19,999 | 97 (3.3%) | 54 (9.4%) |
| $20,000 to $24,999 | 66 (2.2%) | 7 (1.2%) |
| $25,000 to $34,999 | 305 (10.3%) | 34 (5.9%) |
| $35,000 to $49,999 | 202 (6.8%) | 164 (28.6%) |
| $50,000 to $74,999 | 444 (15.0%) | 95 (16.6%) |
| $75,000 to $99,999 | 324 (10.9%) | 41 (7.2%) |
| $100,000 to $149,999 | 803 (27.1%) | 47 (8.2%) |
| $150,000 or more | 596 (20.1%) | 56 (9.8%) |
| Total | 2,963 (100.0%) | 573 (100.0%) |
Monthly Housing Cost Tiers in Mercer County
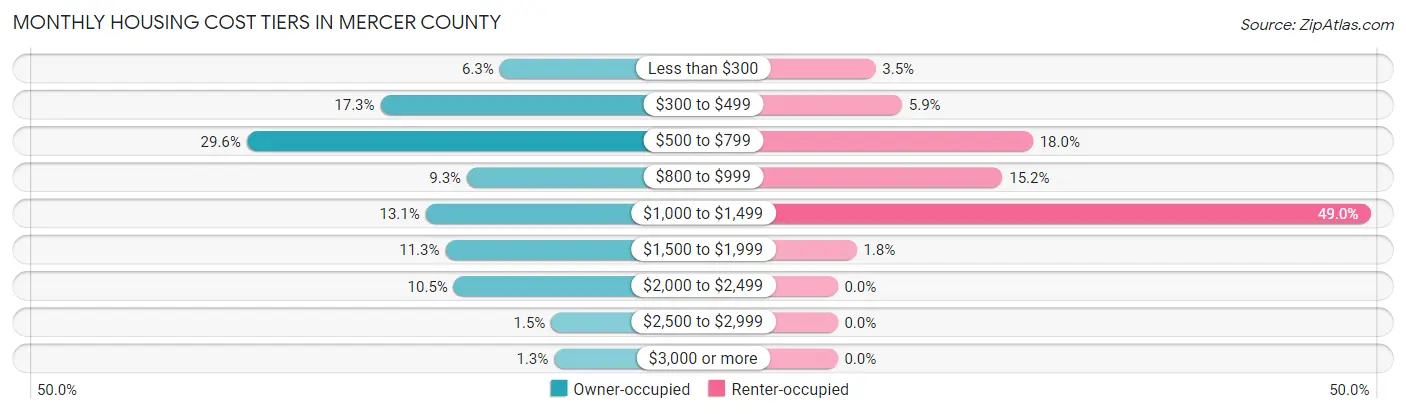
| Monthly Cost | Owner-occupied | Renter-occupied |
| Less than $300 | 186 (6.3%) | 20 (3.5%) |
| $300 to $499 | 511 (17.2%) | 34 (5.9%) |
| $500 to $799 | 876 (29.6%) | 103 (18.0%) |
| $800 to $999 | 275 (9.3%) | 87 (15.2%) |
| $1,000 to $1,499 | 388 (13.1%) | 281 (49.0%) |
| $1,500 to $1,999 | 334 (11.3%) | 10 (1.8%) |
| $2,000 to $2,499 | 311 (10.5%) | 0 (0.0%) |
| $2,500 to $2,999 | 45 (1.5%) | 0 (0.0%) |
| $3,000 or more | 37 (1.3%) | 0 (0.0%) |
| Total | 2,963 (100.0%) | 573 (100.0%) |
Physical Housing Characteristics in Mercer County
Housing Structures in Mercer County
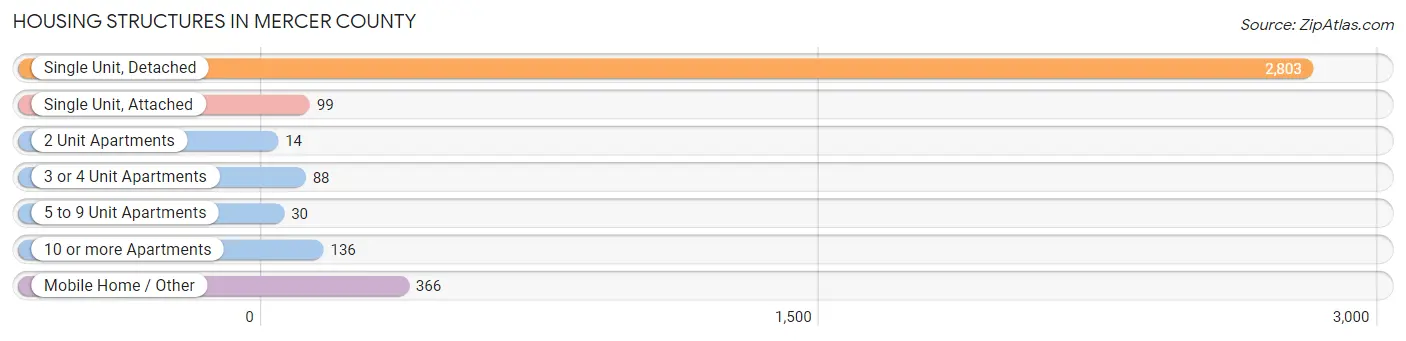
| Structure Type | # Housing Units | % Housing Units |
| Single Unit, Detached | 2,803 | 79.3% |
| Single Unit, Attached | 99 | 2.8% |
| 2 Unit Apartments | 14 | 0.4% |
| 3 or 4 Unit Apartments | 88 | 2.5% |
| 5 to 9 Unit Apartments | 30 | 0.9% |
| 10 or more Apartments | 136 | 3.8% |
| Mobile Home / Other | 366 | 10.3% |
| Total | 3,536 | 100.0% |
Housing Structures by Occupancy in Mercer County
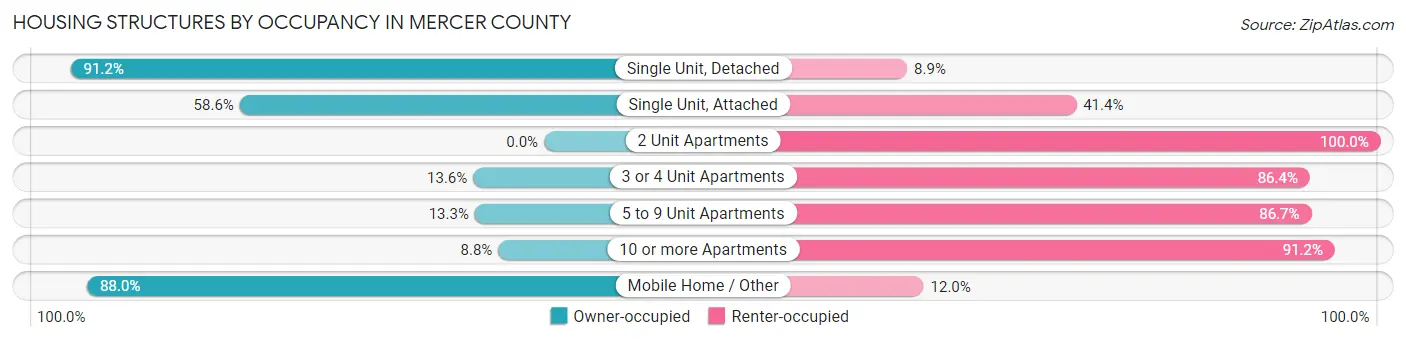
| Structure Type | Owner-occupied | Renter-occupied |
| Single Unit, Detached | 2,555 (91.1%) | 248 (8.8%) |
| Single Unit, Attached | 58 (58.6%) | 41 (41.4%) |
| 2 Unit Apartments | 0 (0.0%) | 14 (100.0%) |
| 3 or 4 Unit Apartments | 12 (13.6%) | 76 (86.4%) |
| 5 to 9 Unit Apartments | 4 (13.3%) | 26 (86.7%) |
| 10 or more Apartments | 12 (8.8%) | 124 (91.2%) |
| Mobile Home / Other | 322 (88.0%) | 44 (12.0%) |
| Total | 2,963 (83.8%) | 573 (16.2%) |
Housing Structures by Number of Rooms in Mercer County
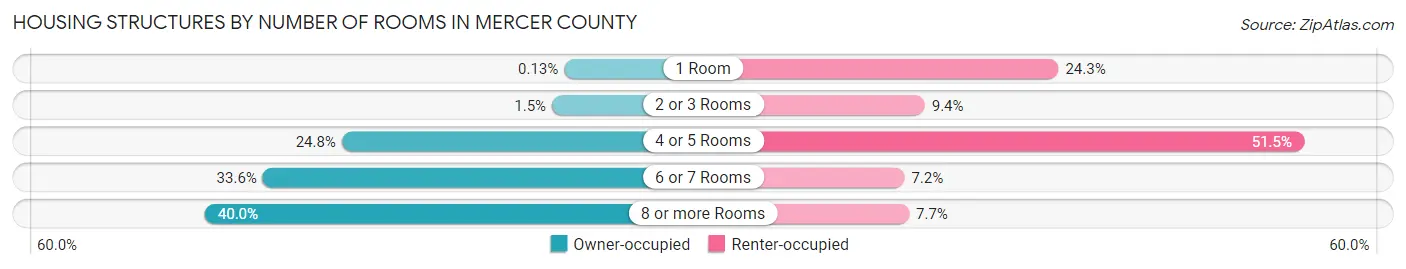
| Number of Rooms | Owner-occupied | Renter-occupied |
| 1 Room | 4 (0.1%) | 139 (24.3%) |
| 2 or 3 Rooms | 44 (1.5%) | 54 (9.4%) |
| 4 or 5 Rooms | 735 (24.8%) | 295 (51.5%) |
| 6 or 7 Rooms | 995 (33.6%) | 41 (7.2%) |
| 8 or more Rooms | 1,185 (40.0%) | 44 (7.7%) |
| Total | 2,963 (100.0%) | 573 (100.0%) |
Housing Structure by Heating Type in Mercer County
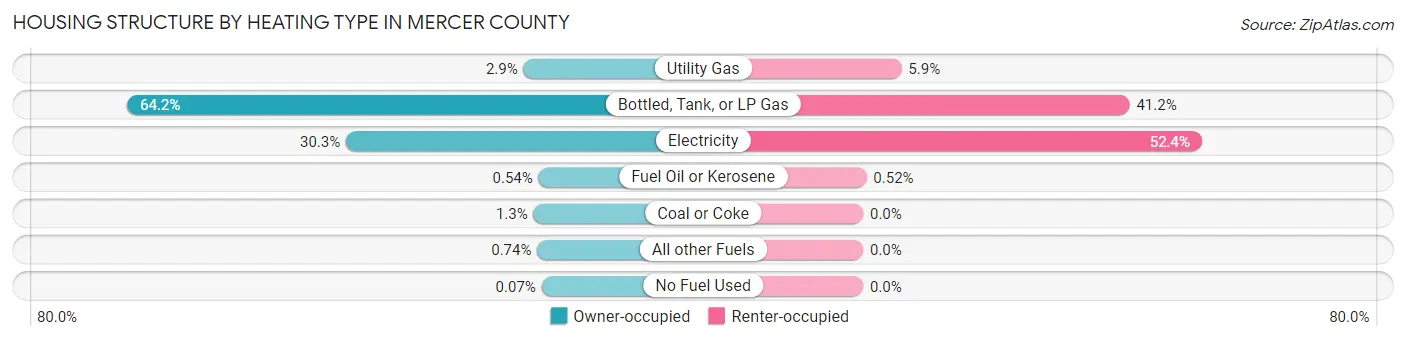
| Heating Type | Owner-occupied | Renter-occupied |
| Utility Gas | 85 (2.9%) | 34 (5.9%) |
| Bottled, Tank, or LP Gas | 1,901 (64.2%) | 236 (41.2%) |
| Electricity | 898 (30.3%) | 300 (52.4%) |
| Fuel Oil or Kerosene | 16 (0.5%) | 3 (0.5%) |
| Coal or Coke | 39 (1.3%) | 0 (0.0%) |
| All other Fuels | 22 (0.7%) | 0 (0.0%) |
| No Fuel Used | 2 (0.1%) | 0 (0.0%) |
| Total | 2,963 (100.0%) | 573 (100.0%) |
Household Vehicle Usage in Mercer County
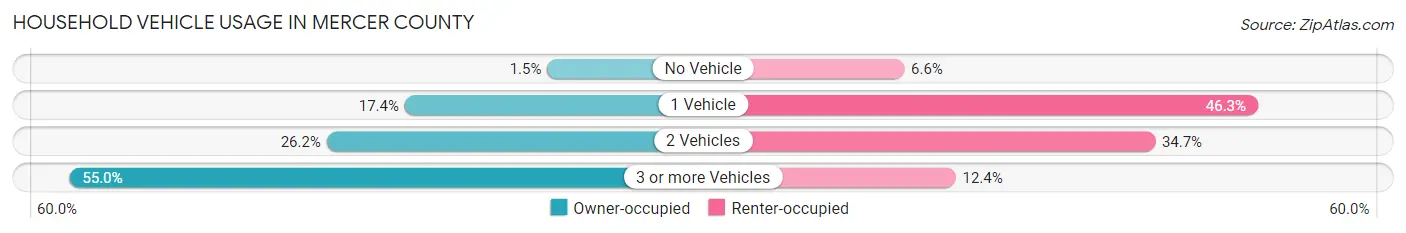
| Vehicles per Household | Owner-occupied | Renter-occupied |
| No Vehicle | 43 (1.5%) | 38 (6.6%) |
| 1 Vehicle | 516 (17.4%) | 265 (46.3%) |
| 2 Vehicles | 775 (26.2%) | 199 (34.7%) |
| 3 or more Vehicles | 1,629 (55.0%) | 71 (12.4%) |
| Total | 2,963 (100.0%) | 573 (100.0%) |
Real Estate & Mortgages in Mercer County
Real Estate and Mortgage Overview in Mercer County
| Characteristic | Without Mortgage | With Mortgage |
| Housing Units | 1,717 | 1,246 |
| Median Property Value | $149,600 | $258,900 |
| Median Household Income | $63,224 | $366 |
| Monthly Housing Costs | $564 | $37 |
| Real Estate Taxes | $1,918 | $37 |
Property Value by Mortgage Status in Mercer County
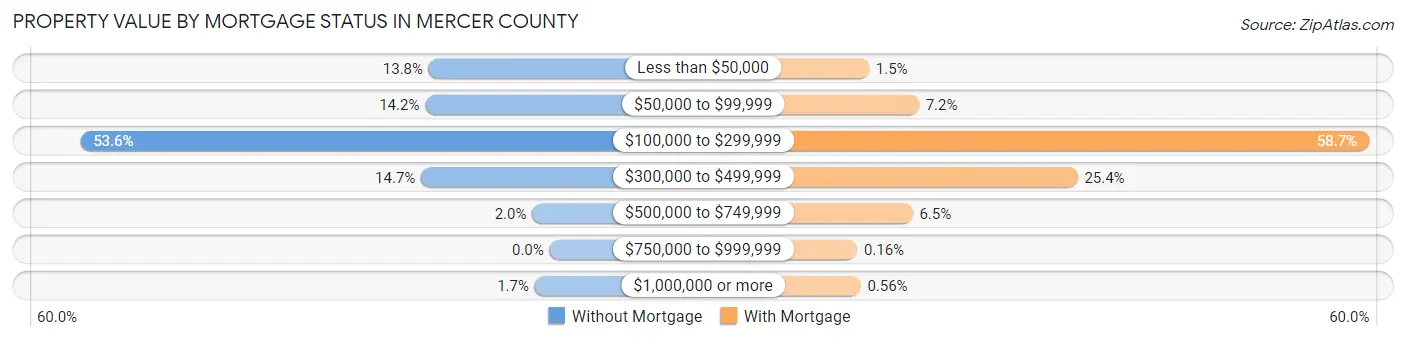
| Property Value | Without Mortgage | With Mortgage |
| Less than $50,000 | 237 (13.8%) | 19 (1.5%) |
| $50,000 to $99,999 | 244 (14.2%) | 90 (7.2%) |
| $100,000 to $299,999 | 921 (53.6%) | 731 (58.7%) |
| $300,000 to $499,999 | 252 (14.7%) | 316 (25.4%) |
| $500,000 to $749,999 | 34 (2.0%) | 81 (6.5%) |
| $750,000 to $999,999 | 0 (0.0%) | 2 (0.2%) |
| $1,000,000 or more | 29 (1.7%) | 7 (0.6%) |
| Total | 1,717 (100.0%) | 1,246 (100.0%) |
Household Income by Mortgage Status in Mercer County
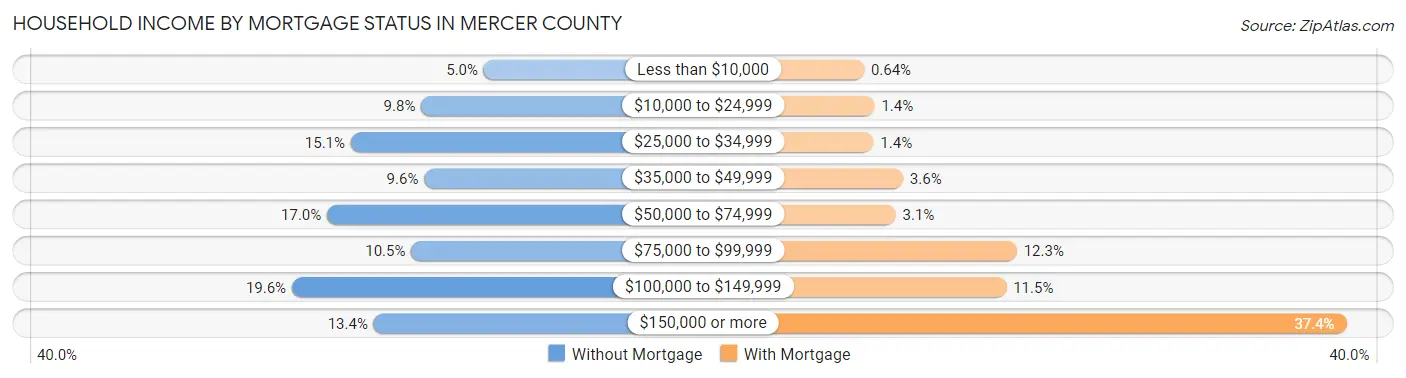
| Household Income | Without Mortgage | With Mortgage |
| Less than $10,000 | 86 (5.0%) | 8 (0.6%) |
| $10,000 to $24,999 | 168 (9.8%) | 18 (1.4%) |
| $25,000 to $34,999 | 260 (15.1%) | 17 (1.4%) |
| $35,000 to $49,999 | 164 (9.6%) | 45 (3.6%) |
| $50,000 to $74,999 | 291 (17.0%) | 38 (3.0%) |
| $75,000 to $99,999 | 181 (10.5%) | 153 (12.3%) |
| $100,000 to $149,999 | 337 (19.6%) | 143 (11.5%) |
| $150,000 or more | 230 (13.4%) | 466 (37.4%) |
| Total | 1,717 (100.0%) | 1,246 (100.0%) |
Property Value to Household Income Ratio in Mercer County
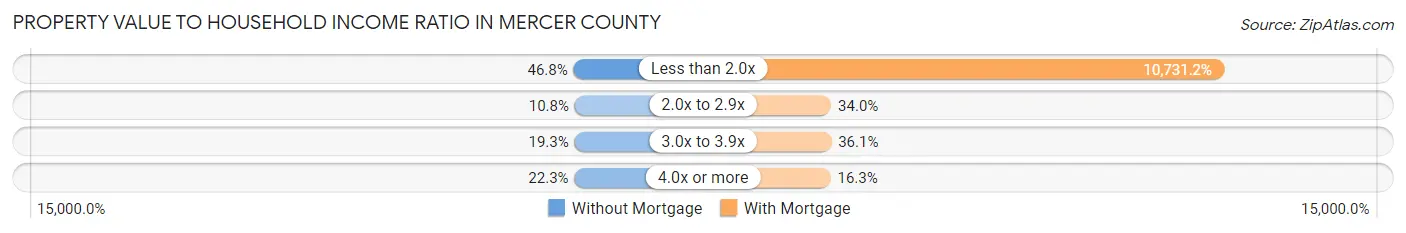
| Value-to-Income Ratio | Without Mortgage | With Mortgage |
| Less than 2.0x | 803 (46.8%) | 133,711 (10,731.2%) |
| 2.0x to 2.9x | 186 (10.8%) | 424 (34.0%) |
| 3.0x to 3.9x | 332 (19.3%) | 450 (36.1%) |
| 4.0x or more | 382 (22.3%) | 203 (16.3%) |
| Total | 1,717 (100.0%) | 1,246 (100.0%) |
Real Estate Taxes by Mortgage Status in Mercer County
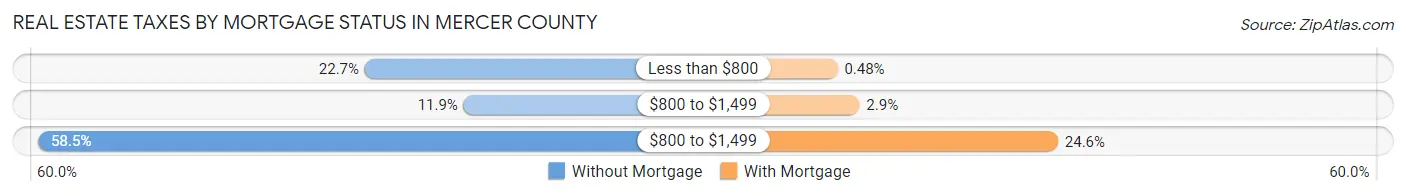
| Property Taxes | Without Mortgage | With Mortgage |
| Less than $800 | 390 (22.7%) | 6 (0.5%) |
| $800 to $1,499 | 204 (11.9%) | 36 (2.9%) |
| $800 to $1,499 | 1,005 (58.5%) | 307 (24.6%) |
| Total | 1,717 (100.0%) | 1,246 (100.0%) |
Health & Disability in Mercer County
Health Insurance Coverage by Age in Mercer County
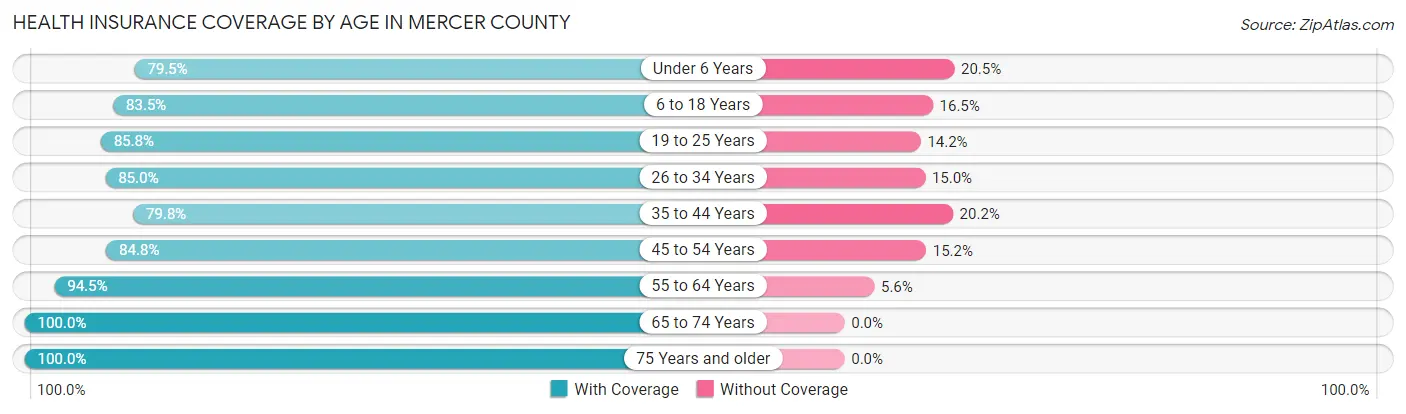
| Age Bracket | With Coverage | Without Coverage |
| Under 6 Years | 478 (79.5%) | 123 (20.5%) |
| 6 to 18 Years | 1,156 (83.5%) | 228 (16.5%) |
| 19 to 25 Years | 429 (85.8%) | 71 (14.2%) |
| 26 to 34 Years | 644 (85.0%) | 114 (15.0%) |
| 35 to 44 Years | 817 (79.8%) | 207 (20.2%) |
| 45 to 54 Years | 759 (84.8%) | 136 (15.2%) |
| 55 to 64 Years | 1,328 (94.5%) | 78 (5.6%) |
| 65 to 74 Years | 1,012 (100.0%) | 0 (0.0%) |
| 75 Years and older | 623 (100.0%) | 0 (0.0%) |
| Total | 7,246 (88.3%) | 957 (11.7%) |
Health Insurance Coverage by Citizenship Status in Mercer County
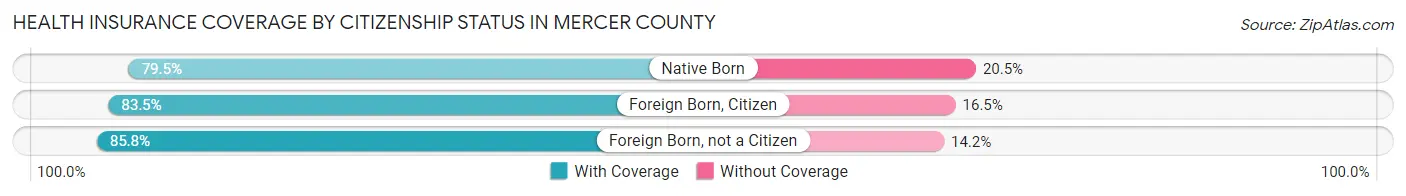
| Citizenship Status | With Coverage | Without Coverage |
| Native Born | 478 (79.5%) | 123 (20.5%) |
| Foreign Born, Citizen | 1,156 (83.5%) | 228 (16.5%) |
| Foreign Born, not a Citizen | 429 (85.8%) | 71 (14.2%) |
Health Insurance Coverage by Household Income in Mercer County
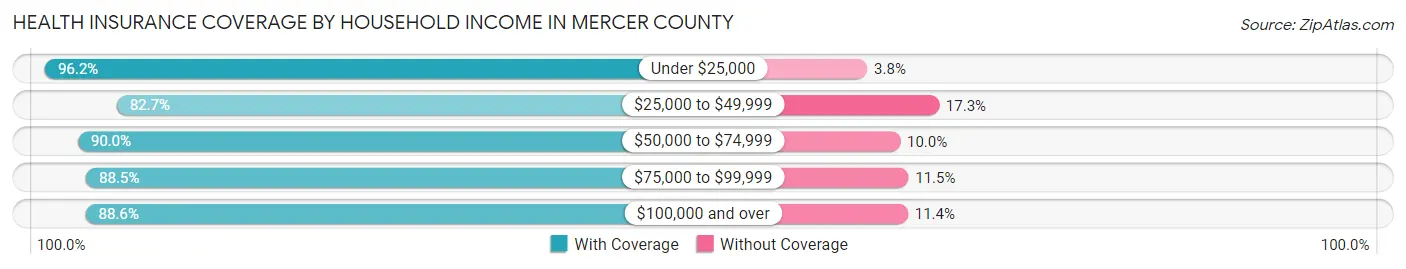
| Household Income | With Coverage | Without Coverage |
| Under $25,000 | 679 (96.2%) | 27 (3.8%) |
| $25,000 to $49,999 | 1,242 (82.7%) | 259 (17.3%) |
| $50,000 to $74,999 | 885 (90.0%) | 98 (10.0%) |
| $75,000 to $99,999 | 836 (88.5%) | 109 (11.5%) |
| $100,000 and over | 3,594 (88.6%) | 464 (11.4%) |
Public vs Private Health Insurance Coverage by Age in Mercer County
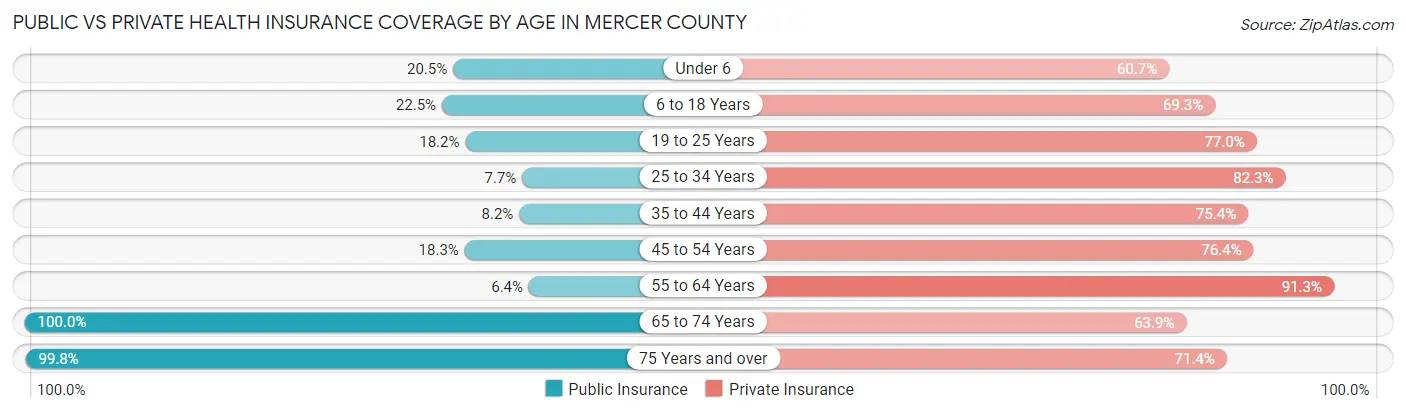
| Age Bracket | Public Insurance | Private Insurance |
| Under 6 | 123 (20.5%) | 365 (60.7%) |
| 6 to 18 Years | 312 (22.5%) | 959 (69.3%) |
| 19 to 25 Years | 91 (18.2%) | 385 (77.0%) |
| 25 to 34 Years | 58 (7.6%) | 624 (82.3%) |
| 35 to 44 Years | 84 (8.2%) | 772 (75.4%) |
| 45 to 54 Years | 164 (18.3%) | 684 (76.4%) |
| 55 to 64 Years | 90 (6.4%) | 1,284 (91.3%) |
| 65 to 74 Years | 1,012 (100.0%) | 647 (63.9%) |
| 75 Years and over | 622 (99.8%) | 445 (71.4%) |
| Total | 2,556 (31.2%) | 6,165 (75.2%) |
Disability Status by Sex by Age in Mercer County
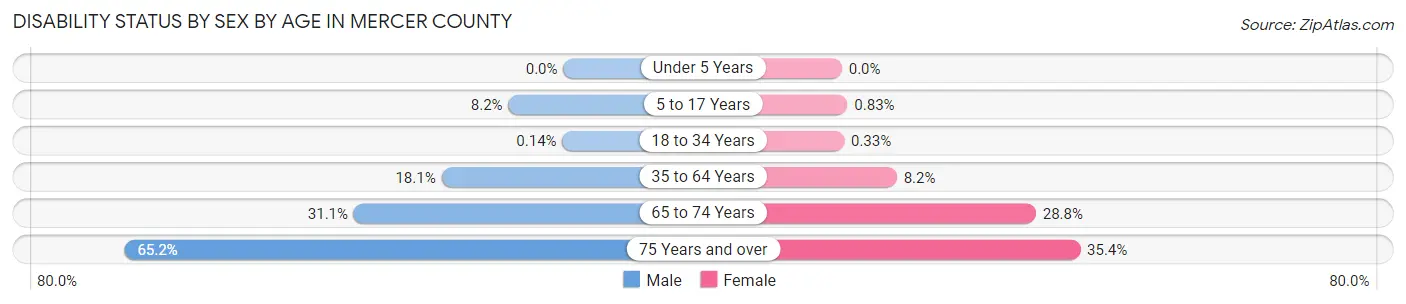
| Age Bracket | Male | Female |
| Under 5 Years | 0 (0.0%) | 0 (0.0%) |
| 5 to 17 Years | 57 (8.2%) | 6 (0.8%) |
| 18 to 34 Years | 1 (0.1%) | 2 (0.3%) |
| 35 to 64 Years | 309 (18.1%) | 132 (8.2%) |
| 65 to 74 Years | 168 (31.1%) | 136 (28.8%) |
| 75 Years and over | 174 (65.2%) | 126 (35.4%) |
Disability Class by Sex by Age in Mercer County
Disability Class: Hearing Difficulty
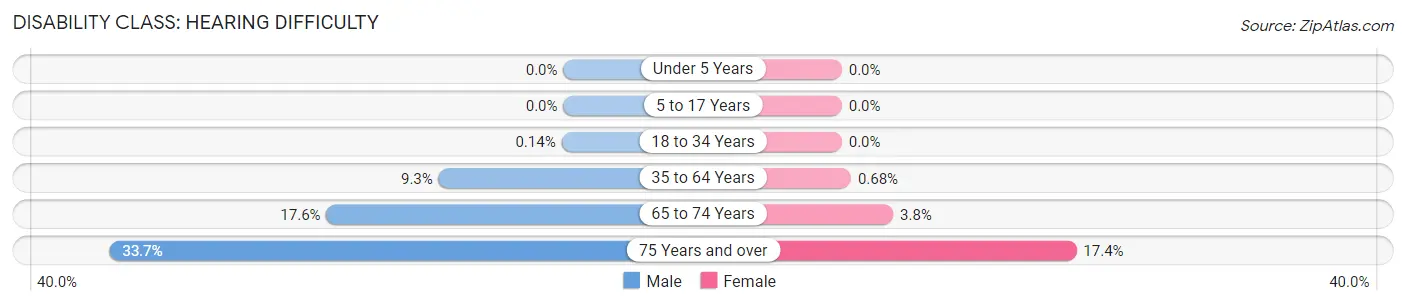
| Age Bracket | Male | Female |
| Under 5 Years | 0 (0.0%) | 0 (0.0%) |
| 5 to 17 Years | 0 (0.0%) | 0 (0.0%) |
| 18 to 34 Years | 1 (0.1%) | 0 (0.0%) |
| 35 to 64 Years | 158 (9.3%) | 11 (0.7%) |
| 65 to 74 Years | 95 (17.6%) | 18 (3.8%) |
| 75 Years and over | 90 (33.7%) | 62 (17.4%) |
Disability Class: Vision Difficulty
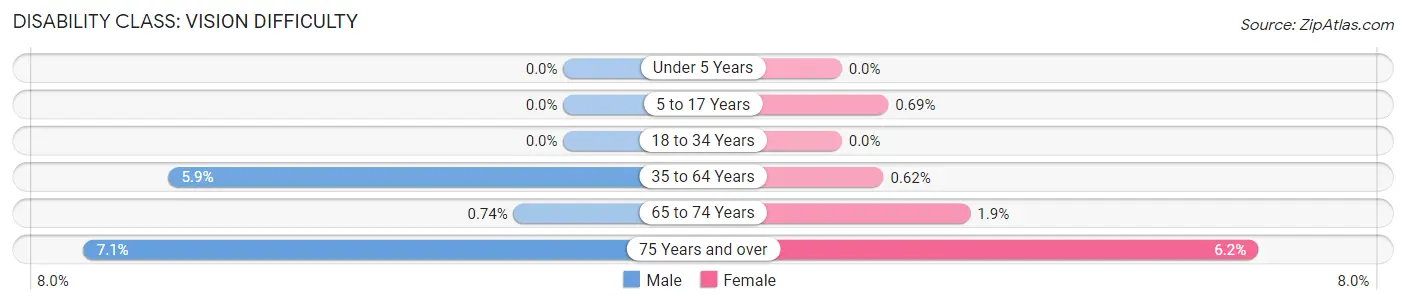
| Age Bracket | Male | Female |
| Under 5 Years | 0 (0.0%) | 0 (0.0%) |
| 5 to 17 Years | 0 (0.0%) | 5 (0.7%) |
| 18 to 34 Years | 0 (0.0%) | 0 (0.0%) |
| 35 to 64 Years | 100 (5.9%) | 10 (0.6%) |
| 65 to 74 Years | 4 (0.7%) | 9 (1.9%) |
| 75 Years and over | 19 (7.1%) | 22 (6.2%) |
Disability Class: Cognitive Difficulty
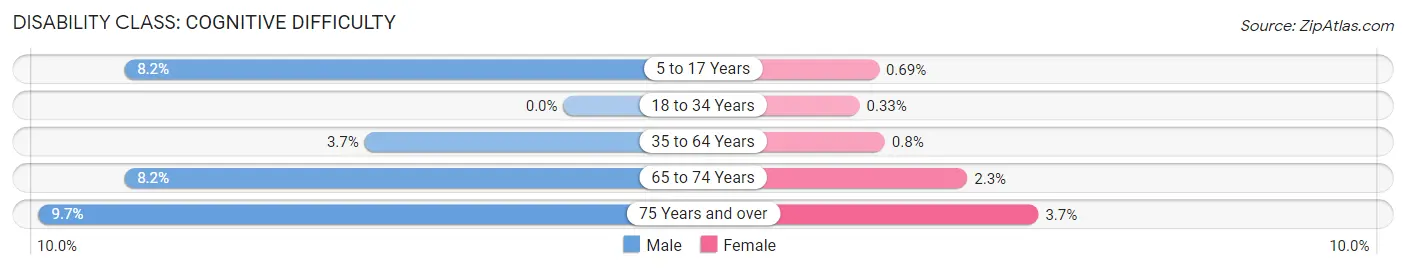
| Age Bracket | Male | Female |
| 5 to 17 Years | 57 (8.2%) | 5 (0.7%) |
| 18 to 34 Years | 0 (0.0%) | 2 (0.3%) |
| 35 to 64 Years | 63 (3.7%) | 13 (0.8%) |
| 65 to 74 Years | 44 (8.2%) | 11 (2.3%) |
| 75 Years and over | 26 (9.7%) | 13 (3.6%) |
Disability Class: Ambulatory Difficulty
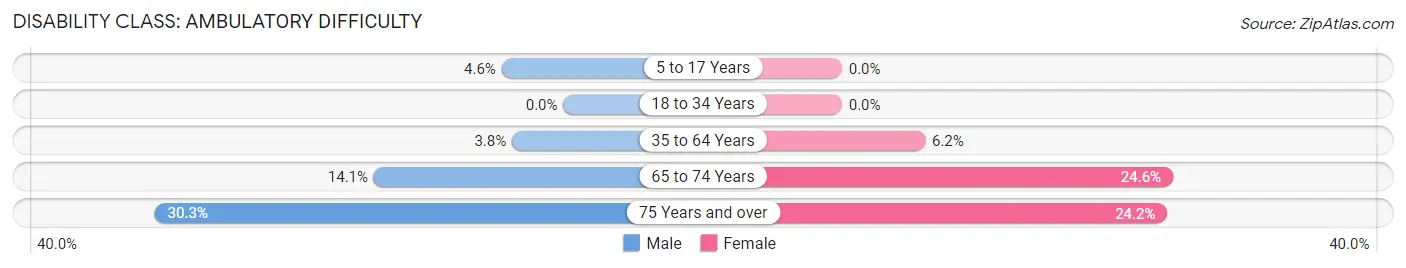
| Age Bracket | Male | Female |
| 5 to 17 Years | 32 (4.6%) | 0 (0.0%) |
| 18 to 34 Years | 0 (0.0%) | 0 (0.0%) |
| 35 to 64 Years | 65 (3.8%) | 100 (6.2%) |
| 65 to 74 Years | 76 (14.1%) | 116 (24.6%) |
| 75 Years and over | 81 (30.3%) | 86 (24.2%) |
Disability Class: Self-Care Difficulty
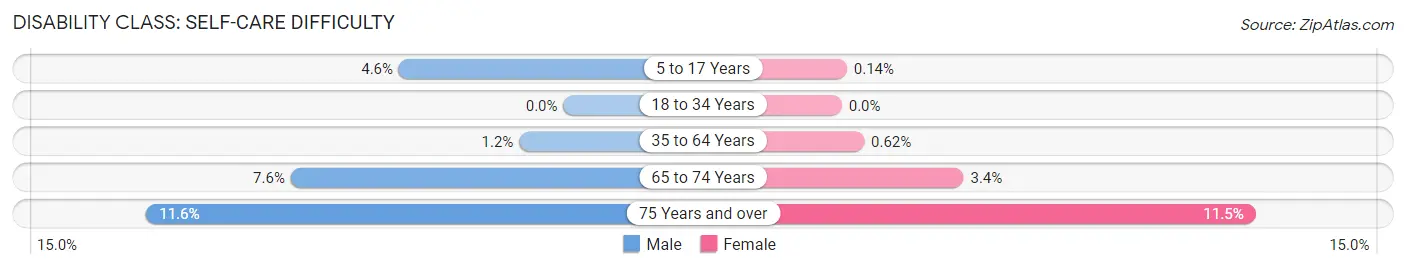
| Age Bracket | Male | Female |
| 5 to 17 Years | 32 (4.6%) | 1 (0.1%) |
| 18 to 34 Years | 0 (0.0%) | 0 (0.0%) |
| 35 to 64 Years | 21 (1.2%) | 10 (0.6%) |
| 65 to 74 Years | 41 (7.6%) | 16 (3.4%) |
| 75 Years and over | 31 (11.6%) | 41 (11.5%) |
Technology Access in Mercer County
Computing Device Access in Mercer County
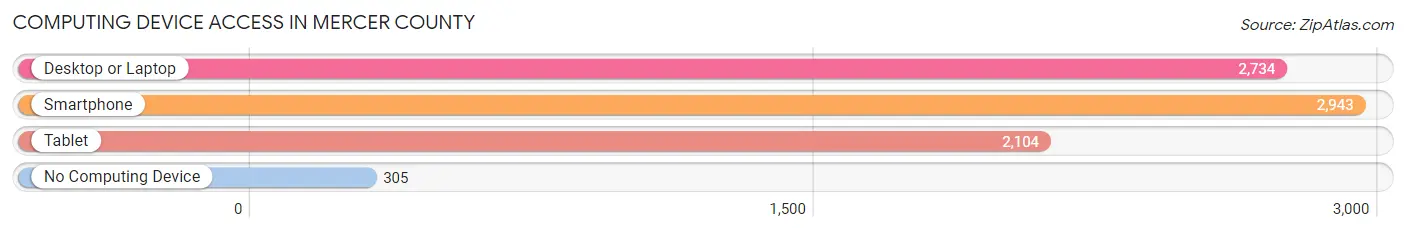
| Device Type | # Households | % Households |
| Desktop or Laptop | 2,734 | 77.3% |
| Smartphone | 2,943 | 83.2% |
| Tablet | 2,104 | 59.5% |
| No Computing Device | 305 | 8.6% |
| Total | 3,536 | 100.0% |
Internet Access in Mercer County
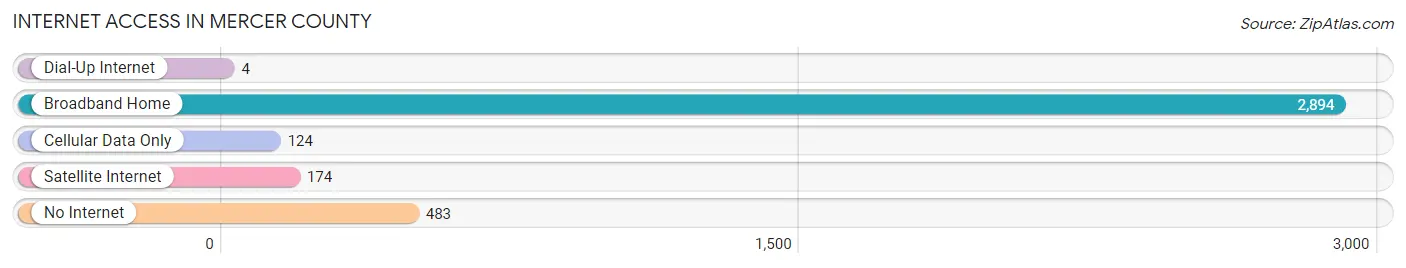
| Internet Type | # Households | % Households |
| Dial-Up Internet | 4 | 0.1% |
| Broadband Home | 2,894 | 81.8% |
| Cellular Data Only | 124 | 3.5% |
| Satellite Internet | 174 | 4.9% |
| No Internet | 483 | 13.7% |
| Total | 3,536 | 100.0% |
Mercer County Summary
Mercer County is located in the U.S. state of North Dakota. It is the fifth-most populous county in the state, with a population of 8,845 as of the 2010 census. The county seat is Stanton, and the largest city is Beulah. Mercer County is part of the Bismarck, ND Metropolitan Statistical Area.
History
Mercer County was created in 1873 from parts of Burleigh and Morton counties. It was named for William Henry Harrison Mercer, a Civil War veteran and the first sheriff of Burleigh County.
The first settlers in the area were German-Russian immigrants who arrived in the late 19th century. The county was largely agricultural, with wheat, corn, and oats being the main crops.
Geography
Mercer County is located in the north-central part of North Dakota. It is bordered by Burleigh County to the north, Morton County to the east, Oliver County to the south, and McLean County to the west.
The county has a total area of 1,072 square miles, of which 1,062 square miles is land and 10 square miles (1.0%) is water. The terrain is mostly flat, with some rolling hills in the western part of the county. The county is drained by the Knife River and its tributaries.
Economy
Agriculture is the main economic activity in Mercer County. The county is a major producer of wheat, corn, oats, and other grains. Livestock production, including cattle, sheep, and hogs, is also important.
The county is home to several large industrial facilities, including a coal-fired power plant, a fertilizer plant, and a grain elevator. The county also has a number of small businesses, including retail stores, restaurants, and service providers.
Demographics
As of the 2010 census, there were 8,845 people, 3,541 households, and 2,521 families living in Mercer County. The population density was 8.3 people per square mile. The racial makeup of the county was 97.2% White, 0.4% Native American, 0.2% Asian, 0.1% Black or African American, 0.1% Pacific Islander, 0.7% from other races, and 1.3% from two or more races. Hispanic or Latino of any race were 1.7% of the population.
The median income for a household in the county was $45,945, and the median income for a family was $54,945. The per capita income for the county was $21,945. About 8.2% of families and 10.7% of the population were below the poverty line, including 14.2% of those under age 18 and 8.2% of those age 65 or over.
Mercer County is served by the Beulah Public School District, which includes two elementary schools, one middle school, and one high school. The county is also home to the University of Mary, a private Catholic university.
Common Questions
What is the Total Population of Mercer County?
Total Population of Mercer County is 8,366.
What is the Total Male Population of Mercer County?
Total Male Population of Mercer County is 4,241.
What is the Total Female Population of Mercer County?
Total Female Population of Mercer County is 4,125.
What is the Ratio of Males per 100 Females in Mercer County?
There are 102.81 Males per 100 Females in Mercer County.
What is the Ratio of Females per 100 Males in Mercer County?
There are 97.26 Females per 100 Males in Mercer County.
What is the Median Population Age in Mercer County?
Median Population Age in Mercer County is 44.0 Years.
What is the Average Family Size in Mercer County
Average Family Size in Mercer County is 2.8 People.
What is the Average Household Size in Mercer County
Average Household Size in Mercer County is 2.3 People.
What is Per Capita Income in Mercer County?
Per Capita income in Mercer County is $39,783.
What is the Median Family Income in Mercer County?
Median Family Income in Mercer County is $105,944.
What is the Median Household income in Mercer County?
Median Household Income in Mercer County is $82,155.
What is Income or Wage Gap in Mercer County?
Income or Wage Gap in Mercer County is 55.4%.
Women in Mercer County earn 44.6 cents for every dollar earned by a man.
What is Inequality or Gini Index in Mercer County?
Inequality or Gini Index in Mercer County is 0.38.
How Large is the Labor Force in Mercer County?
There are 3,865 People in the Labor Forcein in Mercer County.
What is the Percentage of People in the Labor Force in Mercer County?
57.1% of People are in the Labor Force in Mercer County.
What is the Unemployment Rate in Mercer County?
Unemployment Rate in Mercer County is 2.7%.