McLean County, ND
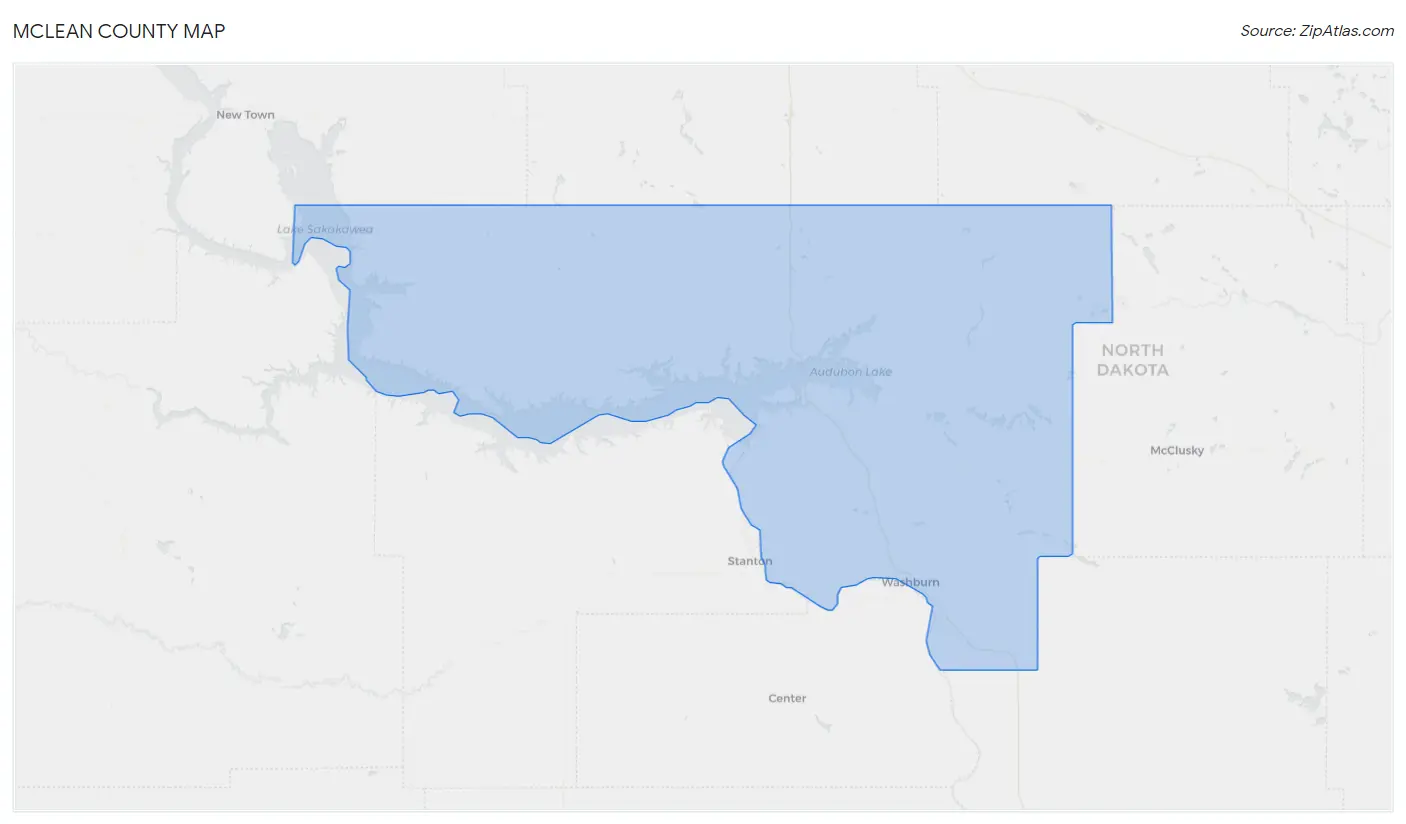
McLean County Map
McLean County Overview
9,781
TOTAL POPULATION
5,076
MALE POPULATION
4,705
FEMALE POPULATION
107.89
MALES / 100 FEMALES
92.69
FEMALES / 100 MALES
46.3
MEDIAN AGE
2.8
AVG FAMILY SIZE
2.3
AVG HOUSEHOLD SIZE
$40,448
PER CAPITA INCOME
$94,481
AVG FAMILY INCOME
$80,556
AVG HOUSEHOLD INCOME
45.9%
WAGE / INCOME GAP [ % ]
54.1¢/ $1
WAGE / INCOME GAP [ $ ]
0.38
INEQUALITY / GINI INDEX
4,556
LABOR FORCE [ PEOPLE ]
58.1%
PERCENT IN LABOR FORCE
1.4%
UNEMPLOYMENT RATE
McLean County Area Codes
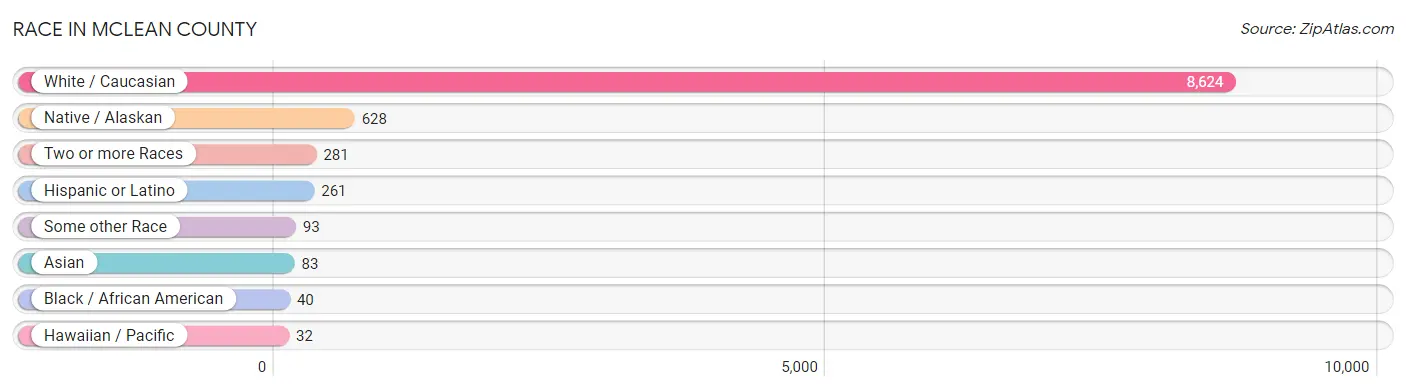
Race in McLean County
The most populous races in McLean County are White / Caucasian (8,624 | 88.2%), Native / Alaskan (628 | 6.4%), and Two or more Races (281 | 2.9%).
| Race | # Population | % Population |
| Asian | 83 | 0.9% |
| Black / African American | 40 | 0.4% |
| Hawaiian / Pacific | 32 | 0.3% |
| Hispanic or Latino | 261 | 2.7% |
| Native / Alaskan | 628 | 6.4% |
| White / Caucasian | 8,624 | 88.2% |
| Two or more Races | 281 | 2.9% |
| Some other Race | 93 | 0.9% |
| Total | 9,781 | 100.0% |
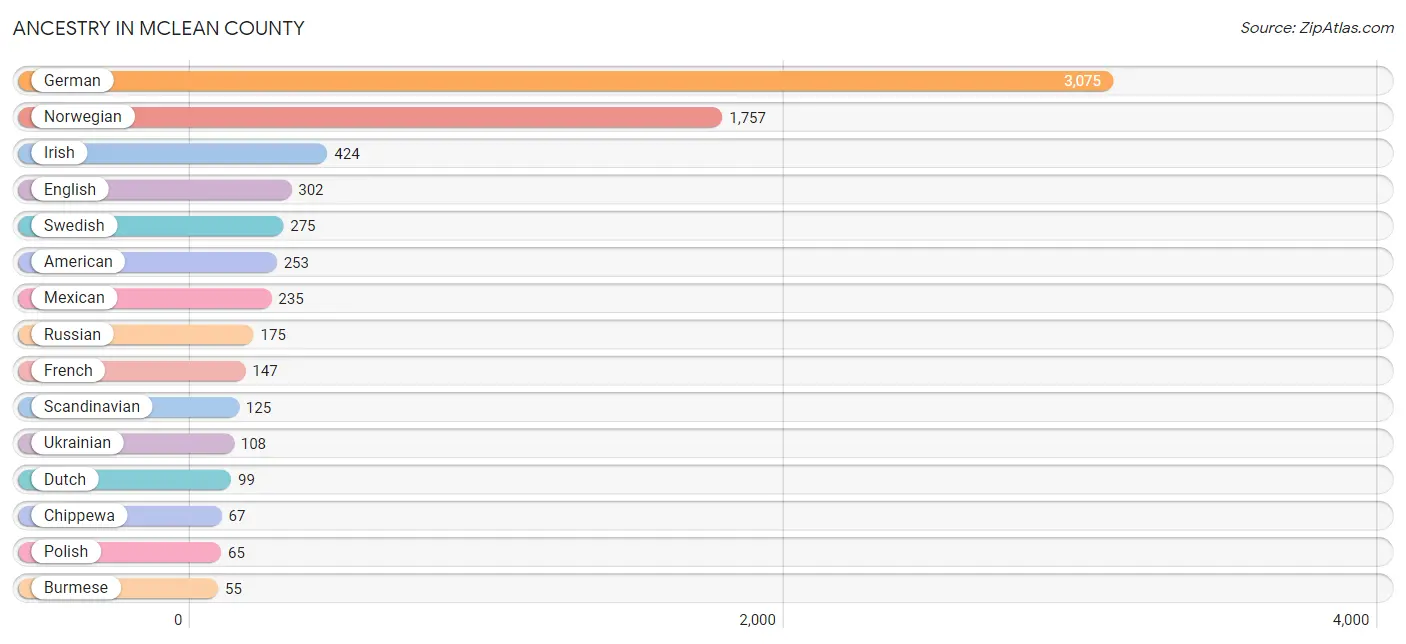
Ancestry in McLean County
The most populous ancestries reported in McLean County are German (3,075 | 31.4%), Norwegian (1,757 | 18.0%), Irish (424 | 4.3%), English (302 | 3.1%), and Swedish (275 | 2.8%), together accounting for 59.6% of all McLean County residents.
| Ancestry | # Population | % Population |
| American | 253 | 2.6% |
| Apache | 5 | 0.1% |
| Australian | 3 | 0.0% |
| Austrian | 10 | 0.1% |
| Belgian | 11 | 0.1% |
| Bhutanese | 6 | 0.1% |
| Brazilian | 23 | 0.2% |
| British | 15 | 0.2% |
| Burmese | 55 | 0.6% |
| Canadian | 9 | 0.1% |
| Celtic | 4 | 0.0% |
| Central American | 21 | 0.2% |
| Cherokee | 9 | 0.1% |
| Chippewa | 67 | 0.7% |
| Colombian | 5 | 0.1% |
| Czech | 22 | 0.2% |
| Danish | 45 | 0.5% |
| Dutch | 99 | 1.0% |
| Eastern European | 4 | 0.0% |
| English | 302 | 3.1% |
| European | 5 | 0.1% |
| Finnish | 23 | 0.2% |
| French | 147 | 1.5% |
| French Canadian | 24 | 0.3% |
| German | 3,075 | 31.4% |
| German Russian | 42 | 0.4% |
| Greek | 10 | 0.1% |
| Guatemalan | 11 | 0.1% |
| Hungarian | 25 | 0.3% |
| Icelander | 8 | 0.1% |
| Indian (Asian) | 21 | 0.2% |
| Irish | 424 | 4.3% |
| Italian | 35 | 0.4% |
| Korean | 47 | 0.5% |
| Latvian | 4 | 0.0% |
| Mexican | 235 | 2.4% |
| Mexican American Indian | 43 | 0.4% |
| Native Hawaiian | 32 | 0.3% |
| Navajo | 34 | 0.4% |
| Northern European | 3 | 0.0% |
| Norwegian | 1,757 | 18.0% |
| Panamanian | 10 | 0.1% |
| Polish | 65 | 0.7% |
| Portuguese | 21 | 0.2% |
| Romanian | 49 | 0.5% |
| Russian | 175 | 1.8% |
| Scandinavian | 125 | 1.3% |
| Scotch-Irish | 29 | 0.3% |
| Scottish | 46 | 0.5% |
| Sioux | 50 | 0.5% |
| South African | 15 | 0.2% |
| South American | 5 | 0.1% |
| Sri Lankan | 21 | 0.2% |
| Subsaharan African | 15 | 0.2% |
| Swedish | 275 | 2.8% |
| Swiss | 8 | 0.1% |
| Thai | 15 | 0.2% |
| Ukrainian | 108 | 1.1% |
| Welsh | 4 | 0.0% |
| Yugoslavian | 6 | 0.1% | View All 60 Rows |
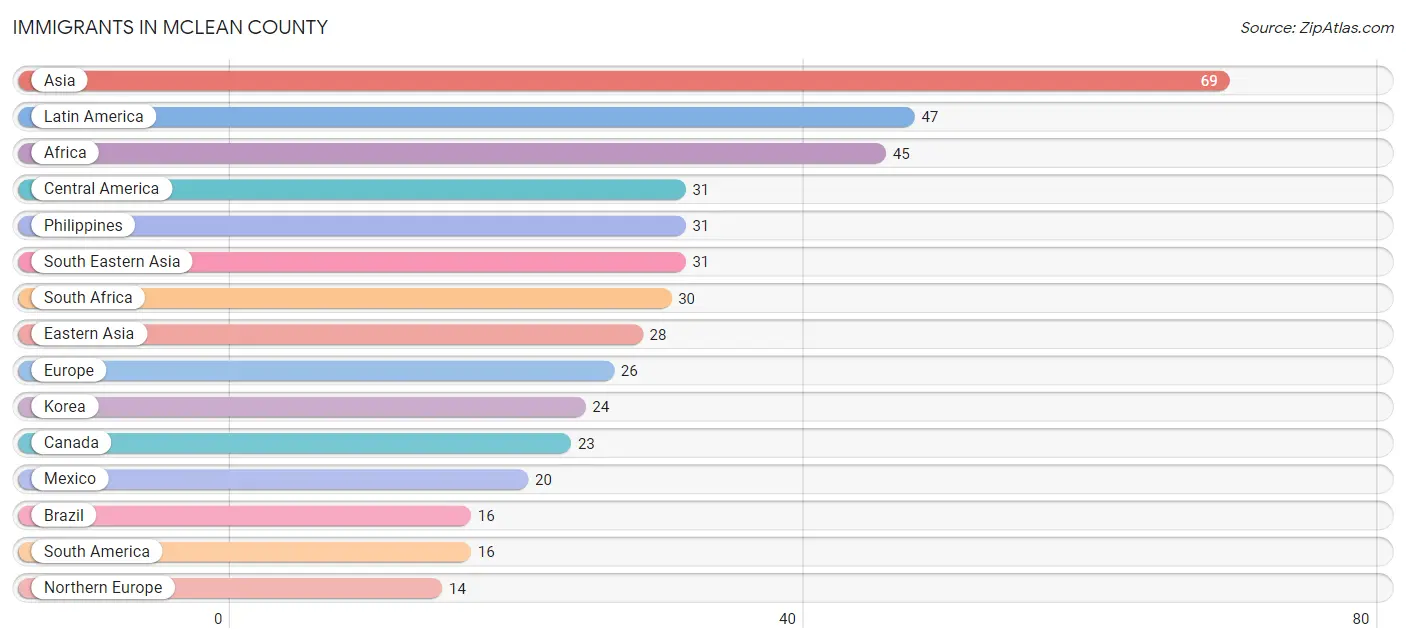
Immigrants in McLean County
The most numerous immigrant groups reported in McLean County came from Asia (69 | 0.7%), Latin America (47 | 0.5%), Africa (45 | 0.5%), Central America (31 | 0.3%), and Philippines (31 | 0.3%), together accounting for 2.3% of all McLean County residents.
| Immigration Origin | # Population | % Population |
| Africa | 45 | 0.5% |
| Asia | 69 | 0.7% |
| Brazil | 16 | 0.2% |
| Canada | 23 | 0.2% |
| Central America | 31 | 0.3% |
| Eastern Asia | 28 | 0.3% |
| Eastern Europe | 3 | 0.0% |
| England | 9 | 0.1% |
| Europe | 26 | 0.3% |
| France | 2 | 0.0% |
| Germany | 7 | 0.1% |
| Guatemala | 11 | 0.1% |
| India | 10 | 0.1% |
| Ireland | 5 | 0.1% |
| Japan | 4 | 0.0% |
| Korea | 24 | 0.3% |
| Latin America | 47 | 0.5% |
| Mexico | 20 | 0.2% |
| Northern Europe | 14 | 0.1% |
| Philippines | 31 | 0.3% |
| Romania | 3 | 0.0% |
| South Africa | 30 | 0.3% |
| South America | 16 | 0.2% |
| South Central Asia | 10 | 0.1% |
| South Eastern Asia | 31 | 0.3% |
| Western Europe | 9 | 0.1% | View All 26 Rows |
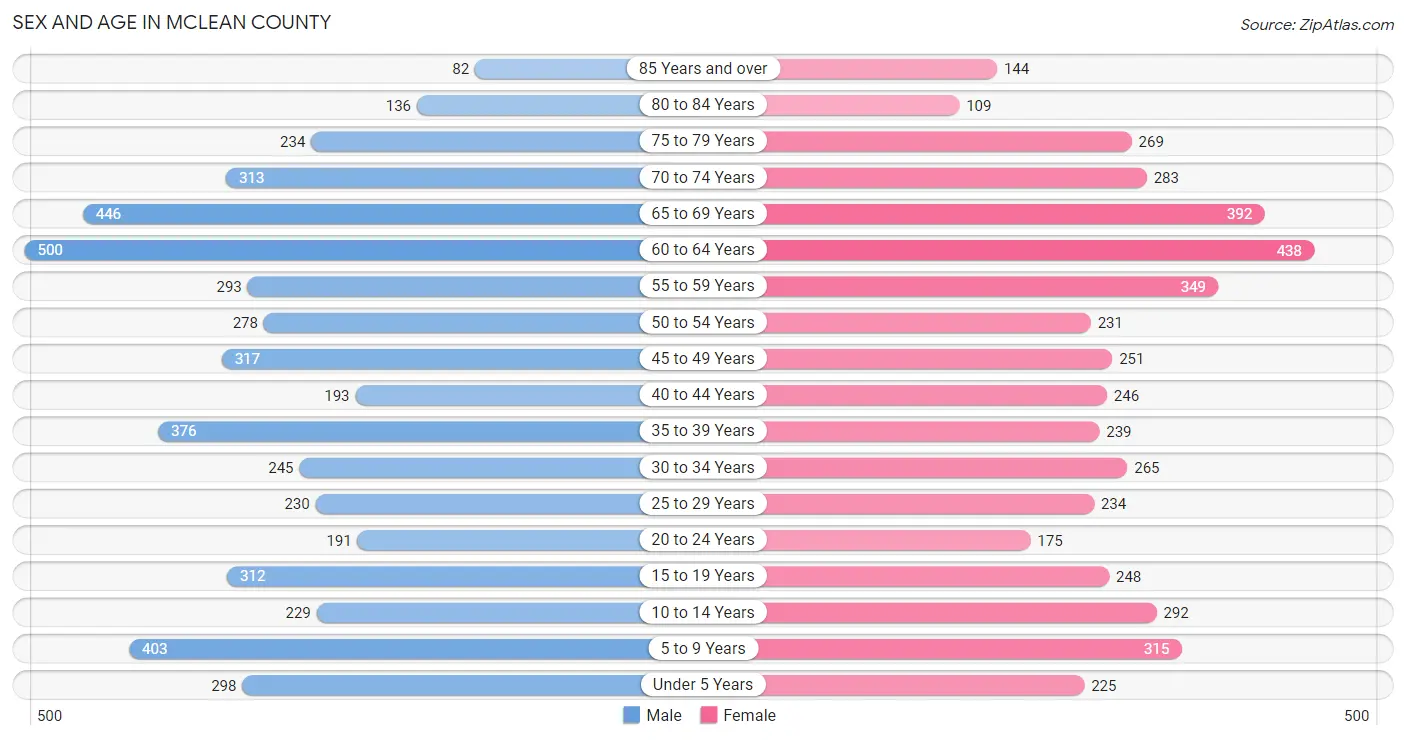
Sex and Age in McLean County
Sex and Age in McLean County
The most populous age groups in McLean County are 60 to 64 Years (500 | 9.9%) for men and 60 to 64 Years (438 | 9.3%) for women.
| Age Bracket | Male | Female |
| Under 5 Years | 298 (5.9%) | 225 (4.8%) |
| 5 to 9 Years | 403 (7.9%) | 315 (6.7%) |
| 10 to 14 Years | 229 (4.5%) | 292 (6.2%) |
| 15 to 19 Years | 312 (6.1%) | 248 (5.3%) |
| 20 to 24 Years | 191 (3.8%) | 175 (3.7%) |
| 25 to 29 Years | 230 (4.5%) | 234 (5.0%) |
| 30 to 34 Years | 245 (4.8%) | 265 (5.6%) |
| 35 to 39 Years | 376 (7.4%) | 239 (5.1%) |
| 40 to 44 Years | 193 (3.8%) | 246 (5.2%) |
| 45 to 49 Years | 317 (6.2%) | 251 (5.3%) |
| 50 to 54 Years | 278 (5.5%) | 231 (4.9%) |
| 55 to 59 Years | 293 (5.8%) | 349 (7.4%) |
| 60 to 64 Years | 500 (9.9%) | 438 (9.3%) |
| 65 to 69 Years | 446 (8.8%) | 392 (8.3%) |
| 70 to 74 Years | 313 (6.2%) | 283 (6.0%) |
| 75 to 79 Years | 234 (4.6%) | 269 (5.7%) |
| 80 to 84 Years | 136 (2.7%) | 109 (2.3%) |
| 85 Years and over | 82 (1.6%) | 144 (3.1%) |
| Total | 5,076 (100.0%) | 4,705 (100.0%) |
Families and Households in McLean County
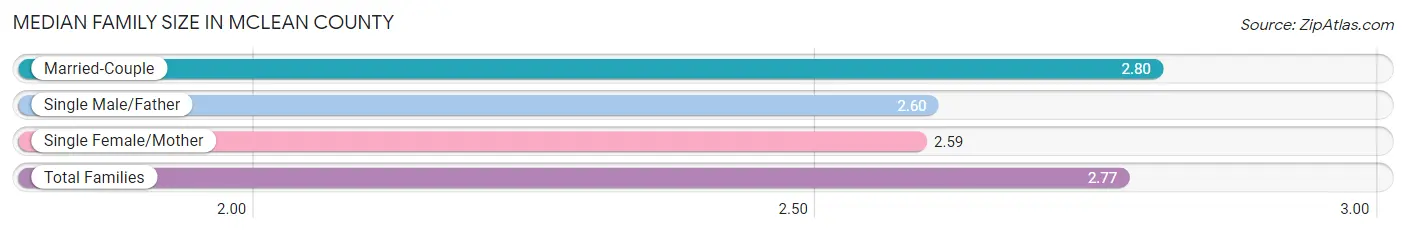
Median Family Size in McLean County
The median family size in McLean County is 2.77 persons per family, with married-couple families (2,457 | 84.3%) accounting for the largest median family size of 2.8 persons per family. On the other hand, single female/mother families (246 | 8.4%) represent the smallest median family size with 2.59 persons per family.
| Family Type | # Families | Family Size |
| Married-Couple | 2,457 (84.3%) | 2.80 |
| Single Male/Father | 212 (7.3%) | 2.60 |
| Single Female/Mother | 246 (8.4%) | 2.59 |
| Total Families | 2,915 (100.0%) | 2.77 |
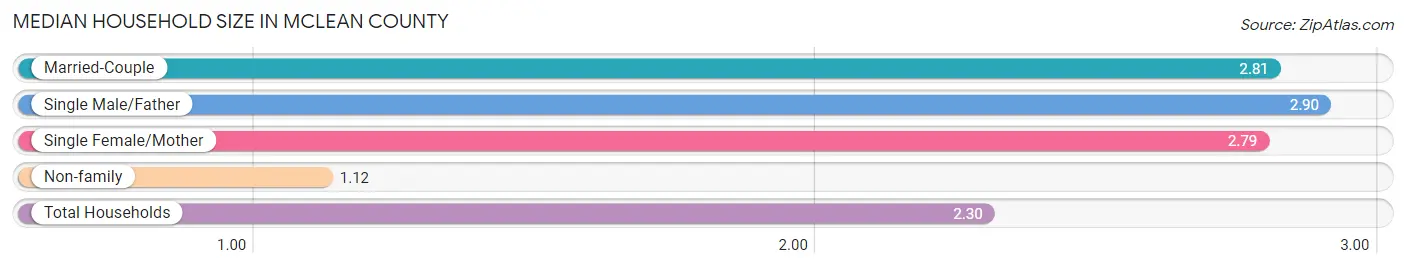
Median Household Size in McLean County
The median household size in McLean County is 2.30 persons per household, with single male/father households (212 | 5.1%) accounting for the largest median household size of 2.9 persons per household. non-family households (1,261 | 30.2%) represent the smallest median household size with 1.12 persons per household.
| Household Type | # Households | Household Size |
| Married-Couple | 2,457 (58.8%) | 2.81 |
| Single Male/Father | 212 (5.1%) | 2.90 |
| Single Female/Mother | 246 (5.9%) | 2.79 |
| Non-family | 1,261 (30.2%) | 1.12 |
| Total Households | 4,176 (100.0%) | 2.30 |
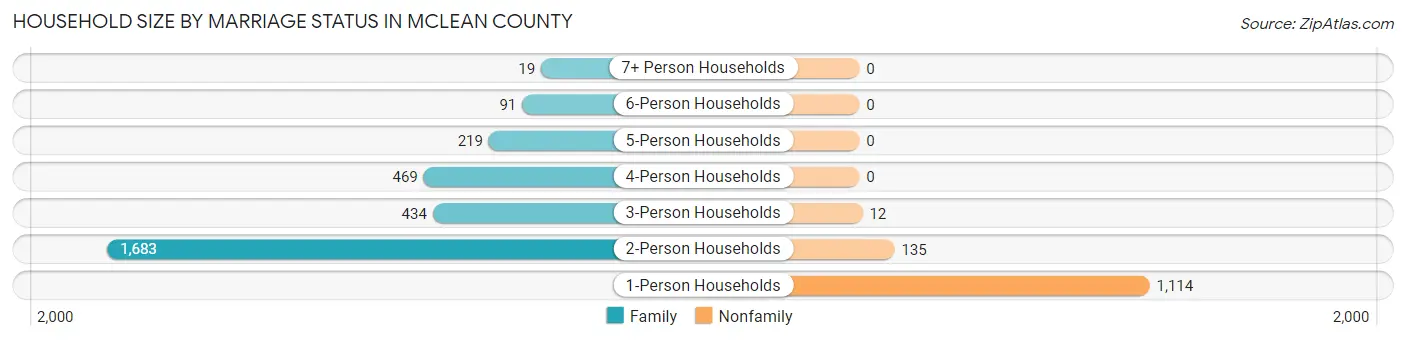
Household Size by Marriage Status in McLean County
Out of a total of 4,176 households in McLean County, 2,915 (69.8%) are family households, while 1,261 (30.2%) are nonfamily households. The most numerous type of family households are 2-person households, comprising 1,683, and the most common type of nonfamily households are 1-person households, comprising 1,114.
| Household Size | Family Households | Nonfamily Households |
| 1-Person Households | - | 1,114 (26.7%) |
| 2-Person Households | 1,683 (40.3%) | 135 (3.2%) |
| 3-Person Households | 434 (10.4%) | 12 (0.3%) |
| 4-Person Households | 469 (11.2%) | 0 (0.0%) |
| 5-Person Households | 219 (5.2%) | 0 (0.0%) |
| 6-Person Households | 91 (2.2%) | 0 (0.0%) |
| 7+ Person Households | 19 (0.4%) | 0 (0.0%) |
| Total | 2,915 (69.8%) | 1,261 (30.2%) |
Female Fertility in McLean County
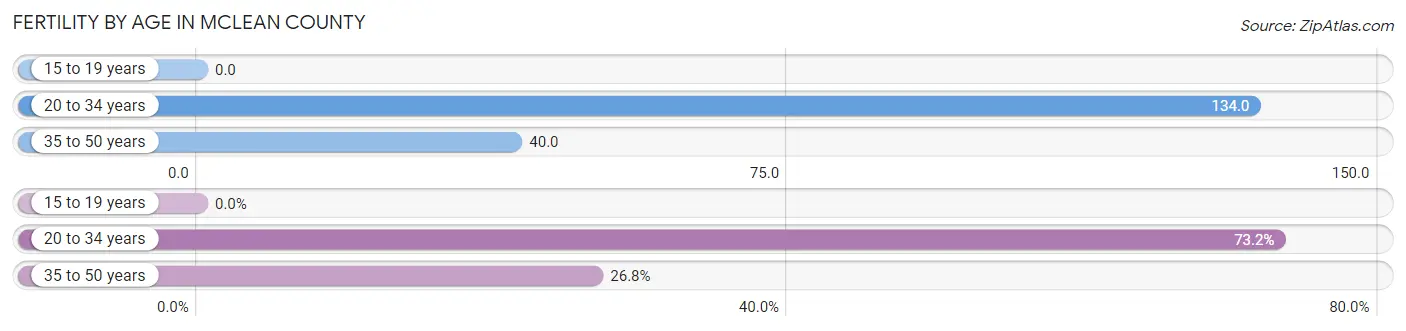
Fertility by Age in McLean County
Average fertility rate in McLean County is 71.0 births per 1,000 women. Women in the age bracket of 20 to 34 years have the highest fertility rate with 134.0 births per 1,000 women. Women in the age bracket of 20 to 34 years acount for 73.2% of all women with births.
| Age Bracket | Women with Births | Births / 1,000 Women |
| 15 to 19 years | 0 (0.0%) | 0.0 |
| 20 to 34 years | 90 (73.2%) | 134.0 |
| 35 to 50 years | 33 (26.8%) | 40.0 |
| Total | 123 (100.0%) | 71.0 |
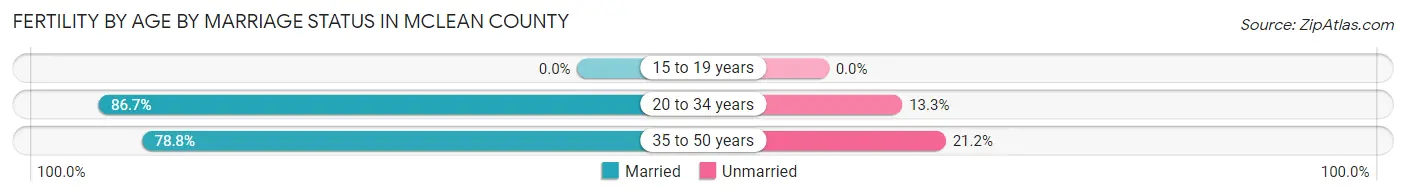
Fertility by Age by Marriage Status in McLean County
84.6% of women with births (123) in McLean County are married. The highest percentage of unmarried women with births falls into 35 to 50 years age bracket with 21.2% of them unmarried at the time of birth, while the lowest percentage of unmarried women with births belong to 20 to 34 years age bracket with 13.3% of them unmarried.
| Age Bracket | Married | Unmarried |
| 15 to 19 years | 0 (0.0%) | 0 (0.0%) |
| 20 to 34 years | 78 (86.7%) | 12 (13.3%) |
| 35 to 50 years | 26 (78.8%) | 7 (21.2%) |
| Total | 104 (84.6%) | 19 (15.4%) |
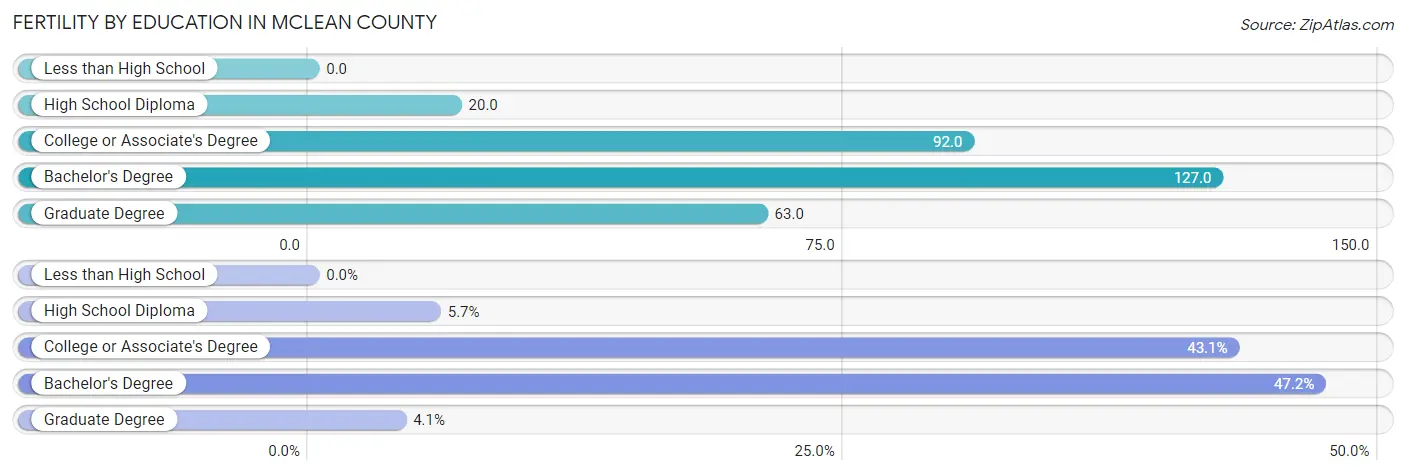
Fertility by Education in McLean County
| Educational Attainment | Women with Births | Births / 1,000 Women |
| Less than High School | 0 (0.0%) | 0.0 |
| High School Diploma | 7 (5.7%) | 20.0 |
| College or Associate's Degree | 53 (43.1%) | 92.0 |
| Bachelor's Degree | 58 (47.1%) | 127.0 |
| Graduate Degree | 5 (4.1%) | 63.0 |
| Total | 123 (100.0%) | 71.0 |
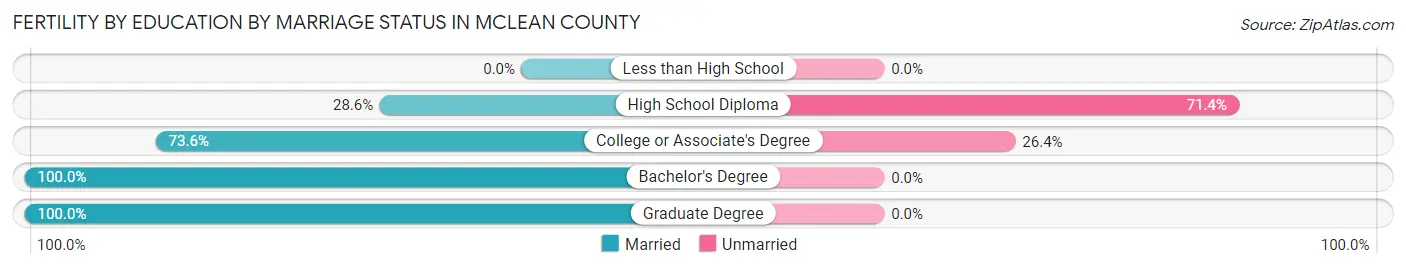
Fertility by Education by Marriage Status in McLean County
15.4% of women with births in McLean County are unmarried. Women with the educational attainment of bachelor's degree are most likely to be married with 100.0% of them married at childbirth, while women with the educational attainment of high school diploma are least likely to be married with 71.4% of them unmarried at childbirth.
| Educational Attainment | Married | Unmarried |
| Less than High School | 0 (0.0%) | 0 (0.0%) |
| High School Diploma | 2 (28.6%) | 5 (71.4%) |
| College or Associate's Degree | 39 (73.6%) | 14 (26.4%) |
| Bachelor's Degree | 58 (100.0%) | 0 (0.0%) |
| Graduate Degree | 5 (100.0%) | 0 (0.0%) |
| Total | 104 (84.6%) | 19 (15.4%) |
Income in McLean County
Income Overview in McLean County
Per Capita Income in McLean County is $40,448, while median incomes of families and households are $94,481 and $80,556 respectively.
| Characteristic | Number | Measure |
| Per Capita Income | 9,781 | $40,448 |
| Median Family Income | 2,915 | $94,481 |
| Mean Family Income | 2,915 | $108,012 |
| Median Household Income | 4,176 | $80,556 |
| Mean Household Income | 4,176 | $93,556 |
| Income Deficit | 2,915 | $0 |
| Wage / Income Gap (%) | 9,781 | 45.88% |
| Wage / Income Gap ($) | 9,781 | 54.12¢ per $1 |
| Gini / Inequality Index | 9,781 | 0.38 |
Earnings by Sex in McLean County
Average Earnings in McLean County are $45,150, $61,908 for men and $33,504 for women, a difference of 45.9%.
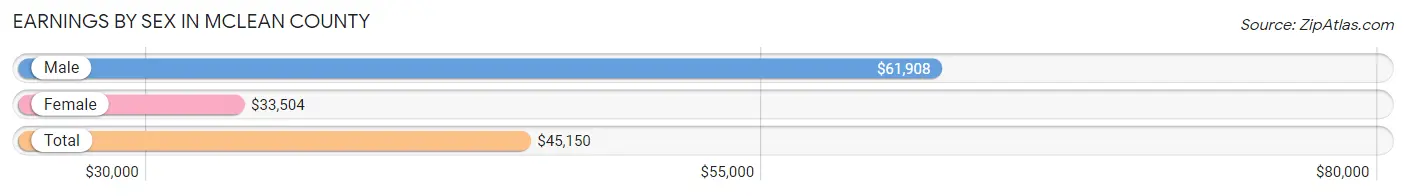
| Sex | Number | Average Earnings |
| Male | 2,810 (55.7%) | $61,908 |
| Female | 2,233 (44.3%) | $33,504 |
| Total | 5,043 (100.0%) | $45,150 |
Earnings by Sex by Income Bracket in McLean County
The most common earnings brackets in McLean County are $100,000+ for men (738 | 26.3%) and $55,000 to $64,999 for women (216 | 9.7%).
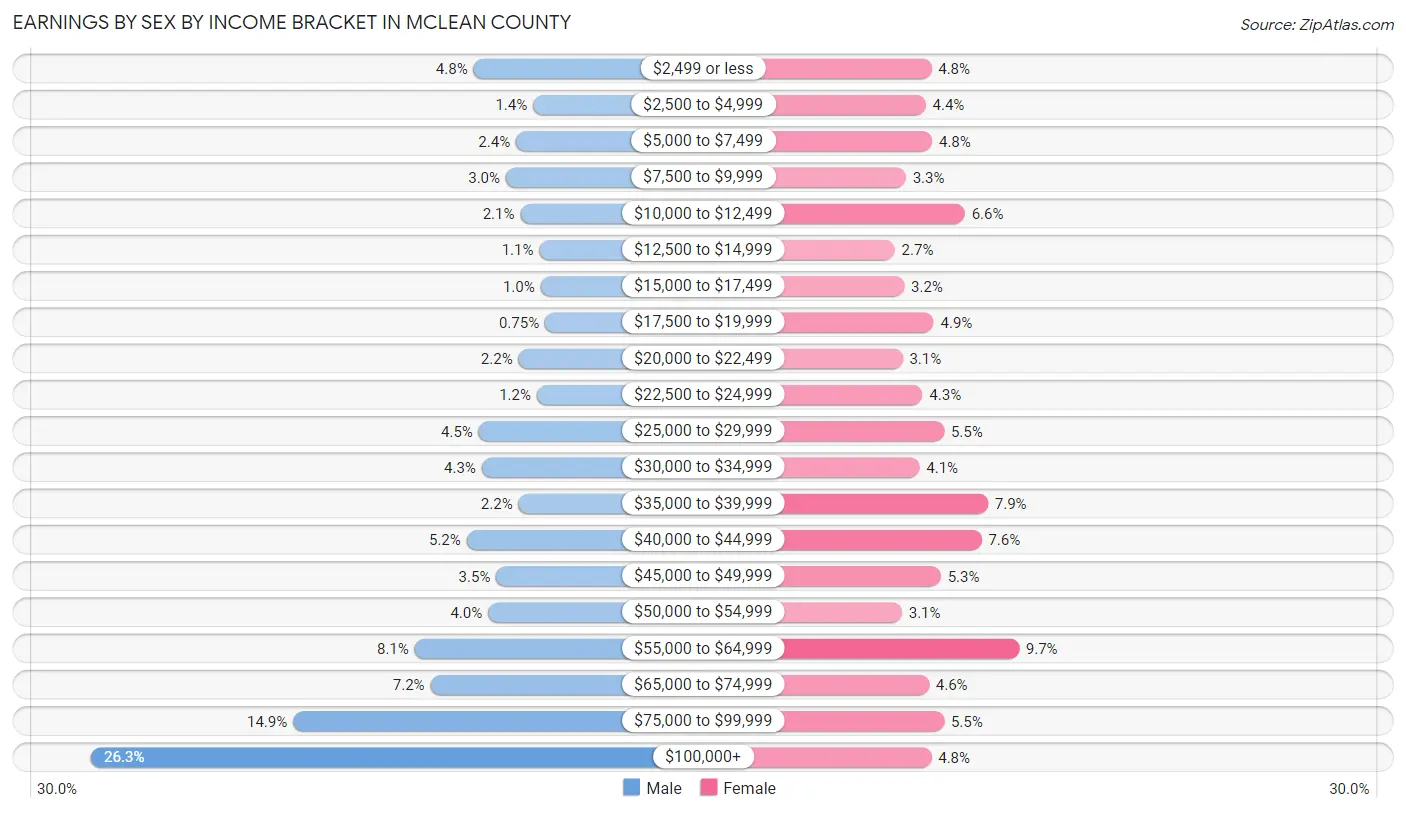
| Income | Male | Female |
| $2,499 or less | 134 (4.8%) | 106 (4.8%) |
| $2,500 to $4,999 | 40 (1.4%) | 99 (4.4%) |
| $5,000 to $7,499 | 67 (2.4%) | 107 (4.8%) |
| $7,500 to $9,999 | 83 (2.9%) | 74 (3.3%) |
| $10,000 to $12,499 | 60 (2.1%) | 148 (6.6%) |
| $12,500 to $14,999 | 30 (1.1%) | 60 (2.7%) |
| $15,000 to $17,499 | 28 (1.0%) | 72 (3.2%) |
| $17,500 to $19,999 | 21 (0.7%) | 109 (4.9%) |
| $20,000 to $22,499 | 63 (2.2%) | 70 (3.1%) |
| $22,500 to $24,999 | 34 (1.2%) | 95 (4.3%) |
| $25,000 to $29,999 | 126 (4.5%) | 122 (5.5%) |
| $30,000 to $34,999 | 121 (4.3%) | 91 (4.1%) |
| $35,000 to $39,999 | 63 (2.2%) | 177 (7.9%) |
| $40,000 to $44,999 | 145 (5.2%) | 169 (7.6%) |
| $45,000 to $49,999 | 98 (3.5%) | 118 (5.3%) |
| $50,000 to $54,999 | 111 (4.0%) | 69 (3.1%) |
| $55,000 to $64,999 | 227 (8.1%) | 216 (9.7%) |
| $65,000 to $74,999 | 202 (7.2%) | 103 (4.6%) |
| $75,000 to $99,999 | 419 (14.9%) | 122 (5.5%) |
| $100,000+ | 738 (26.3%) | 106 (4.8%) |
| Total | 2,810 (100.0%) | 2,233 (100.0%) |
Earnings by Sex by Educational Attainment in McLean County
Average earnings in McLean County are $67,817 for men and $36,328 for women, a difference of 46.4%. Men with an educational attainment of college or associate's degree enjoy the highest average annual earnings of $72,321, while those with less than high school education earn the least with $38,523. Women with an educational attainment of graduate degree earn the most with the average annual earnings of $54,167, while those with less than high school education have the smallest earnings of $18,333.
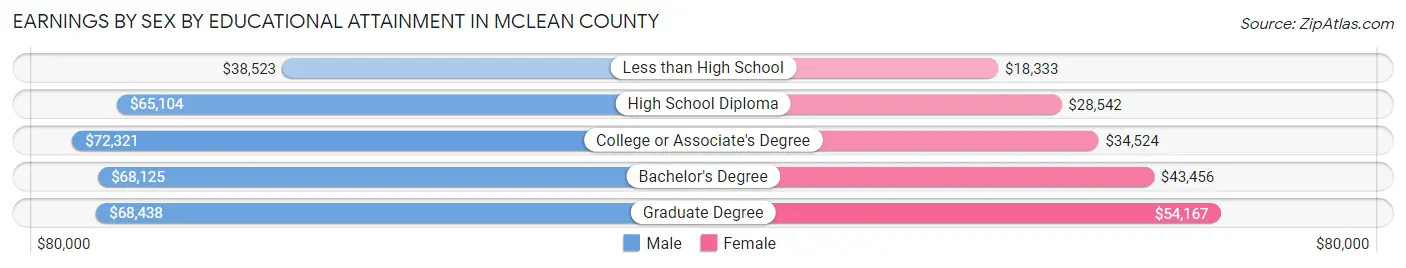
| Educational Attainment | Male Income | Female Income |
| Less than High School | $38,523 | $18,333 |
| High School Diploma | $65,104 | $28,542 |
| College or Associate's Degree | $72,321 | $34,524 |
| Bachelor's Degree | $68,125 | $43,456 |
| Graduate Degree | $68,438 | $54,167 |
| Total | $67,817 | $36,328 |
Family Income in McLean County
Family Income Brackets in McLean County
According to the McLean County family income data, there are 758 families falling into the $100,000 to $149,999 income range, which is the most common income bracket and makes up 26.0% of all families. Conversely, the less than $10,000 income bracket is the least frequent group with only 26 families (0.9%) belonging to this category.
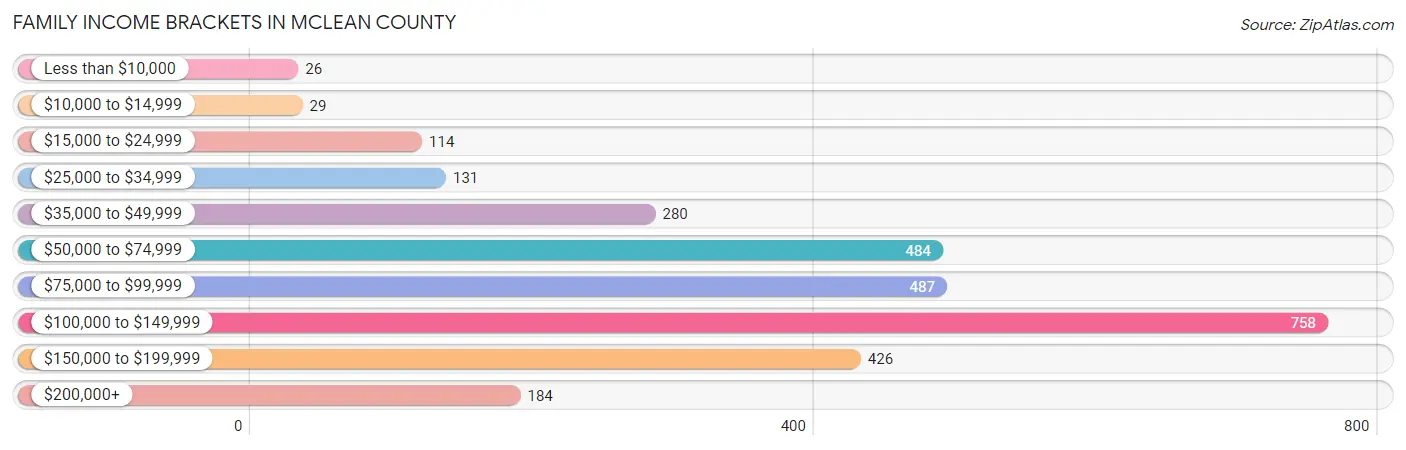
| Income Bracket | # Families | % Families |
| Less than $10,000 | 26 | 0.9% |
| $10,000 to $14,999 | 29 | 1.0% |
| $15,000 to $24,999 | 114 | 3.9% |
| $25,000 to $34,999 | 131 | 4.5% |
| $35,000 to $49,999 | 280 | 9.6% |
| $50,000 to $74,999 | 484 | 16.6% |
| $75,000 to $99,999 | 487 | 16.7% |
| $100,000 to $149,999 | 758 | 26.0% |
| $150,000 to $199,999 | 426 | 14.6% |
| $200,000+ | 184 | 6.3% |
Family Income by Famaliy Size in McLean County
4-person families (387 | 13.3%) account for the highest median family income in McLean County with $124,554 per family, while 2-person families (1,720 | 59.0%) have the highest median income of $41,062 per family member.
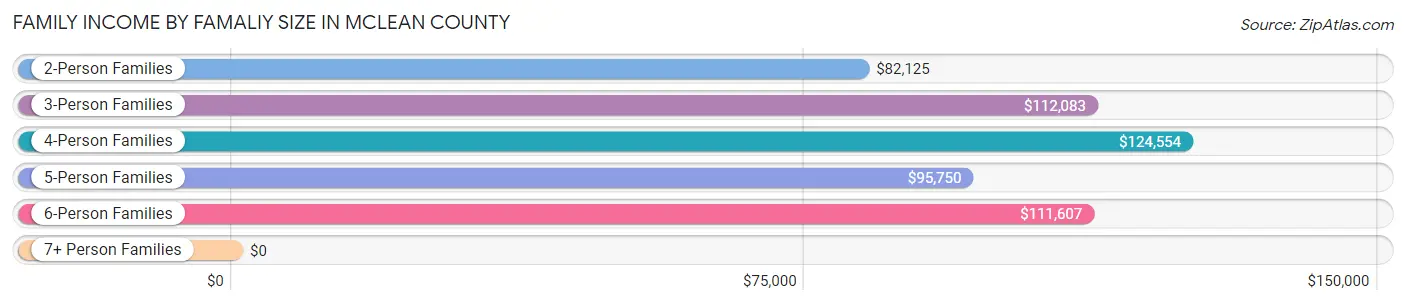
| Income Bracket | # Families | Median Income |
| 2-Person Families | 1,720 (59.0%) | $82,125 |
| 3-Person Families | 488 (16.7%) | $112,083 |
| 4-Person Families | 387 (13.3%) | $124,554 |
| 5-Person Families | 215 (7.4%) | $95,750 |
| 6-Person Families | 87 (3.0%) | $111,607 |
| 7+ Person Families | 18 (0.6%) | $0 |
| Total | 2,915 (100.0%) | $94,481 |
Family Income by Number of Earners in McLean County
The median family income in McLean County is $94,481, with families comprising 2 earners (1,212) having the highest median family income of $130,455, while families with no earners (590) have the lowest median family income of $63,387, accounting for 41.6% and 20.2% of families, respectively.
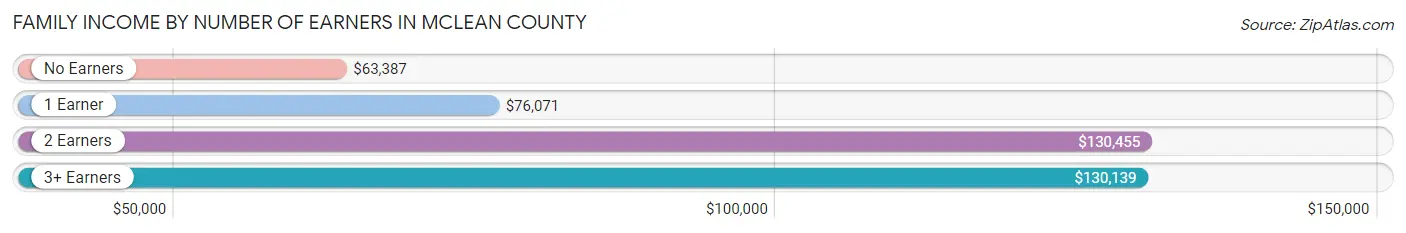
| Number of Earners | # Families | Median Income |
| No Earners | 590 (20.2%) | $63,387 |
| 1 Earner | 900 (30.9%) | $76,071 |
| 2 Earners | 1,212 (41.6%) | $130,455 |
| 3+ Earners | 213 (7.3%) | $130,139 |
| Total | 2,915 (100.0%) | $94,481 |
Household Income in McLean County
Household Income Brackets in McLean County
With 877 households falling in the category, the $100,000 to $149,999 income range is the most frequent in McLean County, accounting for 21.0% of all households. In contrast, only 79 households (1.9%) fall into the $10,000 to $14,999 income bracket, making it the least populous group.
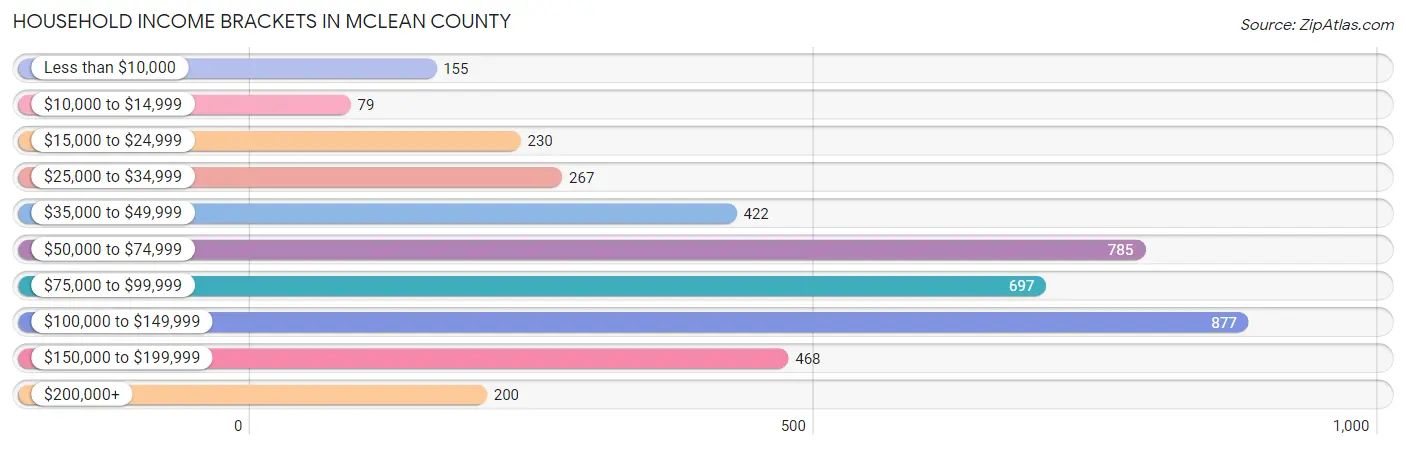
| Income Bracket | # Households | % Households |
| Less than $10,000 | 155 | 3.7% |
| $10,000 to $14,999 | 79 | 1.9% |
| $15,000 to $24,999 | 230 | 5.5% |
| $25,000 to $34,999 | 267 | 6.4% |
| $35,000 to $49,999 | 422 | 10.1% |
| $50,000 to $74,999 | 785 | 18.8% |
| $75,000 to $99,999 | 697 | 16.7% |
| $100,000 to $149,999 | 877 | 21.0% |
| $150,000 to $199,999 | 468 | 11.2% |
| $200,000+ | 200 | 4.8% |
Household Income by Householder Age in McLean County
The median household income in McLean County is $80,556, with the highest median household income of $102,411 found in the 25 to 44 years age bracket for the primary householder. A total of 1,033 households (24.7%) fall into this category. Meanwhile, the 65+ years age bracket for the primary householder has the lowest median household income of $63,667, with 1,410 households (33.8%) in this group.
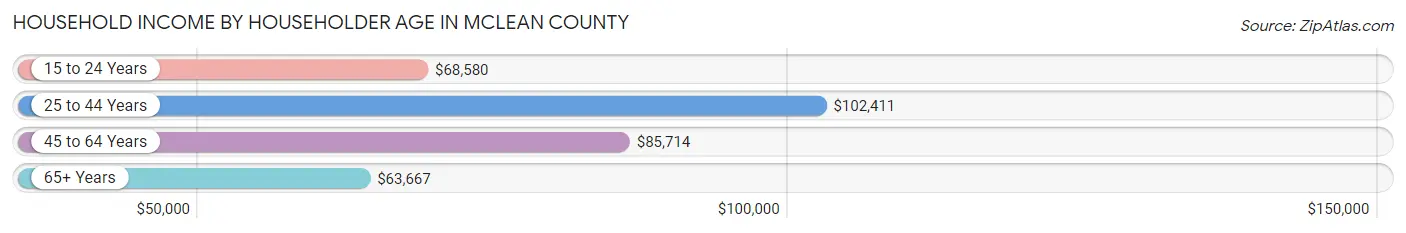
| Income Bracket | # Households | Median Income |
| 15 to 24 Years | 161 (3.9%) | $68,580 |
| 25 to 44 Years | 1,033 (24.7%) | $102,411 |
| 45 to 64 Years | 1,572 (37.6%) | $85,714 |
| 65+ Years | 1,410 (33.8%) | $63,667 |
| Total | 4,176 (100.0%) | $80,556 |
Poverty in McLean County
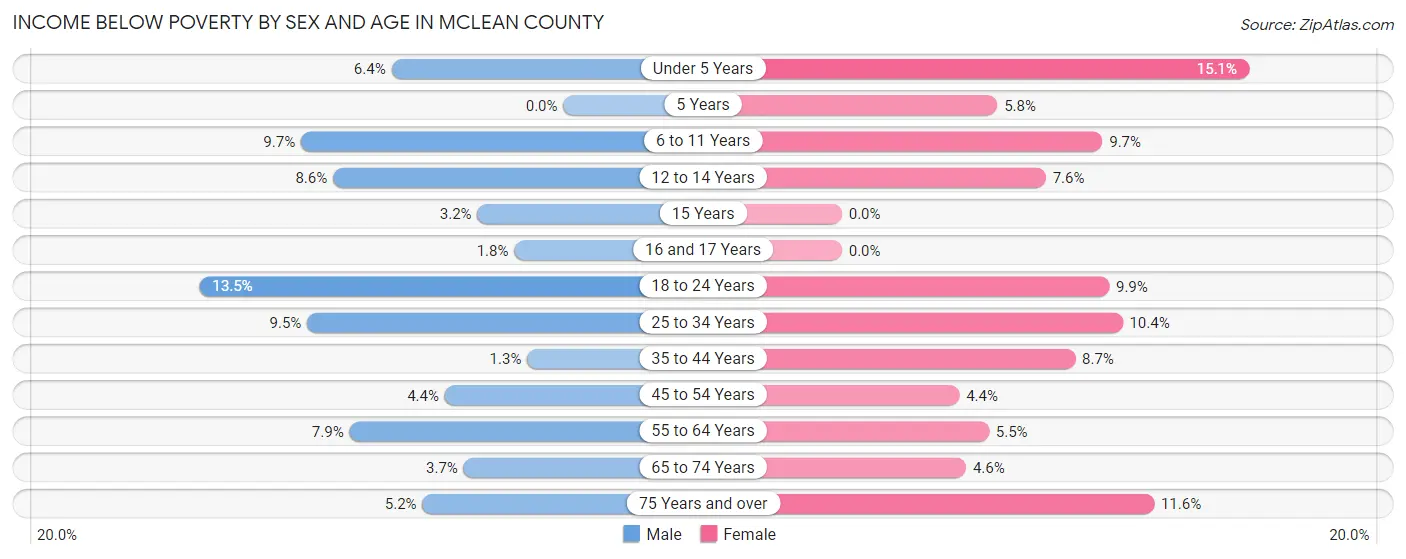
Income Below Poverty by Sex and Age in McLean County
With 6.1% poverty level for males and 7.6% for females among the residents of McLean County, 18 to 24 year old males and under 5 year old females are the most vulnerable to poverty, with 40 males (13.5%) and 34 females (15.1%) in their respective age groups living below the poverty level.
| Age Bracket | Male | Female |
| Under 5 Years | 19 (6.4%) | 34 (15.1%) |
| 5 Years | 0 (0.0%) | 3 (5.8%) |
| 6 to 11 Years | 38 (9.7%) | 35 (9.7%) |
| 12 to 14 Years | 13 (8.6%) | 14 (7.6%) |
| 15 Years | 3 (3.2%) | 0 (0.0%) |
| 16 and 17 Years | 2 (1.8%) | 0 (0.0%) |
| 18 to 24 Years | 40 (13.5%) | 25 (9.9%) |
| 25 to 34 Years | 45 (9.5%) | 52 (10.4%) |
| 35 to 44 Years | 7 (1.3%) | 42 (8.7%) |
| 45 to 54 Years | 26 (4.4%) | 21 (4.4%) |
| 55 to 64 Years | 63 (7.9%) | 43 (5.5%) |
| 65 to 74 Years | 28 (3.7%) | 31 (4.6%) |
| 75 Years and over | 23 (5.2%) | 54 (11.6%) |
| Total | 307 (6.1%) | 354 (7.6%) |
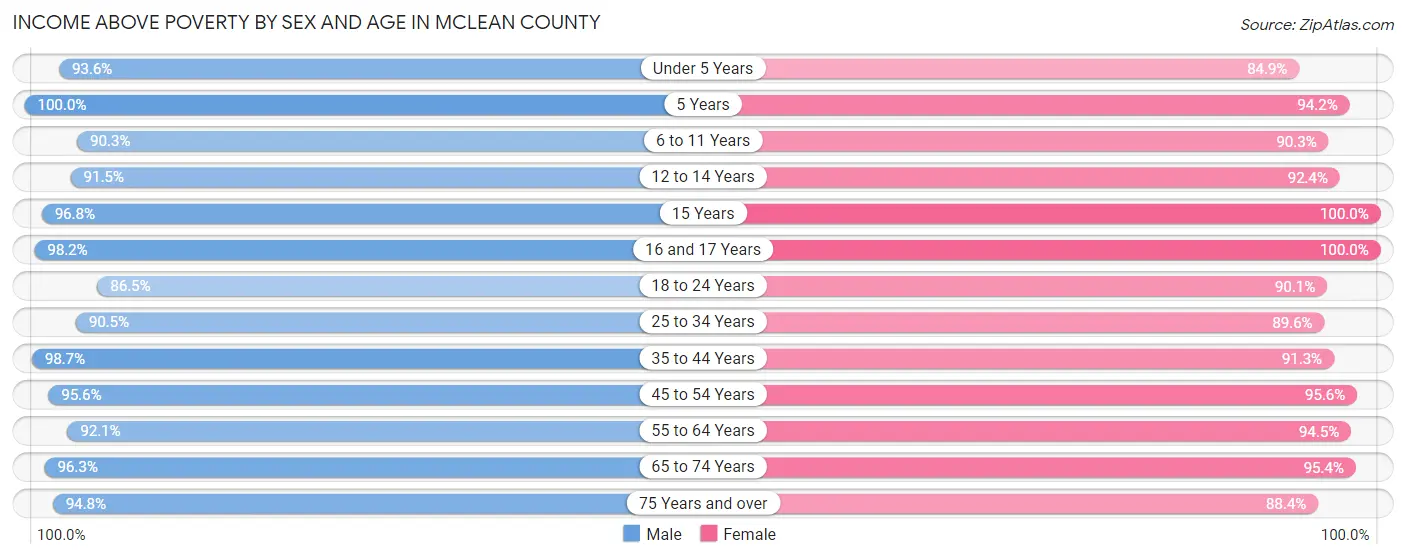
Income Above Poverty by Sex and Age in McLean County
According to the poverty statistics in McLean County, males aged 5 years and females aged 15 years are the age groups that are most secure financially, with 100.0% of males and 100.0% of females in these age groups living above the poverty line.
| Age Bracket | Male | Female |
| Under 5 Years | 279 (93.6%) | 191 (84.9%) |
| 5 Years | 86 (100.0%) | 49 (94.2%) |
| 6 to 11 Years | 352 (90.3%) | 327 (90.3%) |
| 12 to 14 Years | 139 (91.4%) | 171 (92.4%) |
| 15 Years | 91 (96.8%) | 83 (100.0%) |
| 16 and 17 Years | 108 (98.2%) | 88 (100.0%) |
| 18 to 24 Years | 256 (86.5%) | 227 (90.1%) |
| 25 to 34 Years | 428 (90.5%) | 447 (89.6%) |
| 35 to 44 Years | 516 (98.7%) | 443 (91.3%) |
| 45 to 54 Years | 565 (95.6%) | 461 (95.6%) |
| 55 to 64 Years | 730 (92.1%) | 744 (94.5%) |
| 65 to 74 Years | 729 (96.3%) | 642 (95.4%) |
| 75 Years and over | 417 (94.8%) | 412 (88.4%) |
| Total | 4,696 (93.9%) | 4,285 (92.4%) |
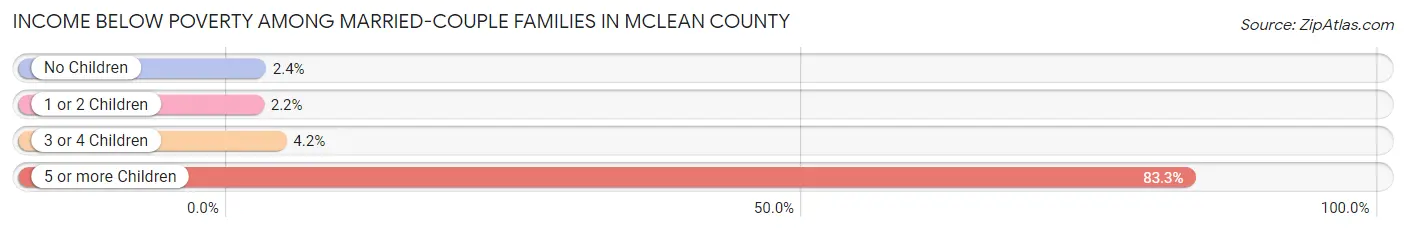
Income Below Poverty Among Married-Couple Families in McLean County
The poverty statistics for married-couple families in McLean County show that 2.7% or 67 of the total 2,457 families live below the poverty line. Families with 5 or more children have the highest poverty rate of 83.3%, comprising of 5 families. On the other hand, families with 1 or 2 children have the lowest poverty rate of 2.2%, which includes 13 families.
| Children | Above Poverty | Below Poverty |
| No Children | 1,616 (97.6%) | 40 (2.4%) |
| 1 or 2 Children | 568 (97.8%) | 13 (2.2%) |
| 3 or 4 Children | 205 (95.8%) | 9 (4.2%) |
| 5 or more Children | 1 (16.7%) | 5 (83.3%) |
| Total | 2,390 (97.3%) | 67 (2.7%) |
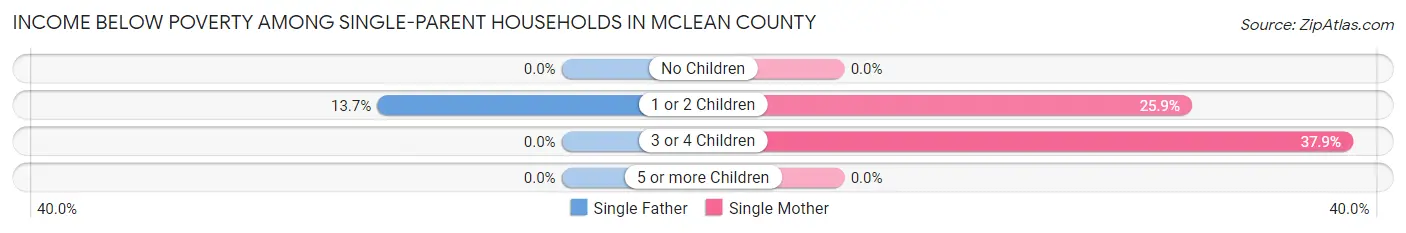
Income Below Poverty Among Single-Parent Households in McLean County
According to the poverty data in McLean County, 8.5% or 18 single-father households and 18.7% or 46 single-mother households are living below the poverty line. Among single-father households, those with 1 or 2 children have the highest poverty rate, with 18 households (13.7%) experiencing poverty. Likewise, among single-mother households, those with 3 or 4 children have the highest poverty rate, with 11 households (37.9%) falling below the poverty line.
| Children | Single Father | Single Mother |
| No Children | 0 (0.0%) | 0 (0.0%) |
| 1 or 2 Children | 18 (13.7%) | 35 (25.9%) |
| 3 or 4 Children | 0 (0.0%) | 11 (37.9%) |
| 5 or more Children | 0 (0.0%) | 0 (0.0%) |
| Total | 18 (8.5%) | 46 (18.7%) |
Income Below Poverty Among Married-Couple vs Single-Parent Households in McLean County
The poverty data for McLean County shows that 67 of the married-couple family households (2.7%) and 64 of the single-parent households (14.0%) are living below the poverty level. Within the married-couple family households, those with 5 or more children have the highest poverty rate, with 5 households (83.3%) falling below the poverty line. Among the single-parent households, those with 1 or 2 children have the highest poverty rate, with 53 household (19.9%) living below poverty.
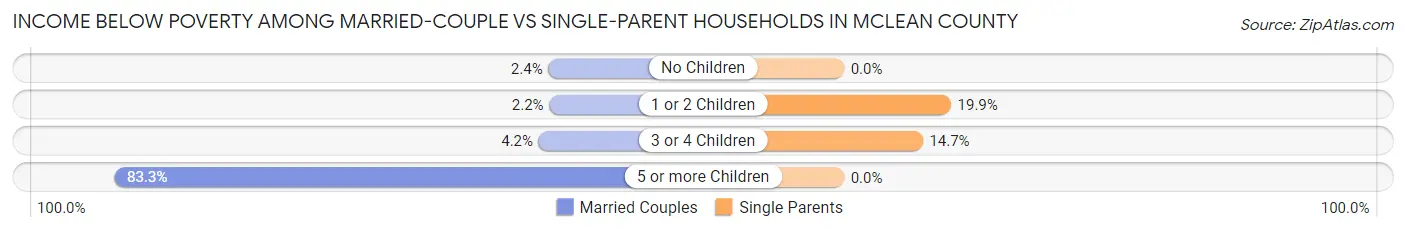
| Children | Married-Couple Families | Single-Parent Households |
| No Children | 40 (2.4%) | 0 (0.0%) |
| 1 or 2 Children | 13 (2.2%) | 53 (19.9%) |
| 3 or 4 Children | 9 (4.2%) | 11 (14.7%) |
| 5 or more Children | 5 (83.3%) | 0 (0.0%) |
| Total | 67 (2.7%) | 64 (14.0%) |
Employment Characteristics in McLean County
Employment by Class of Employer in McLean County
Among the 4,413 employed individuals in McLean County, private company employees (2,414 | 54.7%), self-employed (not incorporated) (487 | 11.0%), and local government employees (479 | 10.8%) make up the most common classes of employment.
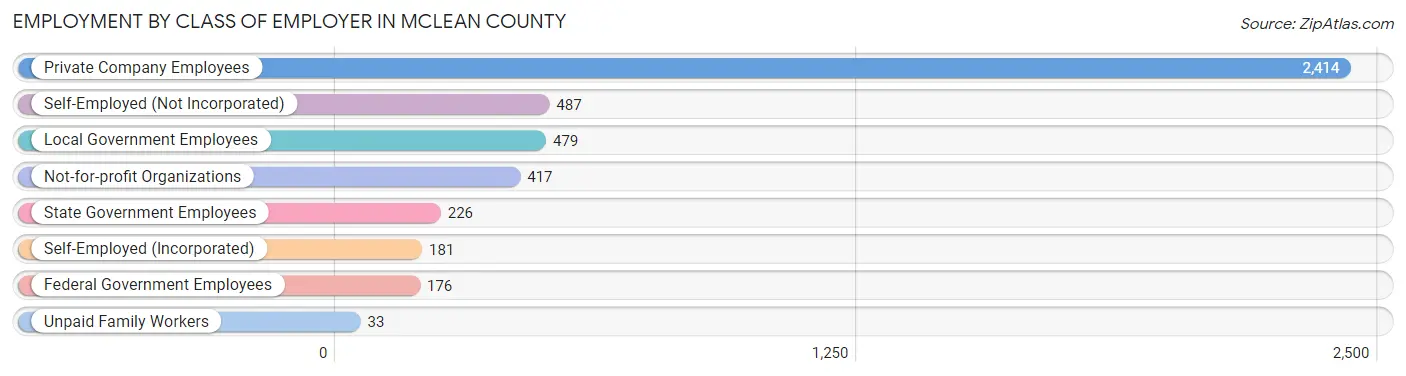
| Employer Class | # Employees | % Employees |
| Private Company Employees | 2,414 | 54.7% |
| Self-Employed (Incorporated) | 181 | 4.1% |
| Self-Employed (Not Incorporated) | 487 | 11.0% |
| Not-for-profit Organizations | 417 | 9.5% |
| Local Government Employees | 479 | 10.8% |
| State Government Employees | 226 | 5.1% |
| Federal Government Employees | 176 | 4.0% |
| Unpaid Family Workers | 33 | 0.7% |
| Total | 4,413 | 100.0% |
Employment Status by Age in McLean County
According to the labor force statistics for McLean County, out of the total population over 16 years of age (7,842), 58.1% or 4,556 individuals are in the labor force, with 1.4% or 64 of them unemployed. The age group with the highest labor force participation rate is 45 to 54 years, with 89.5% or 964 individuals in the labor force. Within the labor force, the 20 to 24 years age range has the highest percentage of unemployed individuals, with 4.0% or 12 of them being unemployed.
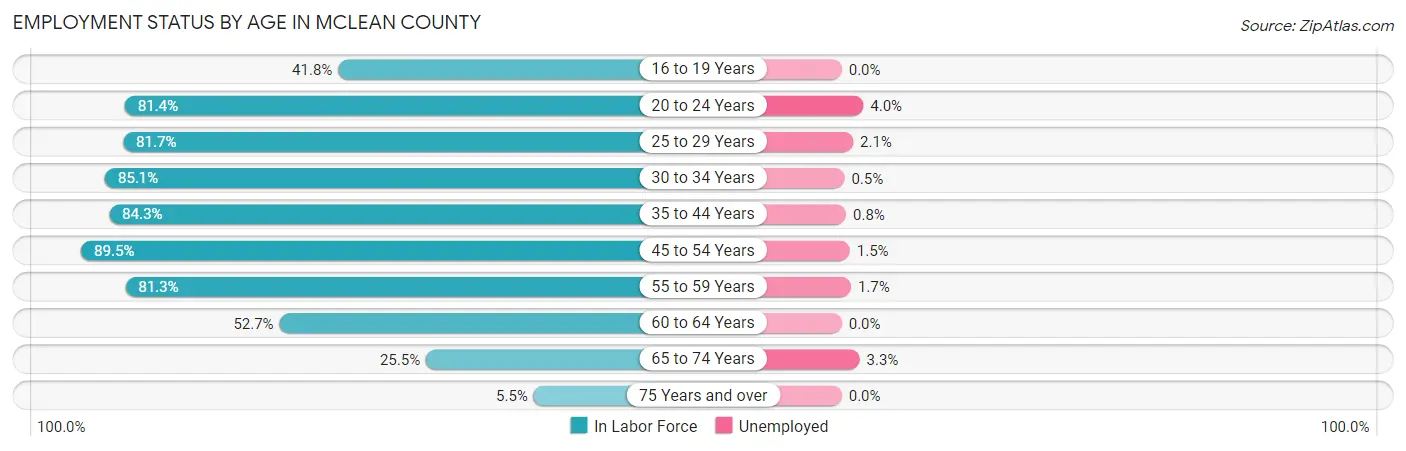
| Age Bracket | In Labor Force | Unemployed |
| 16 to 19 Years | 160 (41.8%) | 0 (0.0%) |
| 20 to 24 Years | 298 (81.4%) | 12 (4.0%) |
| 25 to 29 Years | 379 (81.7%) | 8 (2.1%) |
| 30 to 34 Years | 434 (85.1%) | 2 (0.5%) |
| 35 to 44 Years | 889 (84.3%) | 7 (0.8%) |
| 45 to 54 Years | 964 (89.5%) | 14 (1.5%) |
| 55 to 59 Years | 522 (81.3%) | 9 (1.7%) |
| 60 to 64 Years | 494 (52.7%) | 0 (0.0%) |
| 65 to 74 Years | 366 (25.5%) | 12 (3.3%) |
| 75 Years and over | 54 (5.5%) | 0 (0.0%) |
| Total | 4,556 (58.1%) | 64 (1.4%) |
Employment Status by Educational Attainment in McLean County
According to labor force statistics for McLean County, 78.6% of individuals (3,682) out of the total population between 25 and 64 years of age (4,685) are in the labor force, with 1.1% or 41 of them being unemployed. The group with the highest labor force participation rate are those with the educational attainment of bachelor's degree or higher, with 84.1% or 992 individuals in the labor force. Within the labor force, individuals with high school diploma education have the highest percentage of unemployment, with 3.1% or 30 of them being unemployed.
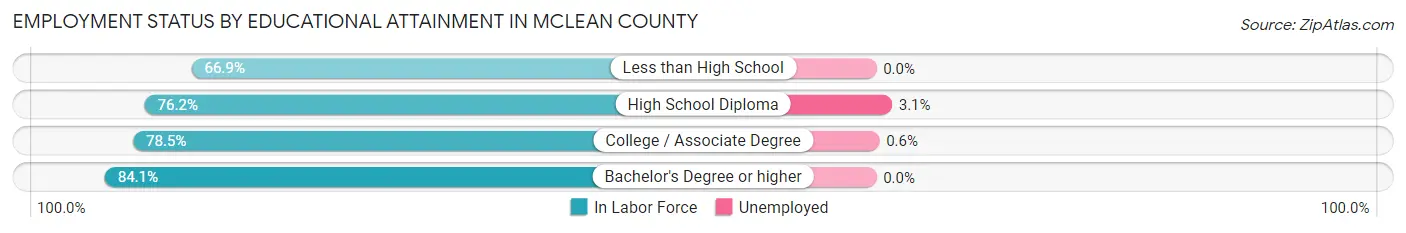
| Educational Attainment | In Labor Force | Unemployed |
| Less than High School | 190 (66.9%) | 0 (0.0%) |
| High School Diploma | 959 (76.2%) | 39 (3.1%) |
| College / Associate Degree | 1,542 (78.5%) | 12 (0.6%) |
| Bachelor's Degree or higher | 992 (84.1%) | 0 (0.0%) |
| Total | 3,682 (78.6%) | 52 (1.1%) |
Employment Occupations by Sex in McLean County
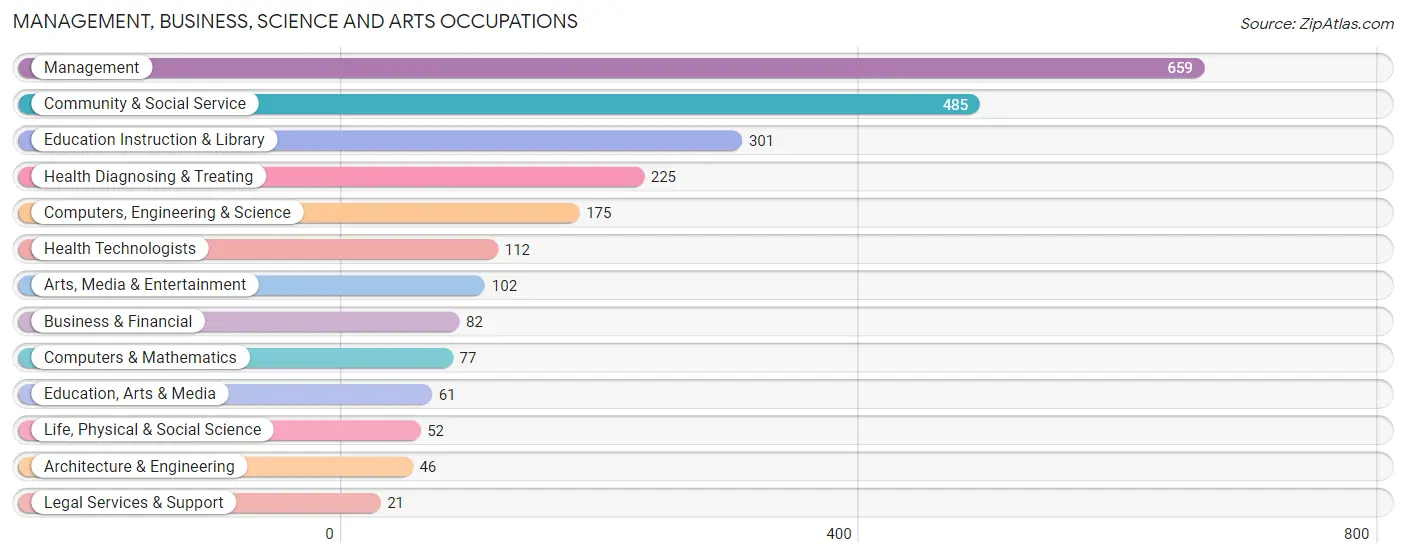
Management, Business, Science and Arts Occupations
The most common Management, Business, Science and Arts occupations in McLean County are Management (659 | 14.7%), Community & Social Service (485 | 10.8%), Education Instruction & Library (301 | 6.7%), Health Diagnosing & Treating (225 | 5.0%), and Computers, Engineering & Science (175 | 3.9%).
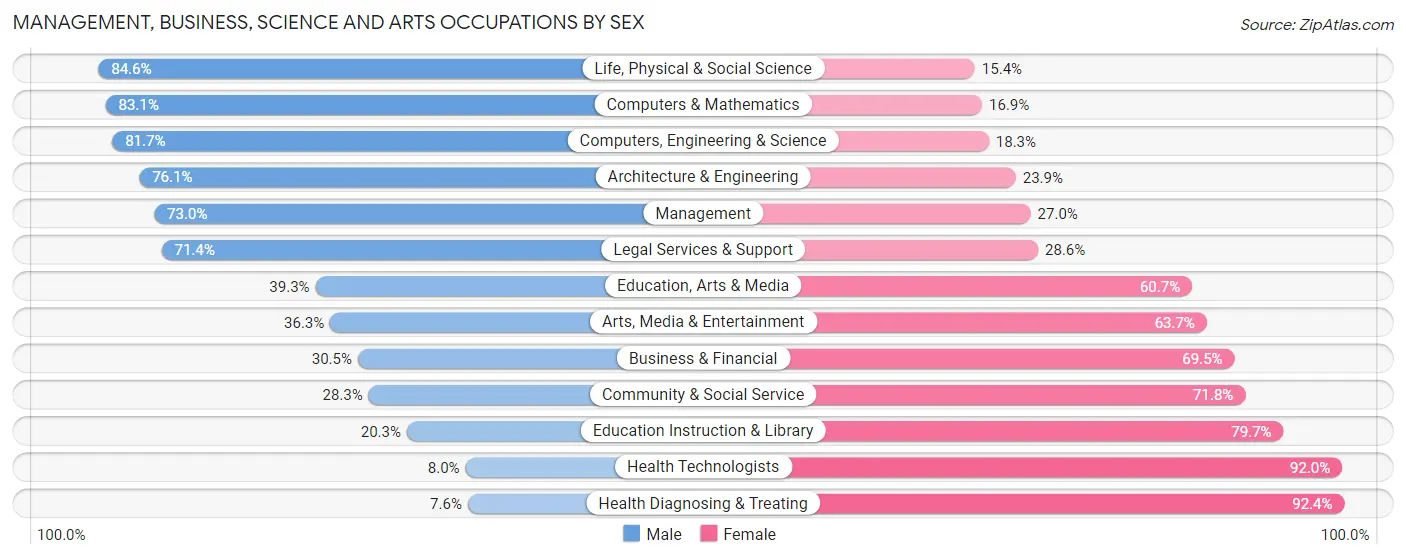
Management, Business, Science and Arts Occupations by Sex
Within the Management, Business, Science and Arts occupations in McLean County, the most male-oriented occupations are Life, Physical & Social Science (84.6%), Computers & Mathematics (83.1%), and Computers, Engineering & Science (81.7%), while the most female-oriented occupations are Health Diagnosing & Treating (92.4%), Health Technologists (92.0%), and Education Instruction & Library (79.7%).
| Occupation | Male | Female |
| Management | 481 (73.0%) | 178 (27.0%) |
| Business & Financial | 25 (30.5%) | 57 (69.5%) |
| Computers, Engineering & Science | 143 (81.7%) | 32 (18.3%) |
| Computers & Mathematics | 64 (83.1%) | 13 (16.9%) |
| Architecture & Engineering | 35 (76.1%) | 11 (23.9%) |
| Life, Physical & Social Science | 44 (84.6%) | 8 (15.4%) |
| Community & Social Service | 137 (28.2%) | 348 (71.8%) |
| Education, Arts & Media | 24 (39.3%) | 37 (60.7%) |
| Legal Services & Support | 15 (71.4%) | 6 (28.6%) |
| Education Instruction & Library | 61 (20.3%) | 240 (79.7%) |
| Arts, Media & Entertainment | 37 (36.3%) | 65 (63.7%) |
| Health Diagnosing & Treating | 17 (7.6%) | 208 (92.4%) |
| Health Technologists | 9 (8.0%) | 103 (92.0%) |
| Total (Category) | 803 (49.4%) | 823 (50.6%) |
| Total (Overall) | 2,490 (55.4%) | 2,003 (44.6%) |
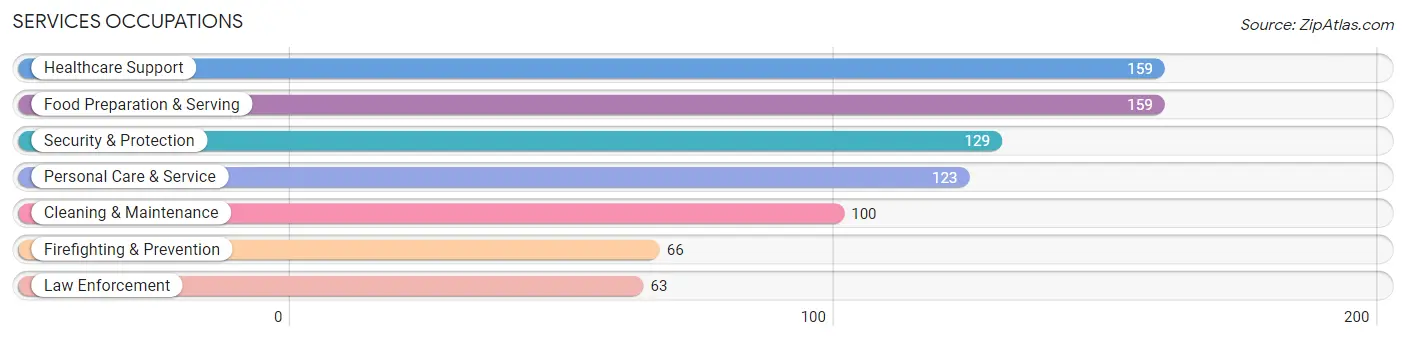
Services Occupations
The most common Services occupations in McLean County are Healthcare Support (159 | 3.5%), Food Preparation & Serving (159 | 3.5%), Security & Protection (129 | 2.9%), Personal Care & Service (123 | 2.7%), and Cleaning & Maintenance (100 | 2.2%).
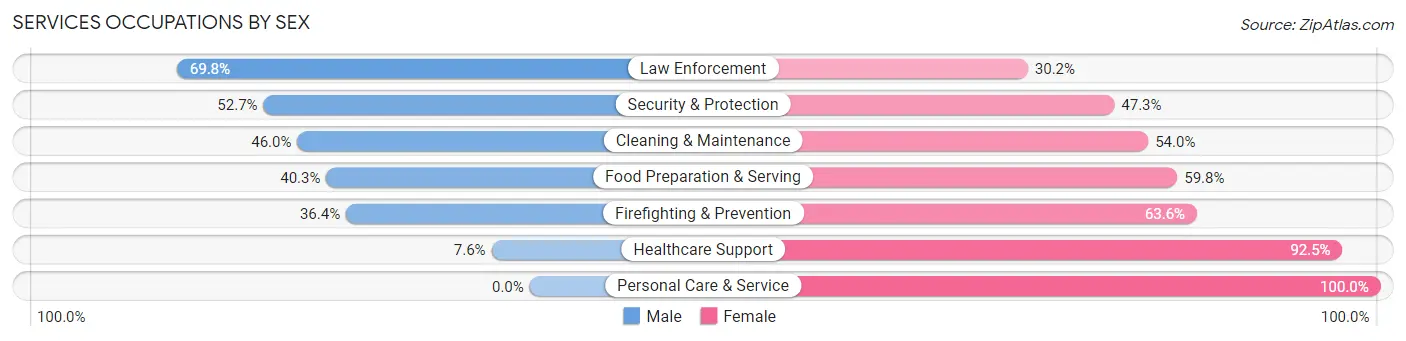
Services Occupations by Sex
Within the Services occupations in McLean County, the most male-oriented occupations are Law Enforcement (69.8%), Security & Protection (52.7%), and Cleaning & Maintenance (46.0%), while the most female-oriented occupations are Personal Care & Service (100.0%), Healthcare Support (92.4%), and Firefighting & Prevention (63.6%).
| Occupation | Male | Female |
| Healthcare Support | 12 (7.5%) | 147 (92.4%) |
| Security & Protection | 68 (52.7%) | 61 (47.3%) |
| Firefighting & Prevention | 24 (36.4%) | 42 (63.6%) |
| Law Enforcement | 44 (69.8%) | 19 (30.2%) |
| Food Preparation & Serving | 64 (40.3%) | 95 (59.8%) |
| Cleaning & Maintenance | 46 (46.0%) | 54 (54.0%) |
| Personal Care & Service | 0 (0.0%) | 123 (100.0%) |
| Total (Category) | 190 (28.4%) | 480 (71.6%) |
| Total (Overall) | 2,490 (55.4%) | 2,003 (44.6%) |
Sales and Office Occupations
The most common Sales and Office occupations in McLean County are Office & Administration (478 | 10.6%), and Sales & Related (273 | 6.1%).
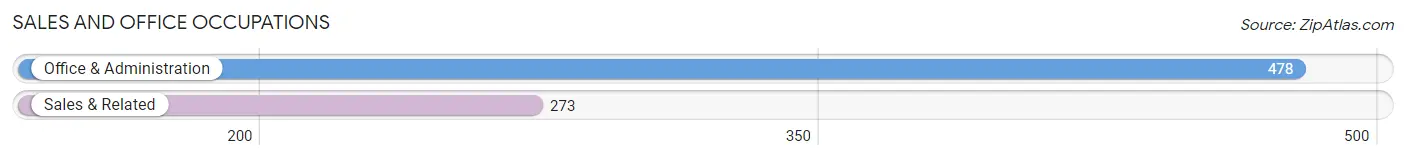
Sales and Office Occupations by Sex
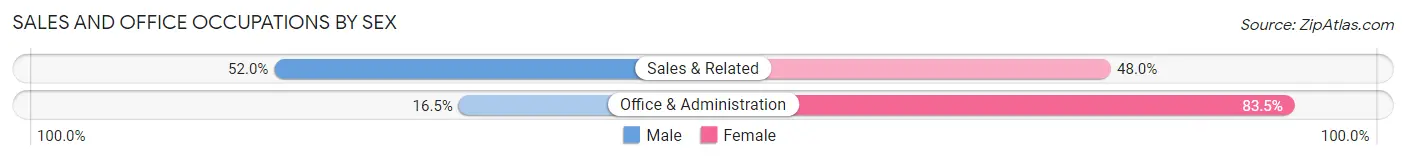
| Occupation | Male | Female |
| Sales & Related | 142 (52.0%) | 131 (48.0%) |
| Office & Administration | 79 (16.5%) | 399 (83.5%) |
| Total (Category) | 221 (29.4%) | 530 (70.6%) |
| Total (Overall) | 2,490 (55.4%) | 2,003 (44.6%) |
Natural Resources, Construction and Maintenance Occupations
The most common Natural Resources, Construction and Maintenance occupations in McLean County are Construction & Extraction (450 | 10.0%), Installation, Maintenance & Repair (304 | 6.8%), and Farming, Fishing & Forestry (115 | 2.6%).
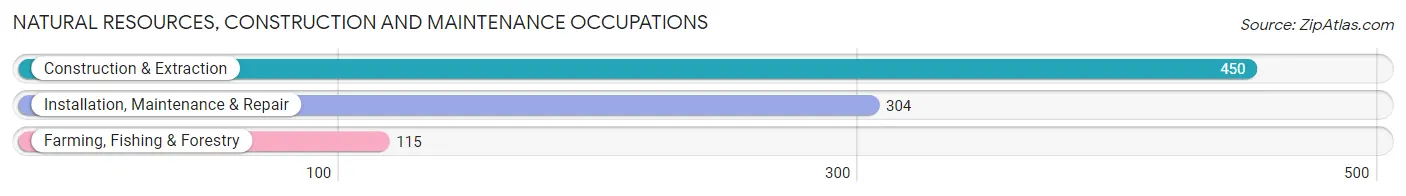
Natural Resources, Construction and Maintenance Occupations by Sex
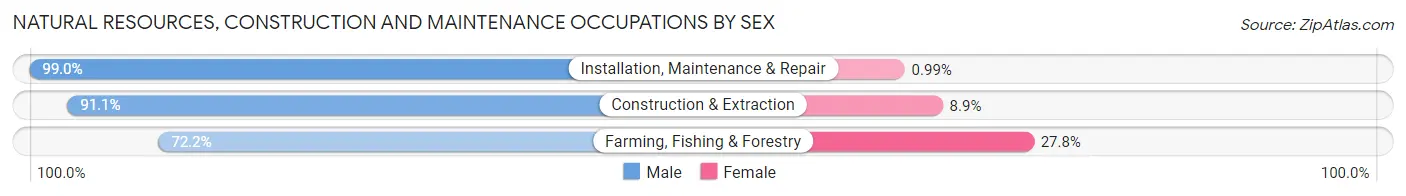
| Occupation | Male | Female |
| Farming, Fishing & Forestry | 83 (72.2%) | 32 (27.8%) |
| Construction & Extraction | 410 (91.1%) | 40 (8.9%) |
| Installation, Maintenance & Repair | 301 (99.0%) | 3 (1.0%) |
| Total (Category) | 794 (91.4%) | 75 (8.6%) |
| Total (Overall) | 2,490 (55.4%) | 2,003 (44.6%) |
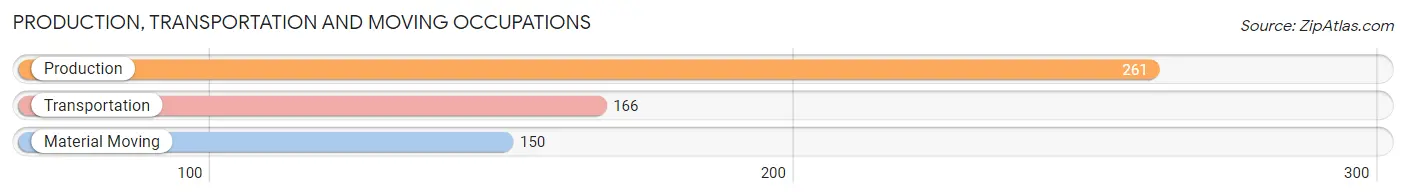
Production, Transportation and Moving Occupations
The most common Production, Transportation and Moving occupations in McLean County are Production (261 | 5.8%), Transportation (166 | 3.7%), and Material Moving (150 | 3.3%).
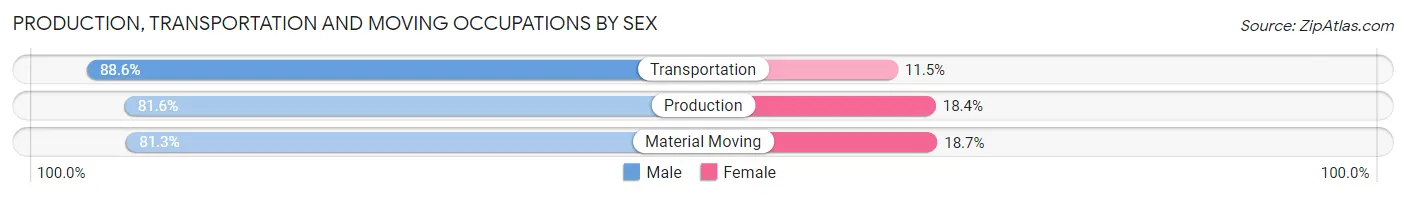
Production, Transportation and Moving Occupations by Sex
| Occupation | Male | Female |
| Production | 213 (81.6%) | 48 (18.4%) |
| Transportation | 147 (88.5%) | 19 (11.5%) |
| Material Moving | 122 (81.3%) | 28 (18.7%) |
| Total (Category) | 482 (83.5%) | 95 (16.5%) |
| Total (Overall) | 2,490 (55.4%) | 2,003 (44.6%) |
Employment Industries by Sex in McLean County
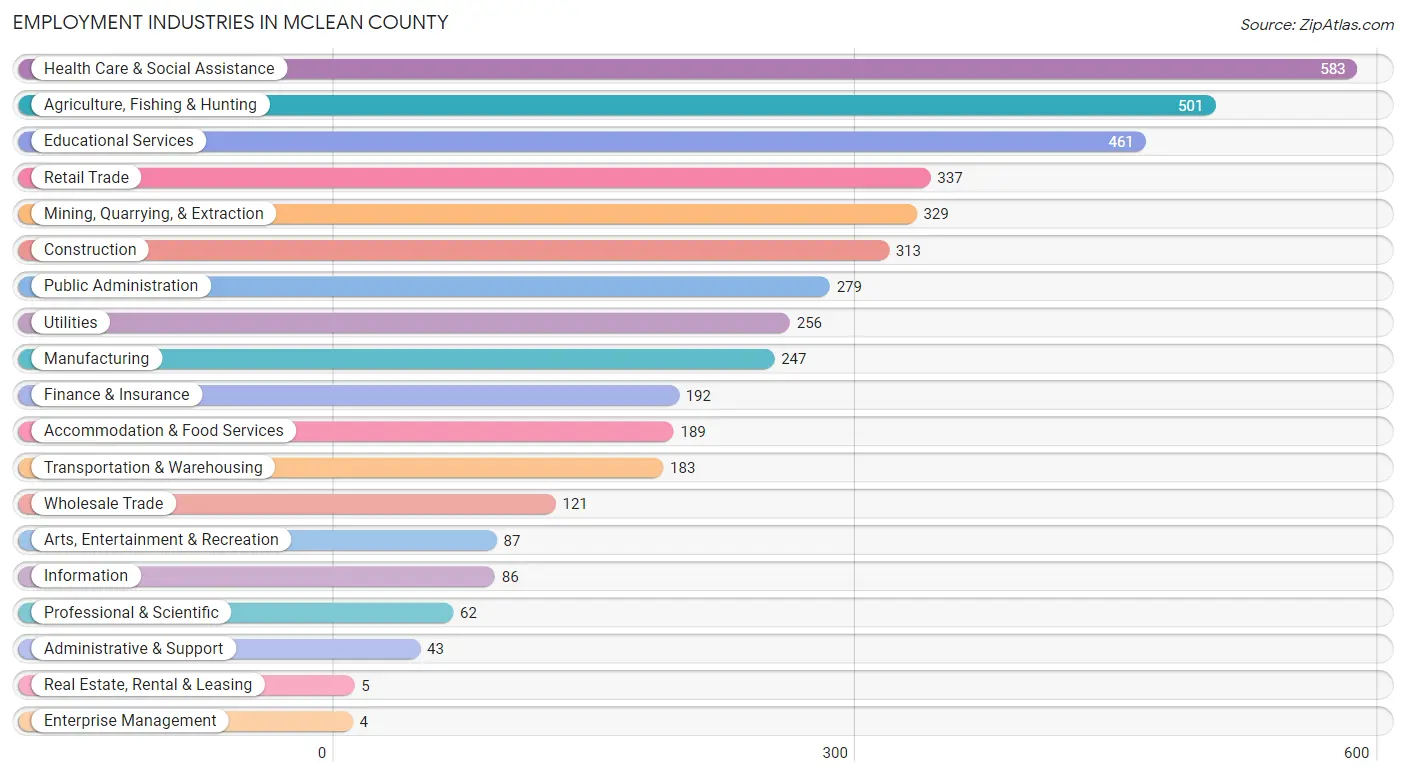
Employment Industries in McLean County
The major employment industries in McLean County include Health Care & Social Assistance (583 | 13.0%), Agriculture, Fishing & Hunting (501 | 11.2%), Educational Services (461 | 10.3%), Retail Trade (337 | 7.5%), and Mining, Quarrying, & Extraction (329 | 7.3%).
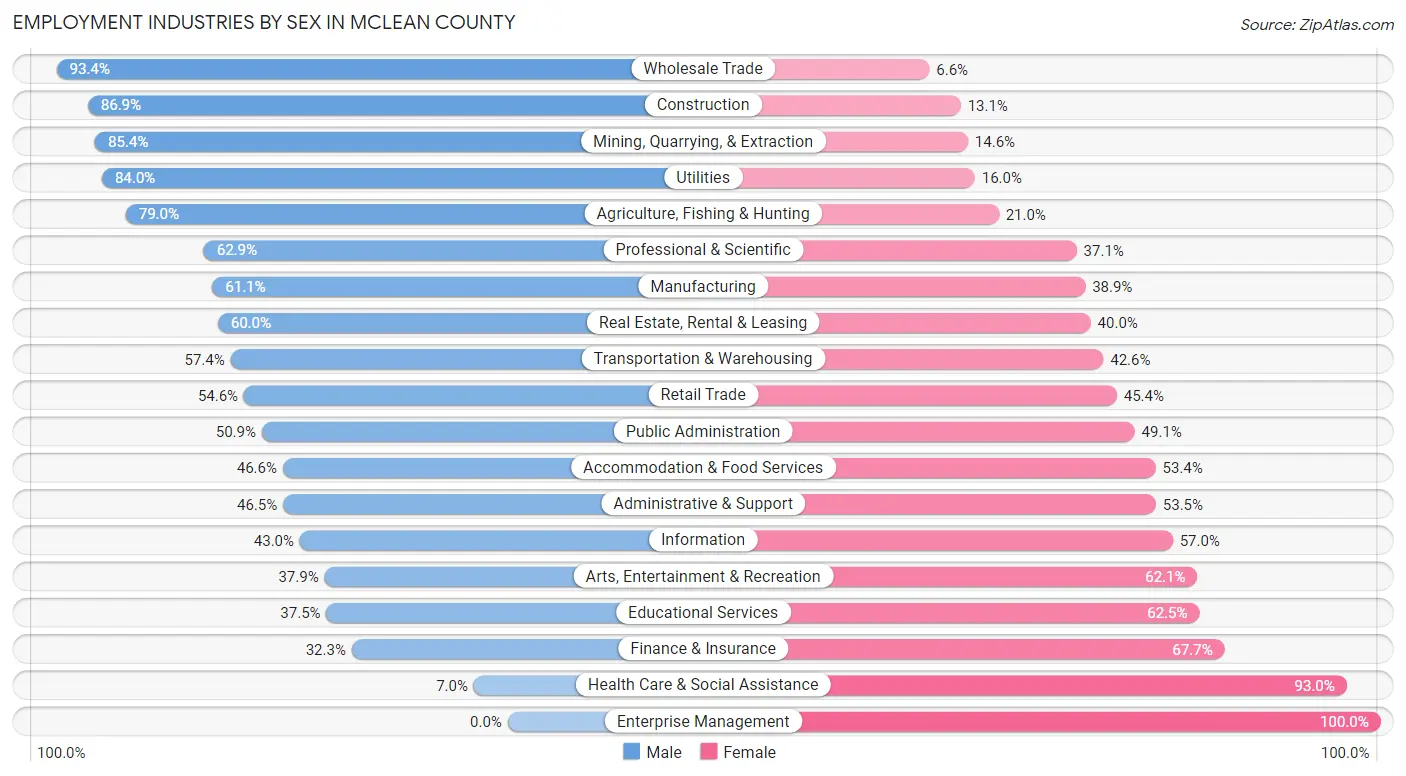
Employment Industries by Sex in McLean County
The McLean County industries that see more men than women are Wholesale Trade (93.4%), Construction (86.9%), and Mining, Quarrying, & Extraction (85.4%), whereas the industries that tend to have a higher number of women are Enterprise Management (100.0%), Health Care & Social Assistance (93.0%), and Finance & Insurance (67.7%).
| Industry | Male | Female |
| Agriculture, Fishing & Hunting | 396 (79.0%) | 105 (21.0%) |
| Mining, Quarrying, & Extraction | 281 (85.4%) | 48 (14.6%) |
| Construction | 272 (86.9%) | 41 (13.1%) |
| Manufacturing | 151 (61.1%) | 96 (38.9%) |
| Wholesale Trade | 113 (93.4%) | 8 (6.6%) |
| Retail Trade | 184 (54.6%) | 153 (45.4%) |
| Transportation & Warehousing | 105 (57.4%) | 78 (42.6%) |
| Utilities | 215 (84.0%) | 41 (16.0%) |
| Information | 37 (43.0%) | 49 (57.0%) |
| Finance & Insurance | 62 (32.3%) | 130 (67.7%) |
| Real Estate, Rental & Leasing | 3 (60.0%) | 2 (40.0%) |
| Professional & Scientific | 39 (62.9%) | 23 (37.1%) |
| Enterprise Management | 0 (0.0%) | 4 (100.0%) |
| Administrative & Support | 20 (46.5%) | 23 (53.5%) |
| Educational Services | 173 (37.5%) | 288 (62.5%) |
| Health Care & Social Assistance | 41 (7.0%) | 542 (93.0%) |
| Arts, Entertainment & Recreation | 33 (37.9%) | 54 (62.1%) |
| Accommodation & Food Services | 88 (46.6%) | 101 (53.4%) |
| Public Administration | 142 (50.9%) | 137 (49.1%) |
| Total | 2,490 (55.4%) | 2,003 (44.6%) |
Education in McLean County
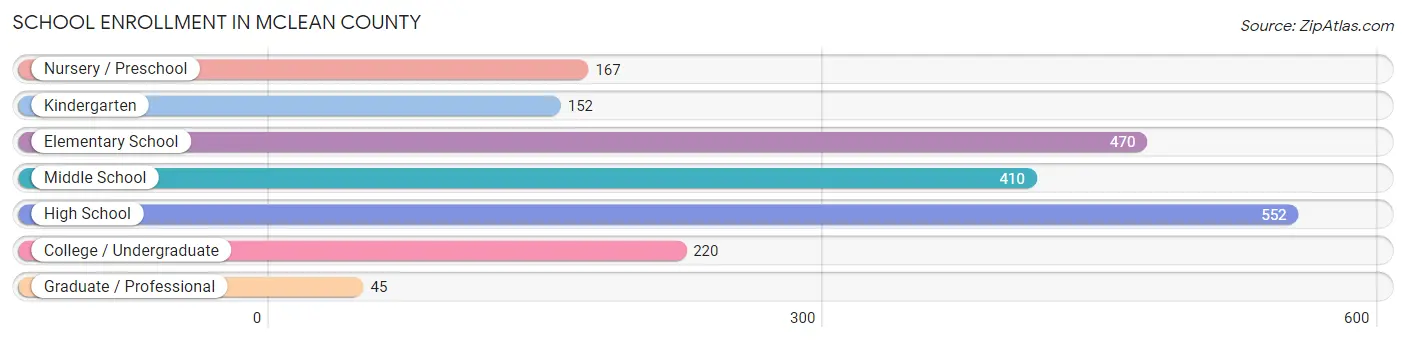
School Enrollment in McLean County
The most common levels of schooling among the 2,016 students in McLean County are high school (552 | 27.4%), elementary school (470 | 23.3%), and middle school (410 | 20.3%).
| School Level | # Students | % Students |
| Nursery / Preschool | 167 | 8.3% |
| Kindergarten | 152 | 7.5% |
| Elementary School | 470 | 23.3% |
| Middle School | 410 | 20.3% |
| High School | 552 | 27.4% |
| College / Undergraduate | 220 | 10.9% |
| Graduate / Professional | 45 | 2.2% |
| Total | 2,016 | 100.0% |
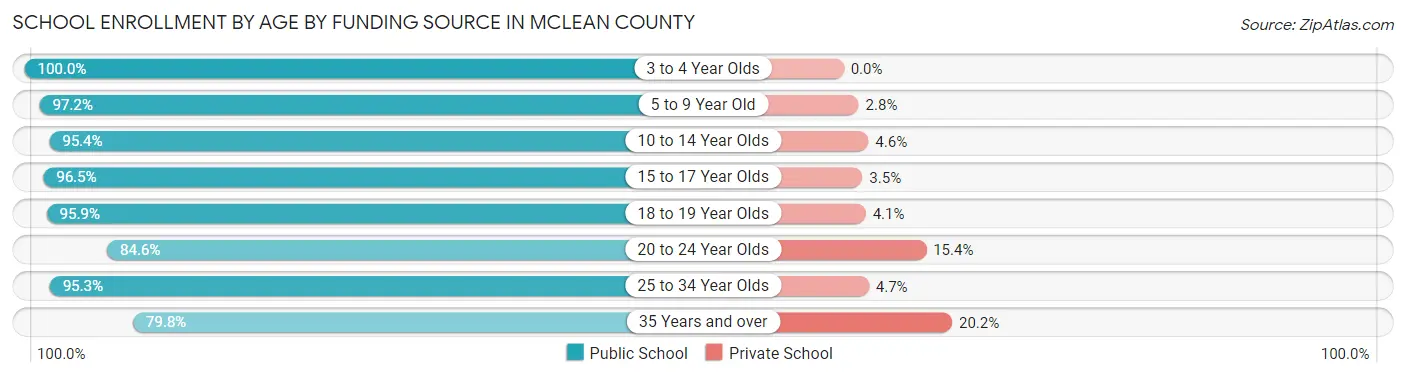
School Enrollment by Age by Funding Source in McLean County
Out of a total of 2,016 students who are enrolled in schools in McLean County, 95 (4.7%) attend a private institution, while the remaining 1,921 (95.3%) are enrolled in public schools. The age group of 35 years and over has the highest likelihood of being enrolled in private schools, with 22 (20.2% in the age bracket) enrolled. Conversely, the age group of 3 to 4 year olds has the lowest likelihood of being enrolled in a private school, with 69 (100.0% in the age bracket) attending a public institution.
| Age Bracket | Public School | Private School |
| 3 to 4 Year Olds | 69 (100.0%) | 0 (0.0%) |
| 5 to 9 Year Old | 663 (97.2%) | 19 (2.8%) |
| 10 to 14 Year Olds | 497 (95.4%) | 24 (4.6%) |
| 15 to 17 Year Olds | 360 (96.5%) | 13 (3.5%) |
| 18 to 19 Year Olds | 140 (95.9%) | 6 (4.1%) |
| 20 to 24 Year Olds | 44 (84.6%) | 8 (15.4%) |
| 25 to 34 Year Olds | 61 (95.3%) | 3 (4.7%) |
| 35 Years and over | 87 (79.8%) | 22 (20.2%) |
| Total | 1,921 (95.3%) | 95 (4.7%) |
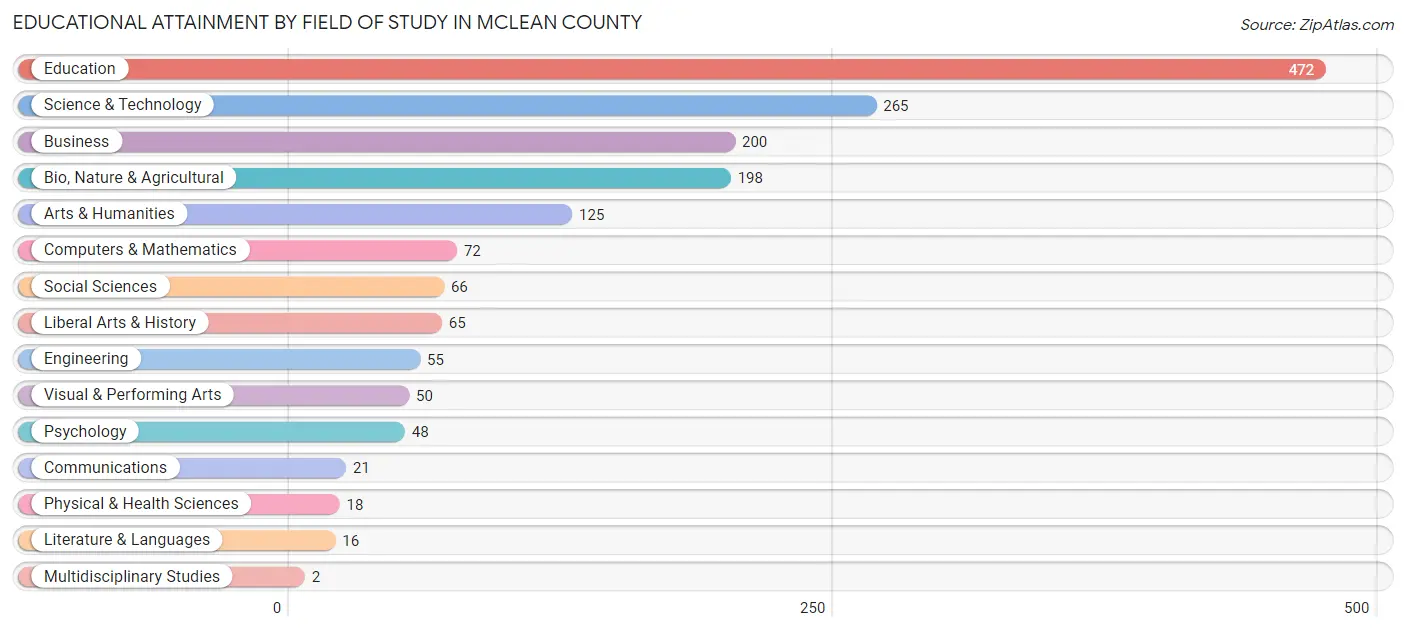
Educational Attainment by Field of Study in McLean County
Education (472 | 28.2%), science & technology (265 | 15.8%), business (200 | 11.9%), bio, nature & agricultural (198 | 11.8%), and arts & humanities (125 | 7.5%) are the most common fields of study among 1,673 individuals in McLean County who have obtained a bachelor's degree or higher.
| Field of Study | # Graduates | % Graduates |
| Computers & Mathematics | 72 | 4.3% |
| Bio, Nature & Agricultural | 198 | 11.8% |
| Physical & Health Sciences | 18 | 1.1% |
| Psychology | 48 | 2.9% |
| Social Sciences | 66 | 4.0% |
| Engineering | 55 | 3.3% |
| Multidisciplinary Studies | 2 | 0.1% |
| Science & Technology | 265 | 15.8% |
| Business | 200 | 11.9% |
| Education | 472 | 28.2% |
| Literature & Languages | 16 | 1.0% |
| Liberal Arts & History | 65 | 3.9% |
| Visual & Performing Arts | 50 | 3.0% |
| Communications | 21 | 1.3% |
| Arts & Humanities | 125 | 7.5% |
| Total | 1,673 | 100.0% |
Transportation & Commute in McLean County
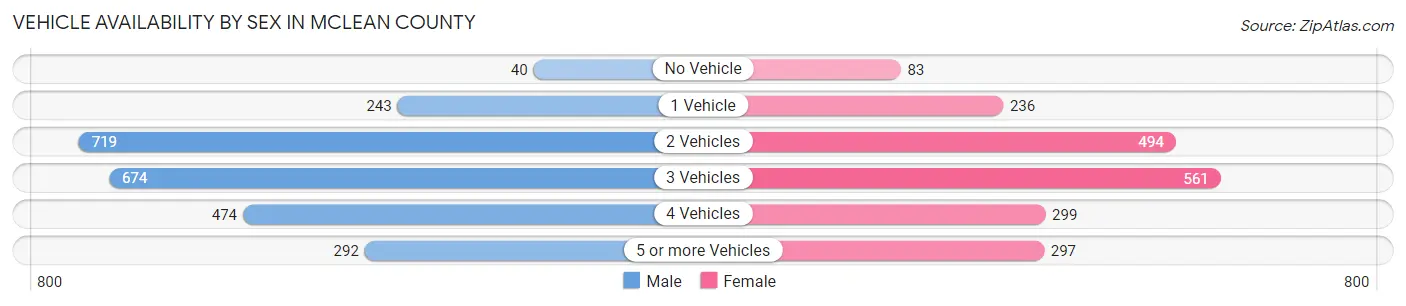
Vehicle Availability by Sex in McLean County
The most prevalent vehicle ownership categories in McLean County are males with 2 vehicles (719, accounting for 29.4%) and females with 2 vehicles (494, making up 36.5%).
| Vehicles Available | Male | Female |
| No Vehicle | 40 (1.6%) | 83 (4.2%) |
| 1 Vehicle | 243 (10.0%) | 236 (12.0%) |
| 2 Vehicles | 719 (29.4%) | 494 (25.1%) |
| 3 Vehicles | 674 (27.6%) | 561 (28.5%) |
| 4 Vehicles | 474 (19.4%) | 299 (15.2%) |
| 5 or more Vehicles | 292 (12.0%) | 297 (15.1%) |
| Total | 2,442 (100.0%) | 1,970 (100.0%) |
Commute Time in McLean County
The most frequently occuring commute durations in McLean County are 5 to 9 minutes (890 commuters, 21.7%), less than 5 minutes (602 commuters, 14.7%), and 15 to 19 minutes (515 commuters, 12.6%).
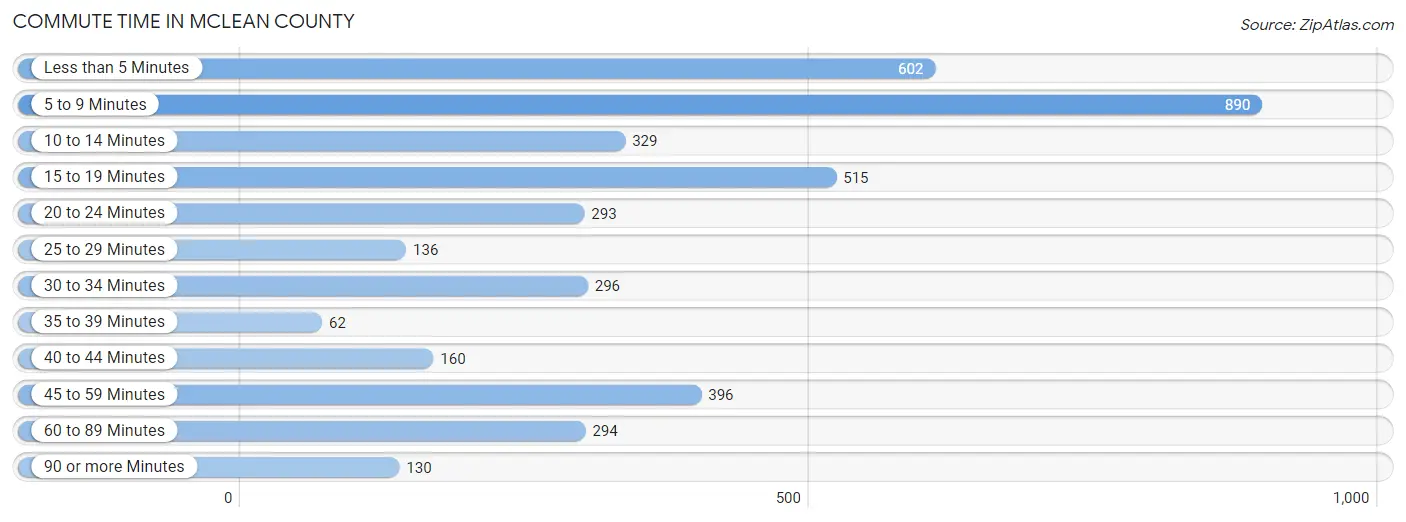
| Commute Time | # Commuters | % Commuters |
| Less than 5 Minutes | 602 | 14.7% |
| 5 to 9 Minutes | 890 | 21.7% |
| 10 to 14 Minutes | 329 | 8.0% |
| 15 to 19 Minutes | 515 | 12.6% |
| 20 to 24 Minutes | 293 | 7.1% |
| 25 to 29 Minutes | 136 | 3.3% |
| 30 to 34 Minutes | 296 | 7.2% |
| 35 to 39 Minutes | 62 | 1.5% |
| 40 to 44 Minutes | 160 | 3.9% |
| 45 to 59 Minutes | 396 | 9.7% |
| 60 to 89 Minutes | 294 | 7.2% |
| 90 or more Minutes | 130 | 3.2% |
Commute Time by Sex in McLean County
The most common commute times in McLean County are 5 to 9 minutes (378 commuters, 16.5%) for males and 5 to 9 minutes (512 commuters, 28.2%) for females.
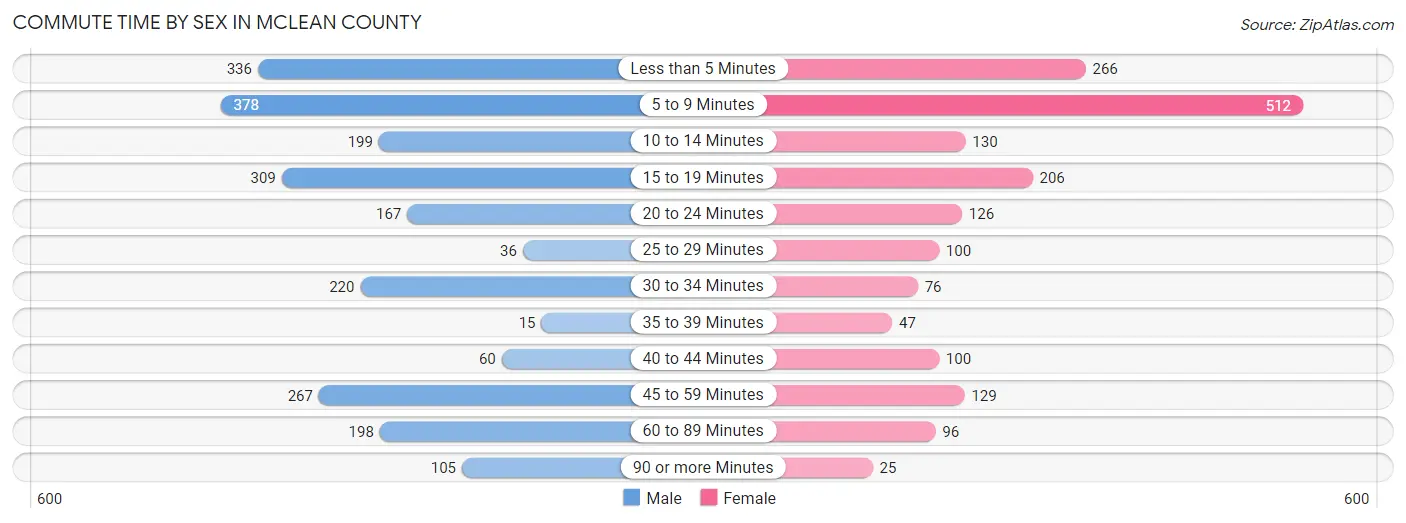
| Commute Time | Male | Female |
| Less than 5 Minutes | 336 (14.7%) | 266 (14.7%) |
| 5 to 9 Minutes | 378 (16.5%) | 512 (28.2%) |
| 10 to 14 Minutes | 199 (8.7%) | 130 (7.2%) |
| 15 to 19 Minutes | 309 (13.5%) | 206 (11.4%) |
| 20 to 24 Minutes | 167 (7.3%) | 126 (7.0%) |
| 25 to 29 Minutes | 36 (1.6%) | 100 (5.5%) |
| 30 to 34 Minutes | 220 (9.6%) | 76 (4.2%) |
| 35 to 39 Minutes | 15 (0.7%) | 47 (2.6%) |
| 40 to 44 Minutes | 60 (2.6%) | 100 (5.5%) |
| 45 to 59 Minutes | 267 (11.7%) | 129 (7.1%) |
| 60 to 89 Minutes | 198 (8.6%) | 96 (5.3%) |
| 90 or more Minutes | 105 (4.6%) | 25 (1.4%) |
Time of Departure to Work by Sex in McLean County
The most frequent times of departure to work in McLean County are 7:00 AM to 7:29 AM (387, 16.9%) for males and 7:30 AM to 7:59 AM (504, 27.8%) for females.
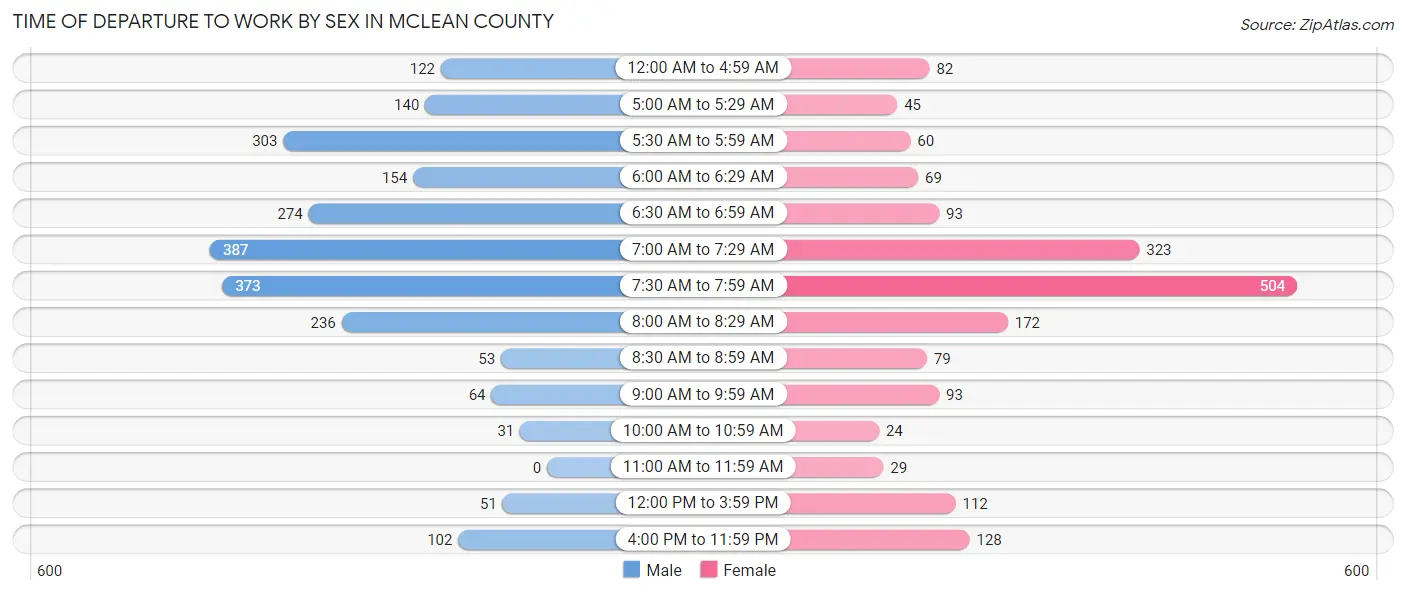
| Time of Departure | Male | Female |
| 12:00 AM to 4:59 AM | 122 (5.3%) | 82 (4.5%) |
| 5:00 AM to 5:29 AM | 140 (6.1%) | 45 (2.5%) |
| 5:30 AM to 5:59 AM | 303 (13.2%) | 60 (3.3%) |
| 6:00 AM to 6:29 AM | 154 (6.7%) | 69 (3.8%) |
| 6:30 AM to 6:59 AM | 274 (12.0%) | 93 (5.1%) |
| 7:00 AM to 7:29 AM | 387 (16.9%) | 323 (17.8%) |
| 7:30 AM to 7:59 AM | 373 (16.3%) | 504 (27.8%) |
| 8:00 AM to 8:29 AM | 236 (10.3%) | 172 (9.5%) |
| 8:30 AM to 8:59 AM | 53 (2.3%) | 79 (4.4%) |
| 9:00 AM to 9:59 AM | 64 (2.8%) | 93 (5.1%) |
| 10:00 AM to 10:59 AM | 31 (1.3%) | 24 (1.3%) |
| 11:00 AM to 11:59 AM | 0 (0.0%) | 29 (1.6%) |
| 12:00 PM to 3:59 PM | 51 (2.2%) | 112 (6.2%) |
| 4:00 PM to 11:59 PM | 102 (4.4%) | 128 (7.1%) |
| Total | 2,290 (100.0%) | 1,813 (100.0%) |
Housing Occupancy in McLean County
Occupancy by Ownership in McLean County
Of the total 4,176 dwellings in McLean County, owner-occupied units account for 3,463 (82.9%), while renter-occupied units make up 713 (17.1%).
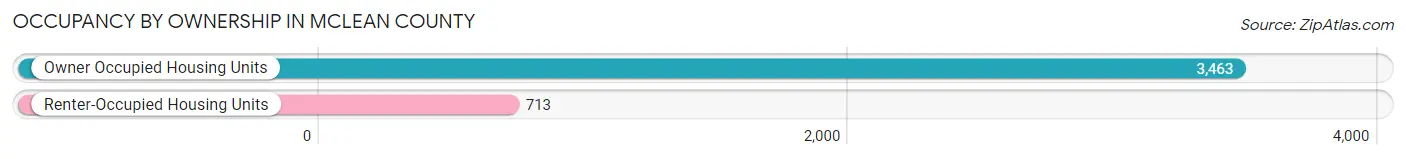
| Occupancy | # Housing Units | % Housing Units |
| Owner Occupied Housing Units | 3,463 | 82.9% |
| Renter-Occupied Housing Units | 713 | 17.1% |
| Total Occupied Housing Units | 4,176 | 100.0% |
Occupancy by Household Size in McLean County
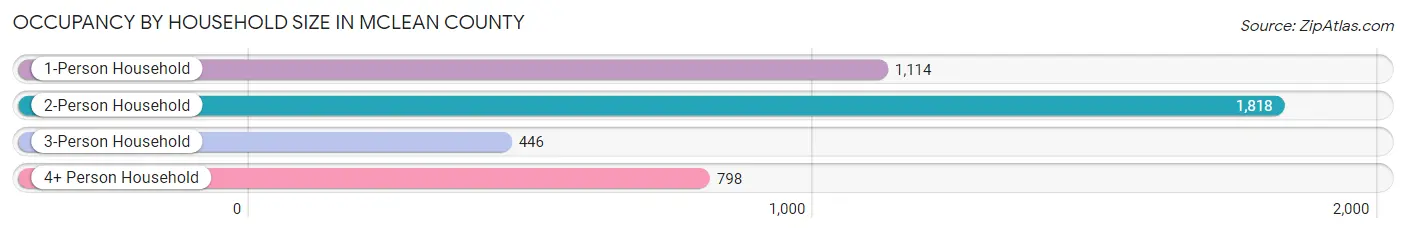
| Household Size | # Housing Units | % Housing Units |
| 1-Person Household | 1,114 | 26.7% |
| 2-Person Household | 1,818 | 43.5% |
| 3-Person Household | 446 | 10.7% |
| 4+ Person Household | 798 | 19.1% |
| Total Housing Units | 4,176 | 100.0% |
Occupancy by Ownership by Household Size in McLean County
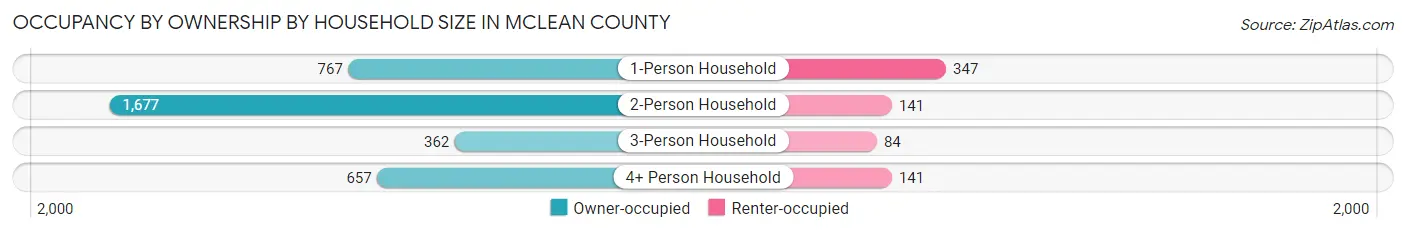
| Household Size | Owner-occupied | Renter-occupied |
| 1-Person Household | 767 (68.9%) | 347 (31.1%) |
| 2-Person Household | 1,677 (92.2%) | 141 (7.8%) |
| 3-Person Household | 362 (81.2%) | 84 (18.8%) |
| 4+ Person Household | 657 (82.3%) | 141 (17.7%) |
| Total Housing Units | 3,463 (82.9%) | 713 (17.1%) |
Occupancy by Educational Attainment in McLean County
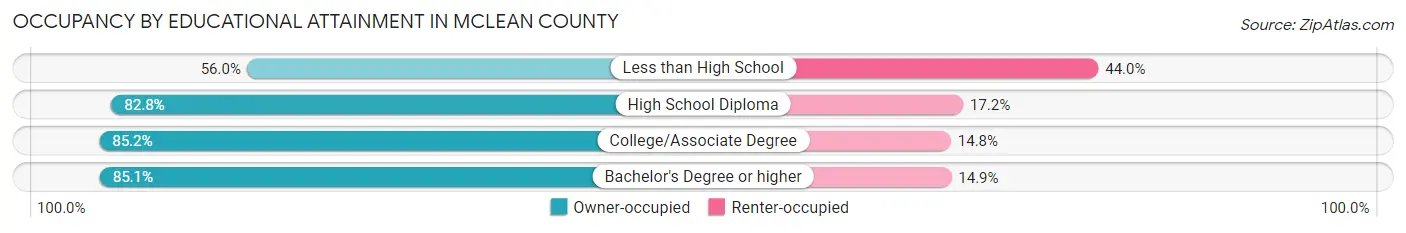
| Household Size | Owner-occupied | Renter-occupied |
| Less than High School | 122 (56.0%) | 96 (44.0%) |
| High School Diploma | 1,029 (82.8%) | 214 (17.2%) |
| College/Associate Degree | 1,473 (85.2%) | 256 (14.8%) |
| Bachelor's Degree or higher | 839 (85.1%) | 147 (14.9%) |
Occupancy by Age of Householder in McLean County
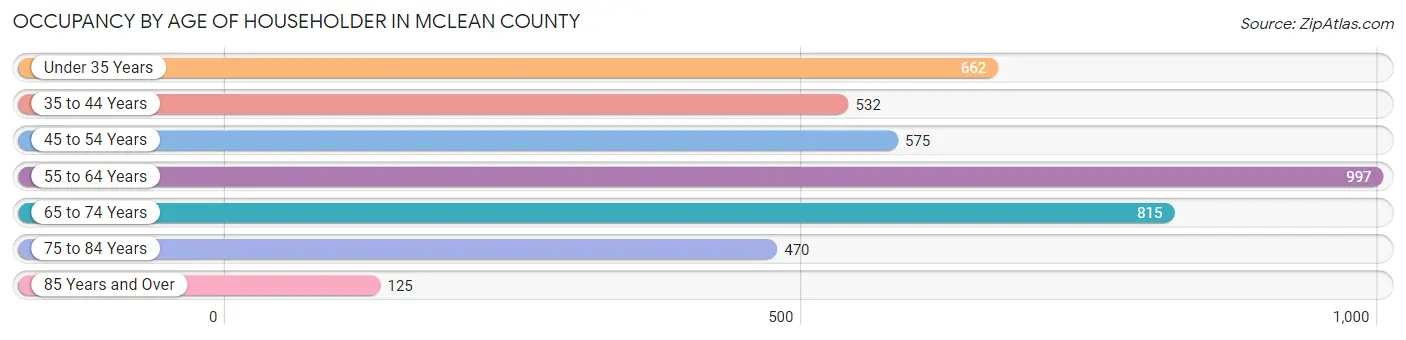
| Age Bracket | # Households | % Households |
| Under 35 Years | 662 | 15.9% |
| 35 to 44 Years | 532 | 12.7% |
| 45 to 54 Years | 575 | 13.8% |
| 55 to 64 Years | 997 | 23.9% |
| 65 to 74 Years | 815 | 19.5% |
| 75 to 84 Years | 470 | 11.3% |
| 85 Years and Over | 125 | 3.0% |
| Total | 4,176 | 100.0% |
Housing Finances in McLean County
Median Income by Occupancy in McLean County
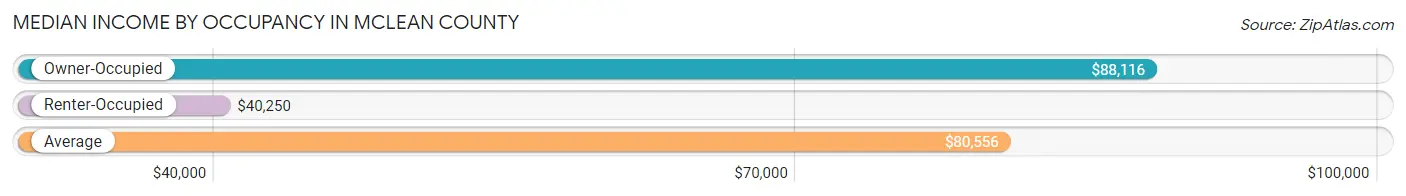
| Occupancy Type | # Households | Median Income |
| Owner-Occupied | 3,463 (82.9%) | $88,116 |
| Renter-Occupied | 713 (17.1%) | $40,250 |
| Average | 4,176 (100.0%) | $80,556 |
Occupancy by Householder Income Bracket in McLean County
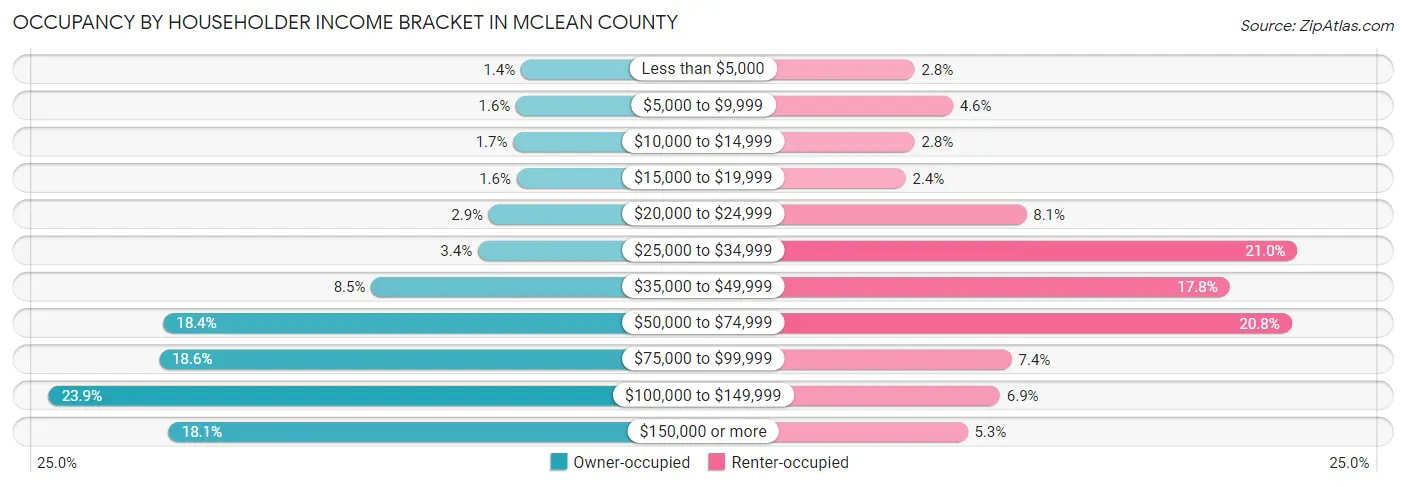
| Income Bracket | Owner-occupied | Renter-occupied |
| Less than $5,000 | 47 (1.4%) | 20 (2.8%) |
| $5,000 to $9,999 | 55 (1.6%) | 33 (4.6%) |
| $10,000 to $14,999 | 60 (1.7%) | 20 (2.8%) |
| $15,000 to $19,999 | 54 (1.6%) | 17 (2.4%) |
| $20,000 to $24,999 | 100 (2.9%) | 58 (8.1%) |
| $25,000 to $34,999 | 118 (3.4%) | 150 (21.0%) |
| $35,000 to $49,999 | 294 (8.5%) | 127 (17.8%) |
| $50,000 to $74,999 | 637 (18.4%) | 148 (20.8%) |
| $75,000 to $99,999 | 644 (18.6%) | 53 (7.4%) |
| $100,000 to $149,999 | 826 (23.8%) | 49 (6.9%) |
| $150,000 or more | 628 (18.1%) | 38 (5.3%) |
| Total | 3,463 (100.0%) | 713 (100.0%) |
Monthly Housing Cost Tiers in McLean County
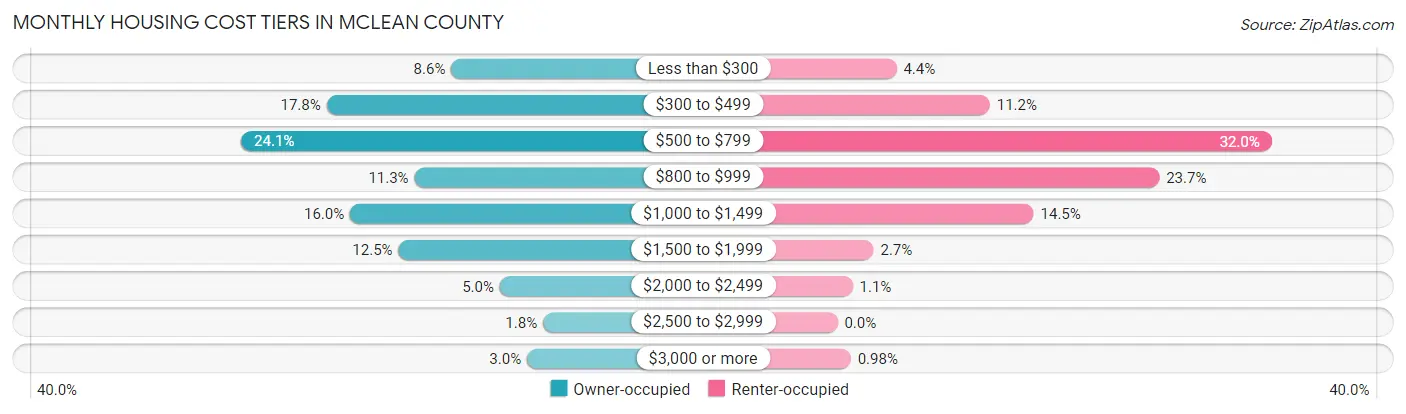
| Monthly Cost | Owner-occupied | Renter-occupied |
| Less than $300 | 297 (8.6%) | 31 (4.3%) |
| $300 to $499 | 615 (17.8%) | 80 (11.2%) |
| $500 to $799 | 833 (24.0%) | 228 (32.0%) |
| $800 to $999 | 391 (11.3%) | 169 (23.7%) |
| $1,000 to $1,499 | 555 (16.0%) | 103 (14.4%) |
| $1,500 to $1,999 | 432 (12.5%) | 19 (2.7%) |
| $2,000 to $2,499 | 173 (5.0%) | 8 (1.1%) |
| $2,500 to $2,999 | 63 (1.8%) | 0 (0.0%) |
| $3,000 or more | 104 (3.0%) | 7 (1.0%) |
| Total | 3,463 (100.0%) | 713 (100.0%) |
Physical Housing Characteristics in McLean County
Housing Structures in McLean County
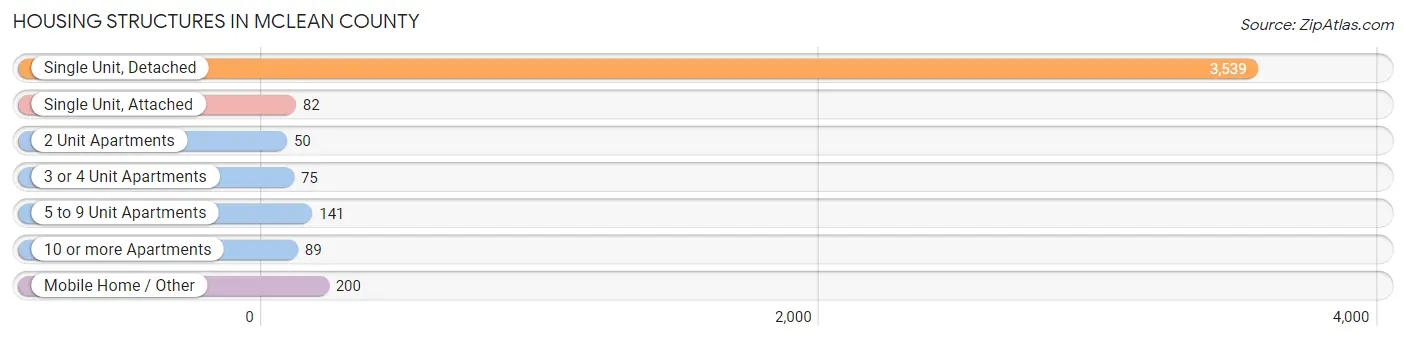
| Structure Type | # Housing Units | % Housing Units |
| Single Unit, Detached | 3,539 | 84.8% |
| Single Unit, Attached | 82 | 2.0% |
| 2 Unit Apartments | 50 | 1.2% |
| 3 or 4 Unit Apartments | 75 | 1.8% |
| 5 to 9 Unit Apartments | 141 | 3.4% |
| 10 or more Apartments | 89 | 2.1% |
| Mobile Home / Other | 200 | 4.8% |
| Total | 4,176 | 100.0% |
Housing Structures by Occupancy in McLean County
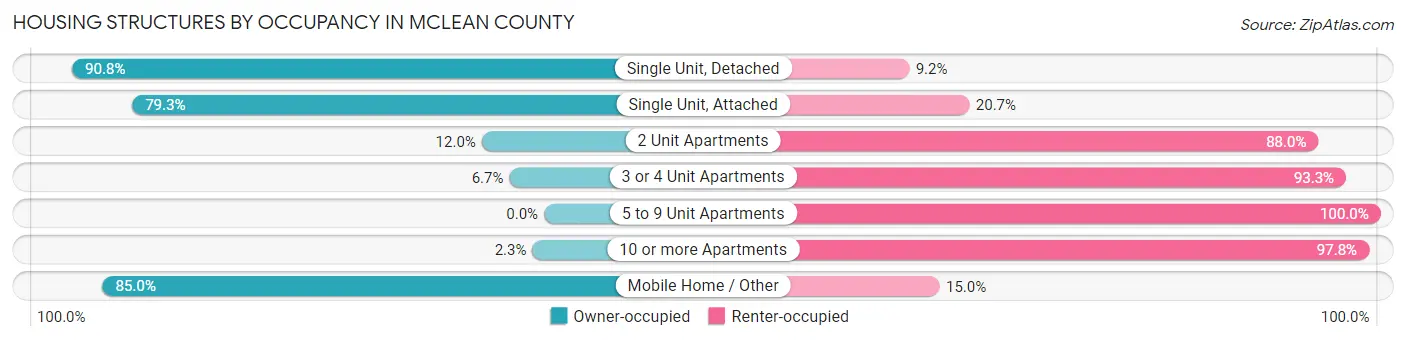
| Structure Type | Owner-occupied | Renter-occupied |
| Single Unit, Detached | 3,215 (90.8%) | 324 (9.2%) |
| Single Unit, Attached | 65 (79.3%) | 17 (20.7%) |
| 2 Unit Apartments | 6 (12.0%) | 44 (88.0%) |
| 3 or 4 Unit Apartments | 5 (6.7%) | 70 (93.3%) |
| 5 to 9 Unit Apartments | 0 (0.0%) | 141 (100.0%) |
| 10 or more Apartments | 2 (2.2%) | 87 (97.8%) |
| Mobile Home / Other | 170 (85.0%) | 30 (15.0%) |
| Total | 3,463 (82.9%) | 713 (17.1%) |
Housing Structures by Number of Rooms in McLean County
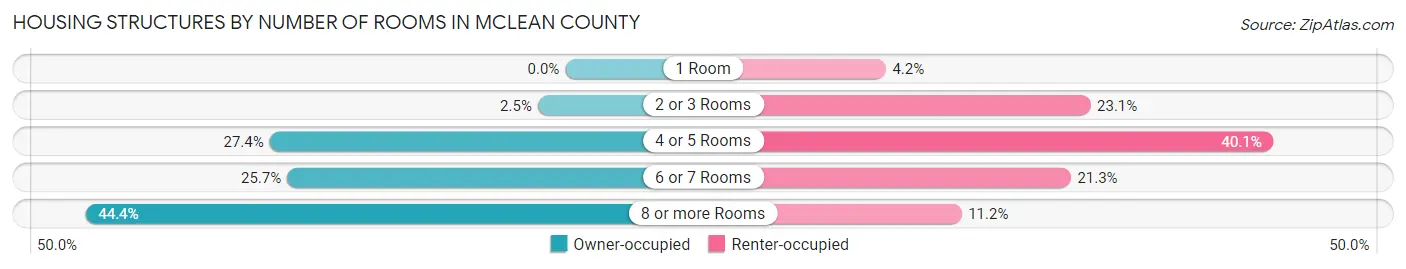
| Number of Rooms | Owner-occupied | Renter-occupied |
| 1 Room | 0 (0.0%) | 30 (4.2%) |
| 2 or 3 Rooms | 88 (2.5%) | 165 (23.1%) |
| 4 or 5 Rooms | 947 (27.4%) | 286 (40.1%) |
| 6 or 7 Rooms | 891 (25.7%) | 152 (21.3%) |
| 8 or more Rooms | 1,537 (44.4%) | 80 (11.2%) |
| Total | 3,463 (100.0%) | 713 (100.0%) |
Housing Structure by Heating Type in McLean County
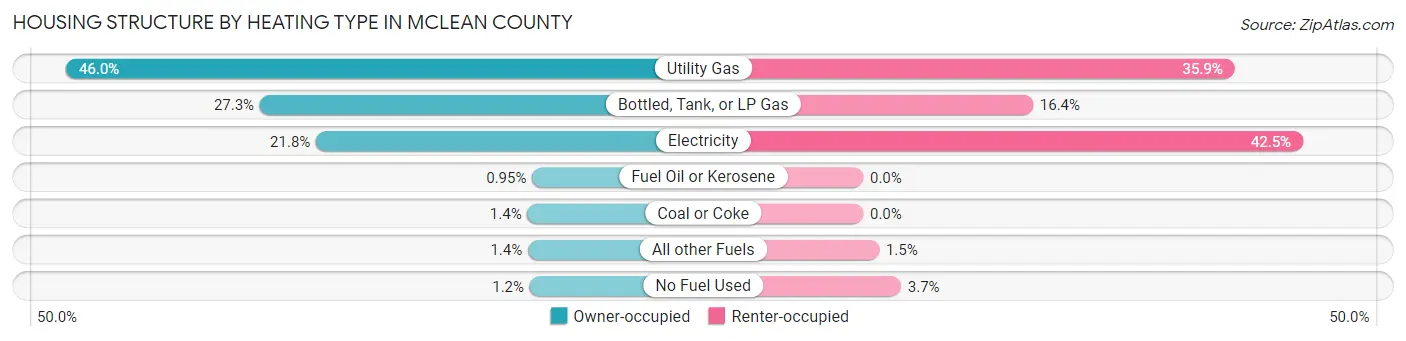
| Heating Type | Owner-occupied | Renter-occupied |
| Utility Gas | 1,593 (46.0%) | 256 (35.9%) |
| Bottled, Tank, or LP Gas | 944 (27.3%) | 117 (16.4%) |
| Electricity | 756 (21.8%) | 303 (42.5%) |
| Fuel Oil or Kerosene | 33 (0.9%) | 0 (0.0%) |
| Coal or Coke | 49 (1.4%) | 0 (0.0%) |
| All other Fuels | 47 (1.4%) | 11 (1.5%) |
| No Fuel Used | 41 (1.2%) | 26 (3.6%) |
| Total | 3,463 (100.0%) | 713 (100.0%) |
Household Vehicle Usage in McLean County
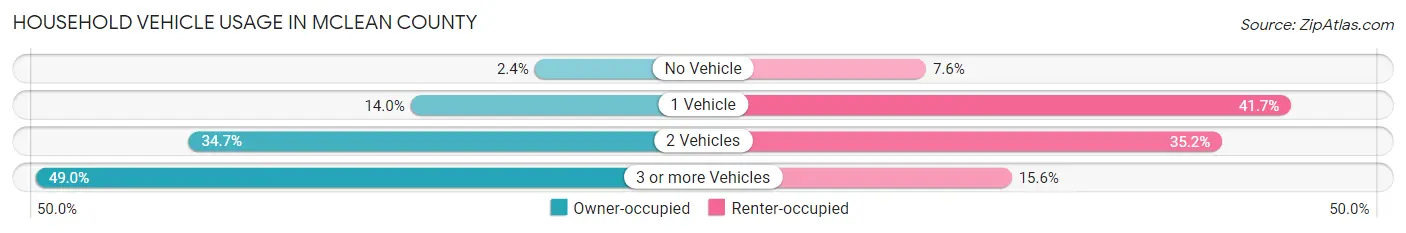
| Vehicles per Household | Owner-occupied | Renter-occupied |
| No Vehicle | 83 (2.4%) | 54 (7.6%) |
| 1 Vehicle | 484 (14.0%) | 297 (41.6%) |
| 2 Vehicles | 1,201 (34.7%) | 251 (35.2%) |
| 3 or more Vehicles | 1,695 (48.9%) | 111 (15.6%) |
| Total | 3,463 (100.0%) | 713 (100.0%) |
Real Estate & Mortgages in McLean County
Real Estate and Mortgage Overview in McLean County
| Characteristic | Without Mortgage | With Mortgage |
| Housing Units | 2,018 | 1,445 |
| Median Property Value | $218,800 | $224,900 |
| Median Household Income | $79,800 | $264 |
| Monthly Housing Costs | $534 | $96 |
| Real Estate Taxes | $1,549 | $29 |
Property Value by Mortgage Status in McLean County
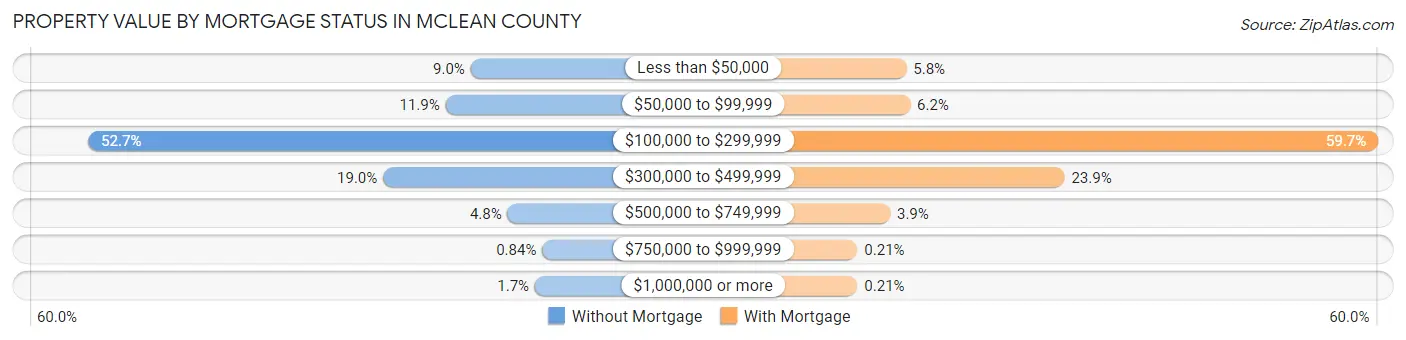
| Property Value | Without Mortgage | With Mortgage |
| Less than $50,000 | 182 (9.0%) | 84 (5.8%) |
| $50,000 to $99,999 | 240 (11.9%) | 90 (6.2%) |
| $100,000 to $299,999 | 1,064 (52.7%) | 863 (59.7%) |
| $300,000 to $499,999 | 384 (19.0%) | 345 (23.9%) |
| $500,000 to $749,999 | 97 (4.8%) | 57 (3.9%) |
| $750,000 to $999,999 | 17 (0.8%) | 3 (0.2%) |
| $1,000,000 or more | 34 (1.7%) | 3 (0.2%) |
| Total | 2,018 (100.0%) | 1,445 (100.0%) |
Household Income by Mortgage Status in McLean County
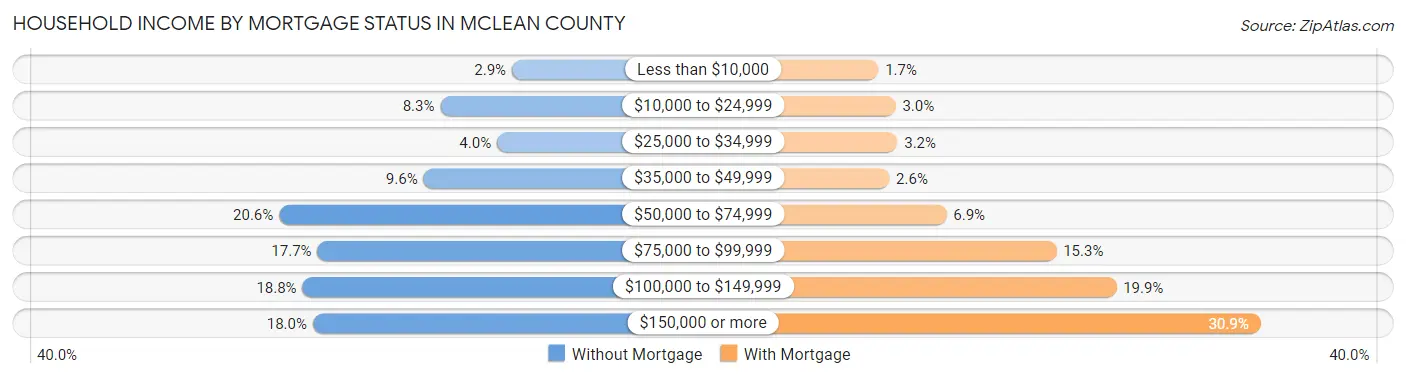
| Household Income | Without Mortgage | With Mortgage |
| Less than $10,000 | 58 (2.9%) | 25 (1.7%) |
| $10,000 to $24,999 | 168 (8.3%) | 44 (3.0%) |
| $25,000 to $34,999 | 81 (4.0%) | 46 (3.2%) |
| $35,000 to $49,999 | 194 (9.6%) | 37 (2.6%) |
| $50,000 to $74,999 | 416 (20.6%) | 100 (6.9%) |
| $75,000 to $99,999 | 357 (17.7%) | 221 (15.3%) |
| $100,000 to $149,999 | 380 (18.8%) | 287 (19.9%) |
| $150,000 or more | 364 (18.0%) | 446 (30.9%) |
| Total | 2,018 (100.0%) | 1,445 (100.0%) |
Property Value to Household Income Ratio in McLean County
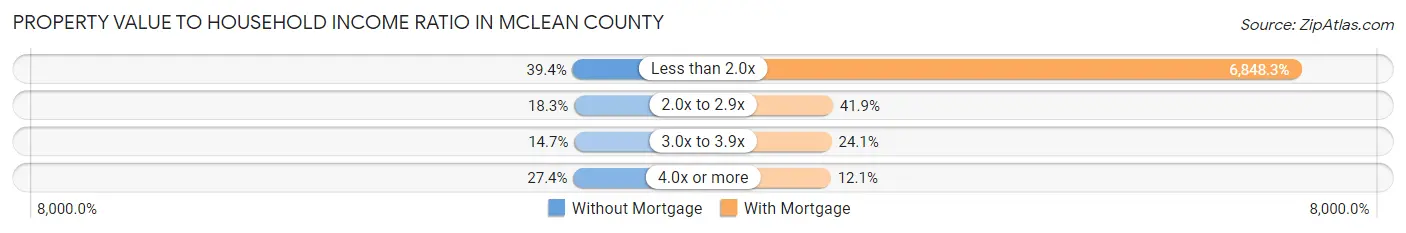
| Value-to-Income Ratio | Without Mortgage | With Mortgage |
| Less than 2.0x | 796 (39.4%) | 98,958 (6,848.3%) |
| 2.0x to 2.9x | 370 (18.3%) | 605 (41.9%) |
| 3.0x to 3.9x | 296 (14.7%) | 348 (24.1%) |
| 4.0x or more | 552 (27.4%) | 175 (12.1%) |
| Total | 2,018 (100.0%) | 1,445 (100.0%) |
Real Estate Taxes by Mortgage Status in McLean County
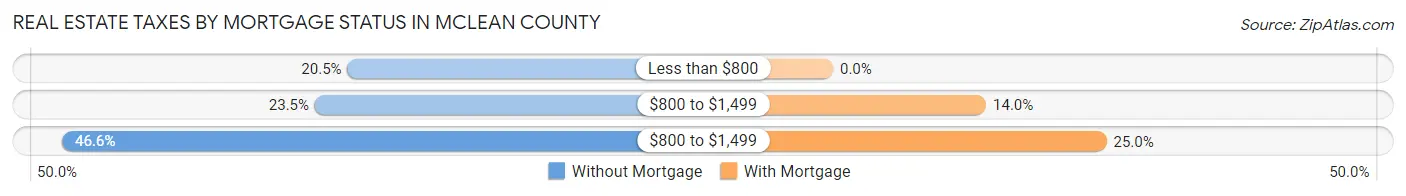
| Property Taxes | Without Mortgage | With Mortgage |
| Less than $800 | 414 (20.5%) | 0 (0.0%) |
| $800 to $1,499 | 474 (23.5%) | 202 (14.0%) |
| $800 to $1,499 | 940 (46.6%) | 361 (25.0%) |
| Total | 2,018 (100.0%) | 1,445 (100.0%) |
Health & Disability in McLean County
Health Insurance Coverage by Age in McLean County
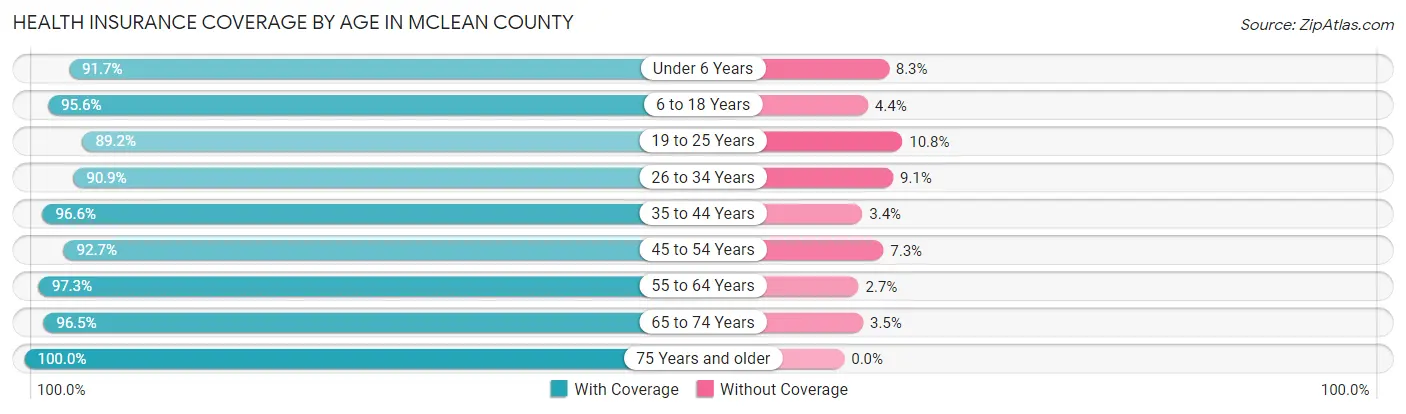
| Age Bracket | With Coverage | Without Coverage |
| Under 6 Years | 608 (91.7%) | 55 (8.3%) |
| 6 to 18 Years | 1,520 (95.6%) | 70 (4.4%) |
| 19 to 25 Years | 437 (89.2%) | 53 (10.8%) |
| 26 to 34 Years | 830 (90.9%) | 83 (9.1%) |
| 35 to 44 Years | 974 (96.6%) | 34 (3.4%) |
| 45 to 54 Years | 994 (92.7%) | 78 (7.3%) |
| 55 to 64 Years | 1,538 (97.3%) | 42 (2.7%) |
| 65 to 74 Years | 1,380 (96.5%) | 50 (3.5%) |
| 75 Years and older | 906 (100.0%) | 0 (0.0%) |
| Total | 9,187 (95.2%) | 465 (4.8%) |
Health Insurance Coverage by Citizenship Status in McLean County
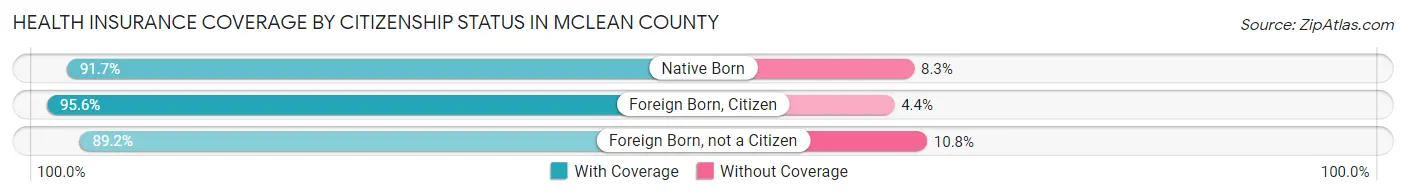
| Citizenship Status | With Coverage | Without Coverage |
| Native Born | 608 (91.7%) | 55 (8.3%) |
| Foreign Born, Citizen | 1,520 (95.6%) | 70 (4.4%) |
| Foreign Born, not a Citizen | 437 (89.2%) | 53 (10.8%) |
Health Insurance Coverage by Household Income in McLean County
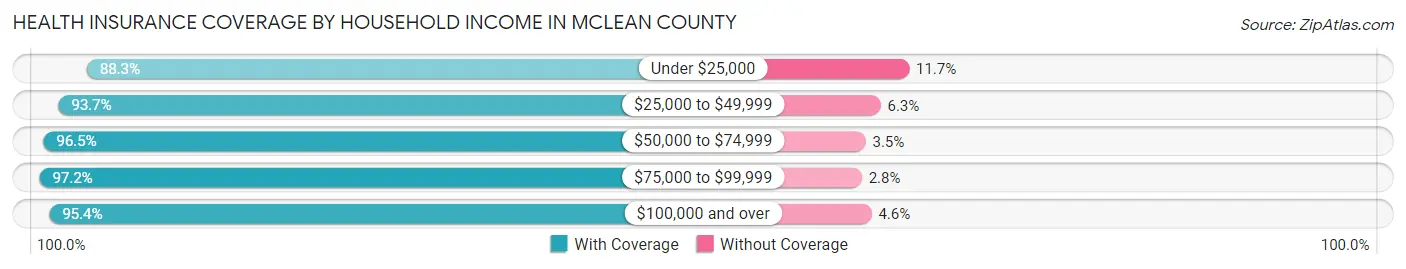
| Household Income | With Coverage | Without Coverage |
| Under $25,000 | 606 (88.3%) | 80 (11.7%) |
| $25,000 to $49,999 | 1,186 (93.7%) | 80 (6.3%) |
| $50,000 to $74,999 | 1,457 (96.5%) | 53 (3.5%) |
| $75,000 to $99,999 | 1,708 (97.2%) | 49 (2.8%) |
| $100,000 and over | 4,194 (95.4%) | 203 (4.6%) |
Public vs Private Health Insurance Coverage by Age in McLean County
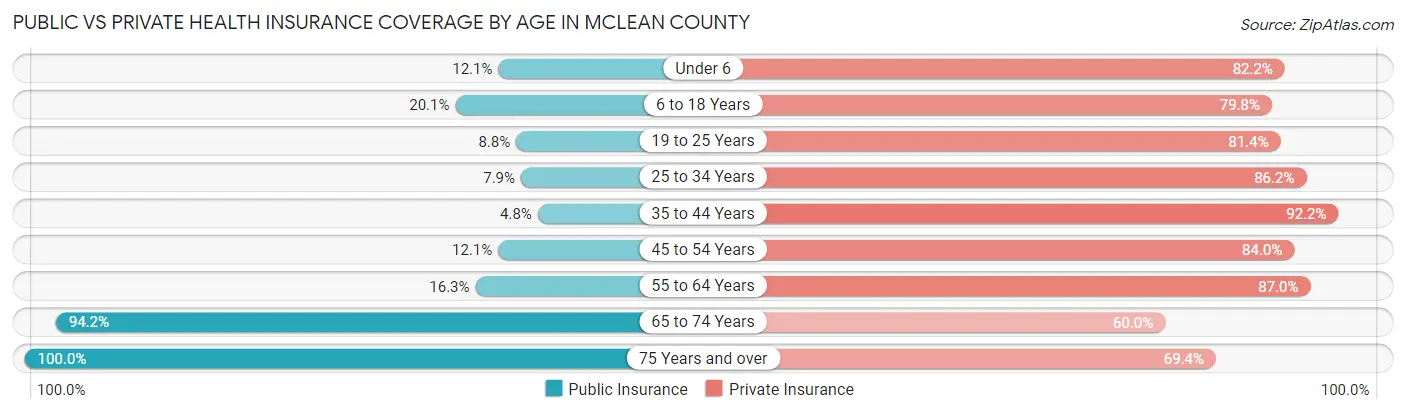
| Age Bracket | Public Insurance | Private Insurance |
| Under 6 | 80 (12.1%) | 545 (82.2%) |
| 6 to 18 Years | 319 (20.1%) | 1,269 (79.8%) |
| 19 to 25 Years | 43 (8.8%) | 399 (81.4%) |
| 25 to 34 Years | 72 (7.9%) | 787 (86.2%) |
| 35 to 44 Years | 48 (4.8%) | 929 (92.2%) |
| 45 to 54 Years | 130 (12.1%) | 900 (84.0%) |
| 55 to 64 Years | 258 (16.3%) | 1,374 (87.0%) |
| 65 to 74 Years | 1,347 (94.2%) | 858 (60.0%) |
| 75 Years and over | 906 (100.0%) | 629 (69.4%) |
| Total | 3,203 (33.2%) | 7,690 (79.7%) |
Disability Status by Sex by Age in McLean County
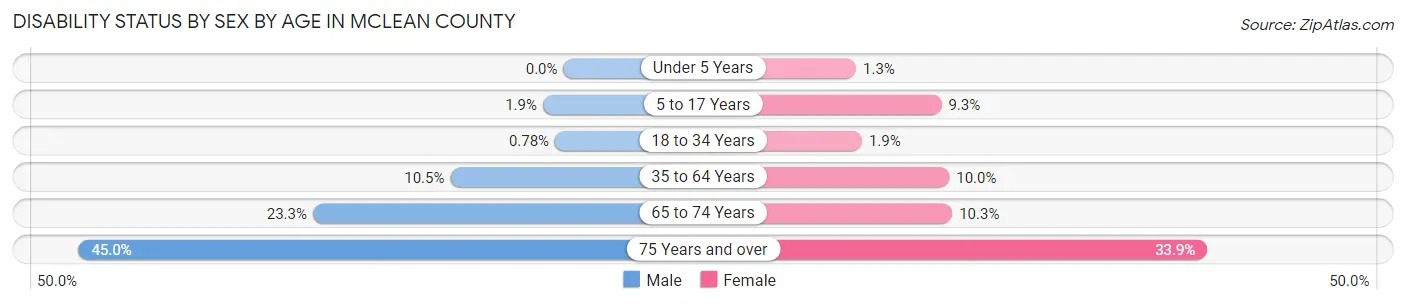
| Age Bracket | Male | Female |
| Under 5 Years | 0 (0.0%) | 3 (1.3%) |
| 5 to 17 Years | 16 (1.9%) | 72 (9.2%) |
| 18 to 34 Years | 6 (0.8%) | 14 (1.9%) |
| 35 to 64 Years | 200 (10.5%) | 175 (10.0%) |
| 65 to 74 Years | 176 (23.3%) | 69 (10.2%) |
| 75 Years and over | 198 (45.0%) | 158 (33.9%) |
Disability Class by Sex by Age in McLean County
Disability Class: Hearing Difficulty
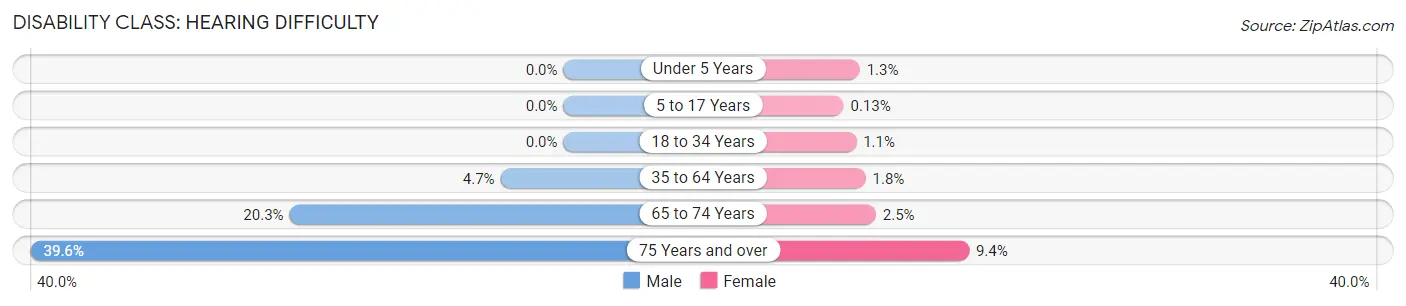
| Age Bracket | Male | Female |
| Under 5 Years | 0 (0.0%) | 3 (1.3%) |
| 5 to 17 Years | 0 (0.0%) | 1 (0.1%) |
| 18 to 34 Years | 0 (0.0%) | 8 (1.1%) |
| 35 to 64 Years | 89 (4.7%) | 31 (1.8%) |
| 65 to 74 Years | 154 (20.3%) | 17 (2.5%) |
| 75 Years and over | 174 (39.6%) | 44 (9.4%) |
Disability Class: Vision Difficulty
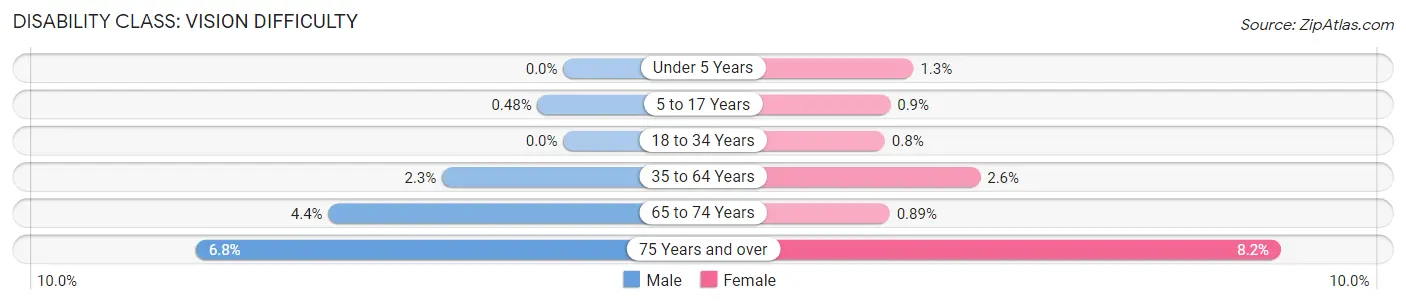
| Age Bracket | Male | Female |
| Under 5 Years | 0 (0.0%) | 3 (1.3%) |
| 5 to 17 Years | 4 (0.5%) | 7 (0.9%) |
| 18 to 34 Years | 0 (0.0%) | 6 (0.8%) |
| 35 to 64 Years | 43 (2.2%) | 45 (2.6%) |
| 65 to 74 Years | 33 (4.4%) | 6 (0.9%) |
| 75 Years and over | 30 (6.8%) | 38 (8.2%) |
Disability Class: Cognitive Difficulty
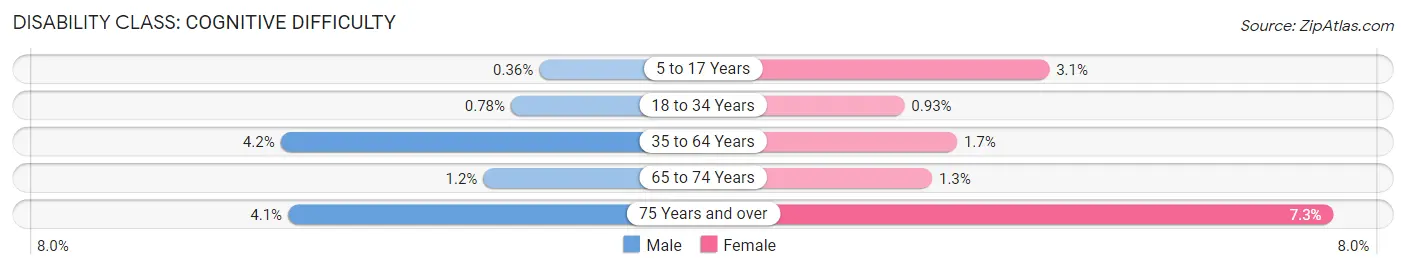
| Age Bracket | Male | Female |
| 5 to 17 Years | 3 (0.4%) | 24 (3.1%) |
| 18 to 34 Years | 6 (0.8%) | 7 (0.9%) |
| 35 to 64 Years | 80 (4.2%) | 30 (1.7%) |
| 65 to 74 Years | 9 (1.2%) | 9 (1.3%) |
| 75 Years and over | 18 (4.1%) | 34 (7.3%) |
Disability Class: Ambulatory Difficulty
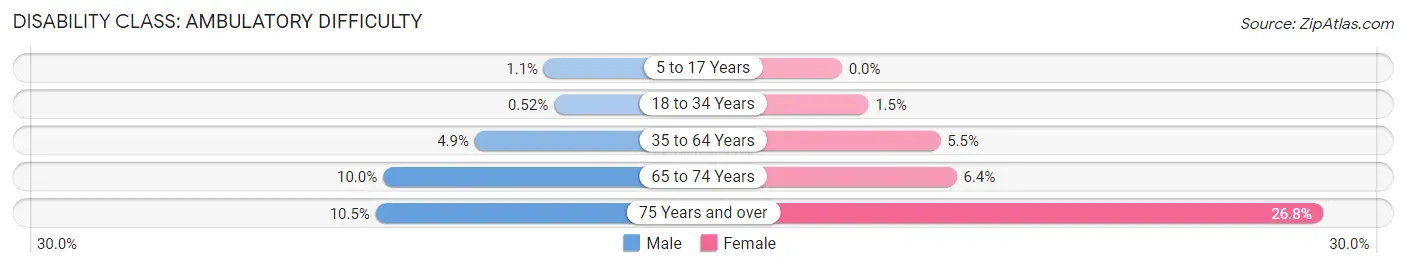
| Age Bracket | Male | Female |
| 5 to 17 Years | 9 (1.1%) | 0 (0.0%) |
| 18 to 34 Years | 4 (0.5%) | 11 (1.5%) |
| 35 to 64 Years | 94 (4.9%) | 96 (5.5%) |
| 65 to 74 Years | 76 (10.0%) | 43 (6.4%) |
| 75 Years and over | 46 (10.4%) | 125 (26.8%) |
Disability Class: Self-Care Difficulty
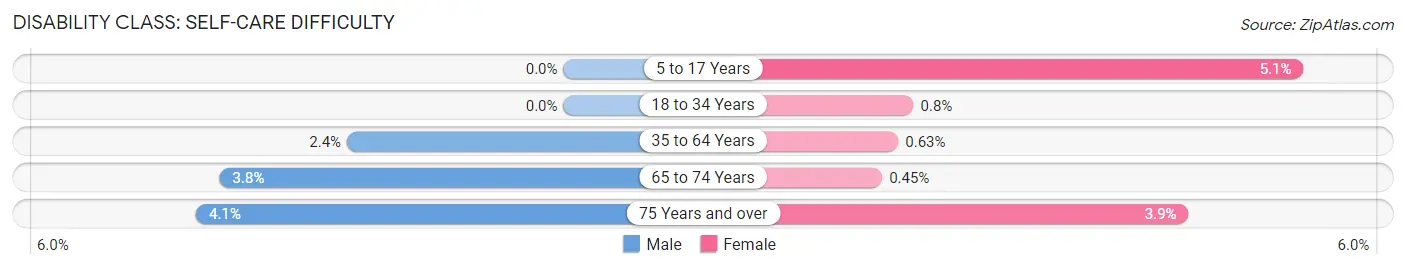
| Age Bracket | Male | Female |
| 5 to 17 Years | 0 (0.0%) | 40 (5.1%) |
| 18 to 34 Years | 0 (0.0%) | 6 (0.8%) |
| 35 to 64 Years | 46 (2.4%) | 11 (0.6%) |
| 65 to 74 Years | 29 (3.8%) | 3 (0.4%) |
| 75 Years and over | 18 (4.1%) | 18 (3.9%) |
Technology Access in McLean County
Computing Device Access in McLean County
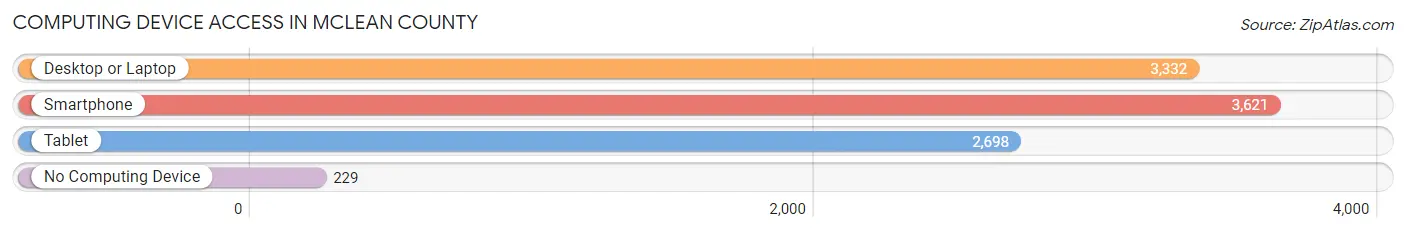
| Device Type | # Households | % Households |
| Desktop or Laptop | 3,332 | 79.8% |
| Smartphone | 3,621 | 86.7% |
| Tablet | 2,698 | 64.6% |
| No Computing Device | 229 | 5.5% |
| Total | 4,176 | 100.0% |
Internet Access in McLean County
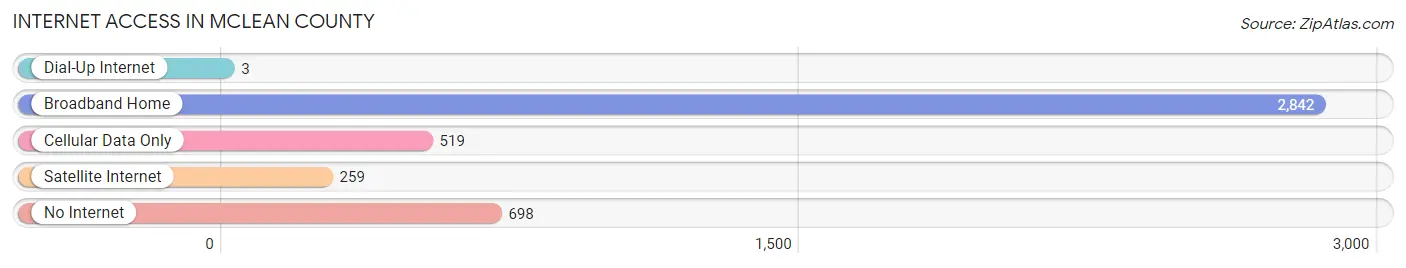
| Internet Type | # Households | % Households |
| Dial-Up Internet | 3 | 0.1% |
| Broadband Home | 2,842 | 68.1% |
| Cellular Data Only | 519 | 12.4% |
| Satellite Internet | 259 | 6.2% |
| No Internet | 698 | 16.7% |
| Total | 4,176 | 100.0% |
McLean County Summary
Mclean County, North Dakota is located in the central part of the state and is bordered by Burleigh County to the north, Mercer County to the east, Oliver County to the south, and Sheridan County to the west. The county seat is Washburn, and the largest city is Underwood. The county was named after James McLean, a former territorial legislator.
Geography
Mclean County is located in the Missouri Plateau region of North Dakota. The county has a total area of 1,845 square miles, of which 1,843 square miles is land and 2.2 square miles is water. The terrain is mostly flat, with rolling hills in the western part of the county. The county is drained by the Little Missouri River and its tributaries. The highest point in the county is located in the southwestern corner, at an elevation of 2,619 feet.
Climate
Mclean County has a semi-arid climate, with cold winters and hot summers. The average annual temperature is 45°F, and the average annual precipitation is 17 inches.
Demographics
As of the 2010 census, there were 7,221 people, 2,845 households, and 1,945 families residing in the county. The population density was 4 people per square mile. The racial makeup of the county was 97.3% White, 0.3% Native American, 0.2% Asian, 0.1% Black or African American, 0.1% Pacific Islander, 0.7% from other races, and 1.3% from two or more races. Hispanic or Latino of any race were 1.7% of the population.
The median income for a household in the county was $45,945, and the median income for a family was $54,945. The per capita income for the county was $21,945. About 8.3% of families and 11.2% of the population were below the poverty line, including 14.2% of those under age 18 and 8.2% of those age 65 or over.
Economy
Mclean County’s economy is largely based on agriculture. The county is home to several large farms, and the main crops grown are wheat, barley, oats, and hay. The county also has a strong manufacturing sector, with several companies producing agricultural equipment, furniture, and other products. The county is also home to several oil and gas wells, and the energy industry is a major contributor to the local economy.
The county is served by several major highways, including Interstate 94, US Highway 83, and North Dakota Highway 200. The county is also served by the BNSF Railway, which runs through the county from east to west.
Conclusion
Mclean County, North Dakota is a rural county located in the central part of the state. The county has a semi-arid climate, and the economy is largely based on agriculture and manufacturing. The county is served by several major highways and the BNSF Railway, and the energy industry is a major contributor to the local economy.
Common Questions
What is the Total Population of McLean County?
Total Population of McLean County is 9,781.
What is the Total Male Population of McLean County?
Total Male Population of McLean County is 5,076.
What is the Total Female Population of McLean County?
Total Female Population of McLean County is 4,705.
What is the Ratio of Males per 100 Females in McLean County?
There are 107.89 Males per 100 Females in McLean County.
What is the Ratio of Females per 100 Males in McLean County?
There are 92.69 Females per 100 Males in McLean County.
What is the Median Population Age in McLean County?
Median Population Age in McLean County is 46.3 Years.
What is the Average Family Size in McLean County
Average Family Size in McLean County is 2.8 People.
What is the Average Household Size in McLean County
Average Household Size in McLean County is 2.3 People.
What is Per Capita Income in McLean County?
Per Capita income in McLean County is $40,448.
What is the Median Family Income in McLean County?
Median Family Income in McLean County is $94,481.
What is the Median Household income in McLean County?
Median Household Income in McLean County is $80,556.
What is Income or Wage Gap in McLean County?
Income or Wage Gap in McLean County is 45.9%.
Women in McLean County earn 54.1 cents for every dollar earned by a man.
What is Inequality or Gini Index in McLean County?
Inequality or Gini Index in McLean County is 0.38.
How Large is the Labor Force in McLean County?
There are 4,556 People in the Labor Forcein in McLean County.
What is the Percentage of People in the Labor Force in McLean County?
58.1% of People are in the Labor Force in McLean County.
What is the Unemployment Rate in McLean County?
Unemployment Rate in McLean County is 1.4%.