McKenzie County, ND
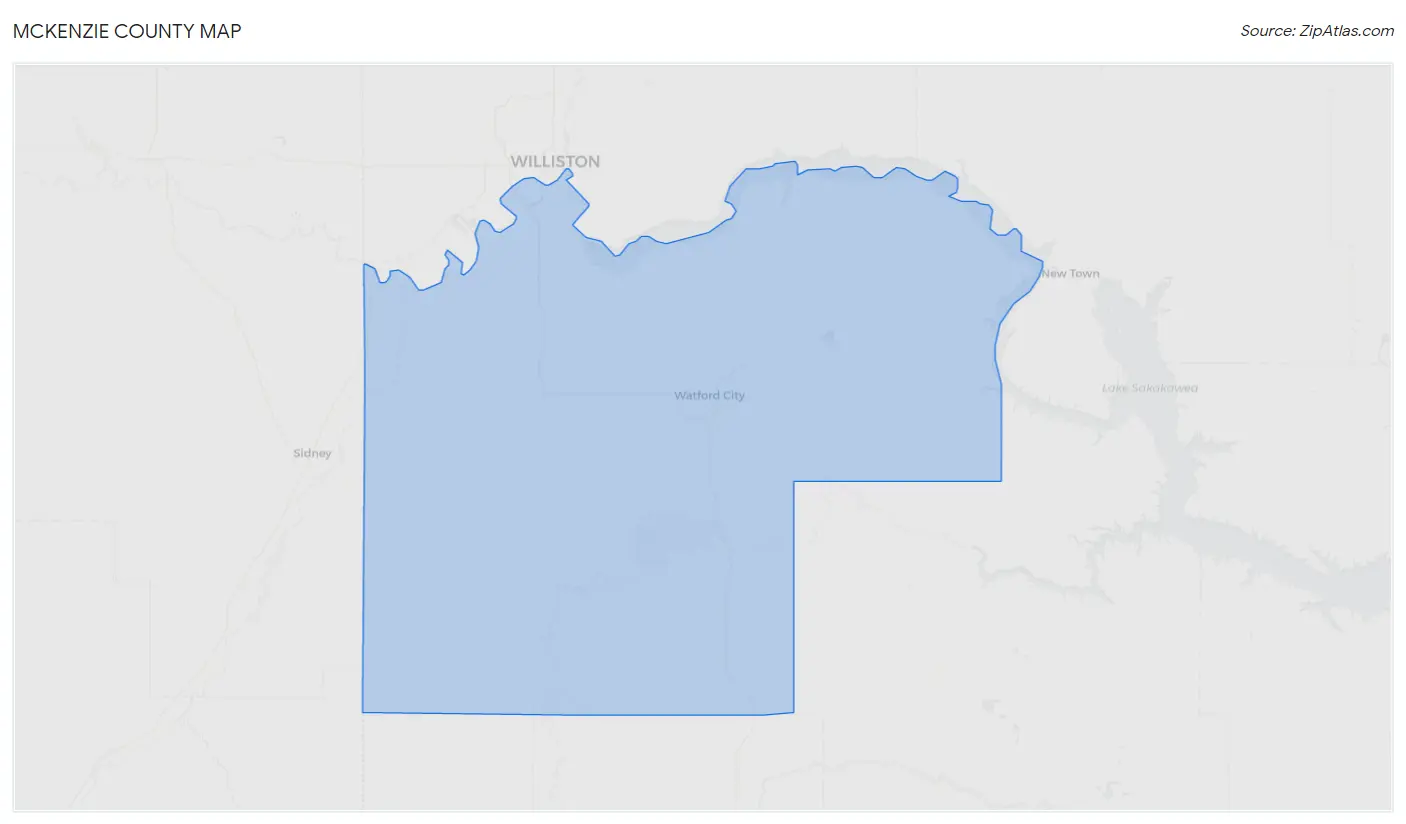
McKenzie County Map
McKenzie County Overview
14,081
TOTAL POPULATION
7,684
MALE POPULATION
6,397
FEMALE POPULATION
120.12
MALES / 100 FEMALES
83.25
FEMALES / 100 MALES
30.5
MEDIAN AGE
3.3
AVG FAMILY SIZE
2.6
AVG HOUSEHOLD SIZE
$44,409
PER CAPITA INCOME
$102,045
AVG FAMILY INCOME
$83,813
AVG HOUSEHOLD INCOME
41.3%
WAGE / INCOME GAP [ % ]
58.7¢/ $1
WAGE / INCOME GAP [ $ ]
0.47
INEQUALITY / GINI INDEX
6,863
LABOR FORCE [ PEOPLE ]
69.2%
PERCENT IN LABOR FORCE
1.7%
UNEMPLOYMENT RATE
McKenzie County Area Codes
Race in McKenzie County
The most populous races in McKenzie County are White / Caucasian (11,236 | 79.8%), Native / Alaskan (1,507 | 10.7%), and Hispanic or Latino (1,488 | 10.6%).
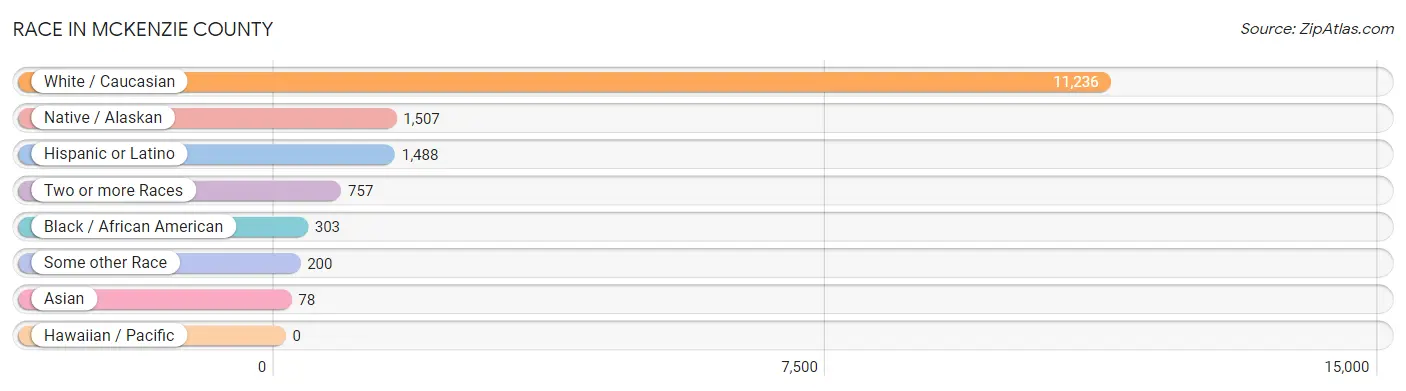
| Race | # Population | % Population |
| Asian | 78 | 0.5% |
| Black / African American | 303 | 2.1% |
| Hawaiian / Pacific | 0 | 0.0% |
| Hispanic or Latino | 1,488 | 10.6% |
| Native / Alaskan | 1,507 | 10.7% |
| White / Caucasian | 11,236 | 79.8% |
| Two or more Races | 757 | 5.4% |
| Some other Race | 200 | 1.4% |
| Total | 14,081 | 100.0% |
Ancestry in McKenzie County
The most populous ancestries reported in McKenzie County are German (2,933 | 20.8%), Norwegian (2,430 | 17.3%), Irish (954 | 6.8%), Mexican (846 | 6.0%), and English (572 | 4.1%), together accounting for 54.9% of all McKenzie County residents.
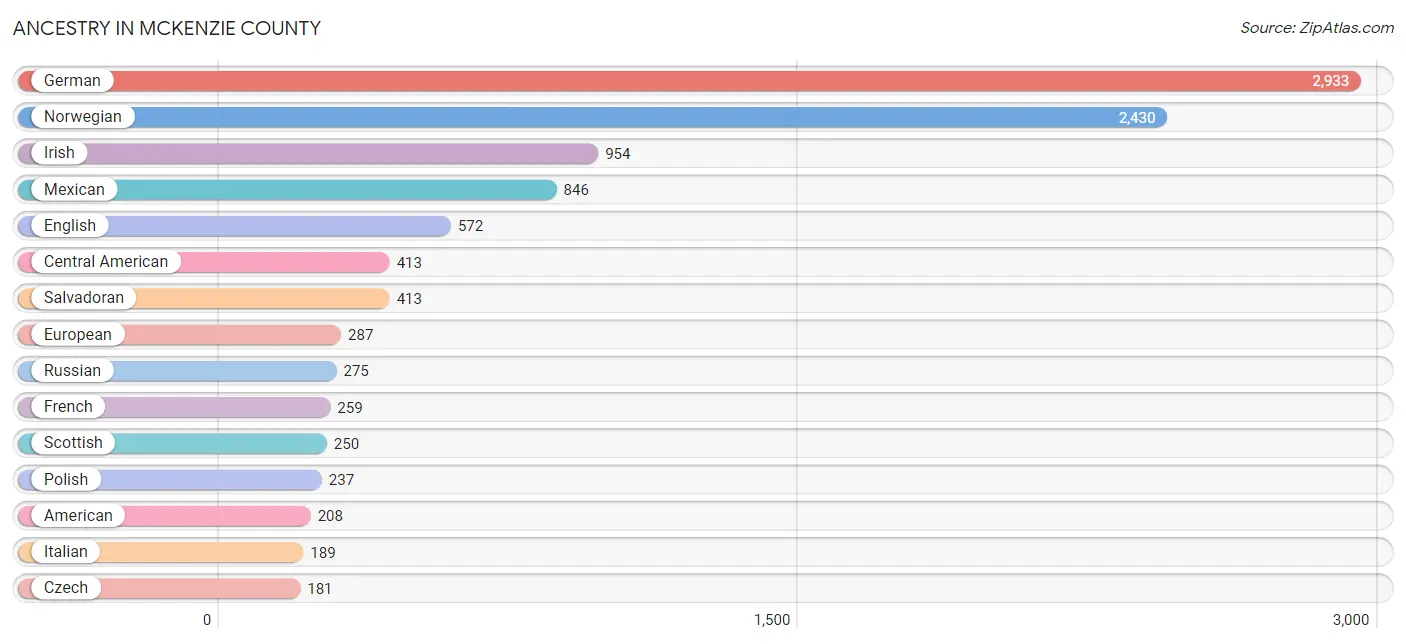
| Ancestry | # Population | % Population |
| African | 2 | 0.0% |
| American | 208 | 1.5% |
| Austrian | 59 | 0.4% |
| Basque | 35 | 0.3% |
| Belgian | 30 | 0.2% |
| Bhutanese | 5 | 0.0% |
| Blackfeet | 16 | 0.1% |
| British | 1 | 0.0% |
| Bulgarian | 5 | 0.0% |
| Canadian | 12 | 0.1% |
| Central American | 413 | 2.9% |
| Central American Indian | 52 | 0.4% |
| Chippewa | 158 | 1.1% |
| Choctaw | 6 | 0.0% |
| Cuban | 3 | 0.0% |
| Czech | 181 | 1.3% |
| Danish | 19 | 0.1% |
| Dutch | 74 | 0.5% |
| Eastern European | 22 | 0.2% |
| English | 572 | 4.1% |
| European | 287 | 2.0% |
| Finnish | 95 | 0.7% |
| French | 259 | 1.8% |
| French Canadian | 51 | 0.4% |
| German | 2,933 | 20.8% |
| German Russian | 26 | 0.2% |
| Hungarian | 28 | 0.2% |
| Indian (Asian) | 14 | 0.1% |
| Irish | 954 | 6.8% |
| Italian | 189 | 1.3% |
| Kiowa | 1 | 0.0% |
| Korean | 118 | 0.8% |
| Menominee | 9 | 0.1% |
| Mexican | 846 | 6.0% |
| Native Hawaiian | 19 | 0.1% |
| Navajo | 148 | 1.1% |
| Norwegian | 2,430 | 17.3% |
| Paiute | 3 | 0.0% |
| Polish | 237 | 1.7% |
| Puerto Rican | 69 | 0.5% |
| Romanian | 20 | 0.1% |
| Russian | 275 | 1.9% |
| Salvadoran | 413 | 2.9% |
| Samoan | 11 | 0.1% |
| Scandinavian | 161 | 1.1% |
| Scotch-Irish | 55 | 0.4% |
| Scottish | 250 | 1.8% |
| Sioux | 95 | 0.7% |
| Spaniard | 18 | 0.1% |
| Spanish | 126 | 0.9% |
| Subsaharan African | 2 | 0.0% |
| Swedish | 181 | 1.3% |
| Thai | 60 | 0.4% |
| Ukrainian | 113 | 0.8% |
| Welsh | 40 | 0.3% |
| West Indian | 2 | 0.0% |
| Yugoslavian | 2 | 0.0% | View All 57 Rows |
Immigrants in McKenzie County
The most numerous immigrant groups reported in McKenzie County came from Latin America (187 | 1.3%), Central America (179 | 1.3%), Mexico (153 | 1.1%), Europe (66 | 0.5%), and Asia (62 | 0.4%), together accounting for 4.6% of all McKenzie County residents.
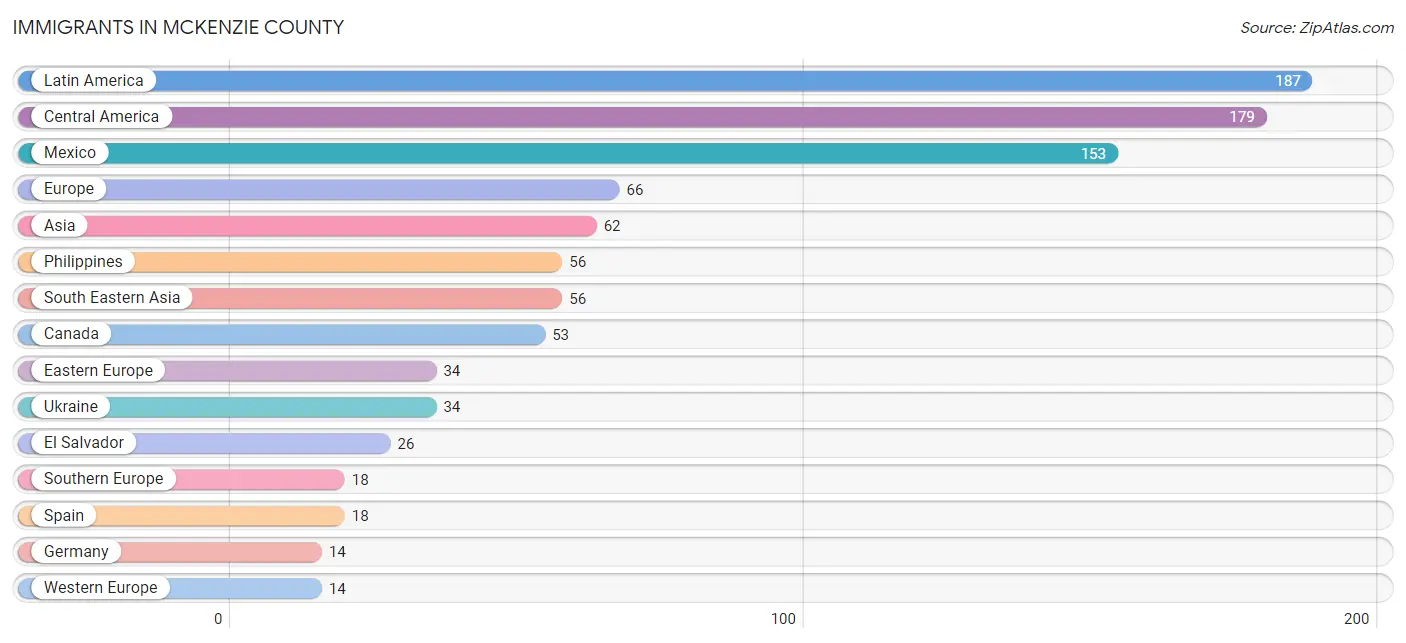
| Immigration Origin | # Population | % Population |
| Asia | 62 | 0.4% |
| Brazil | 8 | 0.1% |
| Canada | 53 | 0.4% |
| Central America | 179 | 1.3% |
| Eastern Europe | 34 | 0.2% |
| El Salvador | 26 | 0.2% |
| Europe | 66 | 0.5% |
| Germany | 14 | 0.1% |
| India | 6 | 0.0% |
| Latin America | 187 | 1.3% |
| Mexico | 153 | 1.1% |
| Philippines | 56 | 0.4% |
| South America | 8 | 0.1% |
| South Central Asia | 6 | 0.0% |
| South Eastern Asia | 56 | 0.4% |
| Southern Europe | 18 | 0.1% |
| Spain | 18 | 0.1% |
| Ukraine | 34 | 0.2% |
| Western Europe | 14 | 0.1% | View All 19 Rows |
Sex and Age in McKenzie County
Sex and Age in McKenzie County
The most populous age groups in McKenzie County are Under 5 Years (880 | 11.5%) for men and 25 to 29 Years (676 | 10.6%) for women.
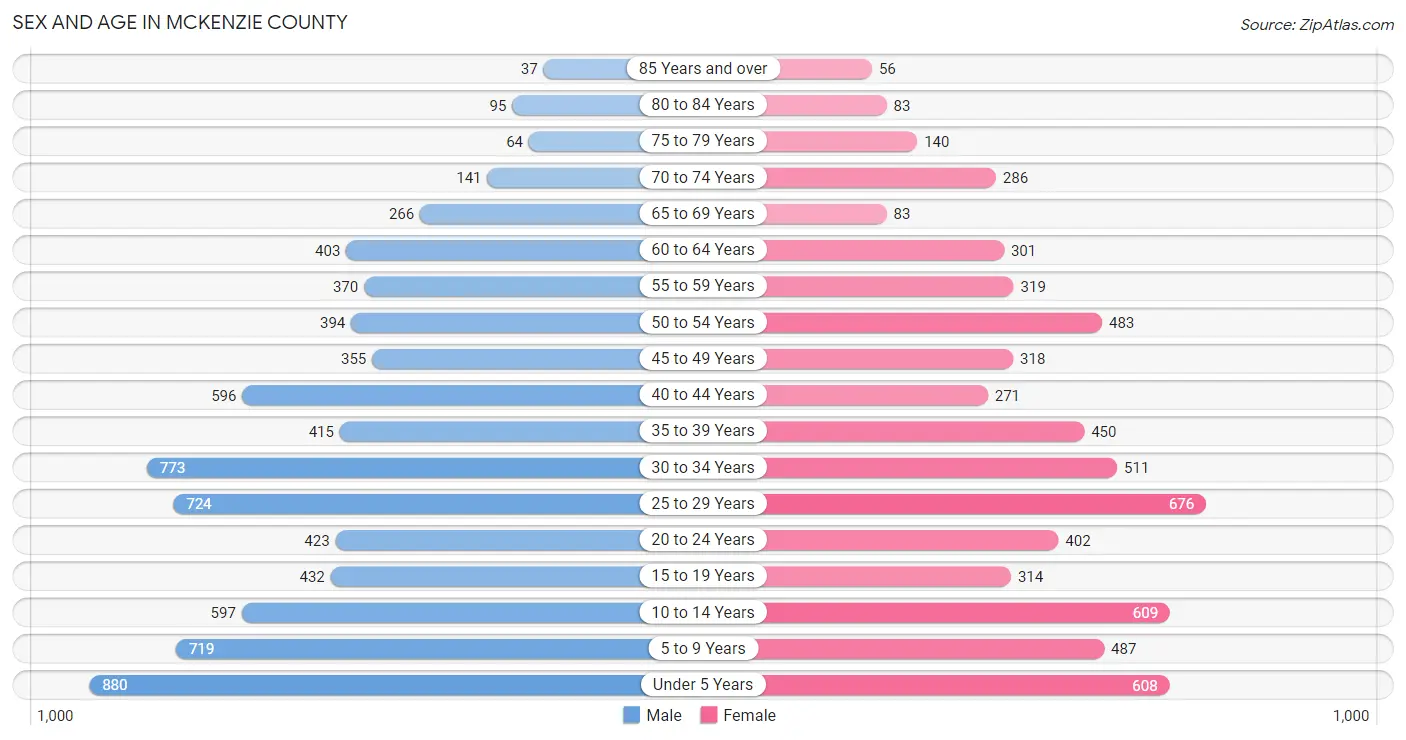
| Age Bracket | Male | Female |
| Under 5 Years | 880 (11.5%) | 608 (9.5%) |
| 5 to 9 Years | 719 (9.4%) | 487 (7.6%) |
| 10 to 14 Years | 597 (7.8%) | 609 (9.5%) |
| 15 to 19 Years | 432 (5.6%) | 314 (4.9%) |
| 20 to 24 Years | 423 (5.5%) | 402 (6.3%) |
| 25 to 29 Years | 724 (9.4%) | 676 (10.6%) |
| 30 to 34 Years | 773 (10.1%) | 511 (8.0%) |
| 35 to 39 Years | 415 (5.4%) | 450 (7.0%) |
| 40 to 44 Years | 596 (7.8%) | 271 (4.2%) |
| 45 to 49 Years | 355 (4.6%) | 318 (5.0%) |
| 50 to 54 Years | 394 (5.1%) | 483 (7.5%) |
| 55 to 59 Years | 370 (4.8%) | 319 (5.0%) |
| 60 to 64 Years | 403 (5.2%) | 301 (4.7%) |
| 65 to 69 Years | 266 (3.5%) | 83 (1.3%) |
| 70 to 74 Years | 141 (1.8%) | 286 (4.5%) |
| 75 to 79 Years | 64 (0.8%) | 140 (2.2%) |
| 80 to 84 Years | 95 (1.2%) | 83 (1.3%) |
| 85 Years and over | 37 (0.5%) | 56 (0.9%) |
| Total | 7,684 (100.0%) | 6,397 (100.0%) |
Families and Households in McKenzie County
Median Family Size in McKenzie County
The median family size in McKenzie County is 3.33 persons per family, with single male/father families (197 | 6.1%) accounting for the largest median family size of 4.46 persons per family. On the other hand, single female/mother families (376 | 11.6%) represent the smallest median family size with 3.03 persons per family.
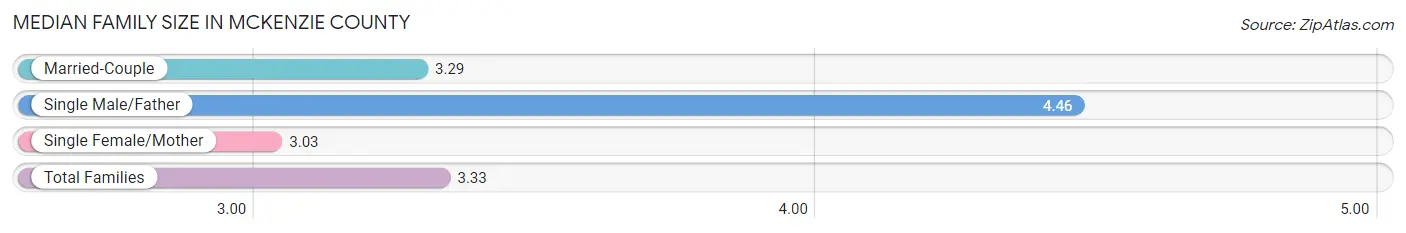
| Family Type | # Families | Family Size |
| Married-Couple | 2,669 (82.3%) | 3.29 |
| Single Male/Father | 197 (6.1%) | 4.46 |
| Single Female/Mother | 376 (11.6%) | 3.03 |
| Total Families | 3,242 (100.0%) | 3.33 |
Median Household Size in McKenzie County
The median household size in McKenzie County is 2.58 persons per household, with single male/father households (197 | 3.7%) accounting for the largest median household size of 5.31 persons per household. non-family households (2,108 | 39.4%) represent the smallest median household size with 1.28 persons per household.
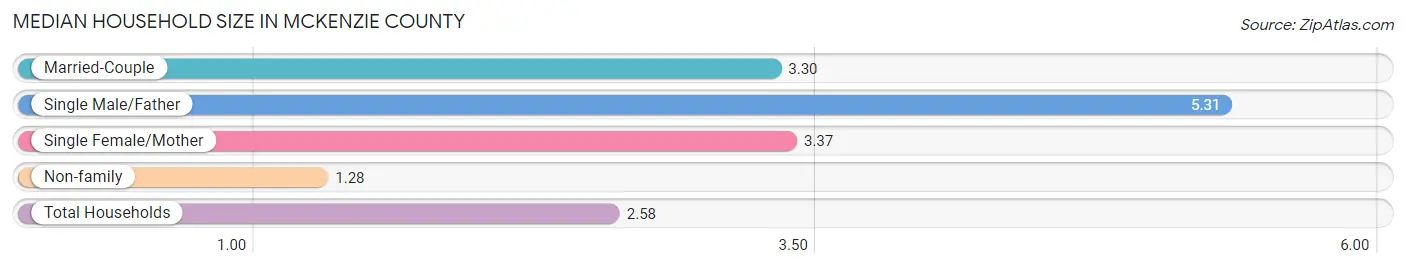
| Household Type | # Households | Household Size |
| Married-Couple | 2,669 (49.9%) | 3.30 |
| Single Male/Father | 197 (3.7%) | 5.31 |
| Single Female/Mother | 376 (7.0%) | 3.37 |
| Non-family | 2,108 (39.4%) | 1.28 |
| Total Households | 5,350 (100.0%) | 2.58 |
Household Size by Marriage Status in McKenzie County
Out of a total of 5,350 households in McKenzie County, 3,242 (60.6%) are family households, while 2,108 (39.4%) are nonfamily households. The most numerous type of family households are 2-person households, comprising 1,312, and the most common type of nonfamily households are 1-person households, comprising 1,599.
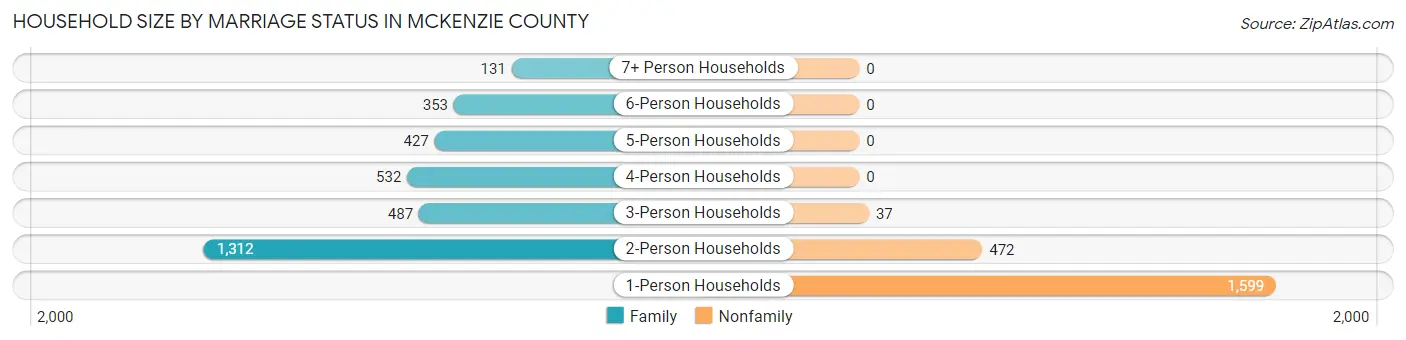
| Household Size | Family Households | Nonfamily Households |
| 1-Person Households | - | 1,599 (29.9%) |
| 2-Person Households | 1,312 (24.5%) | 472 (8.8%) |
| 3-Person Households | 487 (9.1%) | 37 (0.7%) |
| 4-Person Households | 532 (9.9%) | 0 (0.0%) |
| 5-Person Households | 427 (8.0%) | 0 (0.0%) |
| 6-Person Households | 353 (6.6%) | 0 (0.0%) |
| 7+ Person Households | 131 (2.5%) | 0 (0.0%) |
| Total | 3,242 (60.6%) | 2,108 (39.4%) |
Female Fertility in McKenzie County
Fertility by Age in McKenzie County
Average fertility rate in McKenzie County is 85.0 births per 1,000 women. Women in the age bracket of 20 to 34 years have the highest fertility rate with 121.0 births per 1,000 women. Women in the age bracket of 20 to 34 years acount for 71.5% of all women with births.
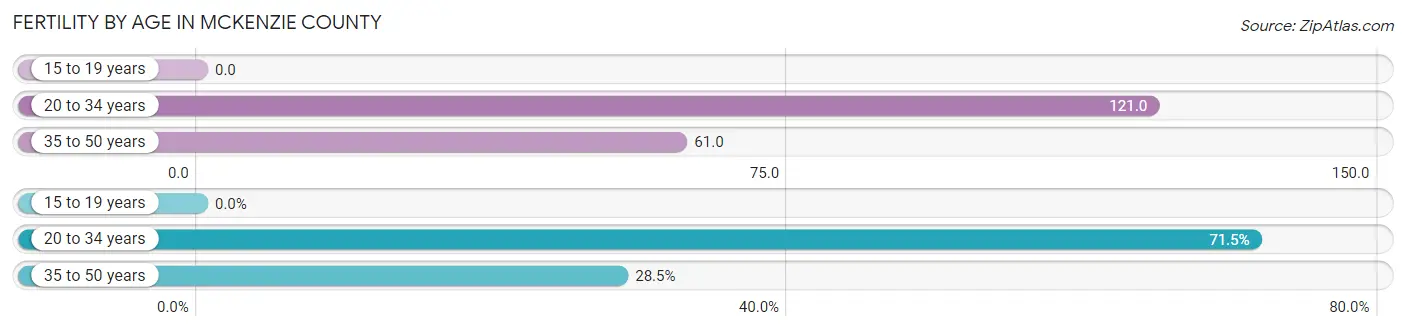
| Age Bracket | Women with Births | Births / 1,000 Women |
| 15 to 19 years | 0 (0.0%) | 0.0 |
| 20 to 34 years | 193 (71.5%) | 121.0 |
| 35 to 50 years | 77 (28.5%) | 61.0 |
| Total | 270 (100.0%) | 85.0 |
Fertility by Age by Marriage Status in McKenzie County
47.4% of women with births (270) in McKenzie County are married. The highest percentage of unmarried women with births falls into 35 to 50 years age bracket with 77.9% of them unmarried at the time of birth, while the lowest percentage of unmarried women with births belong to 20 to 34 years age bracket with 42.5% of them unmarried.
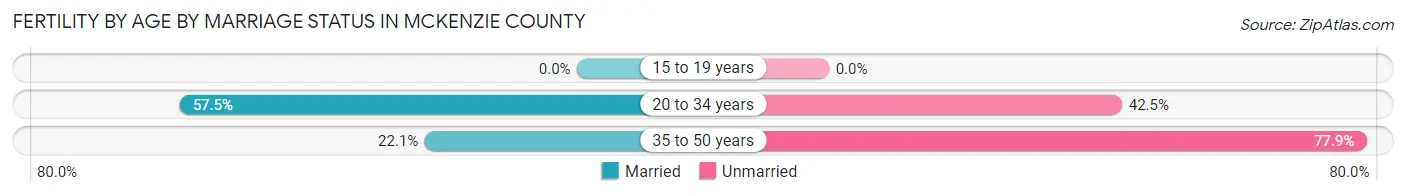
| Age Bracket | Married | Unmarried |
| 15 to 19 years | 0 (0.0%) | 0 (0.0%) |
| 20 to 34 years | 111 (57.5%) | 82 (42.5%) |
| 35 to 50 years | 17 (22.1%) | 60 (77.9%) |
| Total | 128 (47.4%) | 142 (52.6%) |
Fertility by Education in McKenzie County
Average fertility rate in McKenzie County is 85.0 births per 1,000 women. Women with the education attainment of high school diploma have the highest fertility rate of 178.0 births per 1,000 women, while women with the education attainment of less than high school have the lowest fertility at 11.0 births per 1,000 women. Women with the education attainment of high school diploma represent 40.7% of all women with births.
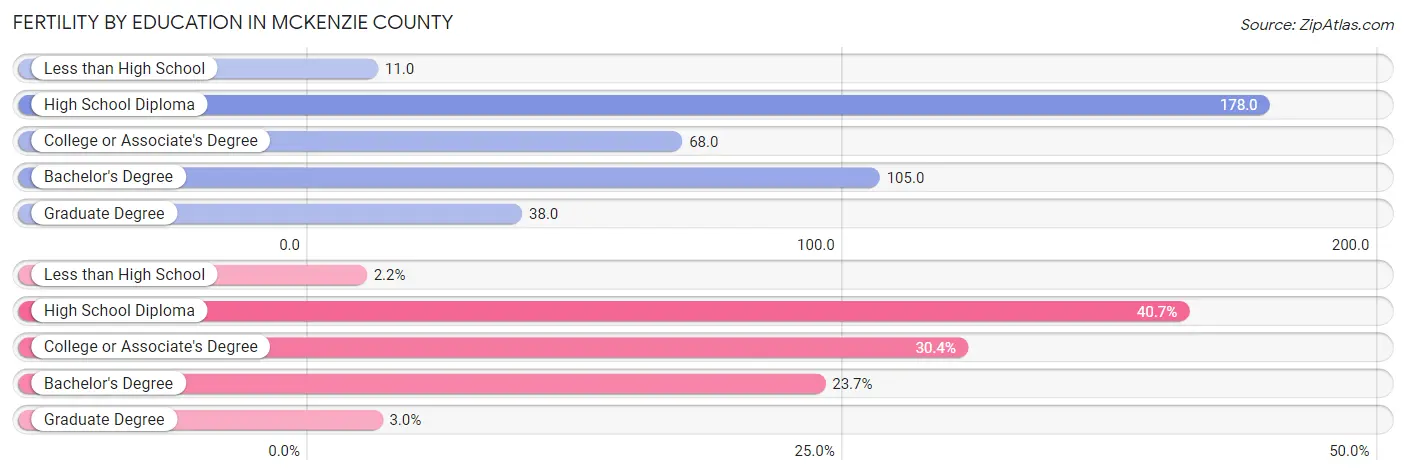
| Educational Attainment | Women with Births | Births / 1,000 Women |
| Less than High School | 6 (2.2%) | 11.0 |
| High School Diploma | 110 (40.7%) | 178.0 |
| College or Associate's Degree | 82 (30.4%) | 68.0 |
| Bachelor's Degree | 64 (23.7%) | 105.0 |
| Graduate Degree | 8 (3.0%) | 38.0 |
| Total | 270 (100.0%) | 85.0 |
Fertility by Education by Marriage Status in McKenzie County
52.6% of women with births in McKenzie County are unmarried. Women with the educational attainment of bachelor's degree are most likely to be married with 100.0% of them married at childbirth, while women with the educational attainment of high school diploma are least likely to be married with 100.0% of them unmarried at childbirth.
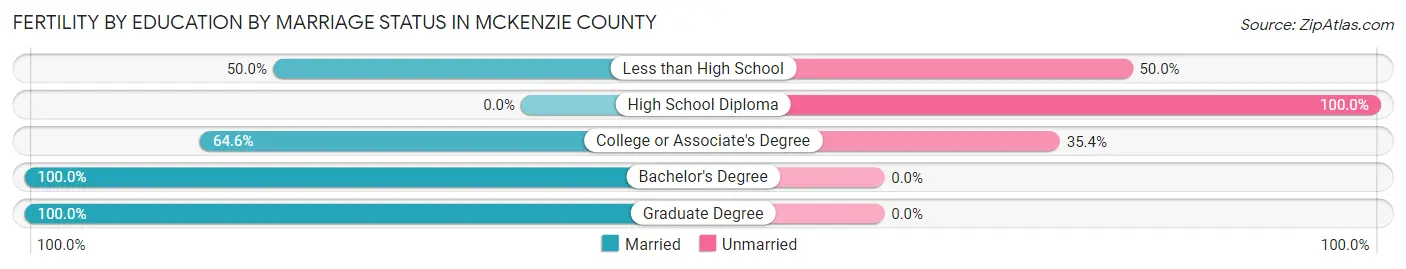
| Educational Attainment | Married | Unmarried |
| Less than High School | 3 (50.0%) | 3 (50.0%) |
| High School Diploma | 0 (0.0%) | 110 (100.0%) |
| College or Associate's Degree | 53 (64.6%) | 29 (35.4%) |
| Bachelor's Degree | 64 (100.0%) | 0 (0.0%) |
| Graduate Degree | 8 (100.0%) | 0 (0.0%) |
| Total | 128 (47.4%) | 142 (52.6%) |
Income in McKenzie County
Income Overview in McKenzie County
Per Capita Income in McKenzie County is $44,409, while median incomes of families and households are $102,045 and $83,813 respectively.
| Characteristic | Number | Measure |
| Per Capita Income | 14,081 | $44,409 |
| Median Family Income | 3,242 | $102,045 |
| Mean Family Income | 3,242 | $140,758 |
| Median Household Income | 5,350 | $83,813 |
| Mean Household Income | 5,350 | $119,287 |
| Income Deficit | 3,242 | $0 |
| Wage / Income Gap (%) | 14,081 | 41.25% |
| Wage / Income Gap ($) | 14,081 | 58.75¢ per $1 |
| Gini / Inequality Index | 14,081 | 0.47 |
Earnings by Sex in McKenzie County
Average Earnings in McKenzie County are $54,902, $69,703 for men and $40,950 for women, a difference of 41.2%.
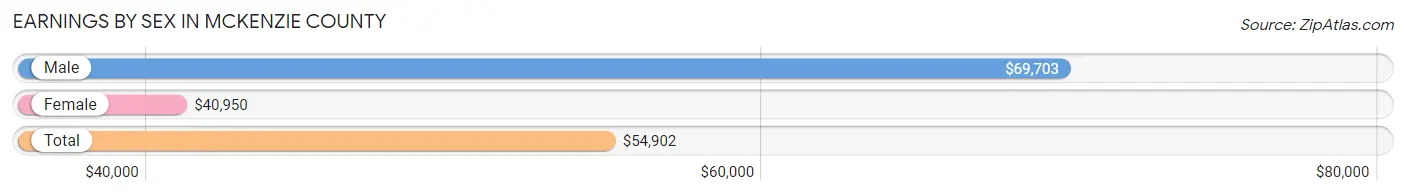
| Sex | Number | Average Earnings |
| Male | 4,263 (58.7%) | $69,703 |
| Female | 3,001 (41.3%) | $40,950 |
| Total | 7,264 (100.0%) | $54,902 |
Earnings by Sex by Income Bracket in McKenzie County
The most common earnings brackets in McKenzie County are $100,000+ for men (1,092 | 25.6%) and $30,000 to $34,999 for women (365 | 12.2%).
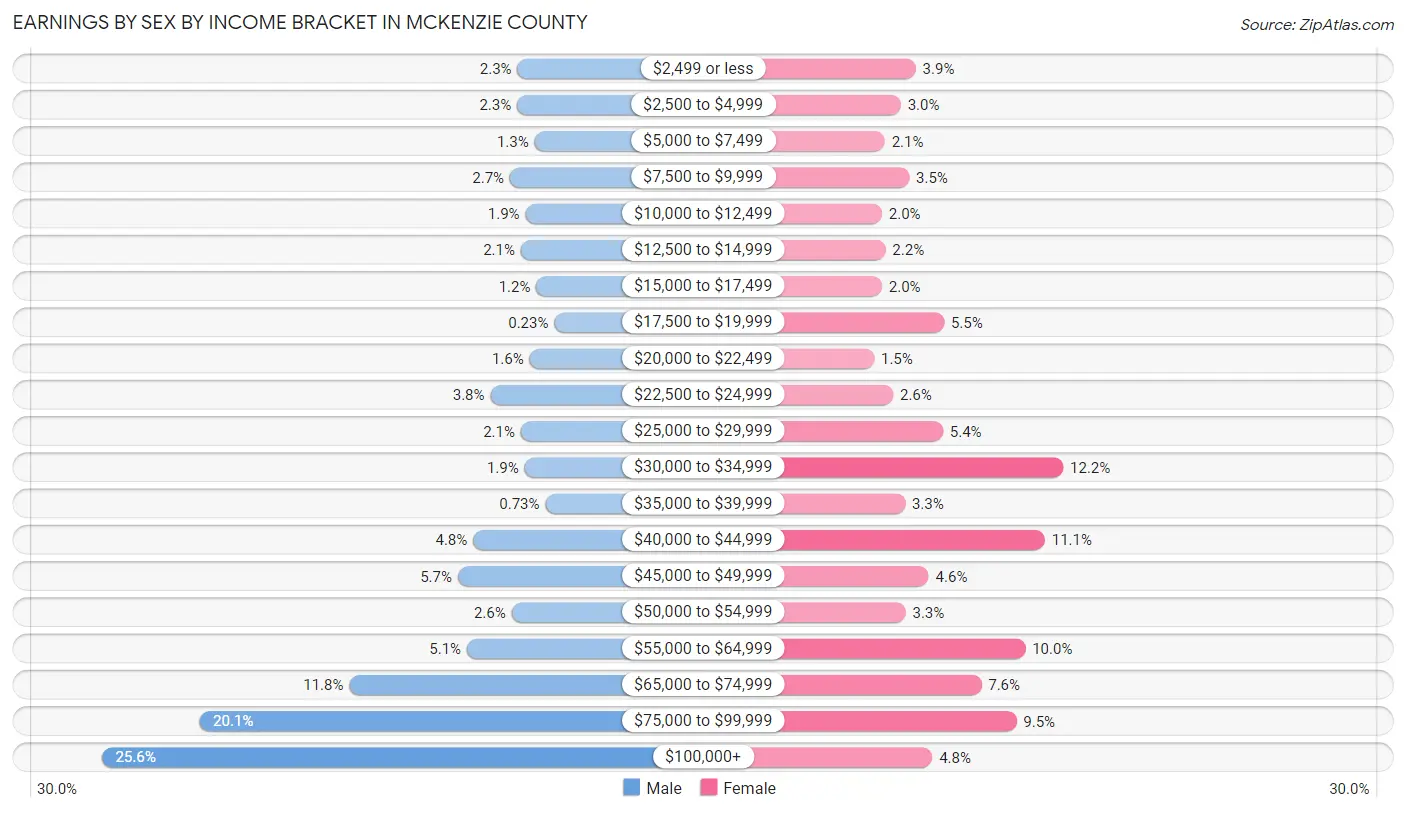
| Income | Male | Female |
| $2,499 or less | 98 (2.3%) | 116 (3.9%) |
| $2,500 to $4,999 | 99 (2.3%) | 91 (3.0%) |
| $5,000 to $7,499 | 57 (1.3%) | 64 (2.1%) |
| $7,500 to $9,999 | 116 (2.7%) | 105 (3.5%) |
| $10,000 to $12,499 | 79 (1.8%) | 59 (2.0%) |
| $12,500 to $14,999 | 90 (2.1%) | 65 (2.2%) |
| $15,000 to $17,499 | 53 (1.2%) | 59 (2.0%) |
| $17,500 to $19,999 | 10 (0.2%) | 164 (5.5%) |
| $20,000 to $22,499 | 69 (1.6%) | 46 (1.5%) |
| $22,500 to $24,999 | 163 (3.8%) | 78 (2.6%) |
| $25,000 to $29,999 | 90 (2.1%) | 162 (5.4%) |
| $30,000 to $34,999 | 81 (1.9%) | 365 (12.2%) |
| $35,000 to $39,999 | 31 (0.7%) | 98 (3.3%) |
| $40,000 to $44,999 | 204 (4.8%) | 334 (11.1%) |
| $45,000 to $49,999 | 241 (5.7%) | 138 (4.6%) |
| $50,000 to $54,999 | 112 (2.6%) | 99 (3.3%) |
| $55,000 to $64,999 | 219 (5.1%) | 301 (10.0%) |
| $65,000 to $74,999 | 501 (11.7%) | 227 (7.6%) |
| $75,000 to $99,999 | 858 (20.1%) | 286 (9.5%) |
| $100,000+ | 1,092 (25.6%) | 144 (4.8%) |
| Total | 4,263 (100.0%) | 3,001 (100.0%) |
Earnings by Sex by Educational Attainment in McKenzie County
Average earnings in McKenzie County are $72,312 for men and $42,233 for women, a difference of 41.6%. Men with an educational attainment of bachelor's degree enjoy the highest average annual earnings of $93,950, while those with college or associate's degree education earn the least with $68,306. Women with an educational attainment of graduate degree earn the most with the average annual earnings of $68,239, while those with high school diploma education have the smallest earnings of $31,411.
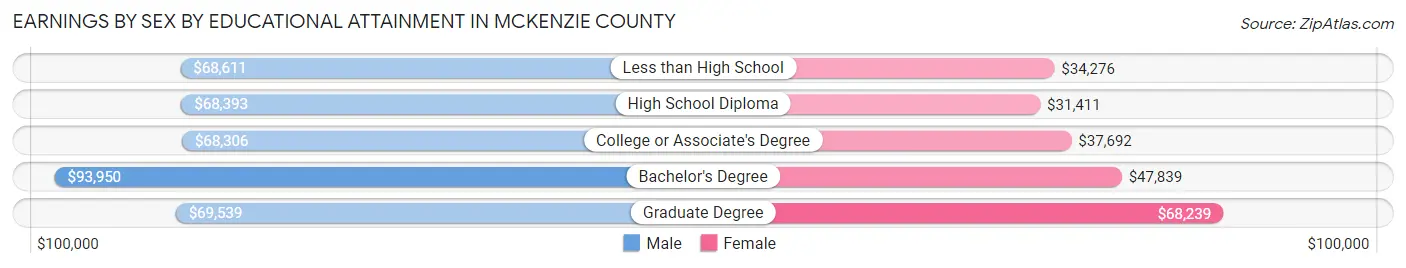
| Educational Attainment | Male Income | Female Income |
| Less than High School | $68,611 | $34,276 |
| High School Diploma | $68,393 | $31,411 |
| College or Associate's Degree | $68,306 | $37,692 |
| Bachelor's Degree | $93,950 | $47,839 |
| Graduate Degree | $69,539 | $68,239 |
| Total | $72,312 | $42,233 |
Family Income in McKenzie County
Family Income Brackets in McKenzie County
According to the McKenzie County family income data, there are 707 families falling into the $100,000 to $149,999 income range, which is the most common income bracket and makes up 21.8% of all families. Conversely, the $10,000 to $14,999 income bracket is the least frequent group with only 32 families (1.0%) belonging to this category.
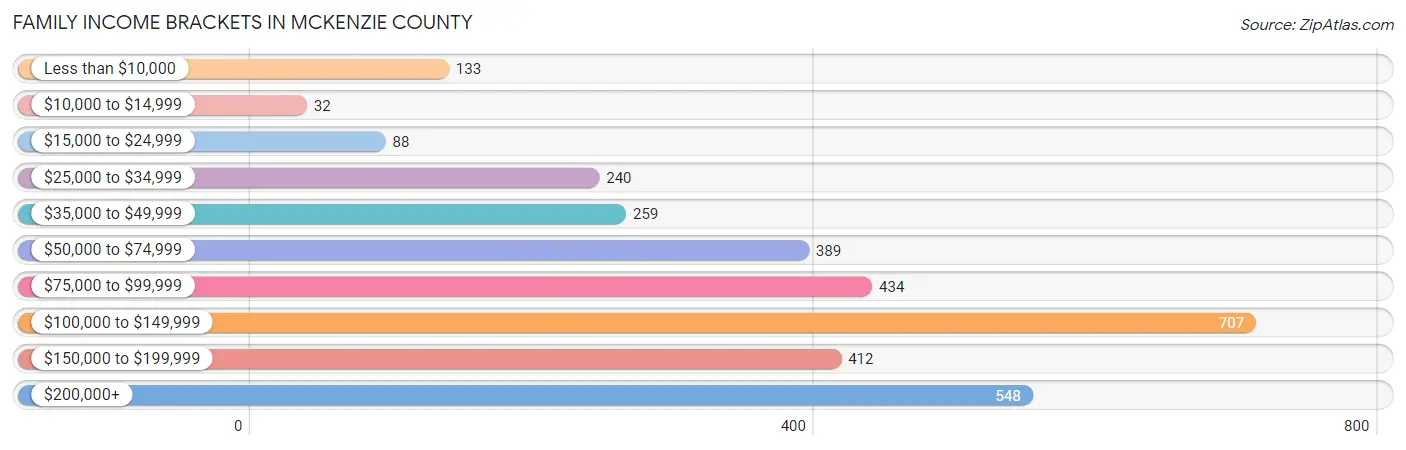
| Income Bracket | # Families | % Families |
| Less than $10,000 | 133 | 4.1% |
| $10,000 to $14,999 | 32 | 1.0% |
| $15,000 to $24,999 | 88 | 2.7% |
| $25,000 to $34,999 | 240 | 7.4% |
| $35,000 to $49,999 | 259 | 8.0% |
| $50,000 to $74,999 | 389 | 12.0% |
| $75,000 to $99,999 | 434 | 13.4% |
| $100,000 to $149,999 | 707 | 21.8% |
| $150,000 to $199,999 | 412 | 12.7% |
| $200,000+ | 548 | 16.9% |
Family Income by Famaliy Size in McKenzie County
4-person families (489 | 15.1%) account for the highest median family income in McKenzie County with $143,083 per family, while 2-person families (1,483 | 45.7%) have the highest median income of $50,670 per family member.
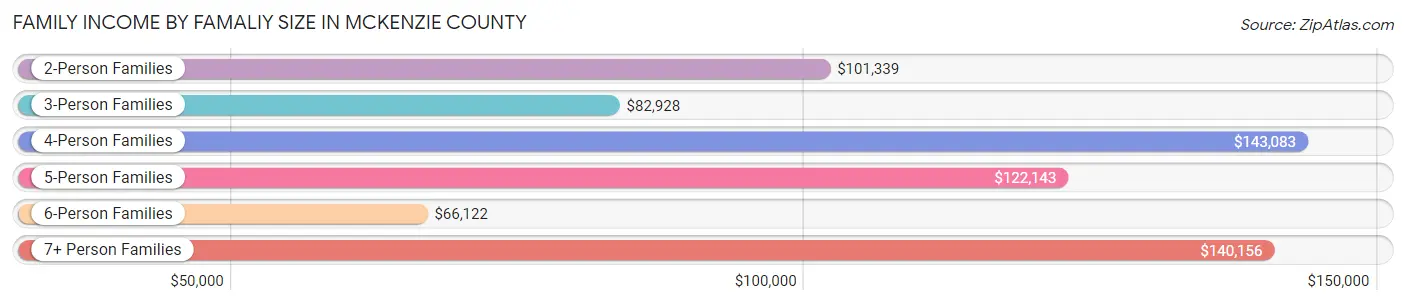
| Income Bracket | # Families | Median Income |
| 2-Person Families | 1,483 (45.7%) | $101,339 |
| 3-Person Families | 391 (12.1%) | $82,928 |
| 4-Person Families | 489 (15.1%) | $143,083 |
| 5-Person Families | 416 (12.8%) | $122,143 |
| 6-Person Families | 428 (13.2%) | $66,122 |
| 7+ Person Families | 35 (1.1%) | $140,156 |
| Total | 3,242 (100.0%) | $102,045 |
Family Income by Number of Earners in McKenzie County
The median family income in McKenzie County is $102,045, with families comprising 3+ earners (215) having the highest median family income of $173,828, while families with no earners (298) have the lowest median family income of $38,250, accounting for 6.6% and 9.2% of families, respectively.
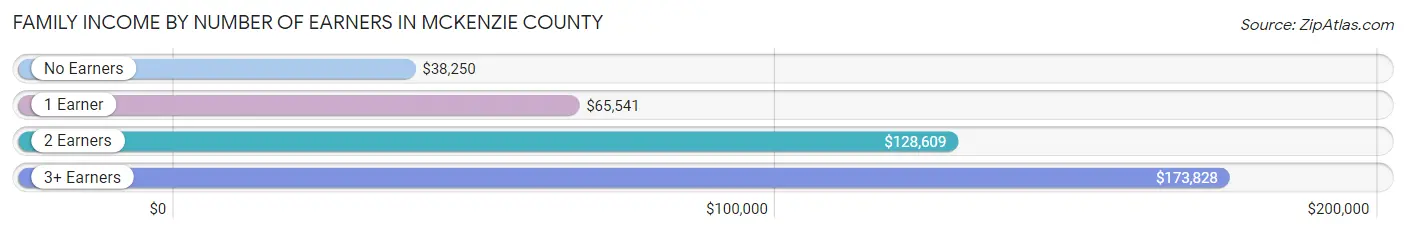
| Number of Earners | # Families | Median Income |
| No Earners | 298 (9.2%) | $38,250 |
| 1 Earner | 1,164 (35.9%) | $65,541 |
| 2 Earners | 1,565 (48.3%) | $128,609 |
| 3+ Earners | 215 (6.6%) | $173,828 |
| Total | 3,242 (100.0%) | $102,045 |
Household Income in McKenzie County
Household Income Brackets in McKenzie County
With 1,059 households falling in the category, the $100,000 to $149,999 income range is the most frequent in McKenzie County, accounting for 19.8% of all households. In contrast, only 70 households (1.3%) fall into the $10,000 to $14,999 income bracket, making it the least populous group.
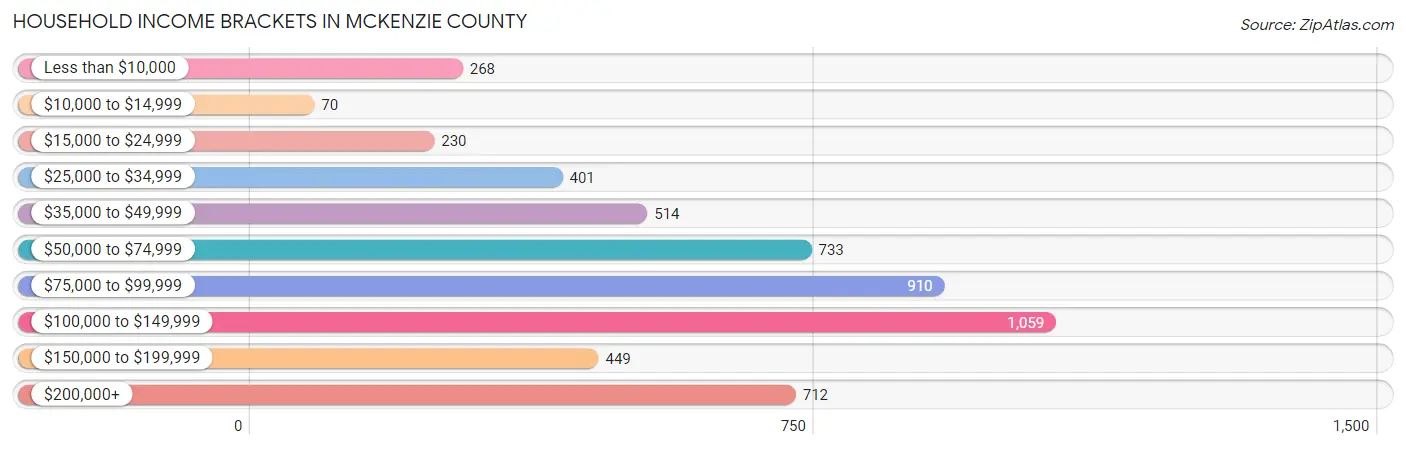
| Income Bracket | # Households | % Households |
| Less than $10,000 | 268 | 5.0% |
| $10,000 to $14,999 | 70 | 1.3% |
| $15,000 to $24,999 | 230 | 4.3% |
| $25,000 to $34,999 | 401 | 7.5% |
| $35,000 to $49,999 | 514 | 9.6% |
| $50,000 to $74,999 | 733 | 13.7% |
| $75,000 to $99,999 | 910 | 17.0% |
| $100,000 to $149,999 | 1,059 | 19.8% |
| $150,000 to $199,999 | 449 | 8.4% |
| $200,000+ | 712 | 13.3% |
Household Income by Householder Age in McKenzie County
The median household income in McKenzie County is $83,813, with the highest median household income of $107,500 found in the 45 to 64 years age bracket for the primary householder. A total of 1,732 households (32.4%) fall into this category. Meanwhile, the 65+ years age bracket for the primary householder has the lowest median household income of $43,333, with 798 households (14.9%) in this group.
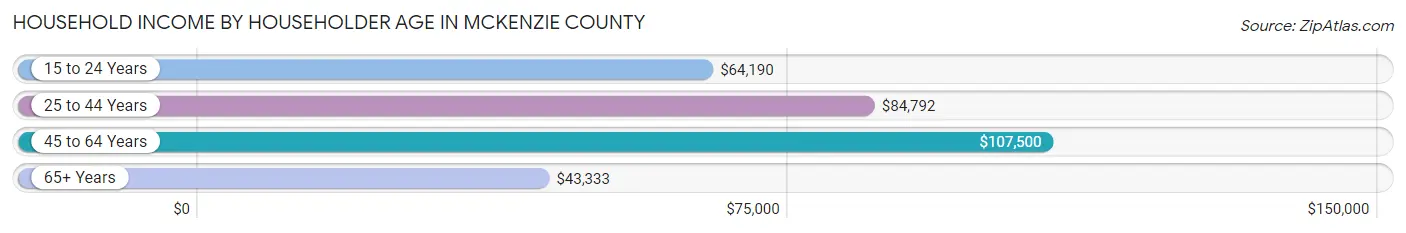
| Income Bracket | # Households | Median Income |
| 15 to 24 Years | 397 (7.4%) | $64,190 |
| 25 to 44 Years | 2,423 (45.3%) | $84,792 |
| 45 to 64 Years | 1,732 (32.4%) | $107,500 |
| 65+ Years | 798 (14.9%) | $43,333 |
| Total | 5,350 (100.0%) | $83,813 |
Poverty in McKenzie County
Income Below Poverty by Sex and Age in McKenzie County
With 14.0% poverty level for males and 12.7% for females among the residents of McKenzie County, 5 year old males and 16 and 17 year old females are the most vulnerable to poverty, with 65 males (45.8%) and 48 females (32.7%) in their respective age groups living below the poverty level.
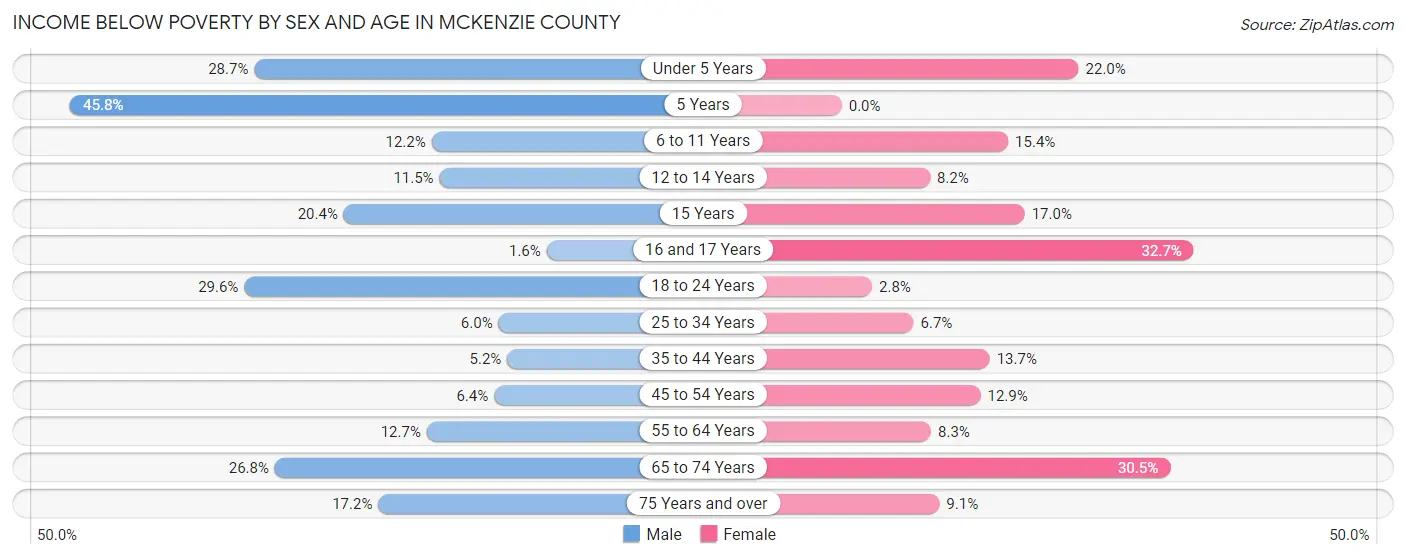
| Age Bracket | Male | Female |
| Under 5 Years | 245 (28.7%) | 129 (22.0%) |
| 5 Years | 65 (45.8%) | 0 (0.0%) |
| 6 to 11 Years | 91 (12.2%) | 105 (15.4%) |
| 12 to 14 Years | 46 (11.5%) | 26 (8.2%) |
| 15 Years | 32 (20.4%) | 18 (17.0%) |
| 16 and 17 Years | 3 (1.5%) | 48 (32.7%) |
| 18 to 24 Years | 149 (29.6%) | 13 (2.8%) |
| 25 to 34 Years | 90 (6.0%) | 79 (6.7%) |
| 35 to 44 Years | 51 (5.2%) | 99 (13.7%) |
| 45 to 54 Years | 48 (6.4%) | 103 (12.9%) |
| 55 to 64 Years | 98 (12.7%) | 51 (8.3%) |
| 65 to 74 Years | 109 (26.8%) | 106 (30.5%) |
| 75 Years and over | 28 (17.2%) | 24 (9.1%) |
| Total | 1,055 (14.0%) | 801 (12.7%) |
Income Above Poverty by Sex and Age in McKenzie County
According to the poverty statistics in McKenzie County, males aged 16 and 17 years and females aged 5 years are the age groups that are most secure financially, with 98.5% of males and 100.0% of females in these age groups living above the poverty line.
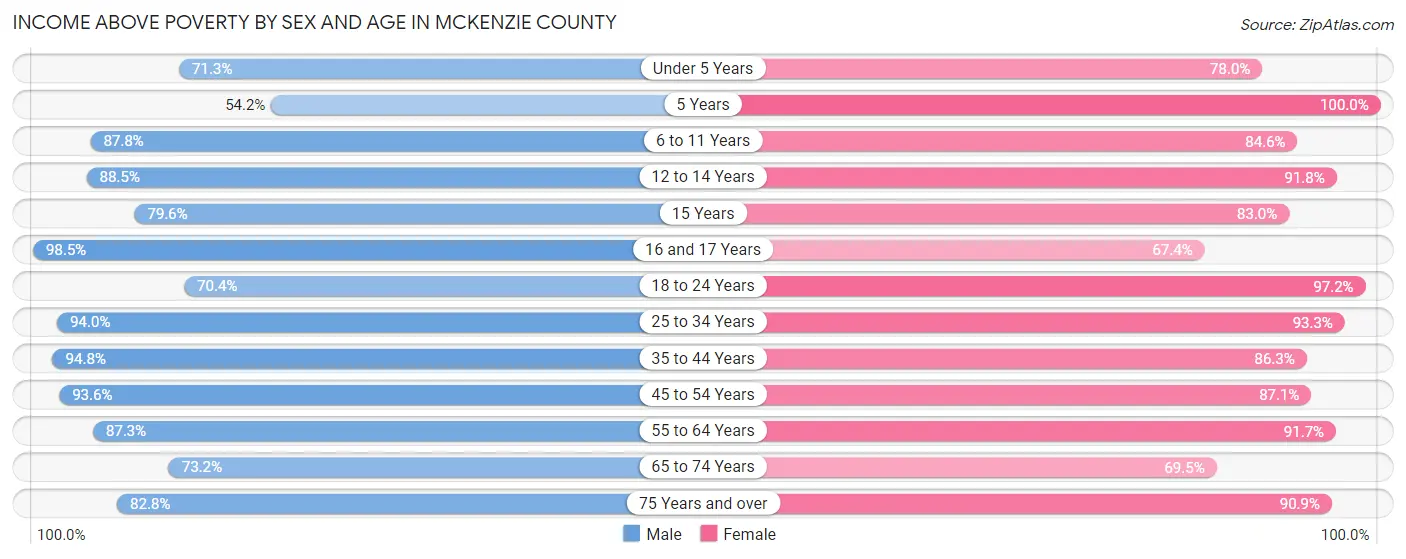
| Age Bracket | Male | Female |
| Under 5 Years | 609 (71.3%) | 458 (78.0%) |
| 5 Years | 77 (54.2%) | 71 (100.0%) |
| 6 to 11 Years | 653 (87.8%) | 575 (84.6%) |
| 12 to 14 Years | 354 (88.5%) | 292 (91.8%) |
| 15 Years | 125 (79.6%) | 88 (83.0%) |
| 16 and 17 Years | 191 (98.5%) | 99 (67.3%) |
| 18 to 24 Years | 354 (70.4%) | 450 (97.2%) |
| 25 to 34 Years | 1,405 (94.0%) | 1,108 (93.3%) |
| 35 to 44 Years | 927 (94.8%) | 622 (86.3%) |
| 45 to 54 Years | 699 (93.6%) | 697 (87.1%) |
| 55 to 64 Years | 675 (87.3%) | 564 (91.7%) |
| 65 to 74 Years | 298 (73.2%) | 242 (69.5%) |
| 75 Years and over | 135 (82.8%) | 241 (90.9%) |
| Total | 6,502 (86.0%) | 5,507 (87.3%) |
Income Below Poverty Among Married-Couple Families in McKenzie County
The poverty statistics for married-couple families in McKenzie County show that 6.8% or 181 of the total 2,669 families live below the poverty line. Families with no children have the highest poverty rate of 7.9%, comprising of 103 families. On the other hand, families with 5 or more children have the lowest poverty rate of 0.0%, which includes 0 families.
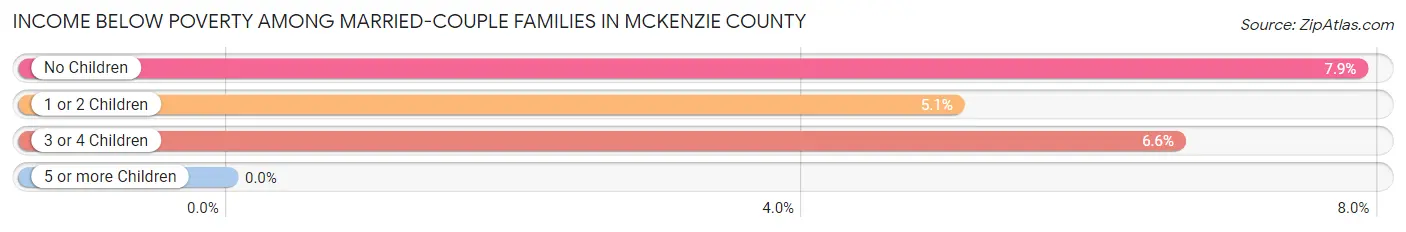
| Children | Above Poverty | Below Poverty |
| No Children | 1,206 (92.1%) | 103 (7.9%) |
| 1 or 2 Children | 675 (94.9%) | 36 (5.1%) |
| 3 or 4 Children | 594 (93.4%) | 42 (6.6%) |
| 5 or more Children | 13 (100.0%) | 0 (0.0%) |
| Total | 2,488 (93.2%) | 181 (6.8%) |
Income Below Poverty Among Single-Parent Households in McKenzie County
According to the poverty data in McKenzie County, 5.6% or 11 single-father households and 22.9% or 86 single-mother households are living below the poverty line. Among single-father households, those with 3 or 4 children have the highest poverty rate, with 11 households (91.7%) experiencing poverty. Likewise, among single-mother households, those with 5 or more children have the highest poverty rate, with 14 households (100.0%) falling below the poverty line.
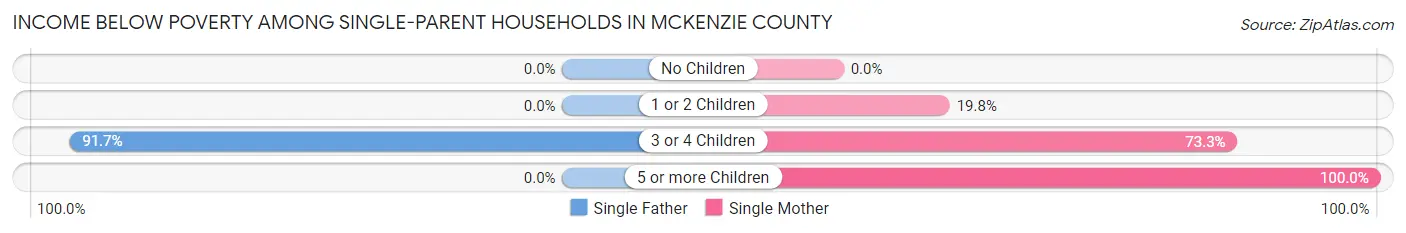
| Children | Single Father | Single Mother |
| No Children | 0 (0.0%) | 0 (0.0%) |
| 1 or 2 Children | 0 (0.0%) | 50 (19.8%) |
| 3 or 4 Children | 11 (91.7%) | 22 (73.3%) |
| 5 or more Children | 0 (0.0%) | 14 (100.0%) |
| Total | 11 (5.6%) | 86 (22.9%) |
Income Below Poverty Among Married-Couple vs Single-Parent Households in McKenzie County
The poverty data for McKenzie County shows that 181 of the married-couple family households (6.8%) and 97 of the single-parent households (16.9%) are living below the poverty level. Within the married-couple family households, those with no children have the highest poverty rate, with 103 households (7.9%) falling below the poverty line. Among the single-parent households, those with 3 or 4 children have the highest poverty rate, with 33 household (78.6%) living below poverty.
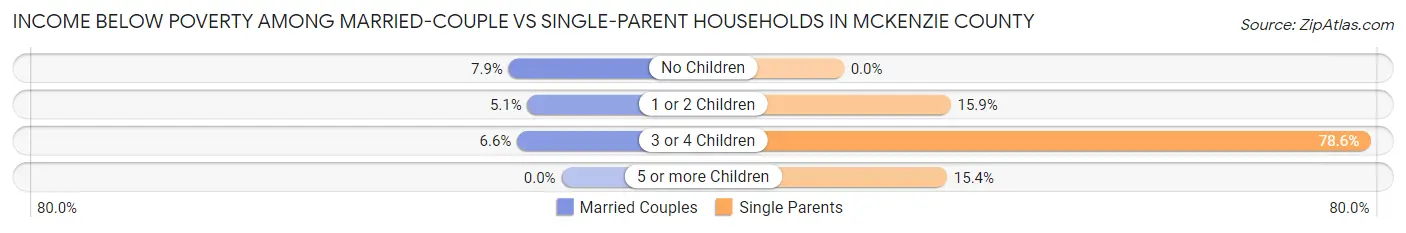
| Children | Married-Couple Families | Single-Parent Households |
| No Children | 103 (7.9%) | 0 (0.0%) |
| 1 or 2 Children | 36 (5.1%) | 50 (15.9%) |
| 3 or 4 Children | 42 (6.6%) | 33 (78.6%) |
| 5 or more Children | 0 (0.0%) | 14 (15.4%) |
| Total | 181 (6.8%) | 97 (16.9%) |
Employment Characteristics in McKenzie County
Employment by Class of Employer in McKenzie County
Among the 6,700 employed individuals in McKenzie County, private company employees (4,491 | 67.0%), local government employees (715 | 10.7%), and self-employed (not incorporated) (567 | 8.5%) make up the most common classes of employment.
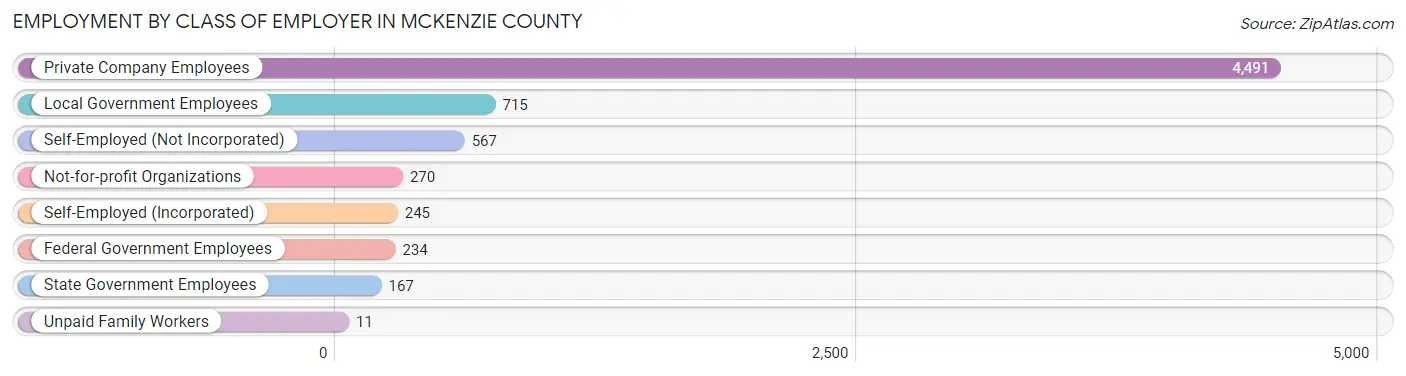
| Employer Class | # Employees | % Employees |
| Private Company Employees | 4,491 | 67.0% |
| Self-Employed (Incorporated) | 245 | 3.7% |
| Self-Employed (Not Incorporated) | 567 | 8.5% |
| Not-for-profit Organizations | 270 | 4.0% |
| Local Government Employees | 715 | 10.7% |
| State Government Employees | 167 | 2.5% |
| Federal Government Employees | 234 | 3.5% |
| Unpaid Family Workers | 11 | 0.2% |
| Total | 6,700 | 100.0% |
Employment Status by Age in McKenzie County
According to the labor force statistics for McKenzie County, out of the total population over 16 years of age (9,918), 69.2% or 6,863 individuals are in the labor force, with 1.7% or 117 of them unemployed. The age group with the highest labor force participation rate is 20 to 24 years, with 92.4% or 762 individuals in the labor force. Within the labor force, the 25 to 29 years age range has the highest percentage of unemployed individuals, with 3.7% or 44 of them being unemployed.
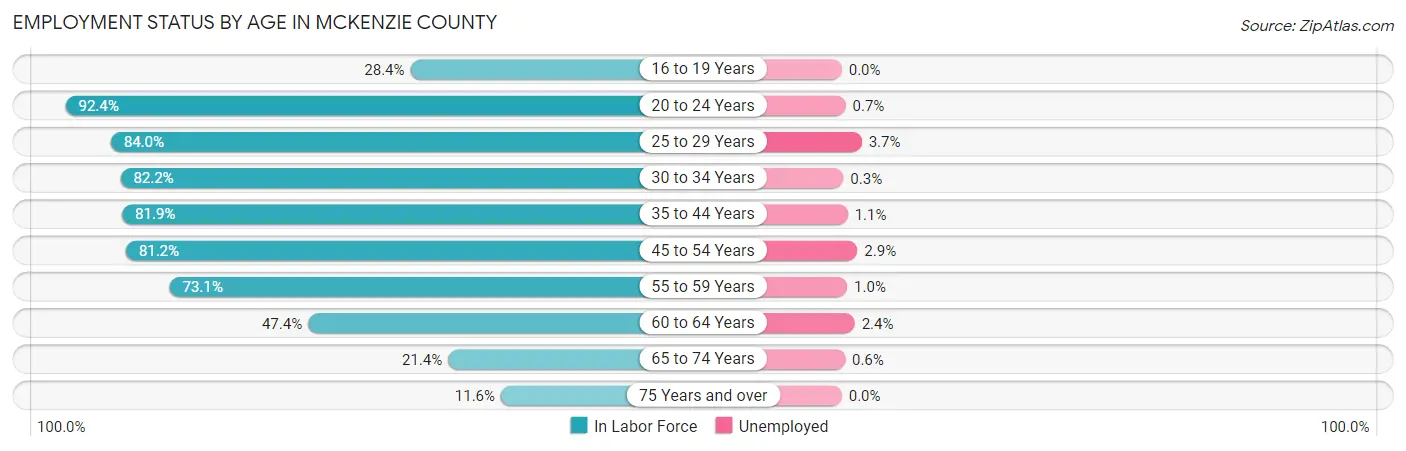
| Age Bracket | In Labor Force | Unemployed |
| 16 to 19 Years | 137 (28.4%) | 0 (0.0%) |
| 20 to 24 Years | 762 (92.4%) | 5 (0.7%) |
| 25 to 29 Years | 1,176 (84.0%) | 44 (3.7%) |
| 30 to 34 Years | 1,055 (82.2%) | 3 (0.3%) |
| 35 to 44 Years | 1,419 (81.9%) | 16 (1.1%) |
| 45 to 54 Years | 1,259 (81.2%) | 37 (2.9%) |
| 55 to 59 Years | 504 (73.1%) | 5 (1.0%) |
| 60 to 64 Years | 334 (47.4%) | 8 (2.4%) |
| 65 to 74 Years | 166 (21.4%) | 1 (0.6%) |
| 75 Years and over | 55 (11.6%) | 0 (0.0%) |
| Total | 6,863 (69.2%) | 117 (1.7%) |
Employment Status by Educational Attainment in McKenzie County
According to labor force statistics for McKenzie County, 78.1% of individuals (5,747) out of the total population between 25 and 64 years of age (7,359) are in the labor force, with 1.9% or 109 of them being unemployed. The group with the highest labor force participation rate are those with the educational attainment of bachelor's degree or higher, with 87.5% or 1,597 individuals in the labor force. Within the labor force, individuals with college / associate degree education have the highest percentage of unemployment, with 3.7% or 86 of them being unemployed.
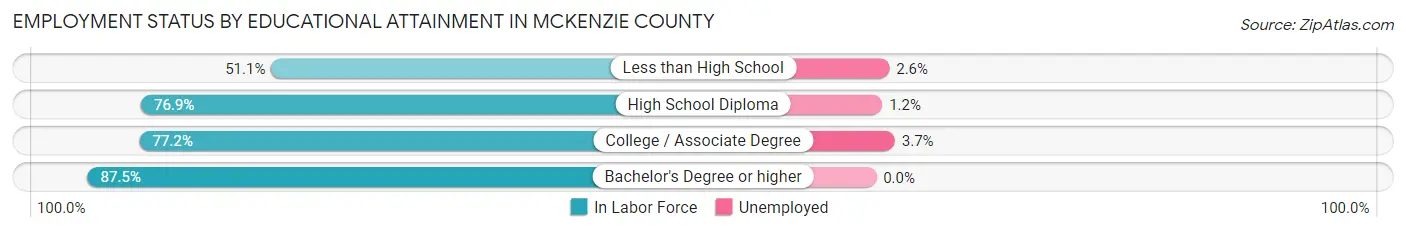
| Educational Attainment | In Labor Force | Unemployed |
| Less than High School | 229 (51.1%) | 12 (2.6%) |
| High School Diploma | 1,584 (76.9%) | 25 (1.2%) |
| College / Associate Degree | 2,336 (77.2%) | 112 (3.7%) |
| Bachelor's Degree or higher | 1,597 (87.5%) | 0 (0.0%) |
| Total | 5,747 (78.1%) | 140 (1.9%) |
Employment Occupations by Sex in McKenzie County
Management, Business, Science and Arts Occupations
The most common Management, Business, Science and Arts occupations in McKenzie County are Management (963 | 14.3%), Community & Social Service (538 | 8.0%), Computers, Engineering & Science (445 | 6.6%), Education Instruction & Library (429 | 6.4%), and Health Diagnosing & Treating (272 | 4.0%).
Management, Business, Science and Arts Occupations by Sex
Within the Management, Business, Science and Arts occupations in McKenzie County, the most male-oriented occupations are Architecture & Engineering (88.0%), Arts, Media & Entertainment (73.3%), and Management (64.0%), while the most female-oriented occupations are Computers & Mathematics (100.0%), Health Diagnosing & Treating (79.4%), and Education Instruction & Library (77.2%).
| Occupation | Male | Female |
| Management | 616 (64.0%) | 347 (36.0%) |
| Business & Financial | 22 (31.9%) | 47 (68.1%) |
| Computers, Engineering & Science | 229 (51.5%) | 216 (48.5%) |
| Computers & Mathematics | 0 (0.0%) | 82 (100.0%) |
| Architecture & Engineering | 191 (88.0%) | 26 (12.0%) |
| Life, Physical & Social Science | 38 (26.0%) | 108 (74.0%) |
| Community & Social Service | 158 (29.4%) | 380 (70.6%) |
| Education, Arts & Media | 26 (45.6%) | 31 (54.4%) |
| Legal Services & Support | 23 (62.2%) | 14 (37.8%) |
| Education Instruction & Library | 98 (22.8%) | 331 (77.2%) |
| Arts, Media & Entertainment | 11 (73.3%) | 4 (26.7%) |
| Health Diagnosing & Treating | 56 (20.6%) | 216 (79.4%) |
| Health Technologists | 44 (30.8%) | 99 (69.2%) |
| Total (Category) | 1,081 (47.3%) | 1,206 (52.7%) |
| Total (Overall) | 4,054 (60.3%) | 2,675 (39.8%) |
Services Occupations
The most common Services occupations in McKenzie County are Food Preparation & Serving (275 | 4.1%), Healthcare Support (236 | 3.5%), Cleaning & Maintenance (161 | 2.4%), Personal Care & Service (139 | 2.1%), and Security & Protection (118 | 1.8%).
Services Occupations by Sex
Within the Services occupations in McKenzie County, the most male-oriented occupations are Firefighting & Prevention (87.0%), Cleaning & Maintenance (81.4%), and Food Preparation & Serving (53.4%), while the most female-oriented occupations are Healthcare Support (94.9%), Law Enforcement (64.2%), and Personal Care & Service (61.2%).
| Occupation | Male | Female |
| Healthcare Support | 12 (5.1%) | 224 (94.9%) |
| Security & Protection | 54 (45.8%) | 64 (54.2%) |
| Firefighting & Prevention | 20 (87.0%) | 3 (13.0%) |
| Law Enforcement | 34 (35.8%) | 61 (64.2%) |
| Food Preparation & Serving | 147 (53.4%) | 128 (46.6%) |
| Cleaning & Maintenance | 131 (81.4%) | 30 (18.6%) |
| Personal Care & Service | 54 (38.9%) | 85 (61.2%) |
| Total (Category) | 398 (42.8%) | 531 (57.2%) |
| Total (Overall) | 4,054 (60.3%) | 2,675 (39.8%) |
Sales and Office Occupations
The most common Sales and Office occupations in McKenzie County are Sales & Related (627 | 9.3%), and Office & Administration (498 | 7.4%).

Sales and Office Occupations by Sex
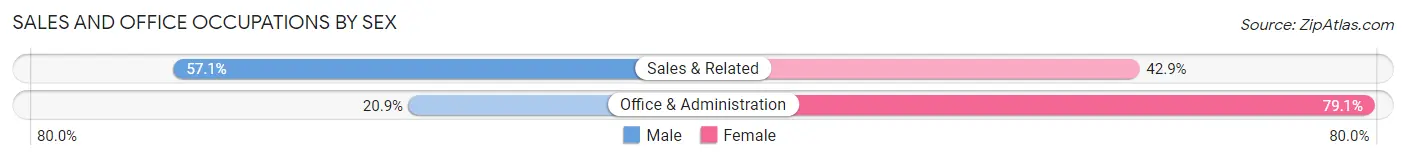
| Occupation | Male | Female |
| Sales & Related | 358 (57.1%) | 269 (42.9%) |
| Office & Administration | 104 (20.9%) | 394 (79.1%) |
| Total (Category) | 462 (41.1%) | 663 (58.9%) |
| Total (Overall) | 4,054 (60.3%) | 2,675 (39.8%) |
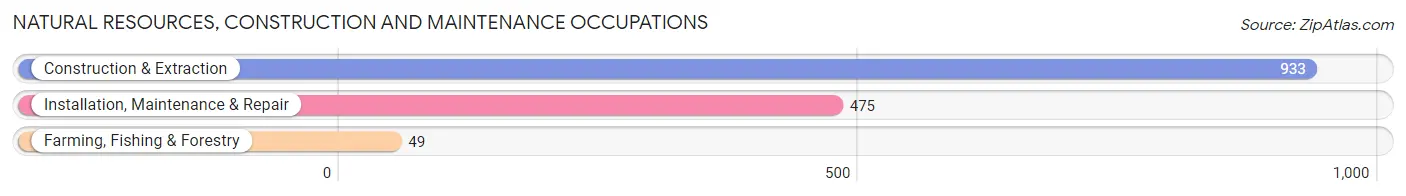
Natural Resources, Construction and Maintenance Occupations
The most common Natural Resources, Construction and Maintenance occupations in McKenzie County are Construction & Extraction (933 | 13.9%), Installation, Maintenance & Repair (475 | 7.1%), and Farming, Fishing & Forestry (49 | 0.7%).
Natural Resources, Construction and Maintenance Occupations by Sex
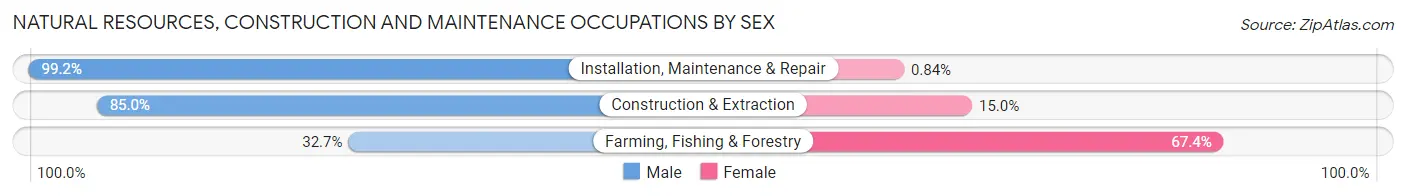
| Occupation | Male | Female |
| Farming, Fishing & Forestry | 16 (32.7%) | 33 (67.3%) |
| Construction & Extraction | 793 (85.0%) | 140 (15.0%) |
| Installation, Maintenance & Repair | 471 (99.2%) | 4 (0.8%) |
| Total (Category) | 1,280 (87.8%) | 177 (12.1%) |
| Total (Overall) | 4,054 (60.3%) | 2,675 (39.8%) |
Production, Transportation and Moving Occupations
The most common Production, Transportation and Moving occupations in McKenzie County are Production (426 | 6.3%), Transportation (306 | 4.5%), and Material Moving (199 | 3.0%).
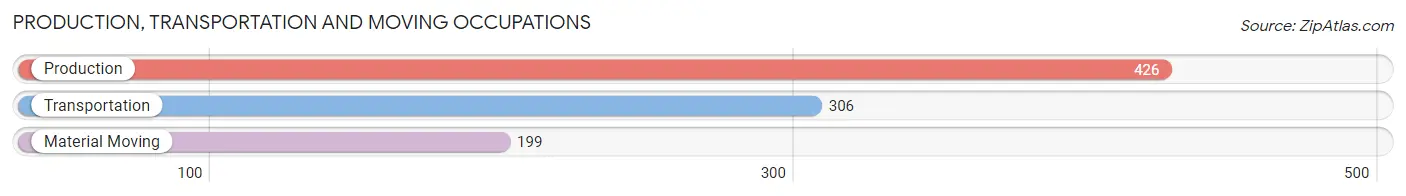
Production, Transportation and Moving Occupations by Sex
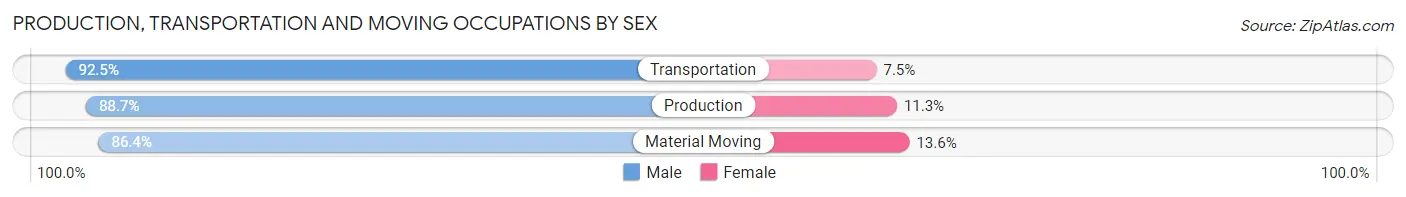
| Occupation | Male | Female |
| Production | 378 (88.7%) | 48 (11.3%) |
| Transportation | 283 (92.5%) | 23 (7.5%) |
| Material Moving | 172 (86.4%) | 27 (13.6%) |
| Total (Category) | 833 (89.5%) | 98 (10.5%) |
| Total (Overall) | 4,054 (60.3%) | 2,675 (39.8%) |
Employment Industries by Sex in McKenzie County
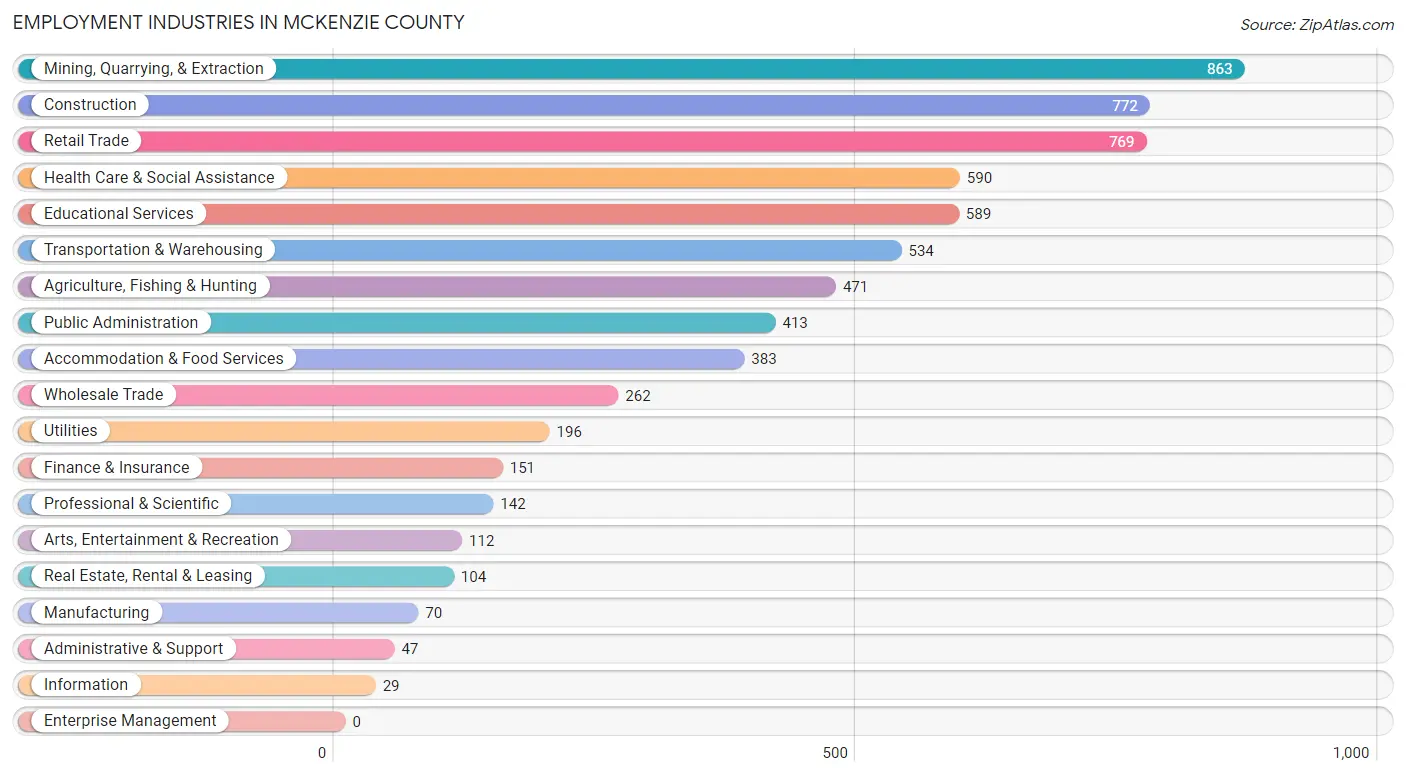
Employment Industries in McKenzie County
The major employment industries in McKenzie County include Mining, Quarrying, & Extraction (863 | 12.8%), Construction (772 | 11.5%), Retail Trade (769 | 11.4%), Health Care & Social Assistance (590 | 8.8%), and Educational Services (589 | 8.7%).
Employment Industries by Sex in McKenzie County
The McKenzie County industries that see more men than women are Transportation & Warehousing (99.3%), Real Estate, Rental & Leasing (96.2%), and Utilities (95.4%), whereas the industries that tend to have a higher number of women are Health Care & Social Assistance (95.8%), Educational Services (77.6%), and Accommodation & Food Services (70.8%).
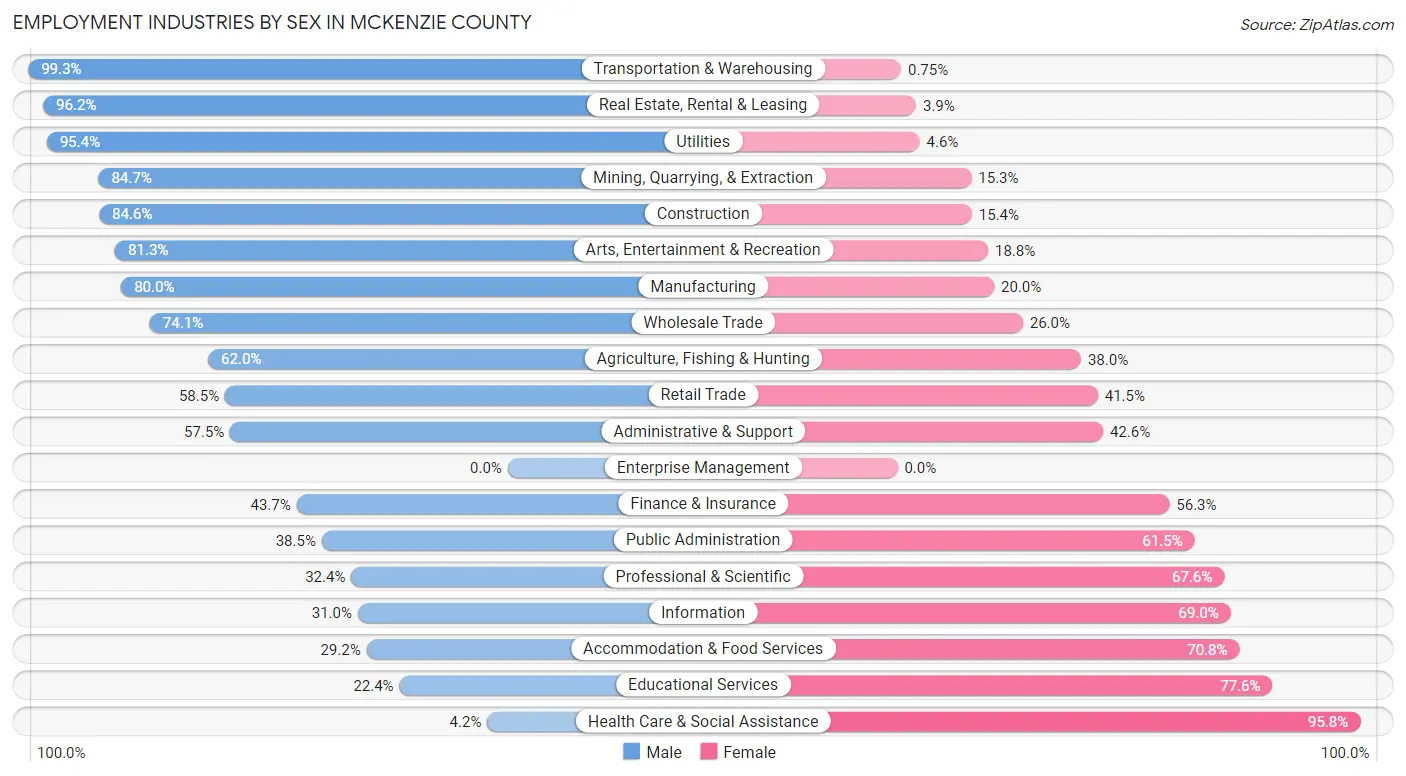
| Industry | Male | Female |
| Agriculture, Fishing & Hunting | 292 (62.0%) | 179 (38.0%) |
| Mining, Quarrying, & Extraction | 731 (84.7%) | 132 (15.3%) |
| Construction | 653 (84.6%) | 119 (15.4%) |
| Manufacturing | 56 (80.0%) | 14 (20.0%) |
| Wholesale Trade | 194 (74.1%) | 68 (26.0%) |
| Retail Trade | 450 (58.5%) | 319 (41.5%) |
| Transportation & Warehousing | 530 (99.3%) | 4 (0.7%) |
| Utilities | 187 (95.4%) | 9 (4.6%) |
| Information | 9 (31.0%) | 20 (69.0%) |
| Finance & Insurance | 66 (43.7%) | 85 (56.3%) |
| Real Estate, Rental & Leasing | 100 (96.2%) | 4 (3.8%) |
| Professional & Scientific | 46 (32.4%) | 96 (67.6%) |
| Enterprise Management | 0 (0.0%) | 0 (0.0%) |
| Administrative & Support | 27 (57.5%) | 20 (42.5%) |
| Educational Services | 132 (22.4%) | 457 (77.6%) |
| Health Care & Social Assistance | 25 (4.2%) | 565 (95.8%) |
| Arts, Entertainment & Recreation | 91 (81.2%) | 21 (18.8%) |
| Accommodation & Food Services | 112 (29.2%) | 271 (70.8%) |
| Public Administration | 159 (38.5%) | 254 (61.5%) |
| Total | 4,054 (60.3%) | 2,675 (39.8%) |
Education in McKenzie County
School Enrollment in McKenzie County
The most common levels of schooling among the 3,810 students in McKenzie County are elementary school (930 | 24.4%), middle school (921 | 24.2%), and high school (681 | 17.9%).
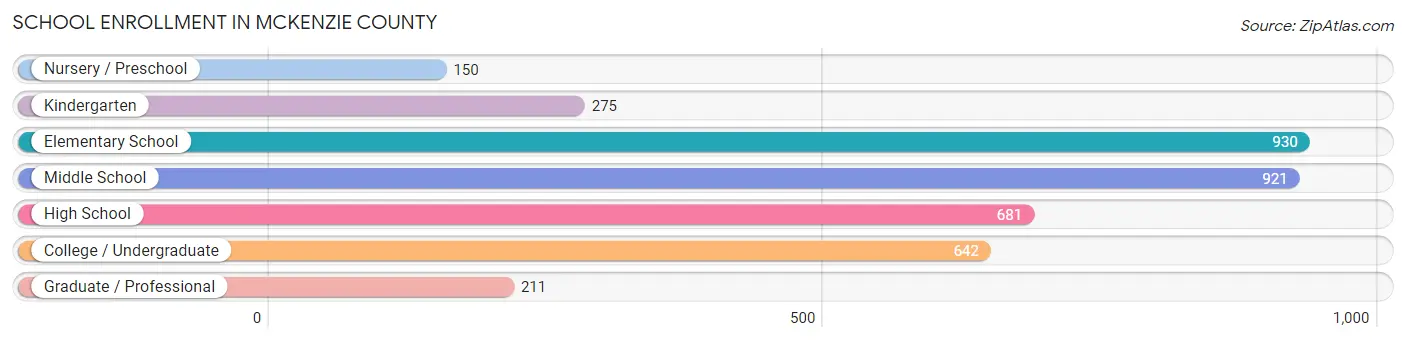
| School Level | # Students | % Students |
| Nursery / Preschool | 150 | 3.9% |
| Kindergarten | 275 | 7.2% |
| Elementary School | 930 | 24.4% |
| Middle School | 921 | 24.2% |
| High School | 681 | 17.9% |
| College / Undergraduate | 642 | 16.9% |
| Graduate / Professional | 211 | 5.5% |
| Total | 3,810 | 100.0% |
School Enrollment by Age by Funding Source in McKenzie County
Out of a total of 3,810 students who are enrolled in schools in McKenzie County, 613 (16.1%) attend a private institution, while the remaining 3,197 (83.9%) are enrolled in public schools. The age group of 25 to 34 year olds has the highest likelihood of being enrolled in private schools, with 226 (54.3% in the age bracket) enrolled. Conversely, the age group of 10 to 14 year olds has the lowest likelihood of being enrolled in a private school, with 1,123 (96.1% in the age bracket) attending a public institution.
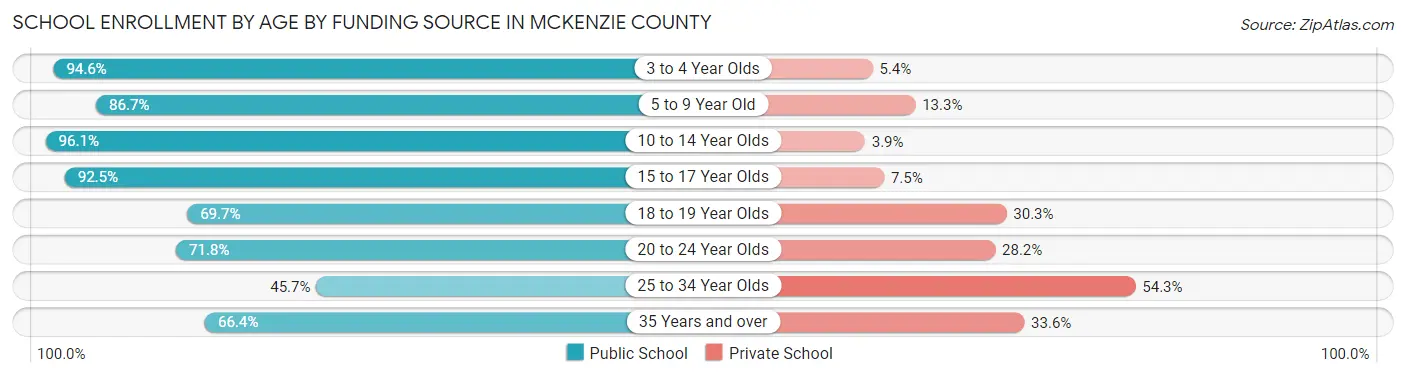
| Age Bracket | Public School | Private School |
| 3 to 4 Year Olds | 123 (94.6%) | 7 (5.4%) |
| 5 to 9 Year Old | 897 (86.7%) | 138 (13.3%) |
| 10 to 14 Year Olds | 1,123 (96.1%) | 46 (3.9%) |
| 15 to 17 Year Olds | 493 (92.5%) | 40 (7.5%) |
| 18 to 19 Year Olds | 69 (69.7%) | 30 (30.3%) |
| 20 to 24 Year Olds | 224 (71.8%) | 88 (28.2%) |
| 25 to 34 Year Olds | 190 (45.7%) | 226 (54.3%) |
| 35 Years and over | 77 (66.4%) | 39 (33.6%) |
| Total | 3,197 (83.9%) | 613 (16.1%) |
Educational Attainment by Field of Study in McKenzie County
Education (545 | 25.0%), business (259 | 11.9%), science & technology (206 | 9.4%), arts & humanities (189 | 8.7%), and engineering (187 | 8.6%) are the most common fields of study among 2,183 individuals in McKenzie County who have obtained a bachelor's degree or higher.
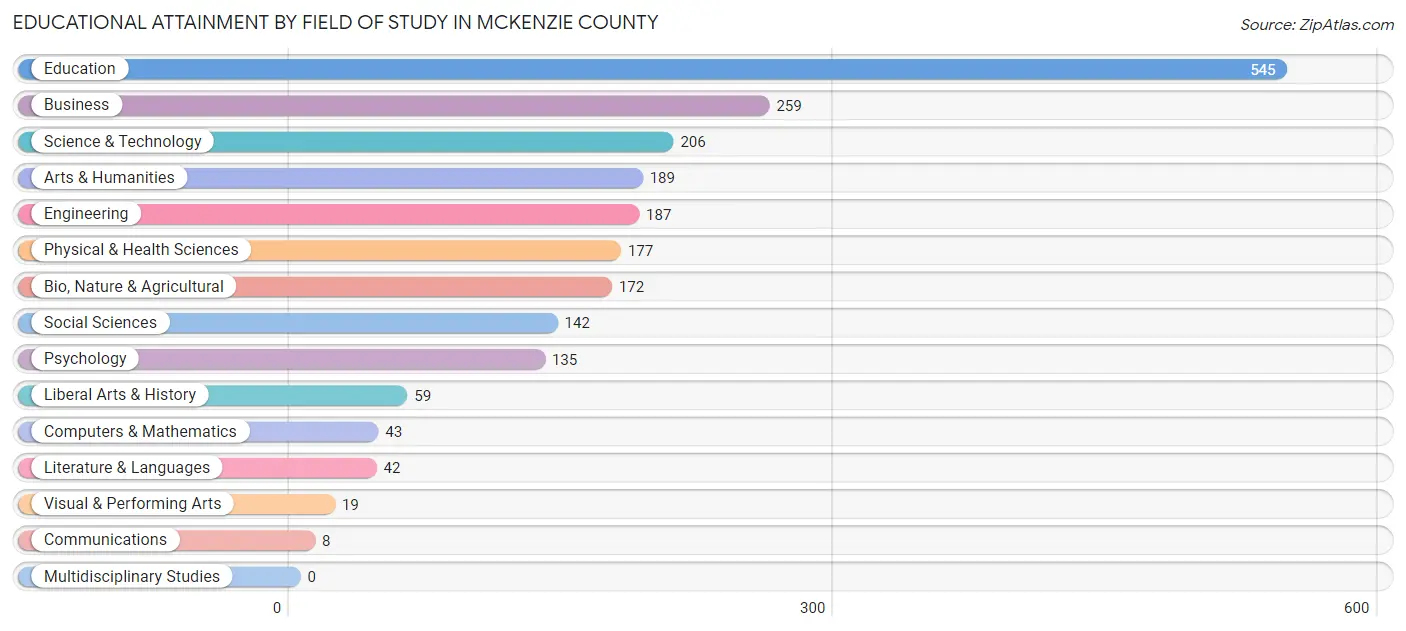
| Field of Study | # Graduates | % Graduates |
| Computers & Mathematics | 43 | 2.0% |
| Bio, Nature & Agricultural | 172 | 7.9% |
| Physical & Health Sciences | 177 | 8.1% |
| Psychology | 135 | 6.2% |
| Social Sciences | 142 | 6.5% |
| Engineering | 187 | 8.6% |
| Multidisciplinary Studies | 0 | 0.0% |
| Science & Technology | 206 | 9.4% |
| Business | 259 | 11.9% |
| Education | 545 | 25.0% |
| Literature & Languages | 42 | 1.9% |
| Liberal Arts & History | 59 | 2.7% |
| Visual & Performing Arts | 19 | 0.9% |
| Communications | 8 | 0.4% |
| Arts & Humanities | 189 | 8.7% |
| Total | 2,183 | 100.0% |
Transportation & Commute in McKenzie County
Vehicle Availability by Sex in McKenzie County
The most prevalent vehicle ownership categories in McKenzie County are males with 2 vehicles (1,309, accounting for 32.4%) and females with 2 vehicles (1,077, making up 50.4%).
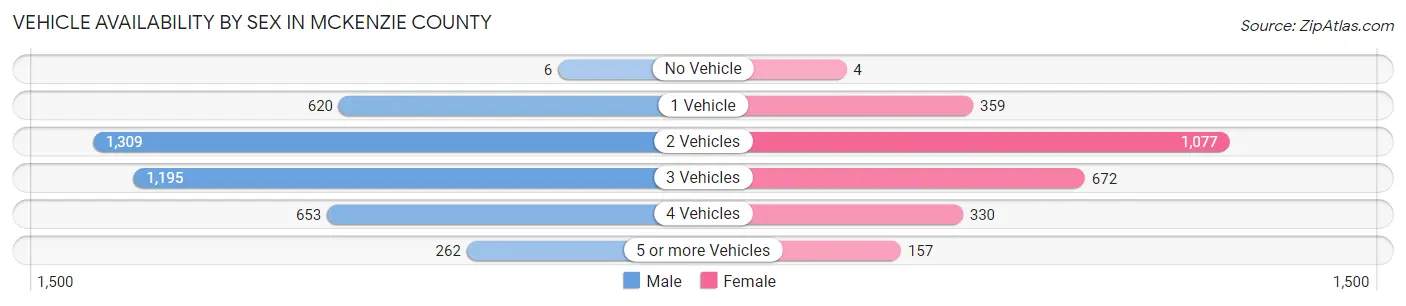
| Vehicles Available | Male | Female |
| No Vehicle | 6 (0.2%) | 4 (0.2%) |
| 1 Vehicle | 620 (15.3%) | 359 (13.8%) |
| 2 Vehicles | 1,309 (32.4%) | 1,077 (41.4%) |
| 3 Vehicles | 1,195 (29.5%) | 672 (25.9%) |
| 4 Vehicles | 653 (16.1%) | 330 (12.7%) |
| 5 or more Vehicles | 262 (6.5%) | 157 (6.0%) |
| Total | 4,045 (100.0%) | 2,599 (100.0%) |
Commute Time in McKenzie County
The most frequently occuring commute durations in McKenzie County are 5 to 9 minutes (1,141 commuters, 18.0%), 10 to 14 minutes (1,121 commuters, 17.7%), and less than 5 minutes (965 commuters, 15.2%).
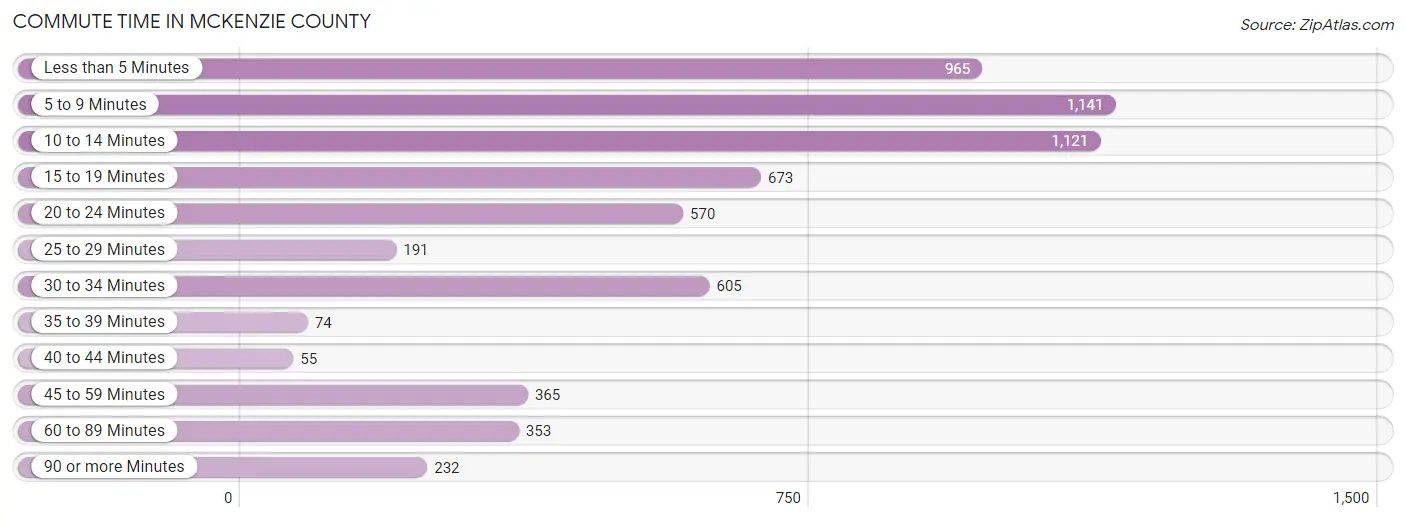
| Commute Time | # Commuters | % Commuters |
| Less than 5 Minutes | 965 | 15.2% |
| 5 to 9 Minutes | 1,141 | 18.0% |
| 10 to 14 Minutes | 1,121 | 17.7% |
| 15 to 19 Minutes | 673 | 10.6% |
| 20 to 24 Minutes | 570 | 9.0% |
| 25 to 29 Minutes | 191 | 3.0% |
| 30 to 34 Minutes | 605 | 9.5% |
| 35 to 39 Minutes | 74 | 1.2% |
| 40 to 44 Minutes | 55 | 0.9% |
| 45 to 59 Minutes | 365 | 5.8% |
| 60 to 89 Minutes | 353 | 5.6% |
| 90 or more Minutes | 232 | 3.7% |
Commute Time by Sex in McKenzie County
The most common commute times in McKenzie County are 5 to 9 minutes (665 commuters, 17.2%) for males and 10 to 14 minutes (647 commuters, 26.0%) for females.
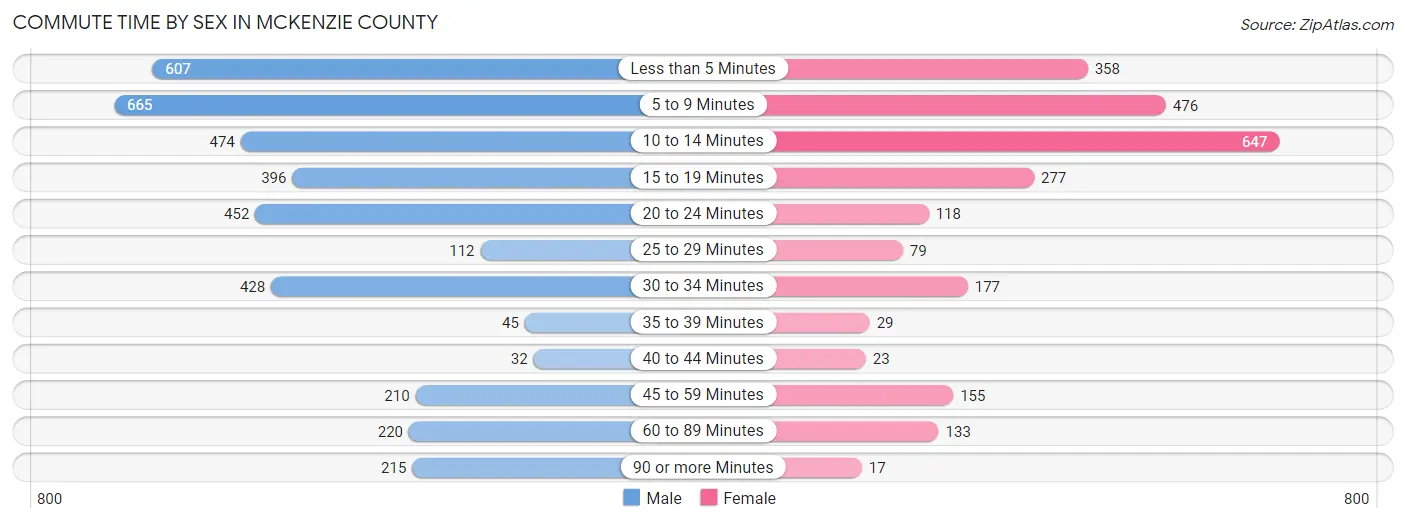
| Commute Time | Male | Female |
| Less than 5 Minutes | 607 (15.7%) | 358 (14.4%) |
| 5 to 9 Minutes | 665 (17.2%) | 476 (19.1%) |
| 10 to 14 Minutes | 474 (12.3%) | 647 (26.0%) |
| 15 to 19 Minutes | 396 (10.3%) | 277 (11.1%) |
| 20 to 24 Minutes | 452 (11.7%) | 118 (4.7%) |
| 25 to 29 Minutes | 112 (2.9%) | 79 (3.2%) |
| 30 to 34 Minutes | 428 (11.1%) | 177 (7.1%) |
| 35 to 39 Minutes | 45 (1.2%) | 29 (1.2%) |
| 40 to 44 Minutes | 32 (0.8%) | 23 (0.9%) |
| 45 to 59 Minutes | 210 (5.4%) | 155 (6.2%) |
| 60 to 89 Minutes | 220 (5.7%) | 133 (5.3%) |
| 90 or more Minutes | 215 (5.6%) | 17 (0.7%) |
Time of Departure to Work by Sex in McKenzie County
The most frequent times of departure to work in McKenzie County are 6:00 AM to 6:29 AM (841, 21.8%) for males and 7:30 AM to 7:59 AM (561, 22.5%) for females.
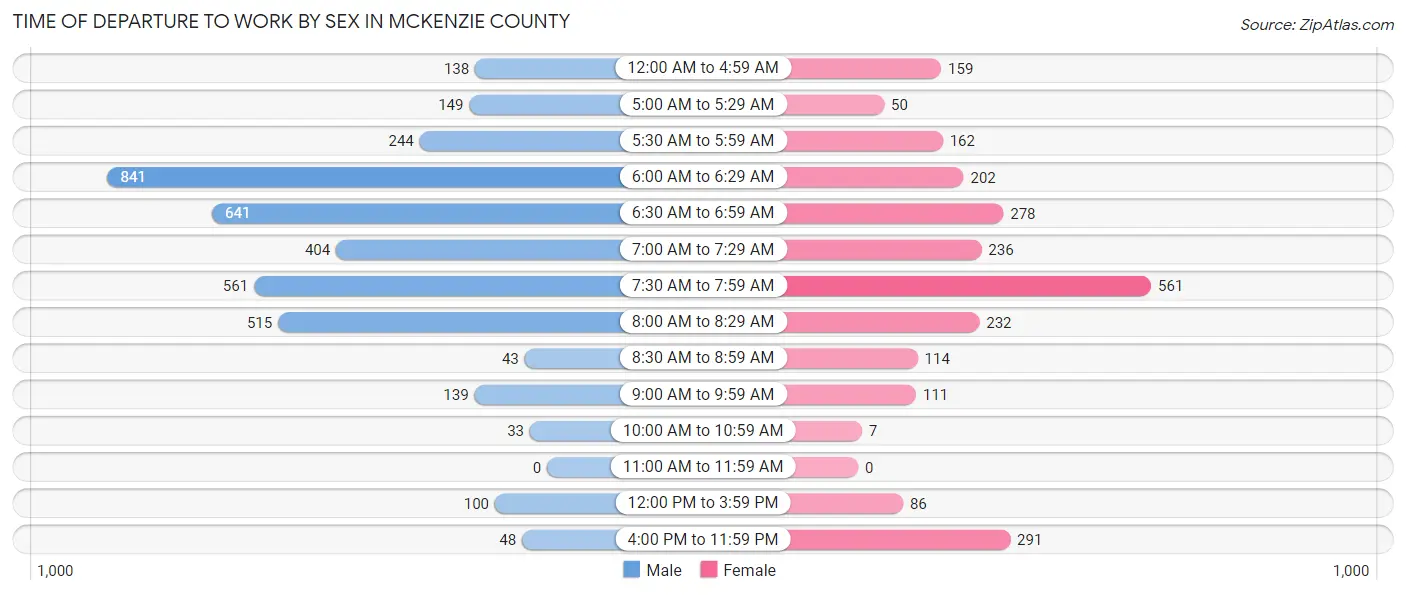
| Time of Departure | Male | Female |
| 12:00 AM to 4:59 AM | 138 (3.6%) | 159 (6.4%) |
| 5:00 AM to 5:29 AM | 149 (3.9%) | 50 (2.0%) |
| 5:30 AM to 5:59 AM | 244 (6.3%) | 162 (6.5%) |
| 6:00 AM to 6:29 AM | 841 (21.8%) | 202 (8.1%) |
| 6:30 AM to 6:59 AM | 641 (16.6%) | 278 (11.2%) |
| 7:00 AM to 7:29 AM | 404 (10.5%) | 236 (9.5%) |
| 7:30 AM to 7:59 AM | 561 (14.5%) | 561 (22.5%) |
| 8:00 AM to 8:29 AM | 515 (13.4%) | 232 (9.3%) |
| 8:30 AM to 8:59 AM | 43 (1.1%) | 114 (4.6%) |
| 9:00 AM to 9:59 AM | 139 (3.6%) | 111 (4.5%) |
| 10:00 AM to 10:59 AM | 33 (0.9%) | 7 (0.3%) |
| 11:00 AM to 11:59 AM | 0 (0.0%) | 0 (0.0%) |
| 12:00 PM to 3:59 PM | 100 (2.6%) | 86 (3.5%) |
| 4:00 PM to 11:59 PM | 48 (1.2%) | 291 (11.7%) |
| Total | 3,856 (100.0%) | 2,489 (100.0%) |
Housing Occupancy in McKenzie County
Occupancy by Ownership in McKenzie County
Of the total 5,350 dwellings in McKenzie County, owner-occupied units account for 3,021 (56.5%), while renter-occupied units make up 2,329 (43.5%).
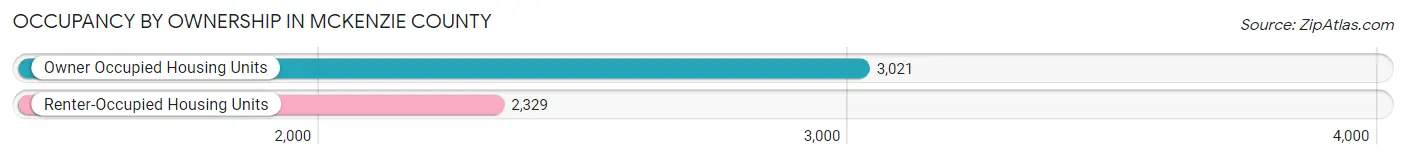
| Occupancy | # Housing Units | % Housing Units |
| Owner Occupied Housing Units | 3,021 | 56.5% |
| Renter-Occupied Housing Units | 2,329 | 43.5% |
| Total Occupied Housing Units | 5,350 | 100.0% |
Occupancy by Household Size in McKenzie County
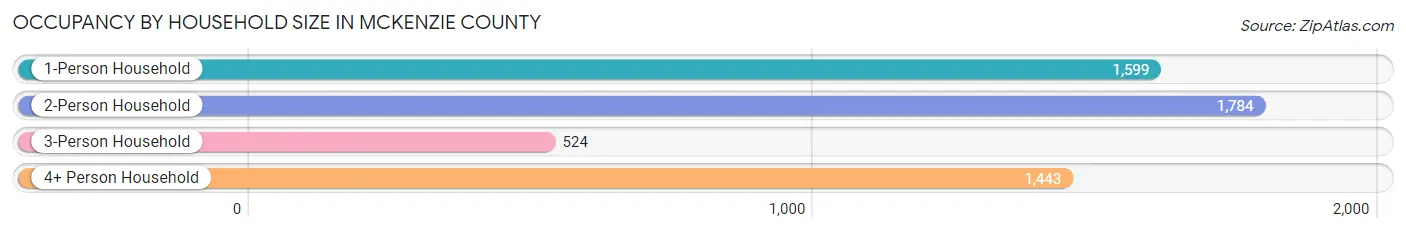
| Household Size | # Housing Units | % Housing Units |
| 1-Person Household | 1,599 | 29.9% |
| 2-Person Household | 1,784 | 33.4% |
| 3-Person Household | 524 | 9.8% |
| 4+ Person Household | 1,443 | 27.0% |
| Total Housing Units | 5,350 | 100.0% |
Occupancy by Ownership by Household Size in McKenzie County
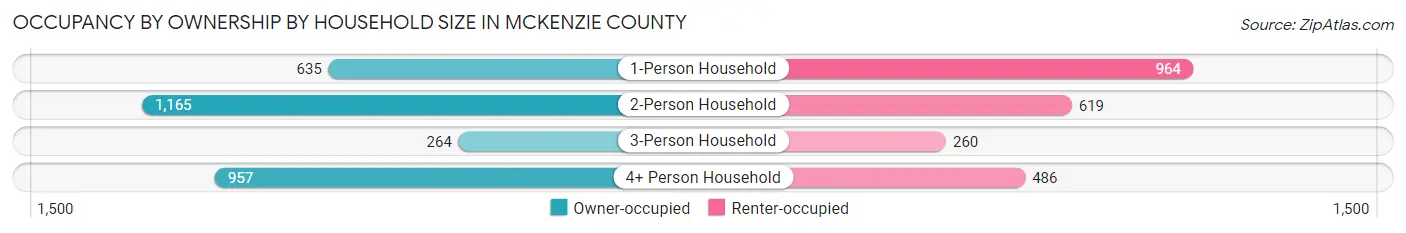
| Household Size | Owner-occupied | Renter-occupied |
| 1-Person Household | 635 (39.7%) | 964 (60.3%) |
| 2-Person Household | 1,165 (65.3%) | 619 (34.7%) |
| 3-Person Household | 264 (50.4%) | 260 (49.6%) |
| 4+ Person Household | 957 (66.3%) | 486 (33.7%) |
| Total Housing Units | 3,021 (56.5%) | 2,329 (43.5%) |
Occupancy by Educational Attainment in McKenzie County
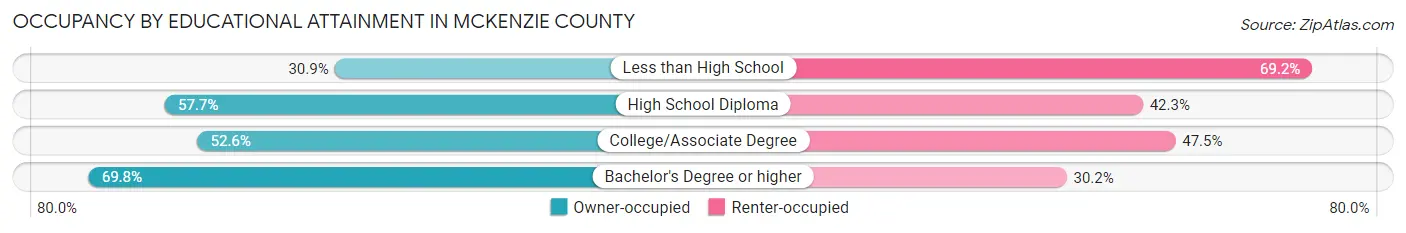
| Household Size | Owner-occupied | Renter-occupied |
| Less than High School | 124 (30.8%) | 278 (69.2%) |
| High School Diploma | 800 (57.7%) | 586 (42.3%) |
| College/Associate Degree | 1,186 (52.5%) | 1,071 (47.4%) |
| Bachelor's Degree or higher | 911 (69.8%) | 394 (30.2%) |
Occupancy by Age of Householder in McKenzie County
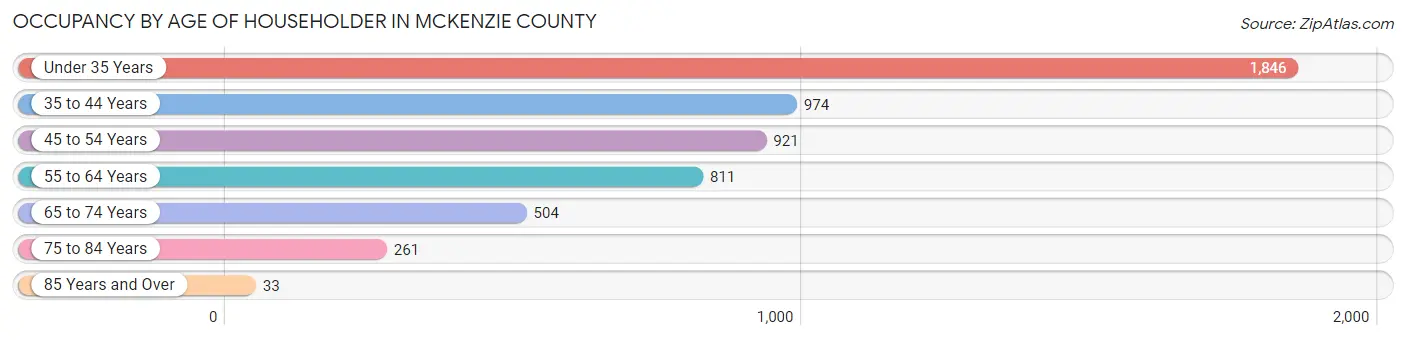
| Age Bracket | # Households | % Households |
| Under 35 Years | 1,846 | 34.5% |
| 35 to 44 Years | 974 | 18.2% |
| 45 to 54 Years | 921 | 17.2% |
| 55 to 64 Years | 811 | 15.2% |
| 65 to 74 Years | 504 | 9.4% |
| 75 to 84 Years | 261 | 4.9% |
| 85 Years and Over | 33 | 0.6% |
| Total | 5,350 | 100.0% |
Housing Finances in McKenzie County
Median Income by Occupancy in McKenzie County
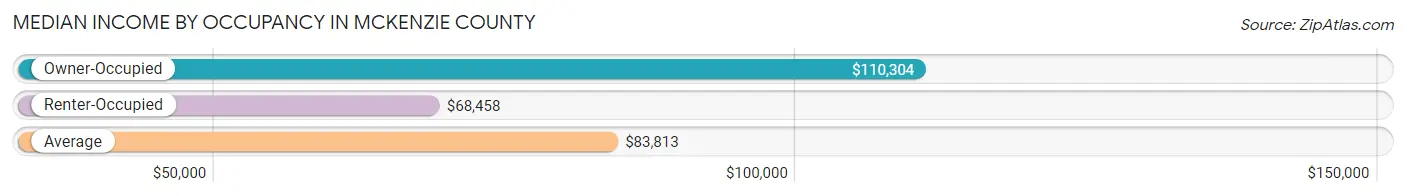
| Occupancy Type | # Households | Median Income |
| Owner-Occupied | 3,021 (56.5%) | $110,304 |
| Renter-Occupied | 2,329 (43.5%) | $68,458 |
| Average | 5,350 (100.0%) | $83,813 |
Occupancy by Householder Income Bracket in McKenzie County
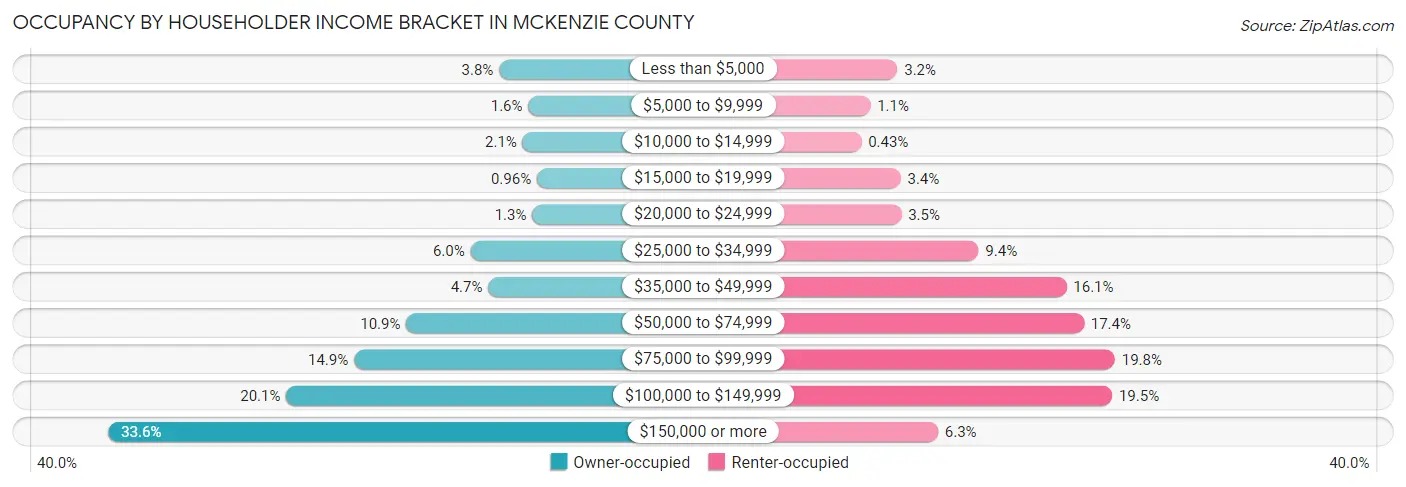
| Income Bracket | Owner-occupied | Renter-occupied |
| Less than $5,000 | 116 (3.8%) | 74 (3.2%) |
| $5,000 to $9,999 | 49 (1.6%) | 26 (1.1%) |
| $10,000 to $14,999 | 62 (2.1%) | 10 (0.4%) |
| $15,000 to $19,999 | 29 (1.0%) | 80 (3.4%) |
| $20,000 to $24,999 | 40 (1.3%) | 81 (3.5%) |
| $25,000 to $34,999 | 182 (6.0%) | 218 (9.4%) |
| $35,000 to $49,999 | 141 (4.7%) | 374 (16.1%) |
| $50,000 to $74,999 | 330 (10.9%) | 405 (17.4%) |
| $75,000 to $99,999 | 450 (14.9%) | 460 (19.8%) |
| $100,000 to $149,999 | 606 (20.1%) | 455 (19.5%) |
| $150,000 or more | 1,016 (33.6%) | 146 (6.3%) |
| Total | 3,021 (100.0%) | 2,329 (100.0%) |
Monthly Housing Cost Tiers in McKenzie County
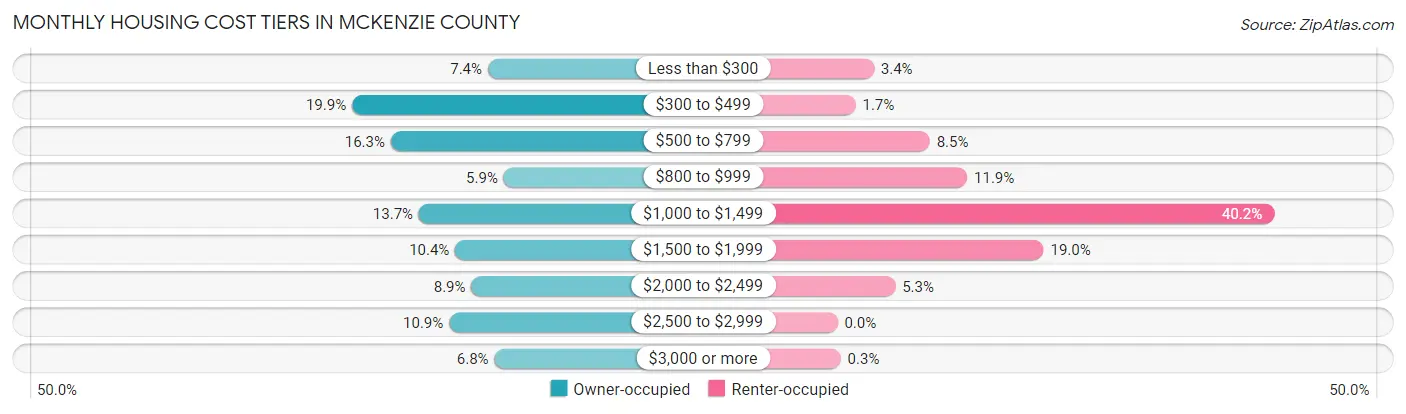
| Monthly Cost | Owner-occupied | Renter-occupied |
| Less than $300 | 222 (7.3%) | 78 (3.4%) |
| $300 to $499 | 600 (19.9%) | 39 (1.7%) |
| $500 to $799 | 492 (16.3%) | 198 (8.5%) |
| $800 to $999 | 178 (5.9%) | 278 (11.9%) |
| $1,000 to $1,499 | 414 (13.7%) | 936 (40.2%) |
| $1,500 to $1,999 | 313 (10.4%) | 442 (19.0%) |
| $2,000 to $2,499 | 268 (8.9%) | 124 (5.3%) |
| $2,500 to $2,999 | 330 (10.9%) | 0 (0.0%) |
| $3,000 or more | 204 (6.8%) | 7 (0.3%) |
| Total | 3,021 (100.0%) | 2,329 (100.0%) |
Physical Housing Characteristics in McKenzie County
Housing Structures in McKenzie County
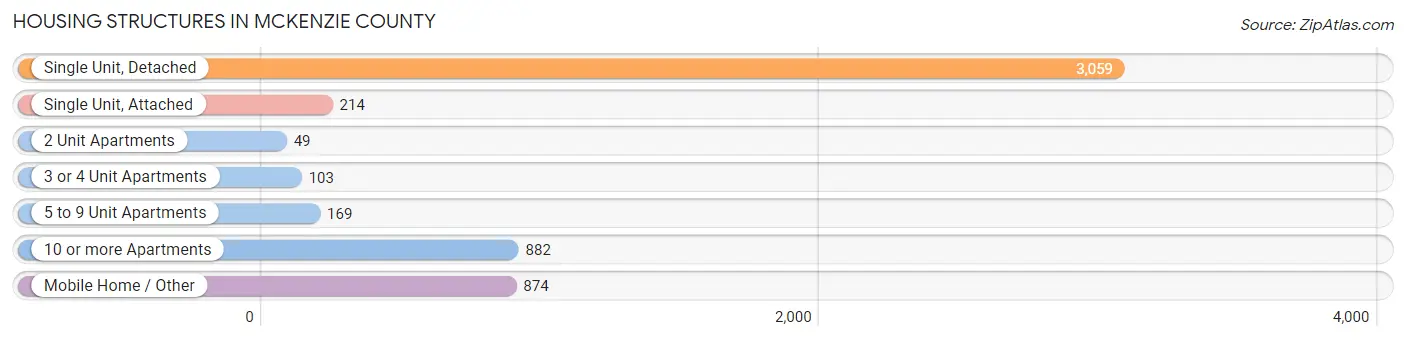
| Structure Type | # Housing Units | % Housing Units |
| Single Unit, Detached | 3,059 | 57.2% |
| Single Unit, Attached | 214 | 4.0% |
| 2 Unit Apartments | 49 | 0.9% |
| 3 or 4 Unit Apartments | 103 | 1.9% |
| 5 to 9 Unit Apartments | 169 | 3.2% |
| 10 or more Apartments | 882 | 16.5% |
| Mobile Home / Other | 874 | 16.3% |
| Total | 5,350 | 100.0% |
Housing Structures by Occupancy in McKenzie County
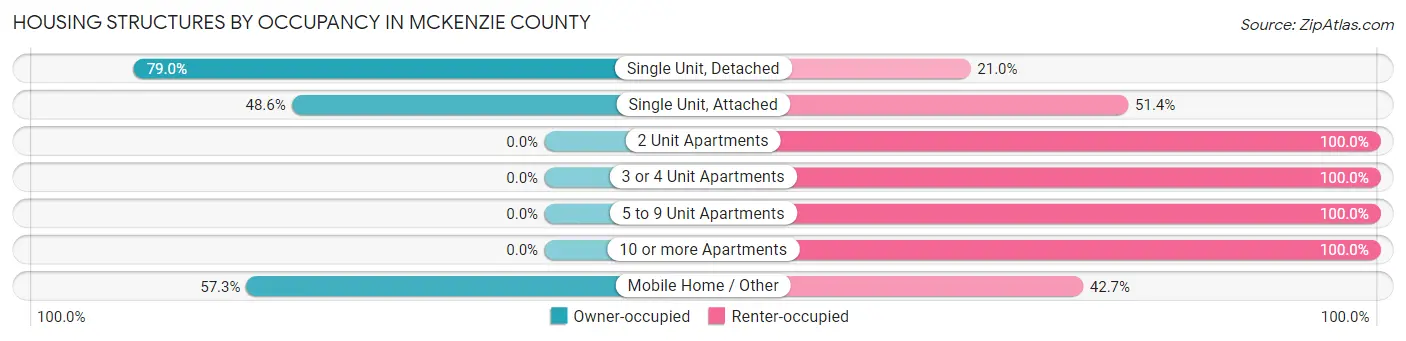
| Structure Type | Owner-occupied | Renter-occupied |
| Single Unit, Detached | 2,416 (79.0%) | 643 (21.0%) |
| Single Unit, Attached | 104 (48.6%) | 110 (51.4%) |
| 2 Unit Apartments | 0 (0.0%) | 49 (100.0%) |
| 3 or 4 Unit Apartments | 0 (0.0%) | 103 (100.0%) |
| 5 to 9 Unit Apartments | 0 (0.0%) | 169 (100.0%) |
| 10 or more Apartments | 0 (0.0%) | 882 (100.0%) |
| Mobile Home / Other | 501 (57.3%) | 373 (42.7%) |
| Total | 3,021 (56.5%) | 2,329 (43.5%) |
Housing Structures by Number of Rooms in McKenzie County
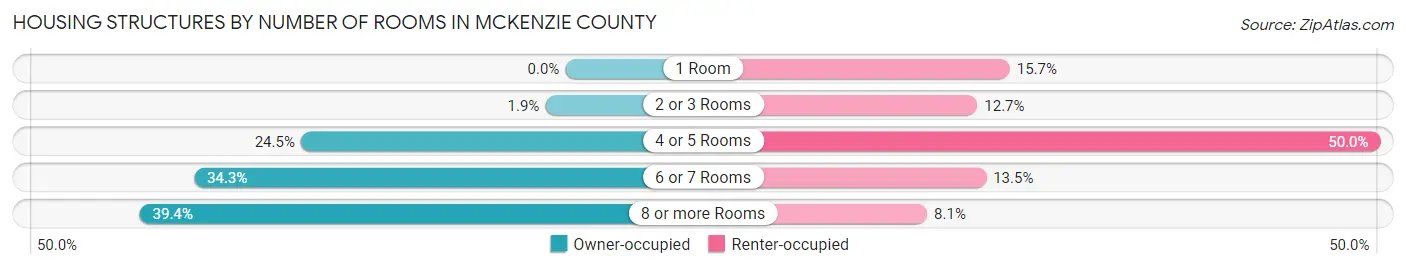
| Number of Rooms | Owner-occupied | Renter-occupied |
| 1 Room | 0 (0.0%) | 366 (15.7%) |
| 2 or 3 Rooms | 56 (1.8%) | 296 (12.7%) |
| 4 or 5 Rooms | 739 (24.5%) | 1,164 (50.0%) |
| 6 or 7 Rooms | 1,037 (34.3%) | 315 (13.5%) |
| 8 or more Rooms | 1,189 (39.4%) | 188 (8.1%) |
| Total | 3,021 (100.0%) | 2,329 (100.0%) |
Housing Structure by Heating Type in McKenzie County
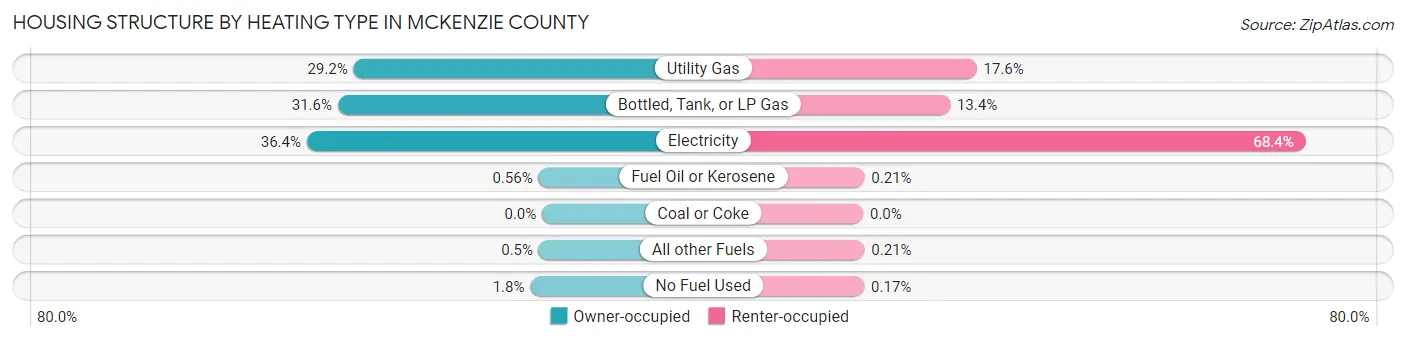
| Heating Type | Owner-occupied | Renter-occupied |
| Utility Gas | 881 (29.2%) | 409 (17.6%) |
| Bottled, Tank, or LP Gas | 954 (31.6%) | 313 (13.4%) |
| Electricity | 1,099 (36.4%) | 1,593 (68.4%) |
| Fuel Oil or Kerosene | 17 (0.6%) | 5 (0.2%) |
| Coal or Coke | 0 (0.0%) | 0 (0.0%) |
| All other Fuels | 15 (0.5%) | 5 (0.2%) |
| No Fuel Used | 55 (1.8%) | 4 (0.2%) |
| Total | 3,021 (100.0%) | 2,329 (100.0%) |
Household Vehicle Usage in McKenzie County
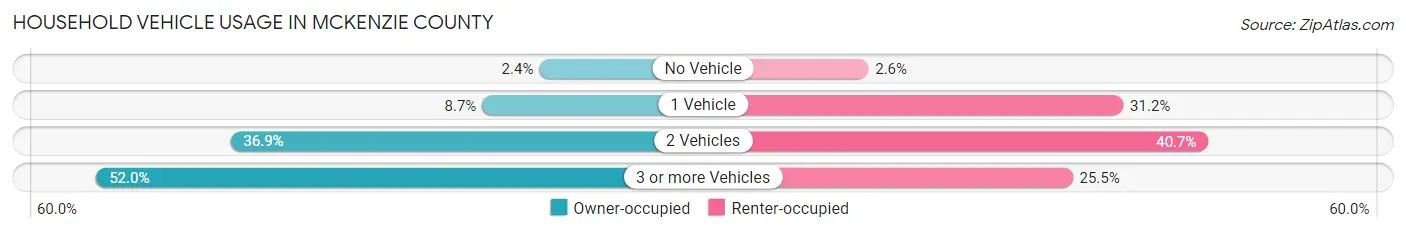
| Vehicles per Household | Owner-occupied | Renter-occupied |
| No Vehicle | 71 (2.4%) | 61 (2.6%) |
| 1 Vehicle | 264 (8.7%) | 726 (31.2%) |
| 2 Vehicles | 1,116 (36.9%) | 948 (40.7%) |
| 3 or more Vehicles | 1,570 (52.0%) | 594 (25.5%) |
| Total | 3,021 (100.0%) | 2,329 (100.0%) |
Real Estate & Mortgages in McKenzie County
Real Estate and Mortgage Overview in McKenzie County
| Characteristic | Without Mortgage | With Mortgage |
| Housing Units | 1,457 | 1,564 |
| Median Property Value | $289,900 | $357,800 |
| Median Household Income | $79,343 | $690 |
| Monthly Housing Costs | $484 | $204 |
| Real Estate Taxes | $1,213 | $81 |
Property Value by Mortgage Status in McKenzie County
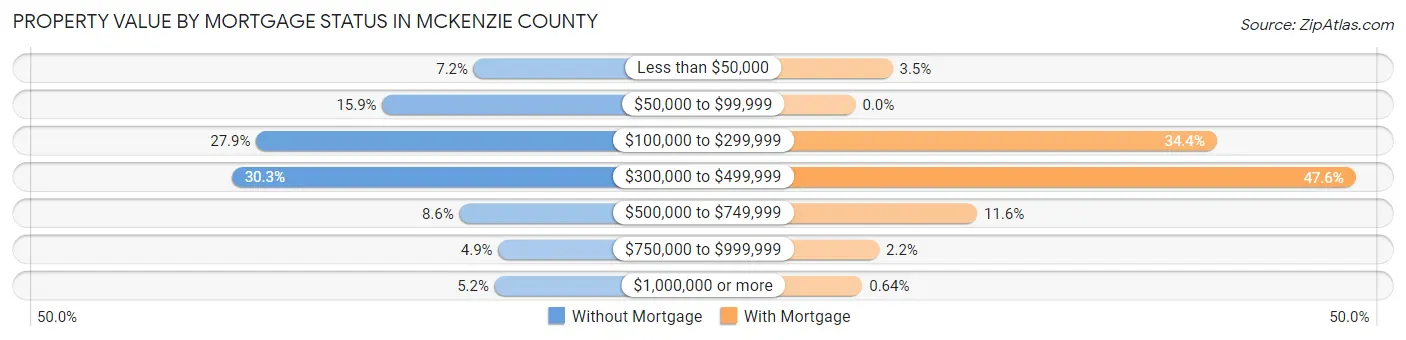
| Property Value | Without Mortgage | With Mortgage |
| Less than $50,000 | 105 (7.2%) | 55 (3.5%) |
| $50,000 to $99,999 | 232 (15.9%) | 0 (0.0%) |
| $100,000 to $299,999 | 407 (27.9%) | 538 (34.4%) |
| $300,000 to $499,999 | 441 (30.3%) | 745 (47.6%) |
| $500,000 to $749,999 | 125 (8.6%) | 181 (11.6%) |
| $750,000 to $999,999 | 71 (4.9%) | 35 (2.2%) |
| $1,000,000 or more | 76 (5.2%) | 10 (0.6%) |
| Total | 1,457 (100.0%) | 1,564 (100.0%) |
Household Income by Mortgage Status in McKenzie County
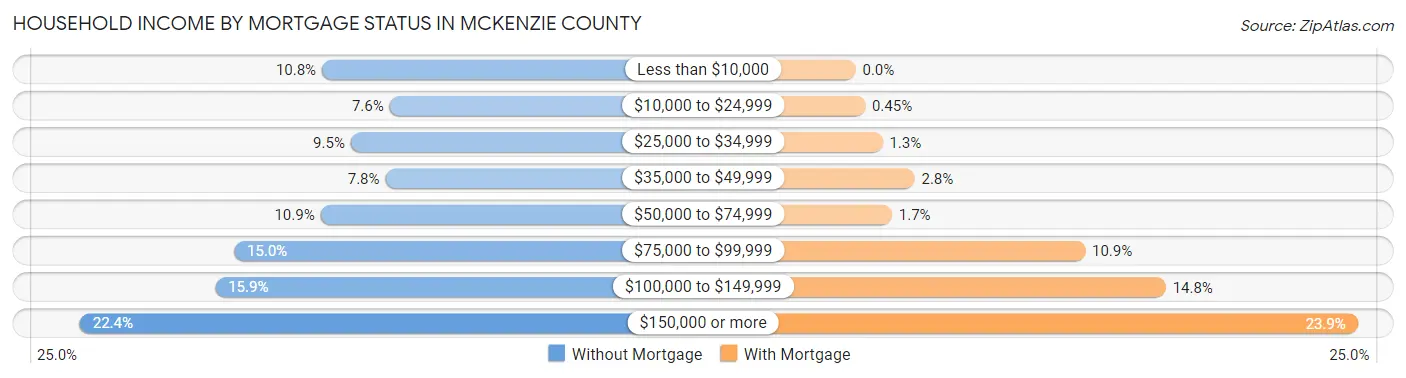
| Household Income | Without Mortgage | With Mortgage |
| Less than $10,000 | 158 (10.8%) | 0 (0.0%) |
| $10,000 to $24,999 | 111 (7.6%) | 7 (0.4%) |
| $25,000 to $34,999 | 138 (9.5%) | 20 (1.3%) |
| $35,000 to $49,999 | 114 (7.8%) | 44 (2.8%) |
| $50,000 to $74,999 | 159 (10.9%) | 27 (1.7%) |
| $75,000 to $99,999 | 219 (15.0%) | 171 (10.9%) |
| $100,000 to $149,999 | 232 (15.9%) | 231 (14.8%) |
| $150,000 or more | 326 (22.4%) | 374 (23.9%) |
| Total | 1,457 (100.0%) | 1,564 (100.0%) |
Property Value to Household Income Ratio in McKenzie County
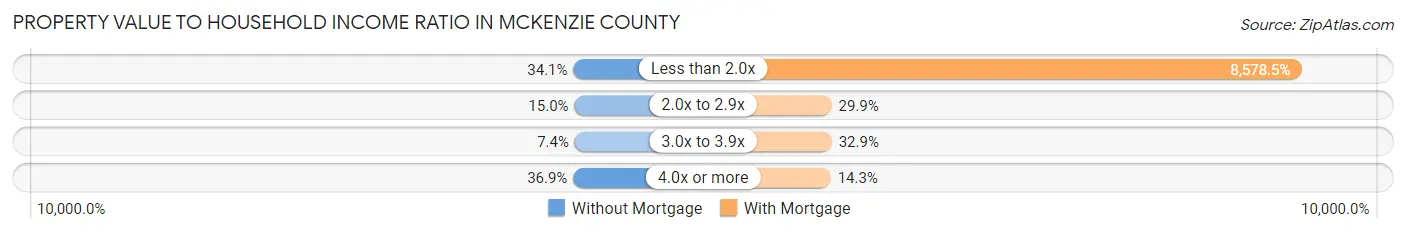
| Value-to-Income Ratio | Without Mortgage | With Mortgage |
| Less than 2.0x | 497 (34.1%) | 134,167 (8,578.4%) |
| 2.0x to 2.9x | 218 (15.0%) | 468 (29.9%) |
| 3.0x to 3.9x | 108 (7.4%) | 514 (32.9%) |
| 4.0x or more | 537 (36.9%) | 223 (14.3%) |
| Total | 1,457 (100.0%) | 1,564 (100.0%) |
Real Estate Taxes by Mortgage Status in McKenzie County
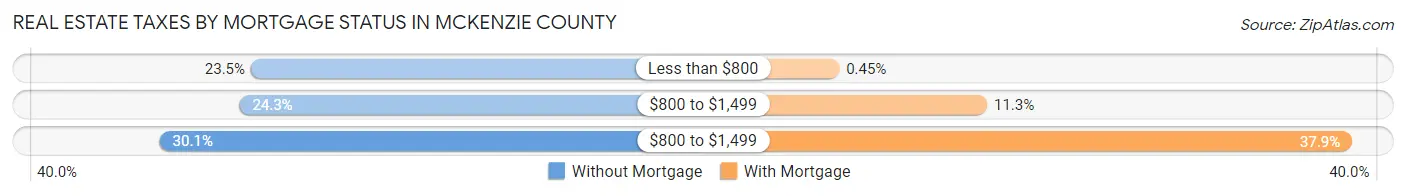
| Property Taxes | Without Mortgage | With Mortgage |
| Less than $800 | 342 (23.5%) | 7 (0.4%) |
| $800 to $1,499 | 354 (24.3%) | 176 (11.3%) |
| $800 to $1,499 | 439 (30.1%) | 593 (37.9%) |
| Total | 1,457 (100.0%) | 1,564 (100.0%) |
Health & Disability in McKenzie County
Health Insurance Coverage by Age in McKenzie County
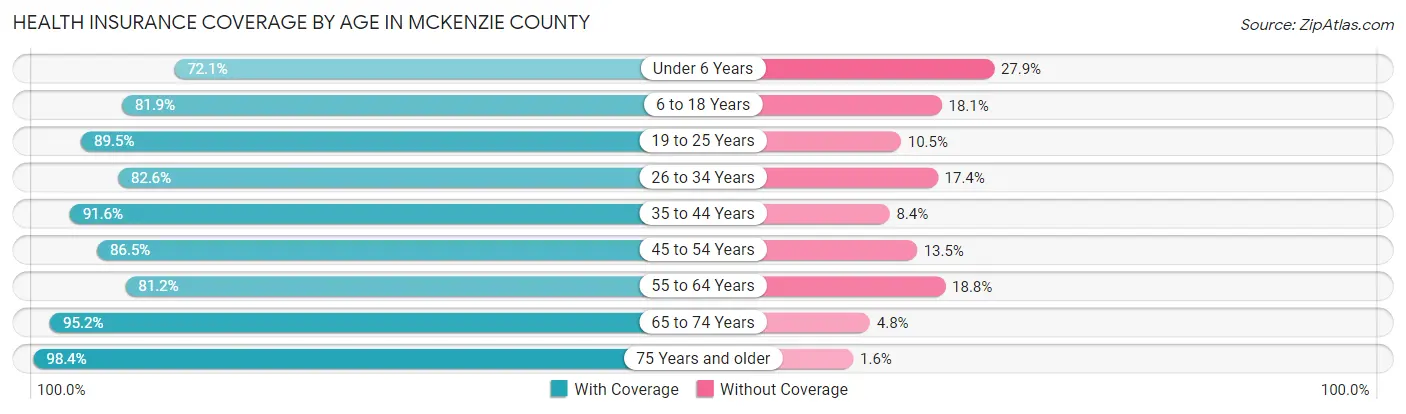
| Age Bracket | With Coverage | Without Coverage |
| Under 6 Years | 1,227 (72.1%) | 475 (27.9%) |
| 6 to 18 Years | 2,382 (81.9%) | 528 (18.1%) |
| 19 to 25 Years | 1,054 (89.5%) | 124 (10.5%) |
| 26 to 34 Years | 1,951 (82.6%) | 411 (17.4%) |
| 35 to 44 Years | 1,556 (91.6%) | 143 (8.4%) |
| 45 to 54 Years | 1,320 (86.5%) | 206 (13.5%) |
| 55 to 64 Years | 1,127 (81.2%) | 261 (18.8%) |
| 65 to 74 Years | 719 (95.2%) | 36 (4.8%) |
| 75 Years and older | 421 (98.4%) | 7 (1.6%) |
| Total | 11,757 (84.3%) | 2,191 (15.7%) |
Health Insurance Coverage by Citizenship Status in McKenzie County

| Citizenship Status | With Coverage | Without Coverage |
| Native Born | 1,227 (72.1%) | 475 (27.9%) |
| Foreign Born, Citizen | 2,382 (81.9%) | 528 (18.1%) |
| Foreign Born, not a Citizen | 1,054 (89.5%) | 124 (10.5%) |
Health Insurance Coverage by Household Income in McKenzie County
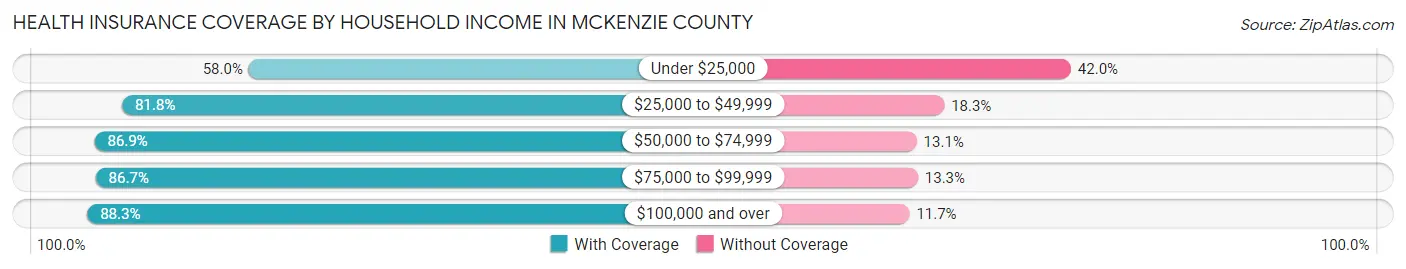
| Household Income | With Coverage | Without Coverage |
| Under $25,000 | 659 (58.0%) | 477 (42.0%) |
| $25,000 to $49,999 | 1,810 (81.8%) | 404 (18.2%) |
| $50,000 to $74,999 | 1,792 (86.9%) | 270 (13.1%) |
| $75,000 to $99,999 | 1,862 (86.7%) | 286 (13.3%) |
| $100,000 and over | 5,493 (88.3%) | 731 (11.7%) |
Public vs Private Health Insurance Coverage by Age in McKenzie County
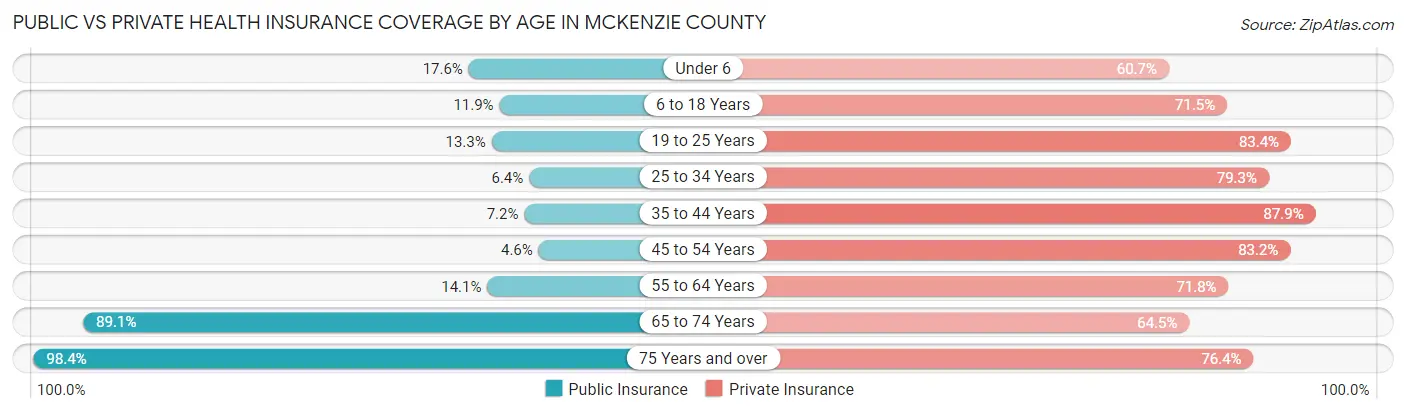
| Age Bracket | Public Insurance | Private Insurance |
| Under 6 | 299 (17.6%) | 1,033 (60.7%) |
| 6 to 18 Years | 345 (11.9%) | 2,081 (71.5%) |
| 19 to 25 Years | 157 (13.3%) | 982 (83.4%) |
| 25 to 34 Years | 150 (6.4%) | 1,872 (79.2%) |
| 35 to 44 Years | 123 (7.2%) | 1,494 (87.9%) |
| 45 to 54 Years | 70 (4.6%) | 1,270 (83.2%) |
| 55 to 64 Years | 196 (14.1%) | 996 (71.8%) |
| 65 to 74 Years | 673 (89.1%) | 487 (64.5%) |
| 75 Years and over | 421 (98.4%) | 327 (76.4%) |
| Total | 2,434 (17.4%) | 10,542 (75.6%) |
Disability Status by Sex by Age in McKenzie County
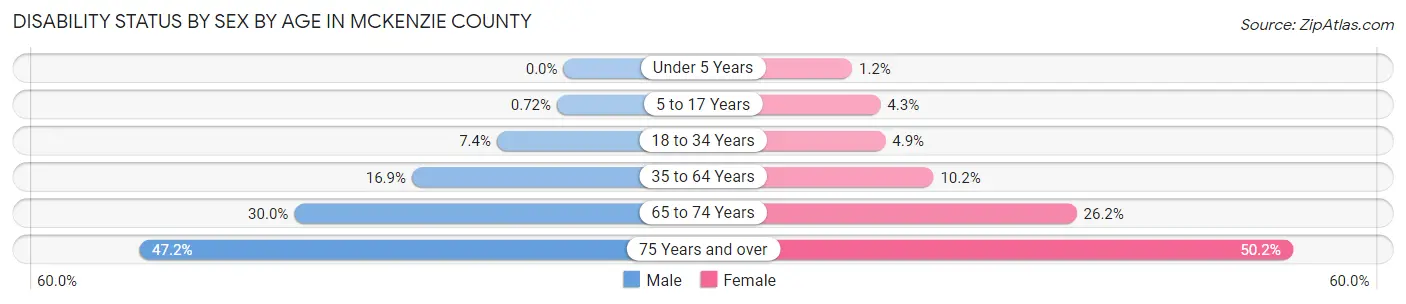
| Age Bracket | Male | Female |
| Under 5 Years | 0 (0.0%) | 7 (1.1%) |
| 5 to 17 Years | 12 (0.7%) | 58 (4.3%) |
| 18 to 34 Years | 148 (7.4%) | 80 (4.9%) |
| 35 to 64 Years | 418 (16.9%) | 218 (10.2%) |
| 65 to 74 Years | 122 (30.0%) | 91 (26.2%) |
| 75 Years and over | 77 (47.2%) | 133 (50.2%) |
Disability Class by Sex by Age in McKenzie County
Disability Class: Hearing Difficulty
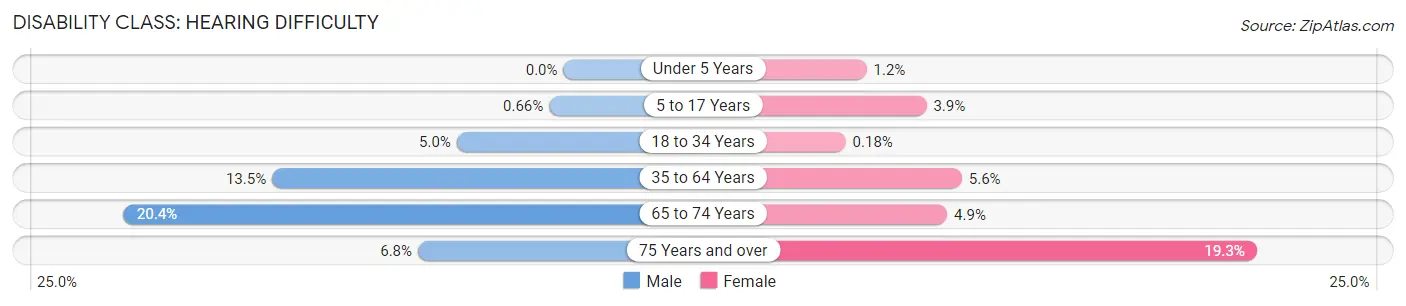
| Age Bracket | Male | Female |
| Under 5 Years | 0 (0.0%) | 7 (1.1%) |
| 5 to 17 Years | 11 (0.7%) | 53 (3.9%) |
| 18 to 34 Years | 99 (5.0%) | 3 (0.2%) |
| 35 to 64 Years | 335 (13.5%) | 119 (5.6%) |
| 65 to 74 Years | 83 (20.4%) | 17 (4.9%) |
| 75 Years and over | 11 (6.8%) | 51 (19.3%) |
Disability Class: Vision Difficulty
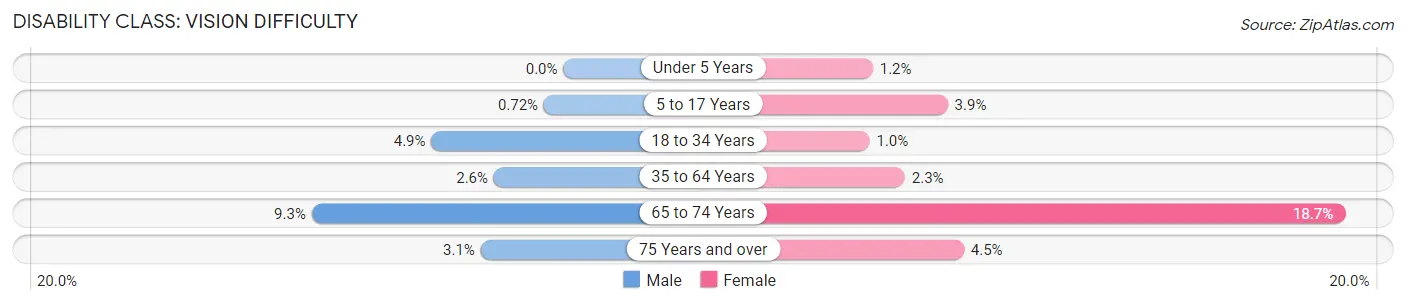
| Age Bracket | Male | Female |
| Under 5 Years | 0 (0.0%) | 7 (1.1%) |
| 5 to 17 Years | 12 (0.7%) | 53 (3.9%) |
| 18 to 34 Years | 98 (4.9%) | 17 (1.0%) |
| 35 to 64 Years | 64 (2.6%) | 50 (2.3%) |
| 65 to 74 Years | 38 (9.3%) | 65 (18.7%) |
| 75 Years and over | 5 (3.1%) | 12 (4.5%) |
Disability Class: Cognitive Difficulty
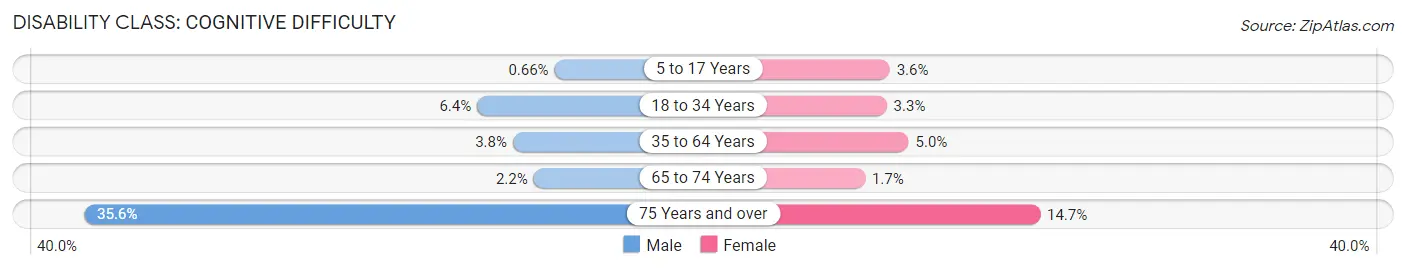
| Age Bracket | Male | Female |
| 5 to 17 Years | 11 (0.7%) | 48 (3.6%) |
| 18 to 34 Years | 128 (6.4%) | 55 (3.3%) |
| 35 to 64 Years | 93 (3.7%) | 106 (5.0%) |
| 65 to 74 Years | 9 (2.2%) | 6 (1.7%) |
| 75 Years and over | 58 (35.6%) | 39 (14.7%) |
Disability Class: Ambulatory Difficulty
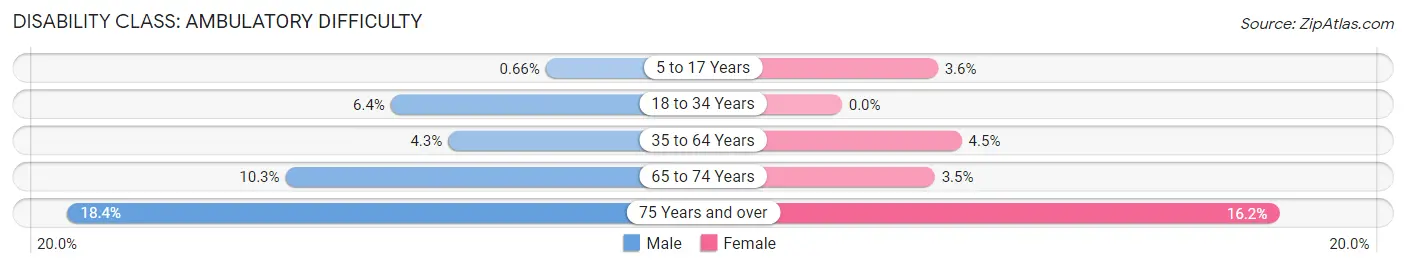
| Age Bracket | Male | Female |
| 5 to 17 Years | 11 (0.7%) | 48 (3.6%) |
| 18 to 34 Years | 128 (6.4%) | 0 (0.0%) |
| 35 to 64 Years | 106 (4.3%) | 95 (4.4%) |
| 65 to 74 Years | 42 (10.3%) | 12 (3.5%) |
| 75 Years and over | 30 (18.4%) | 43 (16.2%) |
Disability Class: Self-Care Difficulty
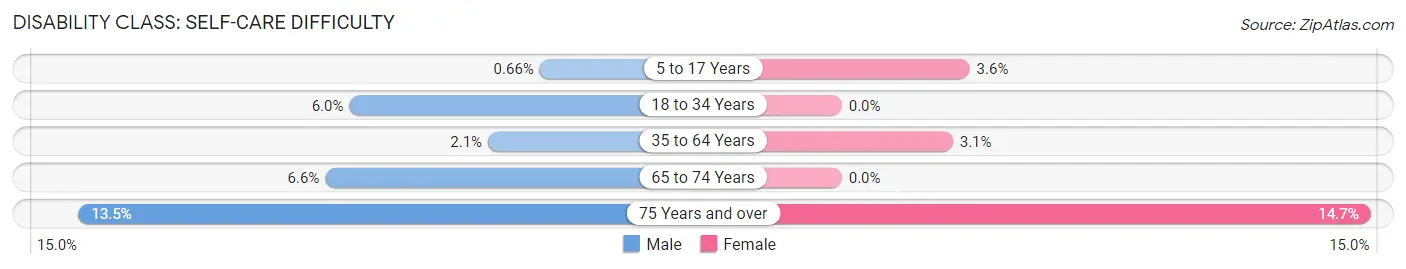
| Age Bracket | Male | Female |
| 5 to 17 Years | 11 (0.7%) | 48 (3.6%) |
| 18 to 34 Years | 119 (6.0%) | 0 (0.0%) |
| 35 to 64 Years | 52 (2.1%) | 66 (3.1%) |
| 65 to 74 Years | 27 (6.6%) | 0 (0.0%) |
| 75 Years and over | 22 (13.5%) | 39 (14.7%) |
Technology Access in McKenzie County
Computing Device Access in McKenzie County
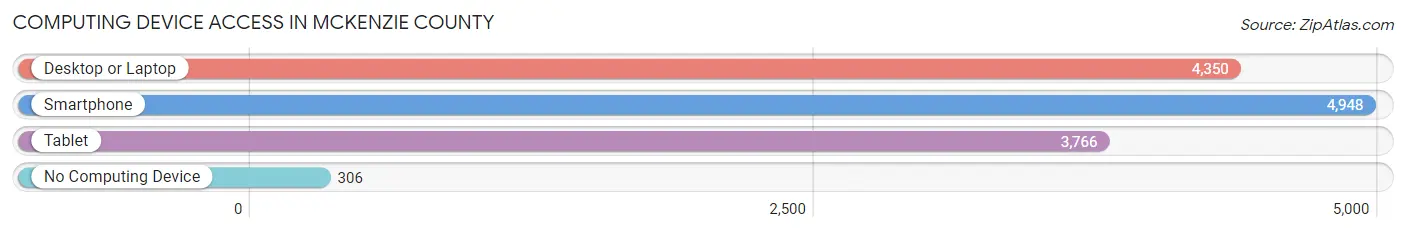
| Device Type | # Households | % Households |
| Desktop or Laptop | 4,350 | 81.3% |
| Smartphone | 4,948 | 92.5% |
| Tablet | 3,766 | 70.4% |
| No Computing Device | 306 | 5.7% |
| Total | 5,350 | 100.0% |
Internet Access in McKenzie County
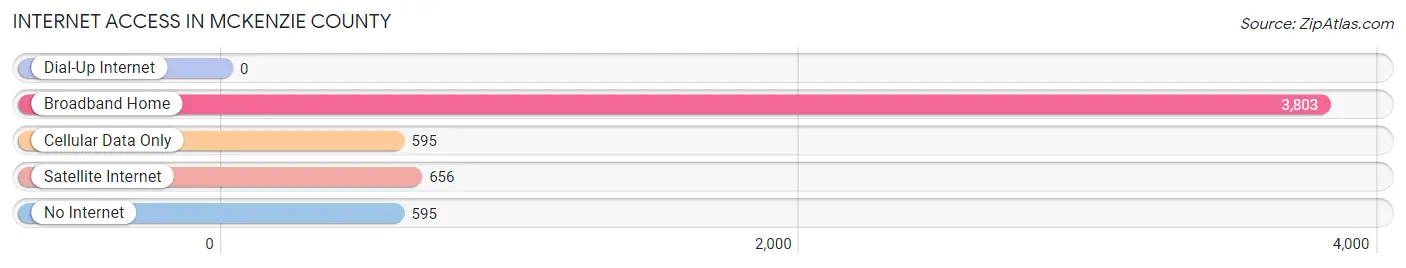
| Internet Type | # Households | % Households |
| Dial-Up Internet | 0 | 0.0% |
| Broadband Home | 3,803 | 71.1% |
| Cellular Data Only | 595 | 11.1% |
| Satellite Internet | 656 | 12.3% |
| No Internet | 595 | 11.1% |
| Total | 5,350 | 100.0% |
McKenzie County Summary
Mckenzie County is located in the western part of North Dakota, and is the largest county in the state. It is bordered by Williams County to the north, Mountrail County to the east, and Dunn County to the south. The county seat is Watford City, and the county is named after Alexander McKenzie, a fur trader and explorer who explored the area in the early 1800s.
History
Mckenzie County was established in 1883, and was originally part of the Dakota Territory. The county was named after Alexander McKenzie, a fur trader and explorer who explored the area in the early 1800s. The first settlers in the area were ranchers, who were attracted to the area by the abundance of grass and water. The first town in the county was Watford City, which was established in 1887.
The county experienced a population boom in the early 1900s, as homesteaders moved to the area to take advantage of the Homestead Act. The population of the county grew from 1,000 in 1900 to over 10,000 by 1910. The county continued to grow throughout the 20th century, and by 2000, the population had reached over 12,000.
Geography
Mckenzie County is located in the western part of North Dakota, and is the largest county in the state. It is bordered by Williams County to the north, Mountrail County to the east, and Dunn County to the south. The county has a total area of 2,845 square miles, and is mostly flat, with some rolling hills in the western part of the county. The county is home to several lakes, including Lake Sakakawea, Lake Audubon, and Lake Tschida.
The county is located in the Great Plains region of the United States, and is part of the Missouri Plateau. The climate is semi-arid, with cold winters and hot summers. The average annual precipitation is around 16 inches, and the average annual temperature is around 48 degrees Fahrenheit.
Economy
Mckenzie County is an agricultural county, and the main crops grown in the area are wheat, barley, oats, and hay. The county is also home to several oil and gas fields, and the oil and gas industry is a major contributor to the local economy. The county is also home to several manufacturing companies, including a wind turbine manufacturing plant.
The county is home to several tourist attractions, including the Theodore Roosevelt National Park, the Fort Union Trading Post National Historic Site, and the Knife River Indian Villages National Historic Site. The county is also home to several outdoor recreation areas, including the Little Missouri National Grassland and the Lake Sakakawea State Park.
Demographics
As of the 2010 census, the population of Mckenzie County was 11,539. The population is mostly white (94.3%), with small percentages of Native American (2.3%), African American (0.7%), Asian (0.4%), and other races (2.3%). The median household income in the county is $50,945, and the median home value is $164,400. The unemployment rate in the county is 3.2%.
Mckenzie County is home to several small towns, including Watford City, Alexander, Arnegard, Cartwright, Grassy Butte, and Keene. The county is served by several school districts, including Watford City Public Schools, Alexander Public Schools, and Grassy Butte Public Schools. The county is also home to several higher education institutions, including the University of Mary, Dickinson State University, and Williston State College.
Common Questions
What is the Total Population of McKenzie County?
Total Population of McKenzie County is 14,081.
What is the Total Male Population of McKenzie County?
Total Male Population of McKenzie County is 7,684.
What is the Total Female Population of McKenzie County?
Total Female Population of McKenzie County is 6,397.
What is the Ratio of Males per 100 Females in McKenzie County?
There are 120.12 Males per 100 Females in McKenzie County.
What is the Ratio of Females per 100 Males in McKenzie County?
There are 83.25 Females per 100 Males in McKenzie County.
What is the Median Population Age in McKenzie County?
Median Population Age in McKenzie County is 30.5 Years.
What is the Average Family Size in McKenzie County
Average Family Size in McKenzie County is 3.3 People.
What is the Average Household Size in McKenzie County
Average Household Size in McKenzie County is 2.6 People.
What is Per Capita Income in McKenzie County?
Per Capita income in McKenzie County is $44,409.
What is the Median Family Income in McKenzie County?
Median Family Income in McKenzie County is $102,045.
What is the Median Household income in McKenzie County?
Median Household Income in McKenzie County is $83,813.
What is Income or Wage Gap in McKenzie County?
Income or Wage Gap in McKenzie County is 41.3%.
Women in McKenzie County earn 58.7 cents for every dollar earned by a man.
What is Inequality or Gini Index in McKenzie County?
Inequality or Gini Index in McKenzie County is 0.47.
How Large is the Labor Force in McKenzie County?
There are 6,863 People in the Labor Forcein in McKenzie County.
What is the Percentage of People in the Labor Force in McKenzie County?
69.2% of People are in the Labor Force in McKenzie County.
What is the Unemployment Rate in McKenzie County?
Unemployment Rate in McKenzie County is 1.7%.