McHenry County, ND
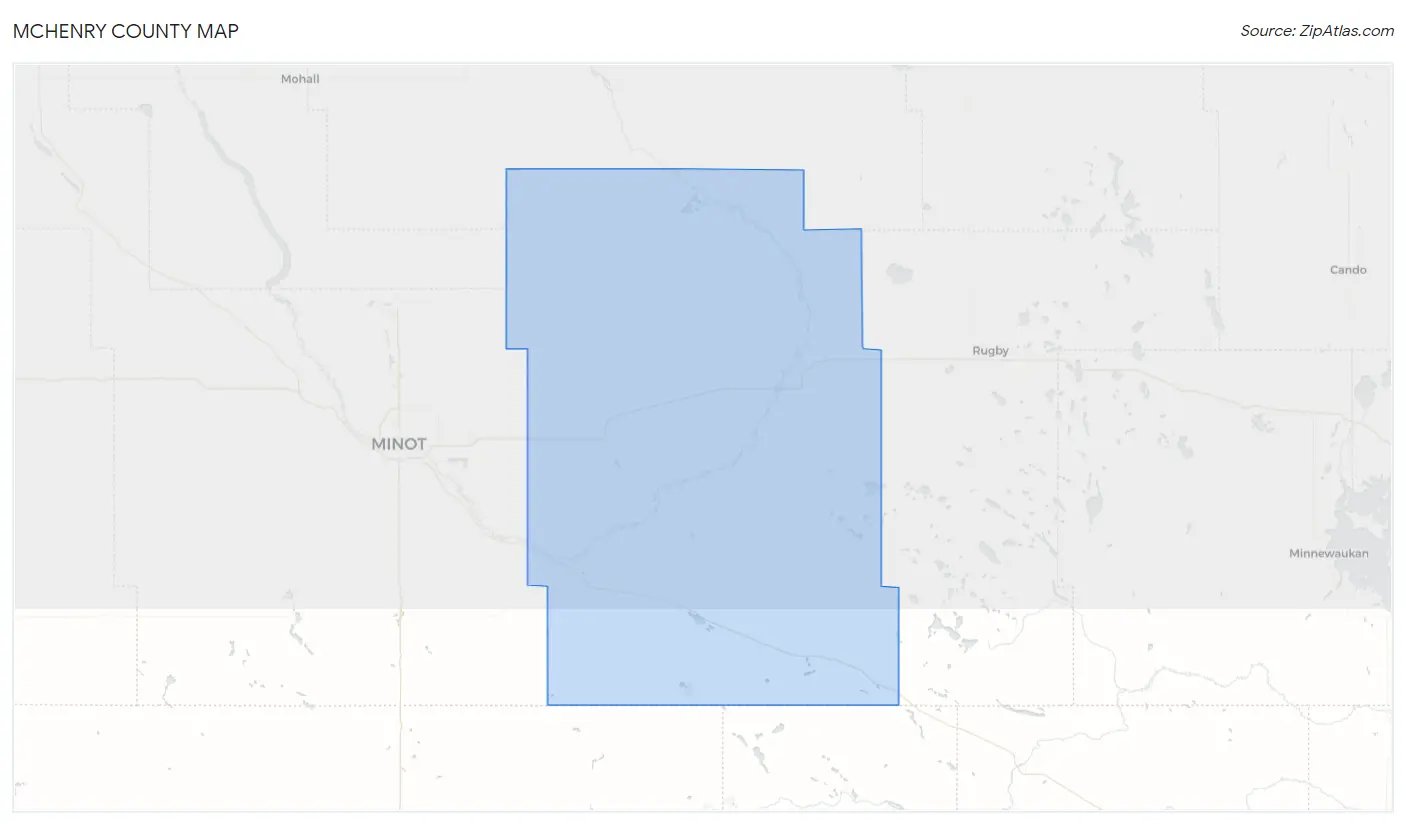
McHenry County Map
McHenry County Overview
5,326
TOTAL POPULATION
2,736
MALE POPULATION
2,590
FEMALE POPULATION
105.64
MALES / 100 FEMALES
94.66
FEMALES / 100 MALES
43.0
MEDIAN AGE
2.8
AVG FAMILY SIZE
2.3
AVG HOUSEHOLD SIZE
$39,973
PER CAPITA INCOME
$95,268
AVG FAMILY INCOME
$78,071
AVG HOUSEHOLD INCOME
37.8%
WAGE / INCOME GAP [ % ]
62.2¢/ $1
WAGE / INCOME GAP [ $ ]
$11,491
FAMILY INCOME DEFICIT
0.43
INEQUALITY / GINI INDEX
2,674
LABOR FORCE [ PEOPLE ]
64.2%
PERCENT IN LABOR FORCE
4.4%
UNEMPLOYMENT RATE
McHenry County Area Codes
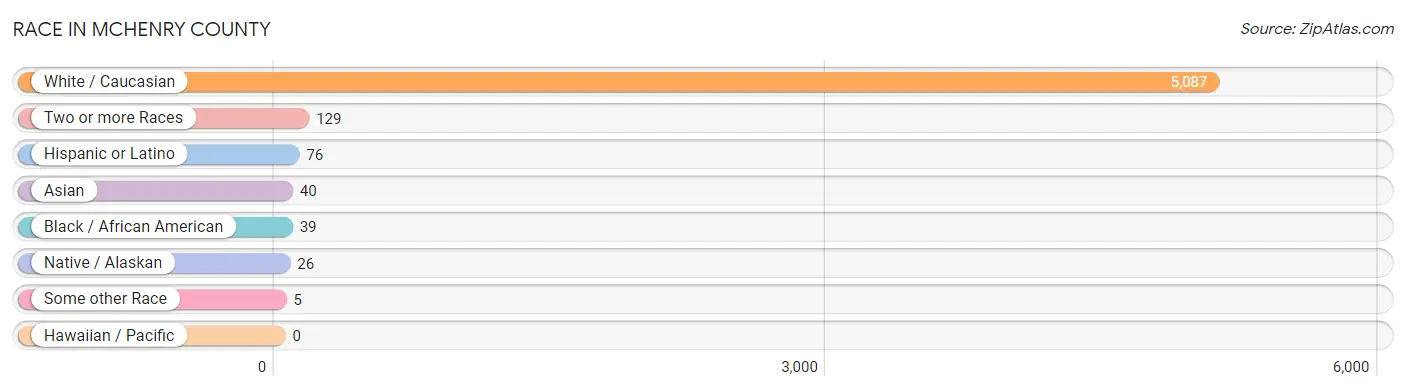
Race in McHenry County
The most populous races in McHenry County are White / Caucasian (5,087 | 95.5%), Two or more Races (129 | 2.4%), and Hispanic or Latino (76 | 1.4%).
| Race | # Population | % Population |
| Asian | 40 | 0.7% |
| Black / African American | 39 | 0.7% |
| Hawaiian / Pacific | 0 | 0.0% |
| Hispanic or Latino | 76 | 1.4% |
| Native / Alaskan | 26 | 0.5% |
| White / Caucasian | 5,087 | 95.5% |
| Two or more Races | 129 | 2.4% |
| Some other Race | 5 | 0.1% |
| Total | 5,326 | 100.0% |
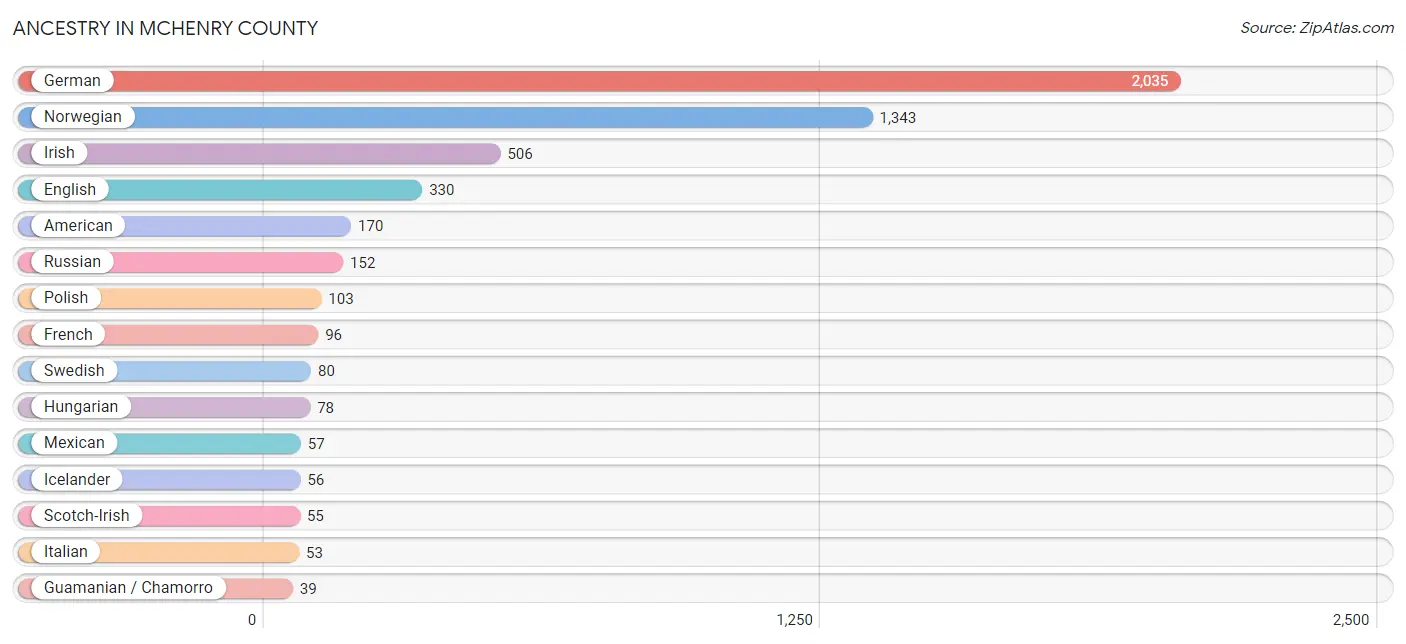
Ancestry in McHenry County
The most populous ancestries reported in McHenry County are German (2,035 | 38.2%), Norwegian (1,343 | 25.2%), Irish (506 | 9.5%), English (330 | 6.2%), and American (170 | 3.2%), together accounting for 82.3% of all McHenry County residents.
| Ancestry | # Population | % Population |
| American | 170 | 3.2% |
| Arab | 1 | 0.0% |
| Austrian | 3 | 0.1% |
| Bermudan | 1 | 0.0% |
| Bhutanese | 27 | 0.5% |
| Blackfeet | 3 | 0.1% |
| Brazilian | 6 | 0.1% |
| Bulgarian | 4 | 0.1% |
| Burmese | 13 | 0.2% |
| Canadian | 1 | 0.0% |
| Cherokee | 3 | 0.1% |
| Chippewa | 13 | 0.2% |
| Czech | 34 | 0.6% |
| Danish | 18 | 0.3% |
| Dutch | 37 | 0.7% |
| Egyptian | 1 | 0.0% |
| English | 330 | 6.2% |
| European | 33 | 0.6% |
| Finnish | 28 | 0.5% |
| French | 96 | 1.8% |
| French Canadian | 13 | 0.2% |
| German | 2,035 | 38.2% |
| German Russian | 2 | 0.0% |
| Greek | 3 | 0.1% |
| Guamanian / Chamorro | 39 | 0.7% |
| Hungarian | 78 | 1.5% |
| Icelander | 56 | 1.1% |
| Irish | 506 | 9.5% |
| Italian | 53 | 1.0% |
| Jamaican | 4 | 0.1% |
| Korean | 12 | 0.2% |
| Latvian | 2 | 0.0% |
| Lithuanian | 8 | 0.2% |
| Luxembourger | 5 | 0.1% |
| Mexican | 57 | 1.1% |
| Native Hawaiian | 5 | 0.1% |
| Northern European | 4 | 0.1% |
| Norwegian | 1,343 | 25.2% |
| Pennsylvania German | 3 | 0.1% |
| Polish | 103 | 1.9% |
| Portuguese | 6 | 0.1% |
| Puerto Rican | 13 | 0.2% |
| Russian | 152 | 2.9% |
| Scandinavian | 14 | 0.3% |
| Scotch-Irish | 55 | 1.0% |
| Scottish | 35 | 0.7% |
| Serbian | 2 | 0.0% |
| Sioux | 17 | 0.3% |
| Slavic | 8 | 0.2% |
| South African | 4 | 0.1% |
| Spanish | 6 | 0.1% |
| Subsaharan African | 4 | 0.1% |
| Swedish | 80 | 1.5% |
| Swiss | 9 | 0.2% |
| Ukrainian | 16 | 0.3% |
| Welsh | 3 | 0.1% |
| Yugoslavian | 3 | 0.1% | View All 57 Rows |
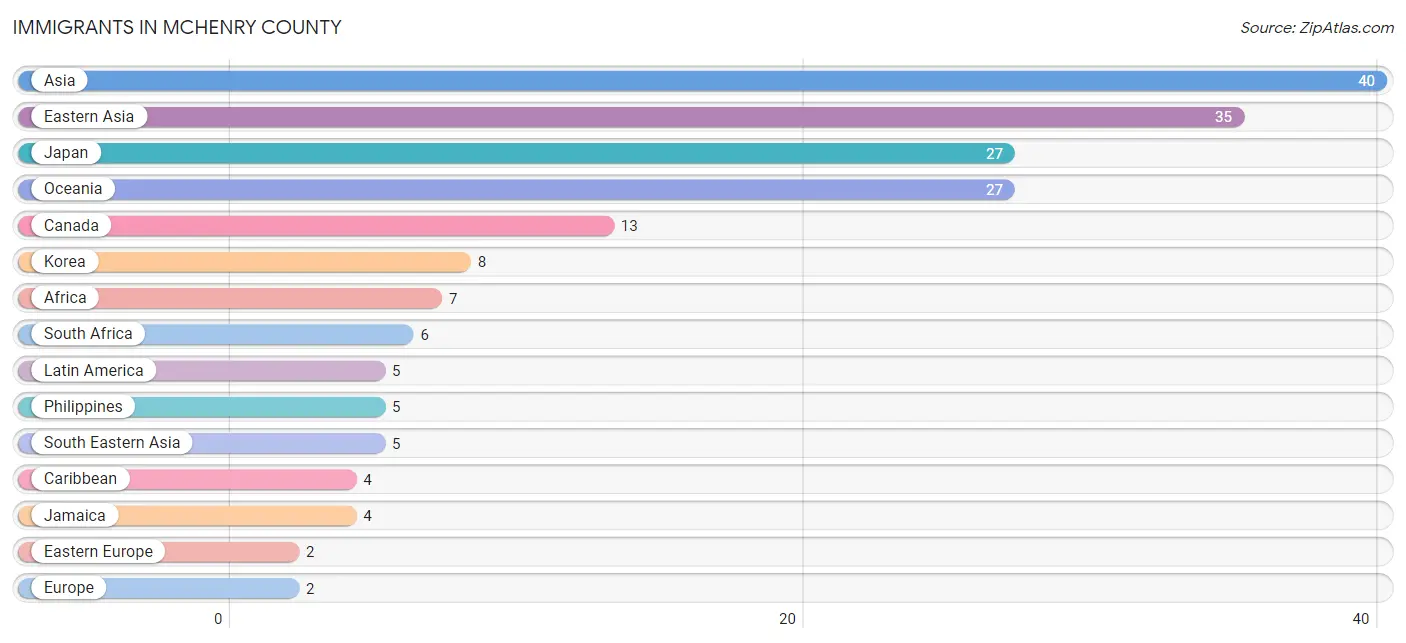
Immigrants in McHenry County
The most numerous immigrant groups reported in McHenry County came from Asia (40 | 0.7%), Eastern Asia (35 | 0.7%), Japan (27 | 0.5%), Oceania (27 | 0.5%), and Canada (13 | 0.2%), together accounting for 2.7% of all McHenry County residents.
| Immigration Origin | # Population | % Population |
| Africa | 7 | 0.1% |
| Asia | 40 | 0.7% |
| Brazil | 1 | 0.0% |
| Canada | 13 | 0.2% |
| Caribbean | 4 | 0.1% |
| Eastern Asia | 35 | 0.7% |
| Eastern Europe | 2 | 0.0% |
| Egypt | 1 | 0.0% |
| Europe | 2 | 0.0% |
| Jamaica | 4 | 0.1% |
| Japan | 27 | 0.5% |
| Korea | 8 | 0.2% |
| Latin America | 5 | 0.1% |
| Latvia | 2 | 0.0% |
| Northern Africa | 1 | 0.0% |
| Oceania | 27 | 0.5% |
| Philippines | 5 | 0.1% |
| South Africa | 6 | 0.1% |
| South America | 1 | 0.0% |
| South Eastern Asia | 5 | 0.1% | View All 20 Rows |
Sex and Age in McHenry County
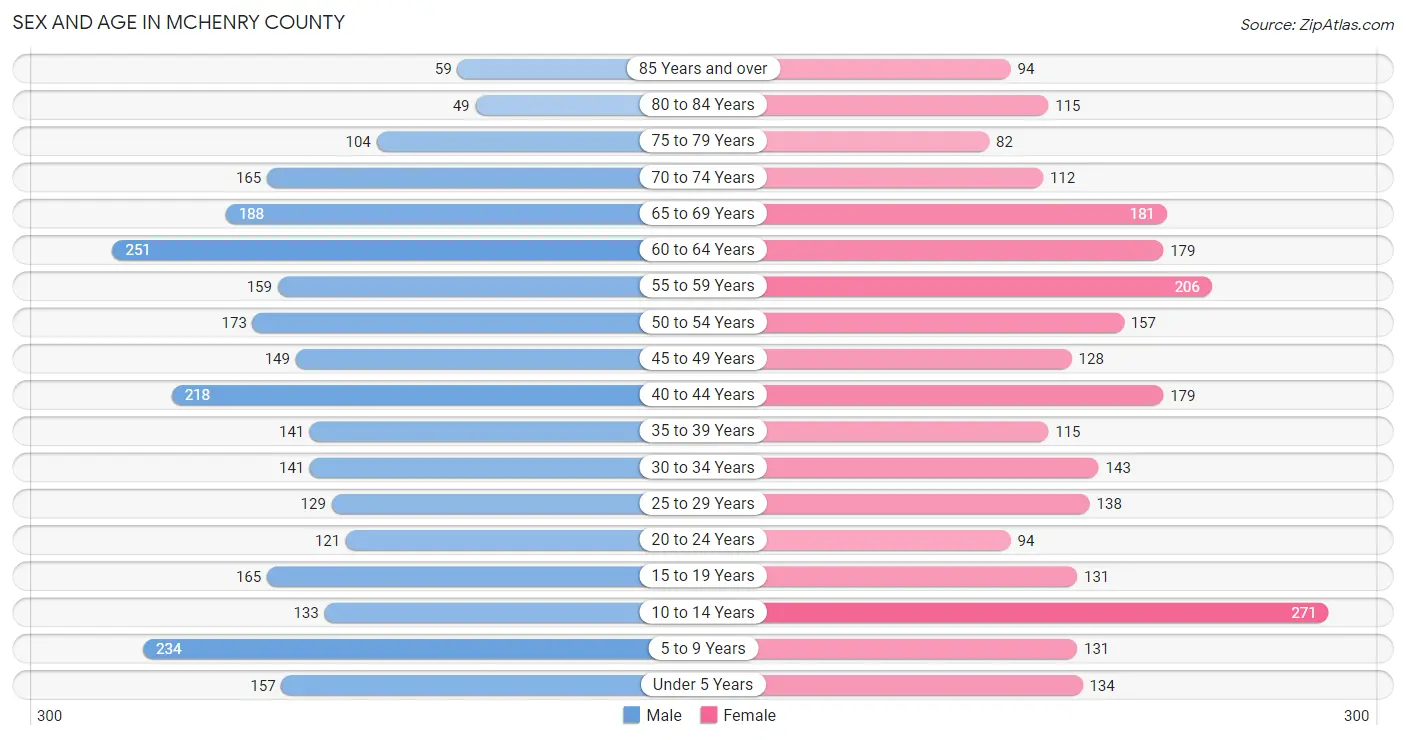
Sex and Age in McHenry County
The most populous age groups in McHenry County are 60 to 64 Years (251 | 9.2%) for men and 10 to 14 Years (271 | 10.5%) for women.
| Age Bracket | Male | Female |
| Under 5 Years | 157 (5.7%) | 134 (5.2%) |
| 5 to 9 Years | 234 (8.6%) | 131 (5.1%) |
| 10 to 14 Years | 133 (4.9%) | 271 (10.5%) |
| 15 to 19 Years | 165 (6.0%) | 131 (5.1%) |
| 20 to 24 Years | 121 (4.4%) | 94 (3.6%) |
| 25 to 29 Years | 129 (4.7%) | 138 (5.3%) |
| 30 to 34 Years | 141 (5.1%) | 143 (5.5%) |
| 35 to 39 Years | 141 (5.1%) | 115 (4.4%) |
| 40 to 44 Years | 218 (8.0%) | 179 (6.9%) |
| 45 to 49 Years | 149 (5.4%) | 128 (4.9%) |
| 50 to 54 Years | 173 (6.3%) | 157 (6.1%) |
| 55 to 59 Years | 159 (5.8%) | 206 (8.0%) |
| 60 to 64 Years | 251 (9.2%) | 179 (6.9%) |
| 65 to 69 Years | 188 (6.9%) | 181 (7.0%) |
| 70 to 74 Years | 165 (6.0%) | 112 (4.3%) |
| 75 to 79 Years | 104 (3.8%) | 82 (3.2%) |
| 80 to 84 Years | 49 (1.8%) | 115 (4.4%) |
| 85 Years and over | 59 (2.2%) | 94 (3.6%) |
| Total | 2,736 (100.0%) | 2,590 (100.0%) |
Families and Households in McHenry County
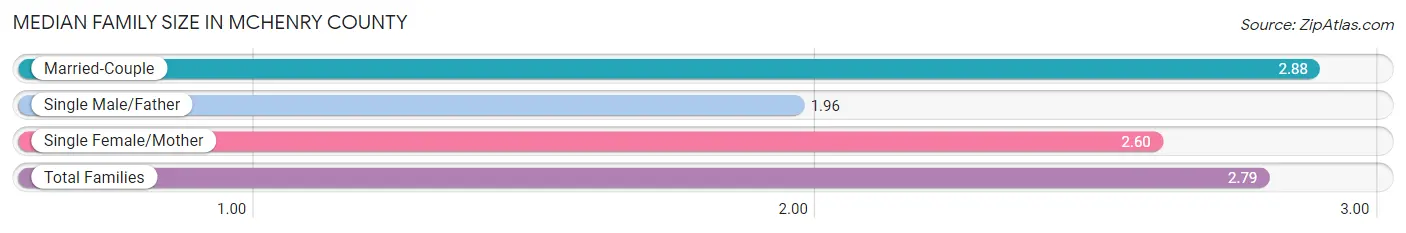
Median Family Size in McHenry County
The median family size in McHenry County is 2.79 persons per family, with married-couple families (1,276 | 83.1%) accounting for the largest median family size of 2.88 persons per family. On the other hand, single male/father families (107 | 7.0%) represent the smallest median family size with 1.96 persons per family.
| Family Type | # Families | Family Size |
| Married-Couple | 1,276 (83.1%) | 2.88 |
| Single Male/Father | 107 (7.0%) | 1.96 |
| Single Female/Mother | 152 (9.9%) | 2.60 |
| Total Families | 1,535 (100.0%) | 2.79 |
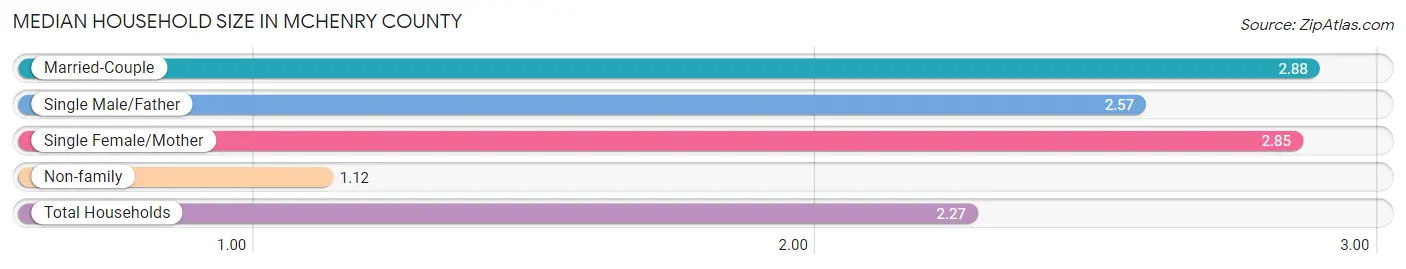
Median Household Size in McHenry County
The median household size in McHenry County is 2.27 persons per household, with married-couple households (1,276 | 55.2%) accounting for the largest median household size of 2.88 persons per household. non-family households (777 | 33.6%) represent the smallest median household size with 1.12 persons per household.
| Household Type | # Households | Household Size |
| Married-Couple | 1,276 (55.2%) | 2.88 |
| Single Male/Father | 107 (4.6%) | 2.57 |
| Single Female/Mother | 152 (6.6%) | 2.85 |
| Non-family | 777 (33.6%) | 1.12 |
| Total Households | 2,312 (100.0%) | 2.27 |
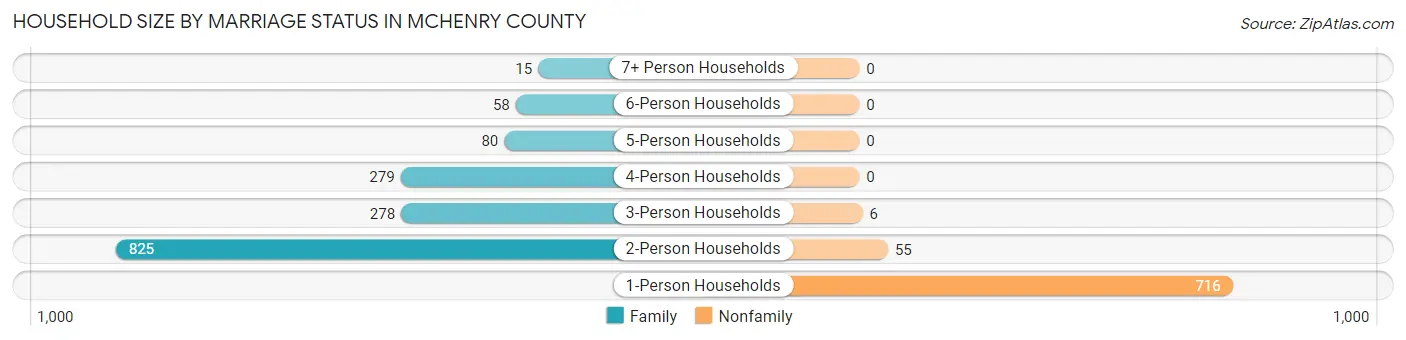
Household Size by Marriage Status in McHenry County
Out of a total of 2,312 households in McHenry County, 1,535 (66.4%) are family households, while 777 (33.6%) are nonfamily households. The most numerous type of family households are 2-person households, comprising 825, and the most common type of nonfamily households are 1-person households, comprising 716.
| Household Size | Family Households | Nonfamily Households |
| 1-Person Households | - | 716 (31.0%) |
| 2-Person Households | 825 (35.7%) | 55 (2.4%) |
| 3-Person Households | 278 (12.0%) | 6 (0.3%) |
| 4-Person Households | 279 (12.1%) | 0 (0.0%) |
| 5-Person Households | 80 (3.5%) | 0 (0.0%) |
| 6-Person Households | 58 (2.5%) | 0 (0.0%) |
| 7+ Person Households | 15 (0.6%) | 0 (0.0%) |
| Total | 1,535 (66.4%) | 777 (33.6%) |
Female Fertility in McHenry County
Fertility by Age in McHenry County
Average fertility rate in McHenry County is 119.0 births per 1,000 women. Women in the age bracket of 20 to 34 years have the highest fertility rate with 272.0 births per 1,000 women. Women in the age bracket of 20 to 34 years acount for 89.5% of all women with births.
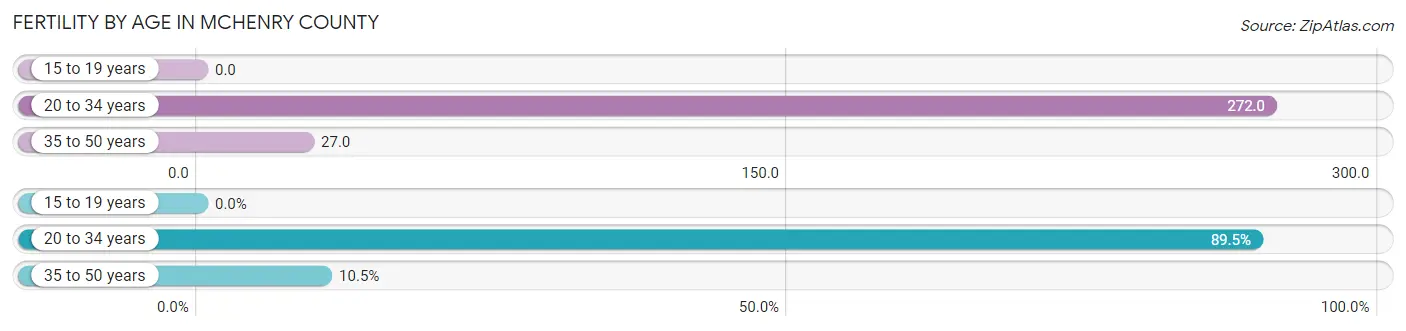
| Age Bracket | Women with Births | Births / 1,000 Women |
| 15 to 19 years | 0 (0.0%) | 0.0 |
| 20 to 34 years | 102 (89.5%) | 272.0 |
| 35 to 50 years | 12 (10.5%) | 27.0 |
| Total | 114 (100.0%) | 119.0 |
Fertility by Age by Marriage Status in McHenry County
60.5% of women with births (114) in McHenry County are married. The highest percentage of unmarried women with births falls into 20 to 34 years age bracket with 44.1% of them unmarried at the time of birth, while the lowest percentage of unmarried women with births belong to 35 to 50 years age bracket with 0.0% of them unmarried.
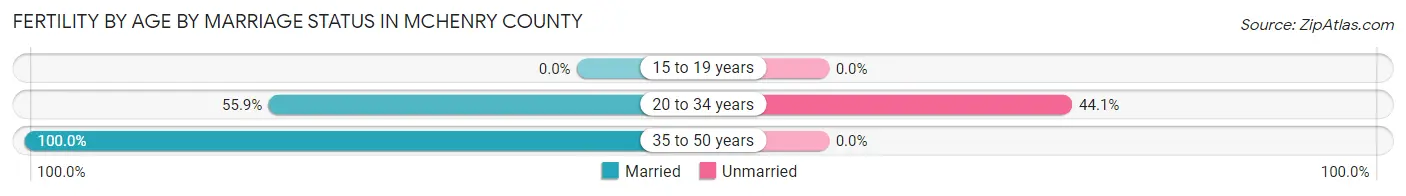
| Age Bracket | Married | Unmarried |
| 15 to 19 years | 0 (0.0%) | 0 (0.0%) |
| 20 to 34 years | 57 (55.9%) | 45 (44.1%) |
| 35 to 50 years | 12 (100.0%) | 0 (0.0%) |
| Total | 69 (60.5%) | 45 (39.5%) |
Fertility by Education in McHenry County
Average fertility rate in McHenry County is 119.0 births per 1,000 women. Women with the education attainment of bachelor's degree have the highest fertility rate of 213.0 births per 1,000 women, while women with the education attainment of less than high school have the lowest fertility at 27.0 births per 1,000 women. Women with the education attainment of college or associate's degree represent 49.1% of all women with births.
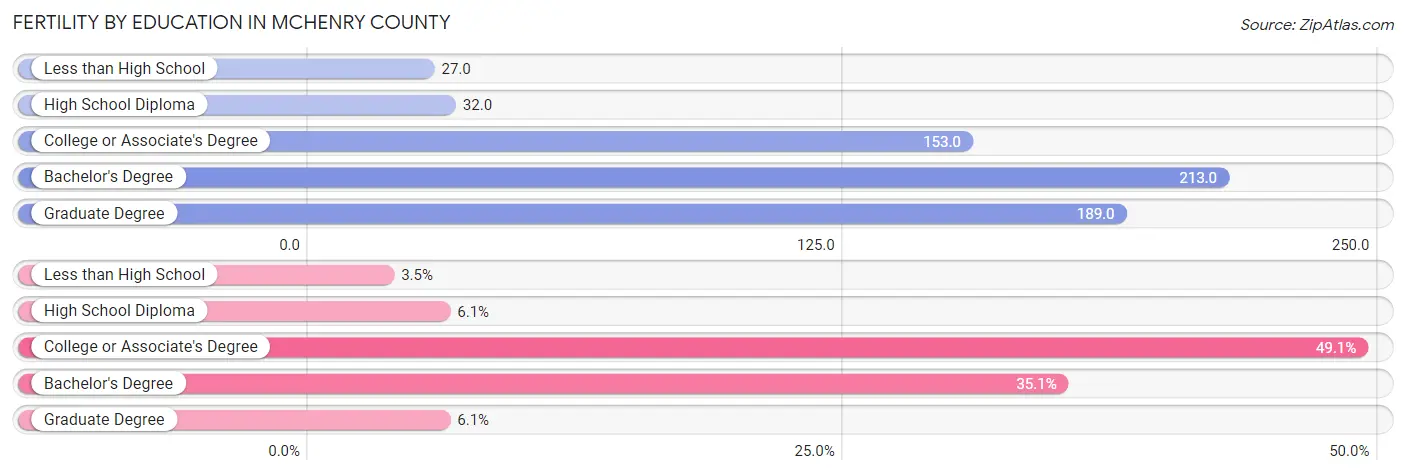
| Educational Attainment | Women with Births | Births / 1,000 Women |
| Less than High School | 4 (3.5%) | 27.0 |
| High School Diploma | 7 (6.1%) | 32.0 |
| College or Associate's Degree | 56 (49.1%) | 153.0 |
| Bachelor's Degree | 40 (35.1%) | 213.0 |
| Graduate Degree | 7 (6.1%) | 189.0 |
| Total | 114 (100.0%) | 119.0 |
Fertility by Education by Marriage Status in McHenry County
39.5% of women with births in McHenry County are unmarried. Women with the educational attainment of less than high school are most likely to be married with 100.0% of them married at childbirth, while women with the educational attainment of high school diploma are least likely to be married with 57.1% of them unmarried at childbirth.
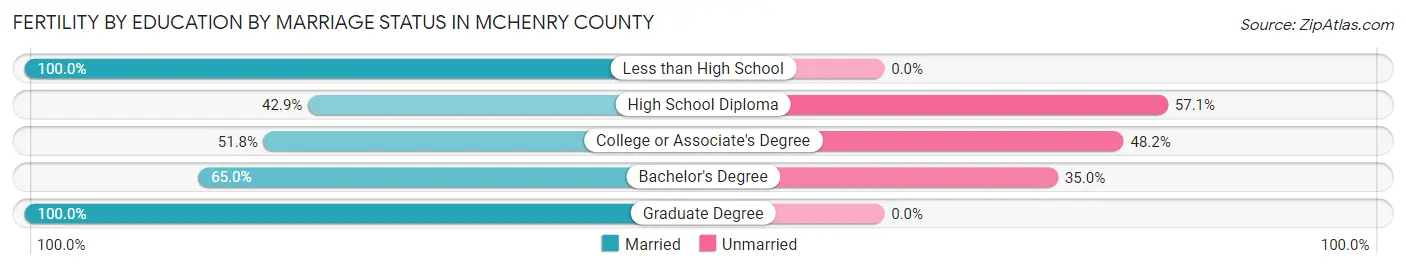
| Educational Attainment | Married | Unmarried |
| Less than High School | 4 (100.0%) | 0 (0.0%) |
| High School Diploma | 3 (42.9%) | 4 (57.1%) |
| College or Associate's Degree | 29 (51.8%) | 27 (48.2%) |
| Bachelor's Degree | 26 (65.0%) | 14 (35.0%) |
| Graduate Degree | 7 (100.0%) | 0 (0.0%) |
| Total | 69 (60.5%) | 45 (39.5%) |
Income in McHenry County
Income Overview in McHenry County
Per Capita Income in McHenry County is $39,973, while median incomes of families and households are $95,268 and $78,071 respectively.
| Characteristic | Number | Measure |
| Per Capita Income | 5,326 | $39,973 |
| Median Family Income | 1,535 | $95,268 |
| Mean Family Income | 1,535 | $104,703 |
| Median Household Income | 2,312 | $78,071 |
| Mean Household Income | 2,312 | $90,514 |
| Income Deficit | 1,535 | $11,491 |
| Wage / Income Gap (%) | 5,326 | 37.77% |
| Wage / Income Gap ($) | 5,326 | 62.23¢ per $1 |
| Gini / Inequality Index | 5,326 | 0.43 |
Earnings by Sex in McHenry County
Average Earnings in McHenry County are $45,550, $57,336 for men and $35,681 for women, a difference of 37.8%.
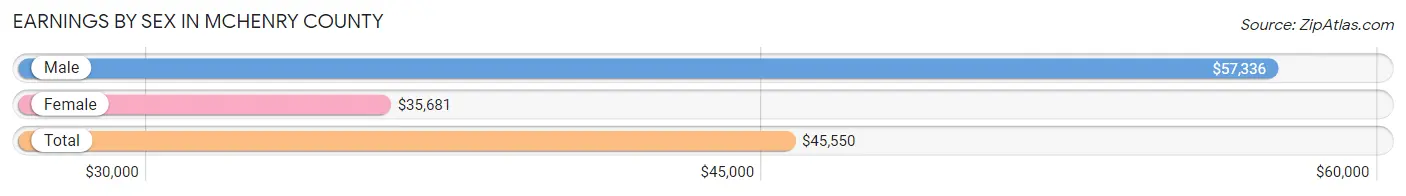
| Sex | Number | Average Earnings |
| Male | 1,606 (55.2%) | $57,336 |
| Female | 1,301 (44.8%) | $35,681 |
| Total | 2,907 (100.0%) | $45,550 |
Earnings by Sex by Income Bracket in McHenry County
The most common earnings brackets in McHenry County are $100,000+ for men (282 | 17.6%) and $45,000 to $49,999 for women (150 | 11.5%).
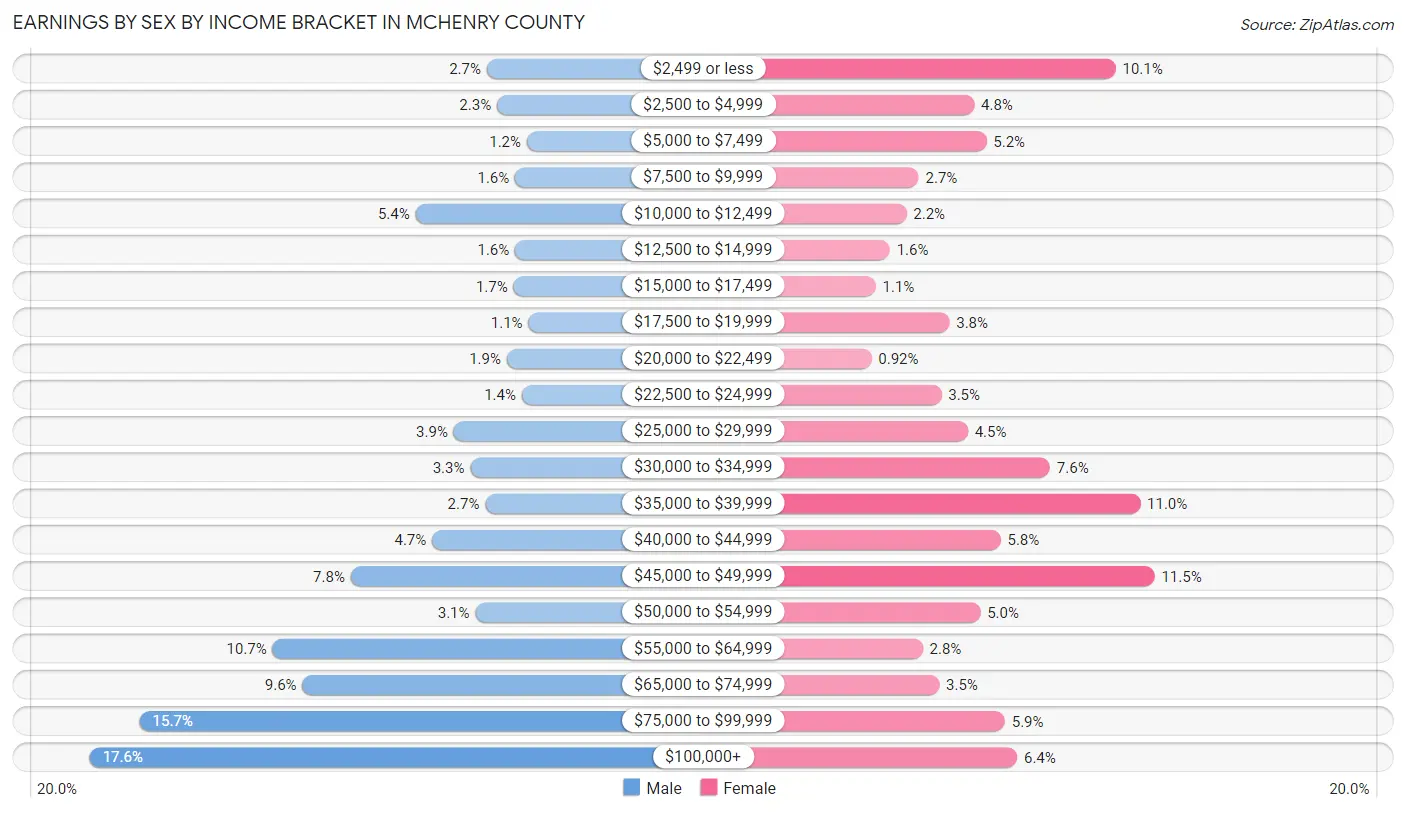
| Income | Male | Female |
| $2,499 or less | 43 (2.7%) | 131 (10.1%) |
| $2,500 to $4,999 | 37 (2.3%) | 62 (4.8%) |
| $5,000 to $7,499 | 19 (1.2%) | 68 (5.2%) |
| $7,500 to $9,999 | 26 (1.6%) | 35 (2.7%) |
| $10,000 to $12,499 | 86 (5.3%) | 29 (2.2%) |
| $12,500 to $14,999 | 26 (1.6%) | 21 (1.6%) |
| $15,000 to $17,499 | 27 (1.7%) | 14 (1.1%) |
| $17,500 to $19,999 | 18 (1.1%) | 50 (3.8%) |
| $20,000 to $22,499 | 31 (1.9%) | 12 (0.9%) |
| $22,500 to $24,999 | 22 (1.4%) | 46 (3.5%) |
| $25,000 to $29,999 | 63 (3.9%) | 59 (4.5%) |
| $30,000 to $34,999 | 53 (3.3%) | 99 (7.6%) |
| $35,000 to $39,999 | 44 (2.7%) | 143 (11.0%) |
| $40,000 to $44,999 | 76 (4.7%) | 75 (5.8%) |
| $45,000 to $49,999 | 125 (7.8%) | 150 (11.5%) |
| $50,000 to $54,999 | 50 (3.1%) | 65 (5.0%) |
| $55,000 to $64,999 | 172 (10.7%) | 37 (2.8%) |
| $65,000 to $74,999 | 154 (9.6%) | 45 (3.5%) |
| $75,000 to $99,999 | 252 (15.7%) | 77 (5.9%) |
| $100,000+ | 282 (17.6%) | 83 (6.4%) |
| Total | 1,606 (100.0%) | 1,301 (100.0%) |
Earnings by Sex by Educational Attainment in McHenry County
Average earnings in McHenry County are $63,068 for men and $37,288 for women, a difference of 40.9%. Men with an educational attainment of bachelor's degree enjoy the highest average annual earnings of $81,389, while those with high school diploma education earn the least with $55,046. Women with an educational attainment of bachelor's degree earn the most with the average annual earnings of $46,417, while those with less than high school education have the smallest earnings of $19,375.
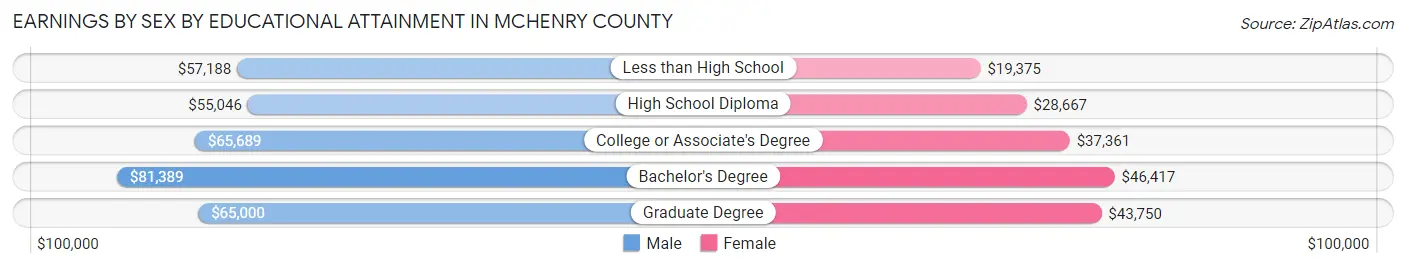
| Educational Attainment | Male Income | Female Income |
| Less than High School | $57,188 | $19,375 |
| High School Diploma | $55,046 | $28,667 |
| College or Associate's Degree | $65,689 | $37,361 |
| Bachelor's Degree | $81,389 | $46,417 |
| Graduate Degree | $65,000 | $43,750 |
| Total | $63,068 | $37,288 |
Family Income in McHenry County
Family Income Brackets in McHenry County
According to the McHenry County family income data, there are 439 families falling into the $100,000 to $149,999 income range, which is the most common income bracket and makes up 28.6% of all families. Conversely, the $10,000 to $14,999 income bracket is the least frequent group with only 18 families (1.2%) belonging to this category.
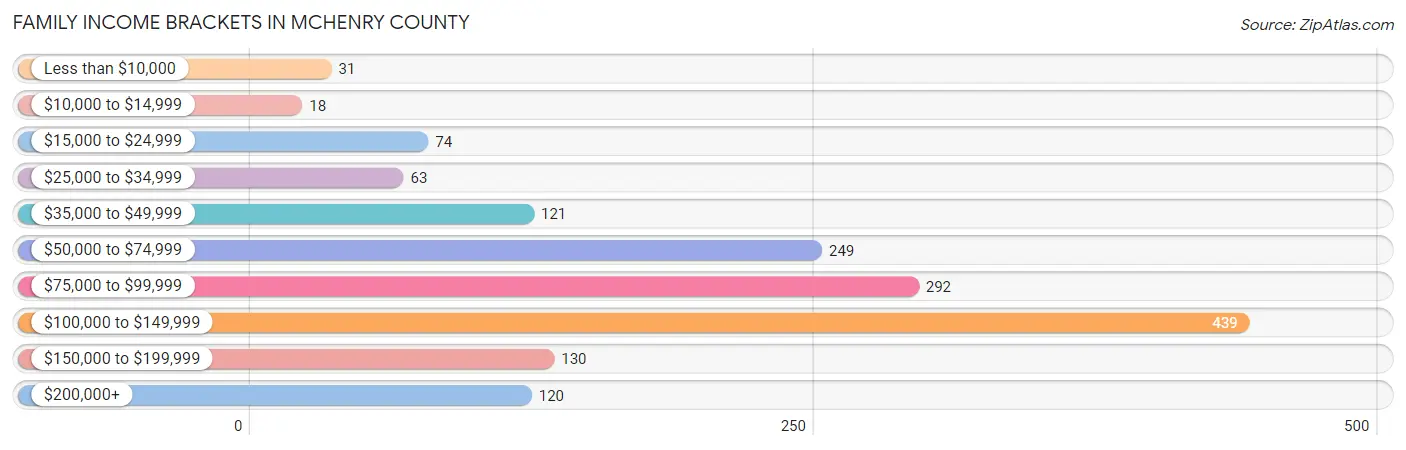
| Income Bracket | # Families | % Families |
| Less than $10,000 | 31 | 2.0% |
| $10,000 to $14,999 | 18 | 1.2% |
| $15,000 to $24,999 | 74 | 4.8% |
| $25,000 to $34,999 | 63 | 4.1% |
| $35,000 to $49,999 | 121 | 7.9% |
| $50,000 to $74,999 | 249 | 16.2% |
| $75,000 to $99,999 | 292 | 19.0% |
| $100,000 to $149,999 | 439 | 28.6% |
| $150,000 to $199,999 | 130 | 8.5% |
| $200,000+ | 120 | 7.8% |
Family Income by Famaliy Size in McHenry County
5-person families (69 | 4.5%) account for the highest median family income in McHenry County with $247,540 per family, while 5-person families (69 | 4.5%) have the highest median income of $49,508 per family member.
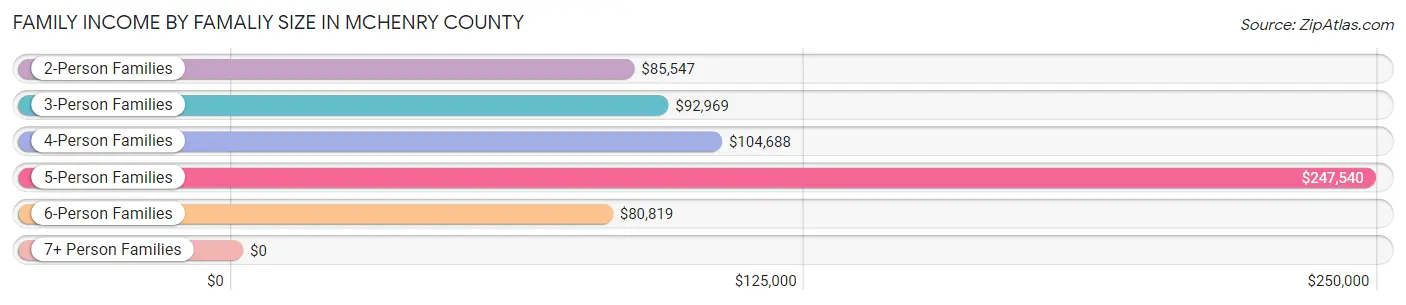
| Income Bracket | # Families | Median Income |
| 2-Person Families | 877 (57.1%) | $85,547 |
| 3-Person Families | 255 (16.6%) | $92,969 |
| 4-Person Families | 262 (17.1%) | $104,688 |
| 5-Person Families | 69 (4.5%) | $247,540 |
| 6-Person Families | 57 (3.7%) | $80,819 |
| 7+ Person Families | 15 (1.0%) | $0 |
| Total | 1,535 (100.0%) | $95,268 |
Family Income by Number of Earners in McHenry County
The median family income in McHenry County is $95,268, with families comprising 3+ earners (78) having the highest median family income of $124,000, while families with no earners (211) have the lowest median family income of $42,250, accounting for 5.1% and 13.8% of families, respectively.
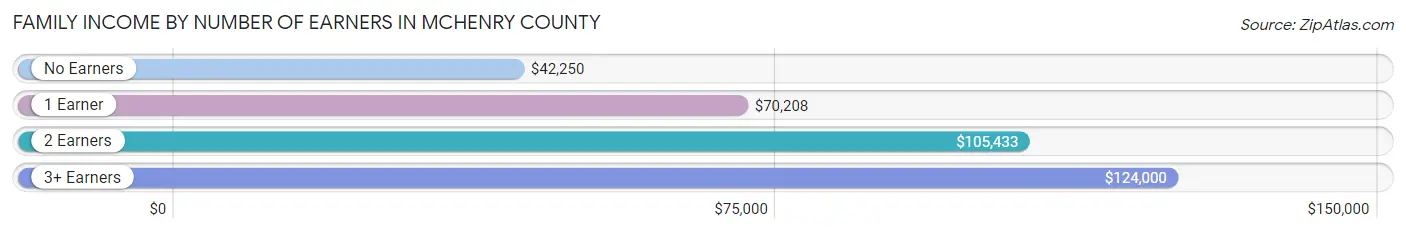
| Number of Earners | # Families | Median Income |
| No Earners | 211 (13.8%) | $42,250 |
| 1 Earner | 409 (26.6%) | $70,208 |
| 2 Earners | 837 (54.5%) | $105,433 |
| 3+ Earners | 78 (5.1%) | $124,000 |
| Total | 1,535 (100.0%) | $95,268 |
Household Income in McHenry County
Household Income Brackets in McHenry County
With 511 households falling in the category, the $100,000 to $149,999 income range is the most frequent in McHenry County, accounting for 22.1% of all households. In contrast, only 83 households (3.6%) fall into the less than $10,000 income bracket, making it the least populous group.
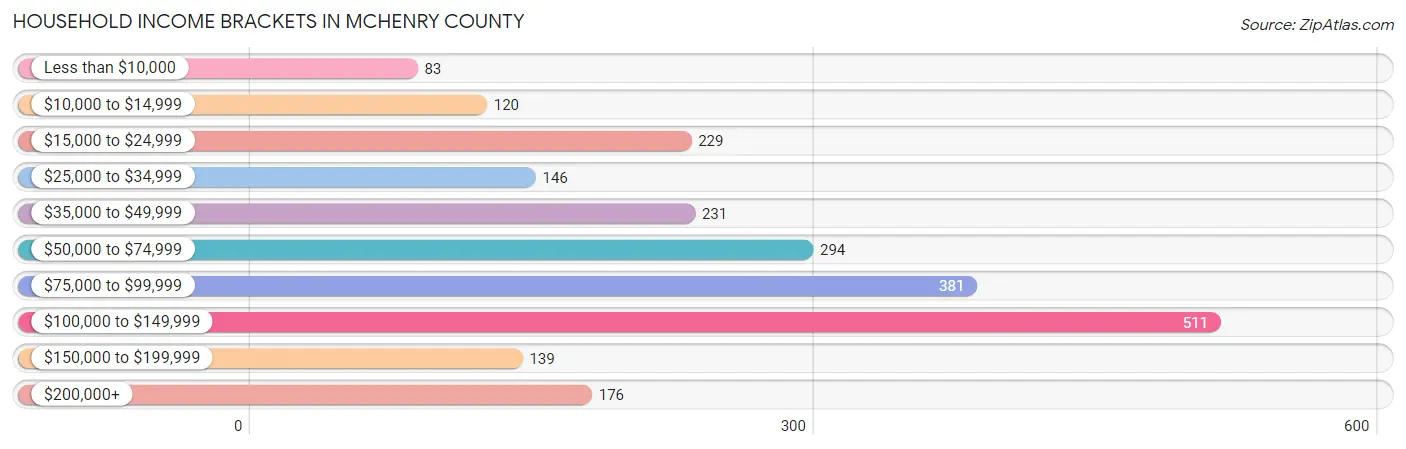
| Income Bracket | # Households | % Households |
| Less than $10,000 | 83 | 3.6% |
| $10,000 to $14,999 | 120 | 5.2% |
| $15,000 to $24,999 | 229 | 9.9% |
| $25,000 to $34,999 | 146 | 6.3% |
| $35,000 to $49,999 | 231 | 10.0% |
| $50,000 to $74,999 | 294 | 12.7% |
| $75,000 to $99,999 | 381 | 16.5% |
| $100,000 to $149,999 | 511 | 22.1% |
| $150,000 to $199,999 | 139 | 6.0% |
| $200,000+ | 176 | 7.6% |
Household Income by Householder Age in McHenry County
The median household income in McHenry County is $78,071, with the highest median household income of $96,250 found in the 45 to 64 years age bracket for the primary householder. A total of 802 households (34.7%) fall into this category. Meanwhile, the 15 to 24 years age bracket for the primary householder has the lowest median household income of $0, with 105 households (4.5%) in this group.
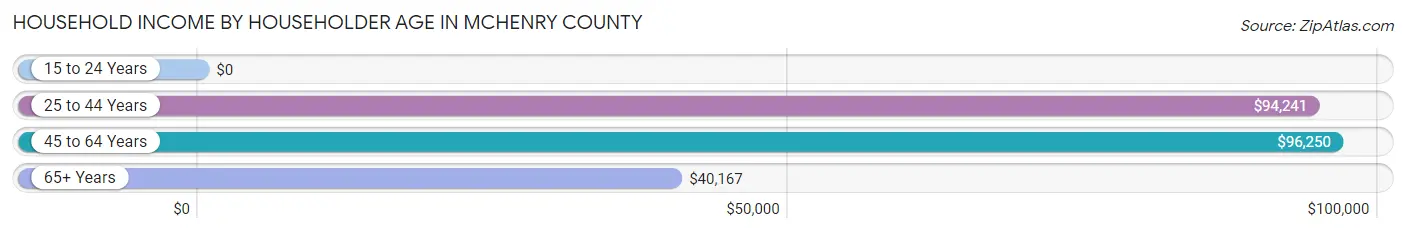
| Income Bracket | # Households | Median Income |
| 15 to 24 Years | 105 (4.5%) | $0 |
| 25 to 44 Years | 641 (27.7%) | $94,241 |
| 45 to 64 Years | 802 (34.7%) | $96,250 |
| 65+ Years | 764 (33.0%) | $40,167 |
| Total | 2,312 (100.0%) | $78,071 |
Poverty in McHenry County
Income Below Poverty by Sex and Age in McHenry County
With 9.6% poverty level for males and 11.0% for females among the residents of McHenry County, 18 to 24 year old males and 75 year old and over females are the most vulnerable to poverty, with 43 males (26.5%) and 83 females (29.9%) in their respective age groups living below the poverty level.
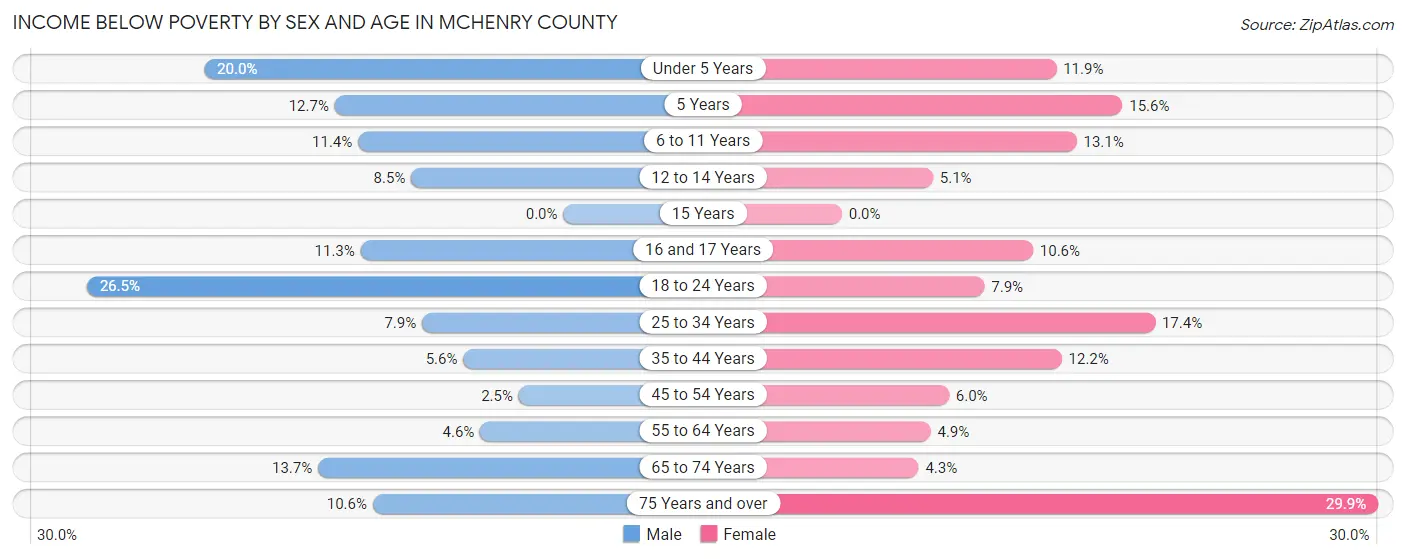
| Age Bracket | Male | Female |
| Under 5 Years | 31 (20.0%) | 16 (11.9%) |
| 5 Years | 7 (12.7%) | 5 (15.6%) |
| 6 to 11 Years | 28 (11.4%) | 20 (13.1%) |
| 12 to 14 Years | 5 (8.5%) | 11 (5.1%) |
| 15 Years | 0 (0.0%) | 0 (0.0%) |
| 16 and 17 Years | 7 (11.3%) | 5 (10.6%) |
| 18 to 24 Years | 43 (26.5%) | 10 (7.9%) |
| 25 to 34 Years | 21 (7.9%) | 49 (17.4%) |
| 35 to 44 Years | 20 (5.6%) | 36 (12.2%) |
| 45 to 54 Years | 8 (2.5%) | 17 (6.0%) |
| 55 to 64 Years | 19 (4.6%) | 19 (4.9%) |
| 65 to 74 Years | 47 (13.7%) | 12 (4.3%) |
| 75 Years and over | 21 (10.6%) | 83 (29.9%) |
| Total | 257 (9.6%) | 283 (11.0%) |
Income Above Poverty by Sex and Age in McHenry County
According to the poverty statistics in McHenry County, males aged 15 years and females aged 15 years are the age groups that are most secure financially, with 100.0% of males and 100.0% of females in these age groups living above the poverty line.
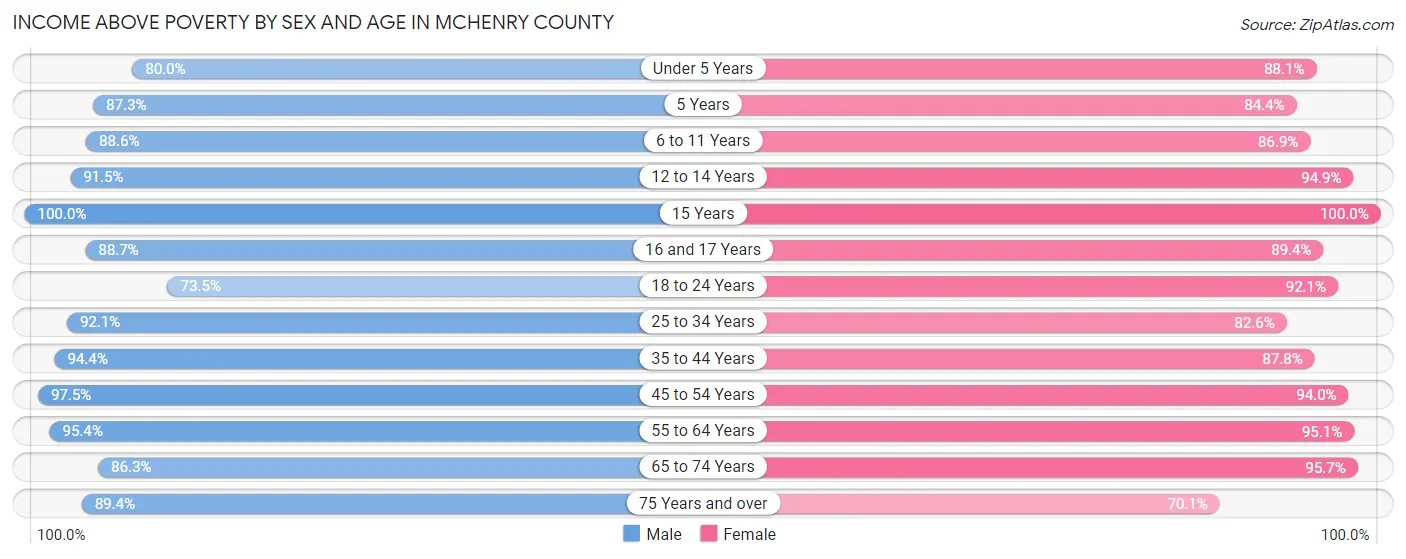
| Age Bracket | Male | Female |
| Under 5 Years | 124 (80.0%) | 118 (88.1%) |
| 5 Years | 48 (87.3%) | 27 (84.4%) |
| 6 to 11 Years | 217 (88.6%) | 133 (86.9%) |
| 12 to 14 Years | 54 (91.5%) | 206 (94.9%) |
| 15 Years | 49 (100.0%) | 52 (100.0%) |
| 16 and 17 Years | 55 (88.7%) | 42 (89.4%) |
| 18 to 24 Years | 119 (73.5%) | 116 (92.1%) |
| 25 to 34 Years | 246 (92.1%) | 232 (82.6%) |
| 35 to 44 Years | 339 (94.4%) | 258 (87.8%) |
| 45 to 54 Years | 314 (97.5%) | 268 (94.0%) |
| 55 to 64 Years | 391 (95.4%) | 366 (95.1%) |
| 65 to 74 Years | 297 (86.3%) | 269 (95.7%) |
| 75 Years and over | 177 (89.4%) | 195 (70.1%) |
| Total | 2,430 (90.4%) | 2,282 (89.0%) |
Income Below Poverty Among Married-Couple Families in McHenry County
The poverty statistics for married-couple families in McHenry County show that 3.8% or 48 of the total 1,276 families live below the poverty line. Families with 5 or more children have the highest poverty rate of 72.7%, comprising of 8 families. On the other hand, families with no children have the lowest poverty rate of 2.6%, which includes 20 families.
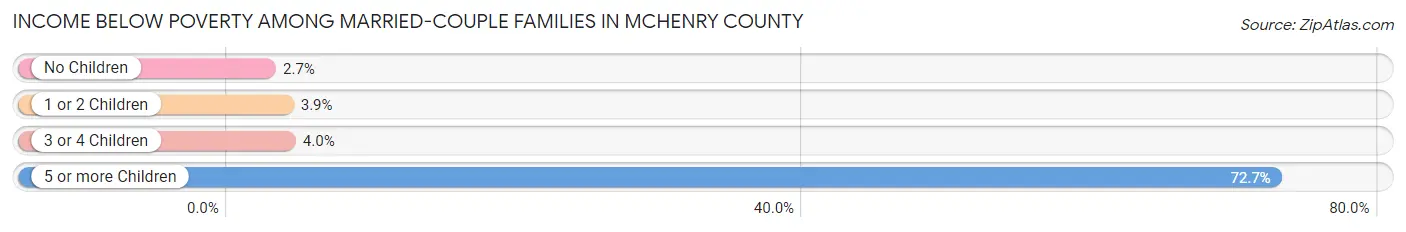
| Children | Above Poverty | Below Poverty |
| No Children | 734 (97.4%) | 20 (2.6%) |
| 1 or 2 Children | 372 (96.1%) | 15 (3.9%) |
| 3 or 4 Children | 119 (96.0%) | 5 (4.0%) |
| 5 or more Children | 3 (27.3%) | 8 (72.7%) |
| Total | 1,228 (96.2%) | 48 (3.8%) |
Income Below Poverty Among Single-Parent Households in McHenry County
According to the poverty data in McHenry County, 10.3% or 11 single-father households and 26.3% or 40 single-mother households are living below the poverty line. Among single-father households, those with 1 or 2 children have the highest poverty rate, with 9 households (15.2%) experiencing poverty. Likewise, among single-mother households, those with 3 or 4 children have the highest poverty rate, with 17 households (80.9%) falling below the poverty line.
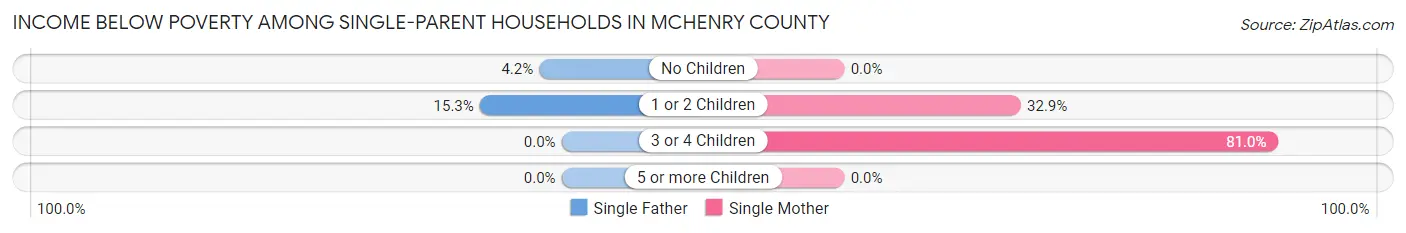
| Children | Single Father | Single Mother |
| No Children | 2 (4.2%) | 0 (0.0%) |
| 1 or 2 Children | 9 (15.2%) | 23 (32.9%) |
| 3 or 4 Children | 0 (0.0%) | 17 (80.9%) |
| 5 or more Children | 0 (0.0%) | 0 (0.0%) |
| Total | 11 (10.3%) | 40 (26.3%) |
Income Below Poverty Among Married-Couple vs Single-Parent Households in McHenry County
The poverty data for McHenry County shows that 48 of the married-couple family households (3.8%) and 51 of the single-parent households (19.7%) are living below the poverty level. Within the married-couple family households, those with 5 or more children have the highest poverty rate, with 8 households (72.7%) falling below the poverty line. Among the single-parent households, those with 3 or 4 children have the highest poverty rate, with 17 household (80.9%) living below poverty.
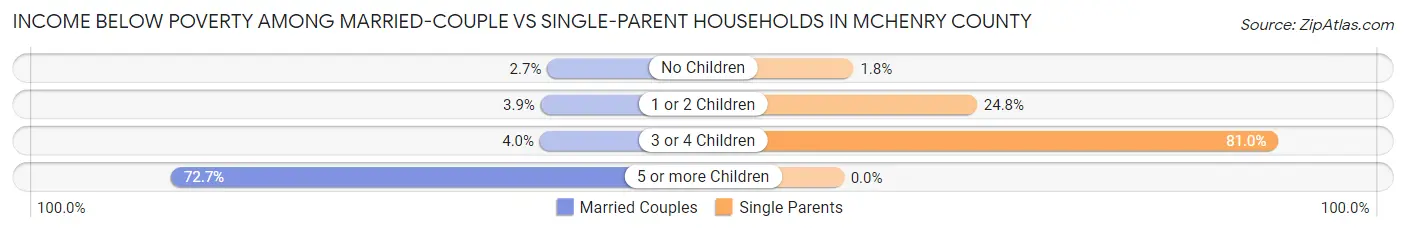
| Children | Married-Couple Families | Single-Parent Households |
| No Children | 20 (2.6%) | 2 (1.8%) |
| 1 or 2 Children | 15 (3.9%) | 32 (24.8%) |
| 3 or 4 Children | 5 (4.0%) | 17 (80.9%) |
| 5 or more Children | 8 (72.7%) | 0 (0.0%) |
| Total | 48 (3.8%) | 51 (19.7%) |
Employment Characteristics in McHenry County
Employment by Class of Employer in McHenry County
Among the 2,501 employed individuals in McHenry County, private company employees (1,254 | 50.1%), self-employed (not incorporated) (418 | 16.7%), and not-for-profit organizations (229 | 9.2%) make up the most common classes of employment.
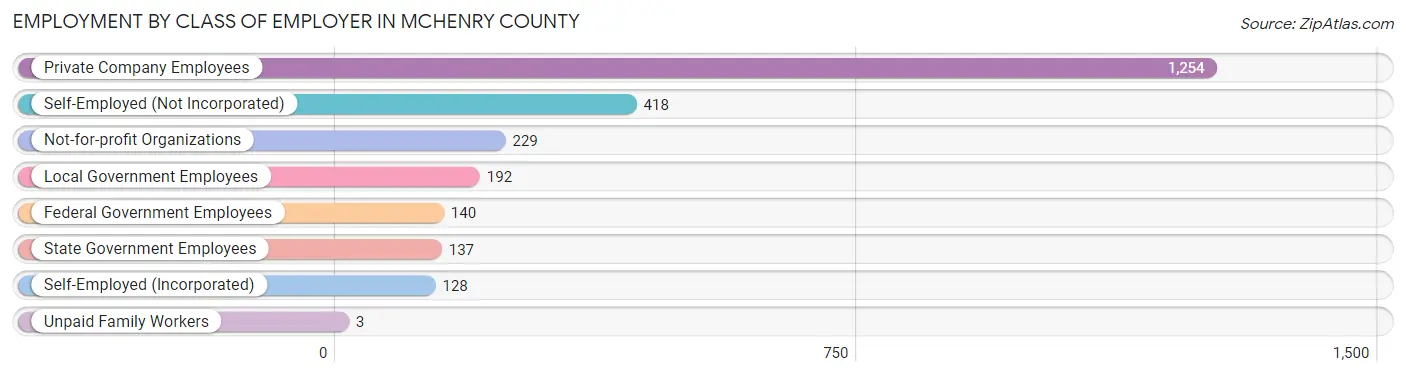
| Employer Class | # Employees | % Employees |
| Private Company Employees | 1,254 | 50.1% |
| Self-Employed (Incorporated) | 128 | 5.1% |
| Self-Employed (Not Incorporated) | 418 | 16.7% |
| Not-for-profit Organizations | 229 | 9.2% |
| Local Government Employees | 192 | 7.7% |
| State Government Employees | 137 | 5.5% |
| Federal Government Employees | 140 | 5.6% |
| Unpaid Family Workers | 3 | 0.1% |
| Total | 2,501 | 100.0% |
Employment Status by Age in McHenry County
According to the labor force statistics for McHenry County, out of the total population over 16 years of age (4,165), 64.2% or 2,674 individuals are in the labor force, with 4.4% or 118 of them unemployed. The age group with the highest labor force participation rate is 20 to 24 years, with 89.3% or 192 individuals in the labor force. Within the labor force, the 25 to 29 years age range has the highest percentage of unemployed individuals, with 24.3% or 54 of them being unemployed.
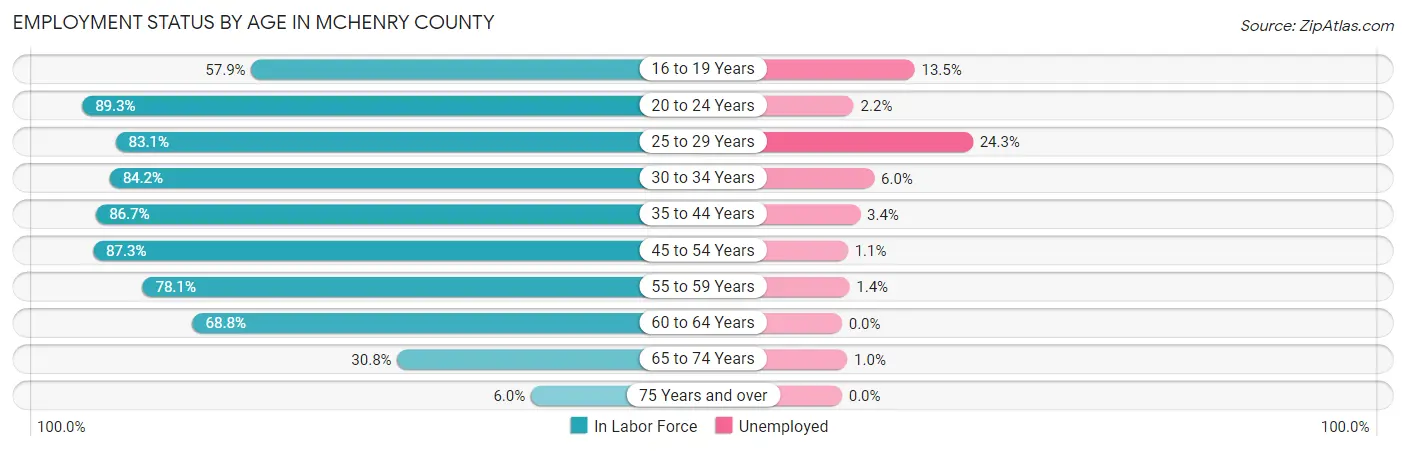
| Age Bracket | In Labor Force | Unemployed |
| 16 to 19 Years | 113 (57.9%) | 15 (13.5%) |
| 20 to 24 Years | 192 (89.3%) | 4 (2.2%) |
| 25 to 29 Years | 222 (83.1%) | 54 (24.3%) |
| 30 to 34 Years | 239 (84.2%) | 14 (6.0%) |
| 35 to 44 Years | 566 (86.7%) | 19 (3.4%) |
| 45 to 54 Years | 530 (87.3%) | 6 (1.1%) |
| 55 to 59 Years | 285 (78.1%) | 4 (1.4%) |
| 60 to 64 Years | 296 (68.8%) | 0 (0.0%) |
| 65 to 74 Years | 199 (30.8%) | 2 (1.0%) |
| 75 Years and over | 30 (6.0%) | 0 (0.0%) |
| Total | 2,674 (64.2%) | 118 (4.4%) |
Employment Status by Educational Attainment in McHenry County
According to labor force statistics for McHenry County, 82.0% of individuals (2,137) out of the total population between 25 and 64 years of age (2,606) are in the labor force, with 4.5% or 96 of them being unemployed. The group with the highest labor force participation rate are those with the educational attainment of bachelor's degree or higher, with 88.3% or 519 individuals in the labor force. Within the labor force, individuals with less than high school education have the highest percentage of unemployment, with 6.5% or 8 of them being unemployed.
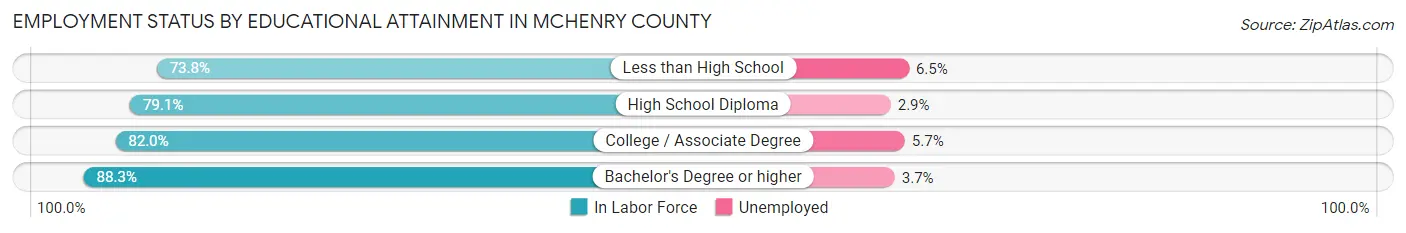
| Educational Attainment | In Labor Force | Unemployed |
| Less than High School | 124 (73.8%) | 11 (6.5%) |
| High School Diploma | 611 (79.1%) | 22 (2.9%) |
| College / Associate Degree | 884 (82.0%) | 61 (5.7%) |
| Bachelor's Degree or higher | 519 (88.3%) | 22 (3.7%) |
| Total | 2,137 (82.0%) | 117 (4.5%) |
Employment Occupations by Sex in McHenry County
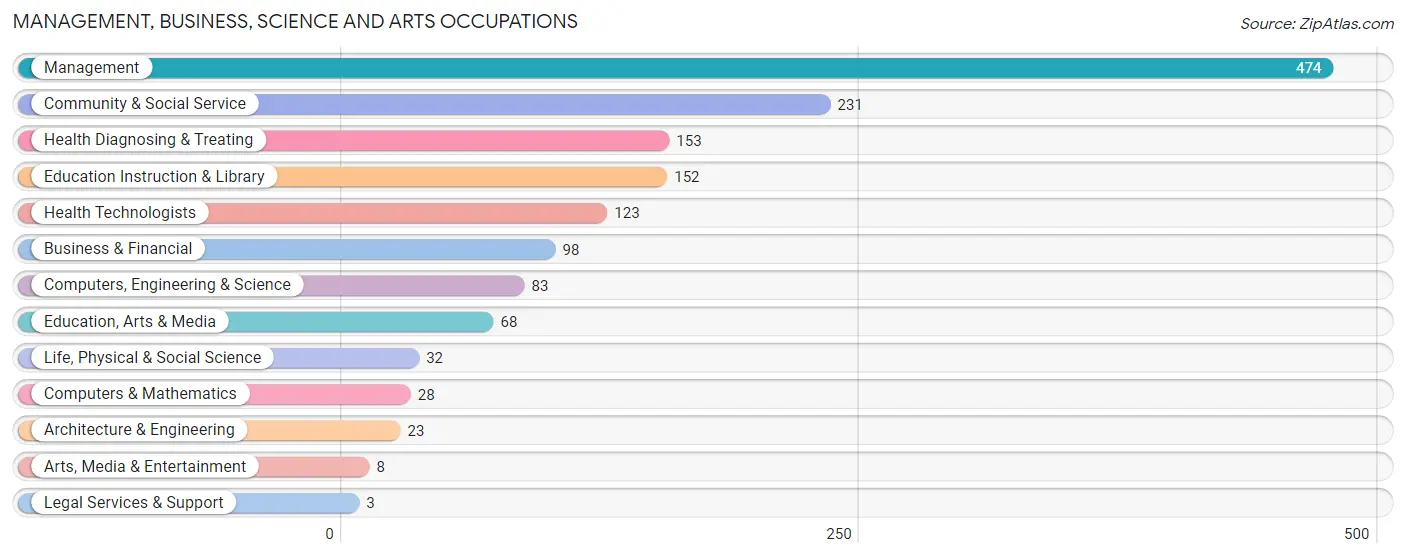
Management, Business, Science and Arts Occupations
The most common Management, Business, Science and Arts occupations in McHenry County are Management (474 | 18.7%), Community & Social Service (231 | 9.1%), Health Diagnosing & Treating (153 | 6.0%), Education Instruction & Library (152 | 6.0%), and Health Technologists (123 | 4.9%).
Management, Business, Science and Arts Occupations by Sex
Within the Management, Business, Science and Arts occupations in McHenry County, the most male-oriented occupations are Computers & Mathematics (96.4%), Management (86.1%), and Life, Physical & Social Science (81.2%), while the most female-oriented occupations are Legal Services & Support (100.0%), Arts, Media & Entertainment (100.0%), and Health Diagnosing & Treating (87.6%).
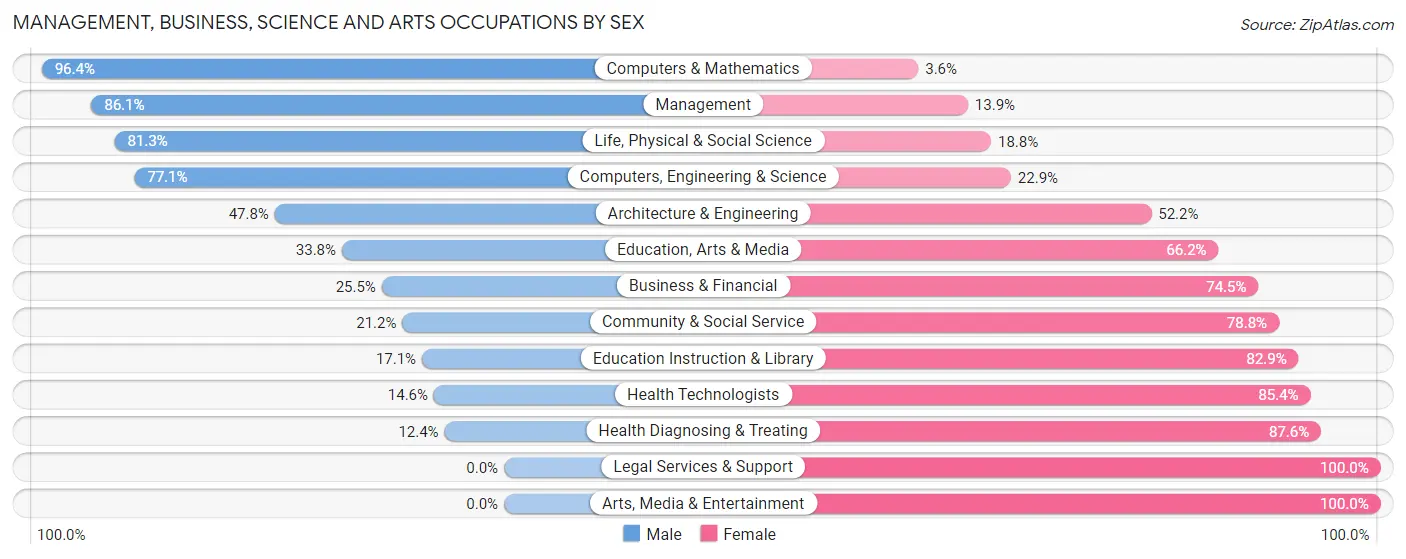
| Occupation | Male | Female |
| Management | 408 (86.1%) | 66 (13.9%) |
| Business & Financial | 25 (25.5%) | 73 (74.5%) |
| Computers, Engineering & Science | 64 (77.1%) | 19 (22.9%) |
| Computers & Mathematics | 27 (96.4%) | 1 (3.6%) |
| Architecture & Engineering | 11 (47.8%) | 12 (52.2%) |
| Life, Physical & Social Science | 26 (81.2%) | 6 (18.8%) |
| Community & Social Service | 49 (21.2%) | 182 (78.8%) |
| Education, Arts & Media | 23 (33.8%) | 45 (66.2%) |
| Legal Services & Support | 0 (0.0%) | 3 (100.0%) |
| Education Instruction & Library | 26 (17.1%) | 126 (82.9%) |
| Arts, Media & Entertainment | 0 (0.0%) | 8 (100.0%) |
| Health Diagnosing & Treating | 19 (12.4%) | 134 (87.6%) |
| Health Technologists | 18 (14.6%) | 105 (85.4%) |
| Total (Category) | 565 (54.4%) | 474 (45.6%) |
| Total (Overall) | 1,448 (57.1%) | 1,088 (42.9%) |
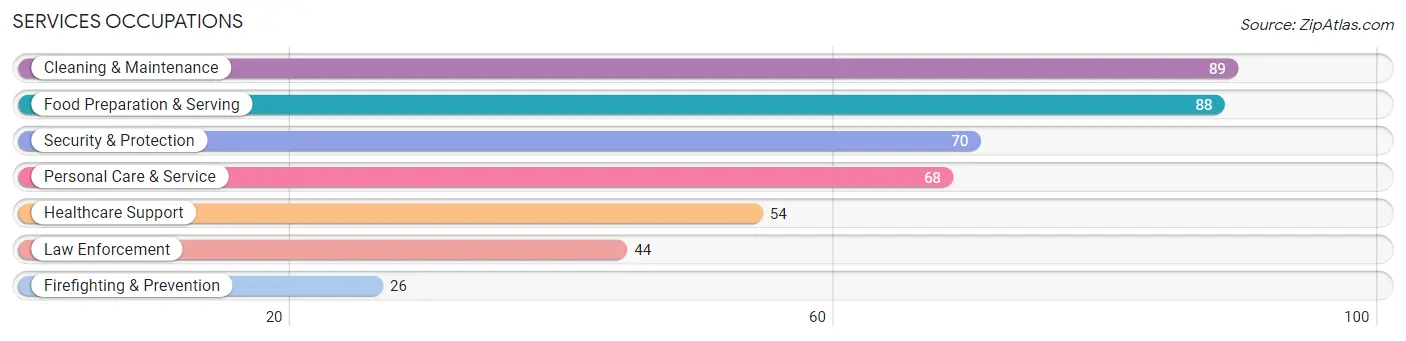
Services Occupations
The most common Services occupations in McHenry County are Cleaning & Maintenance (89 | 3.5%), Food Preparation & Serving (88 | 3.5%), Security & Protection (70 | 2.8%), Personal Care & Service (68 | 2.7%), and Healthcare Support (54 | 2.1%).
Services Occupations by Sex
Within the Services occupations in McHenry County, the most male-oriented occupations are Law Enforcement (97.7%), Security & Protection (82.9%), and Cleaning & Maintenance (64.0%), while the most female-oriented occupations are Food Preparation & Serving (88.6%), Healthcare Support (87.0%), and Personal Care & Service (60.3%).
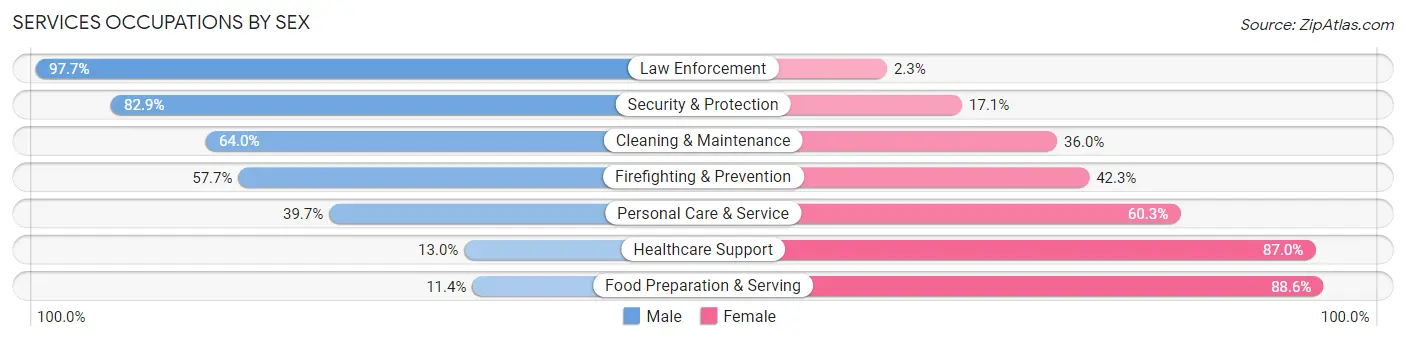
| Occupation | Male | Female |
| Healthcare Support | 7 (13.0%) | 47 (87.0%) |
| Security & Protection | 58 (82.9%) | 12 (17.1%) |
| Firefighting & Prevention | 15 (57.7%) | 11 (42.3%) |
| Law Enforcement | 43 (97.7%) | 1 (2.3%) |
| Food Preparation & Serving | 10 (11.4%) | 78 (88.6%) |
| Cleaning & Maintenance | 57 (64.0%) | 32 (36.0%) |
| Personal Care & Service | 27 (39.7%) | 41 (60.3%) |
| Total (Category) | 159 (43.1%) | 210 (56.9%) |
| Total (Overall) | 1,448 (57.1%) | 1,088 (42.9%) |
Sales and Office Occupations
The most common Sales and Office occupations in McHenry County are Office & Administration (283 | 11.2%), and Sales & Related (185 | 7.3%).
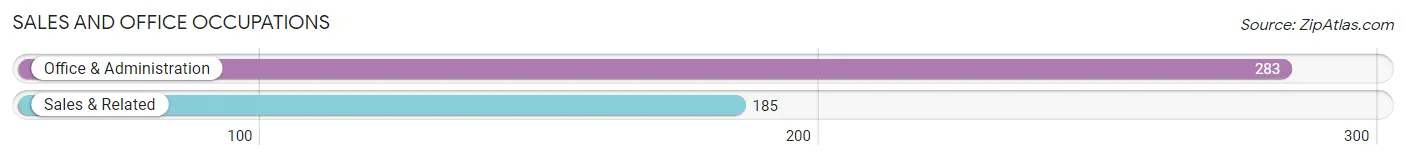
Sales and Office Occupations by Sex

| Occupation | Male | Female |
| Sales & Related | 77 (41.6%) | 108 (58.4%) |
| Office & Administration | 60 (21.2%) | 223 (78.8%) |
| Total (Category) | 137 (29.3%) | 331 (70.7%) |
| Total (Overall) | 1,448 (57.1%) | 1,088 (42.9%) |
Natural Resources, Construction and Maintenance Occupations
The most common Natural Resources, Construction and Maintenance occupations in McHenry County are Construction & Extraction (144 | 5.7%), Installation, Maintenance & Repair (128 | 5.1%), and Farming, Fishing & Forestry (69 | 2.7%).
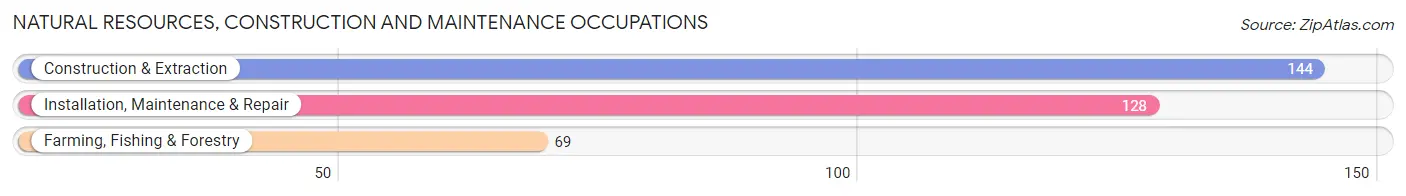
Natural Resources, Construction and Maintenance Occupations by Sex

| Occupation | Male | Female |
| Farming, Fishing & Forestry | 63 (91.3%) | 6 (8.7%) |
| Construction & Extraction | 144 (100.0%) | 0 (0.0%) |
| Installation, Maintenance & Repair | 125 (97.7%) | 3 (2.3%) |
| Total (Category) | 332 (97.4%) | 9 (2.6%) |
| Total (Overall) | 1,448 (57.1%) | 1,088 (42.9%) |
Production, Transportation and Moving Occupations
The most common Production, Transportation and Moving occupations in McHenry County are Transportation (129 | 5.1%), Production (101 | 4.0%), and Material Moving (89 | 3.5%).
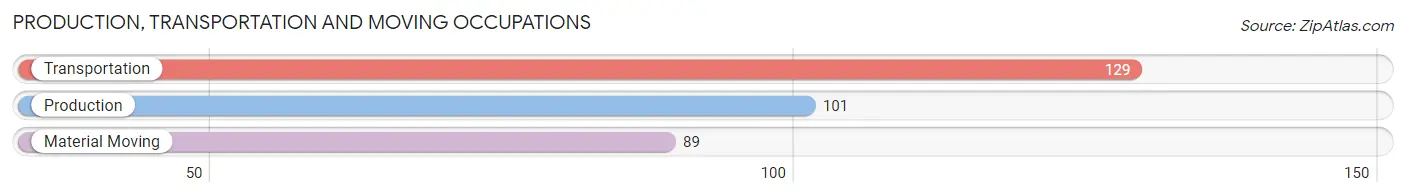
Production, Transportation and Moving Occupations by Sex

| Occupation | Male | Female |
| Production | 85 (84.2%) | 16 (15.8%) |
| Transportation | 109 (84.5%) | 20 (15.5%) |
| Material Moving | 61 (68.5%) | 28 (31.5%) |
| Total (Category) | 255 (79.9%) | 64 (20.1%) |
| Total (Overall) | 1,448 (57.1%) | 1,088 (42.9%) |
Employment Industries by Sex in McHenry County
Employment Industries in McHenry County
The major employment industries in McHenry County include Agriculture, Fishing & Hunting (498 | 19.6%), Health Care & Social Assistance (281 | 11.1%), Educational Services (218 | 8.6%), Retail Trade (201 | 7.9%), and Transportation & Warehousing (178 | 7.0%).
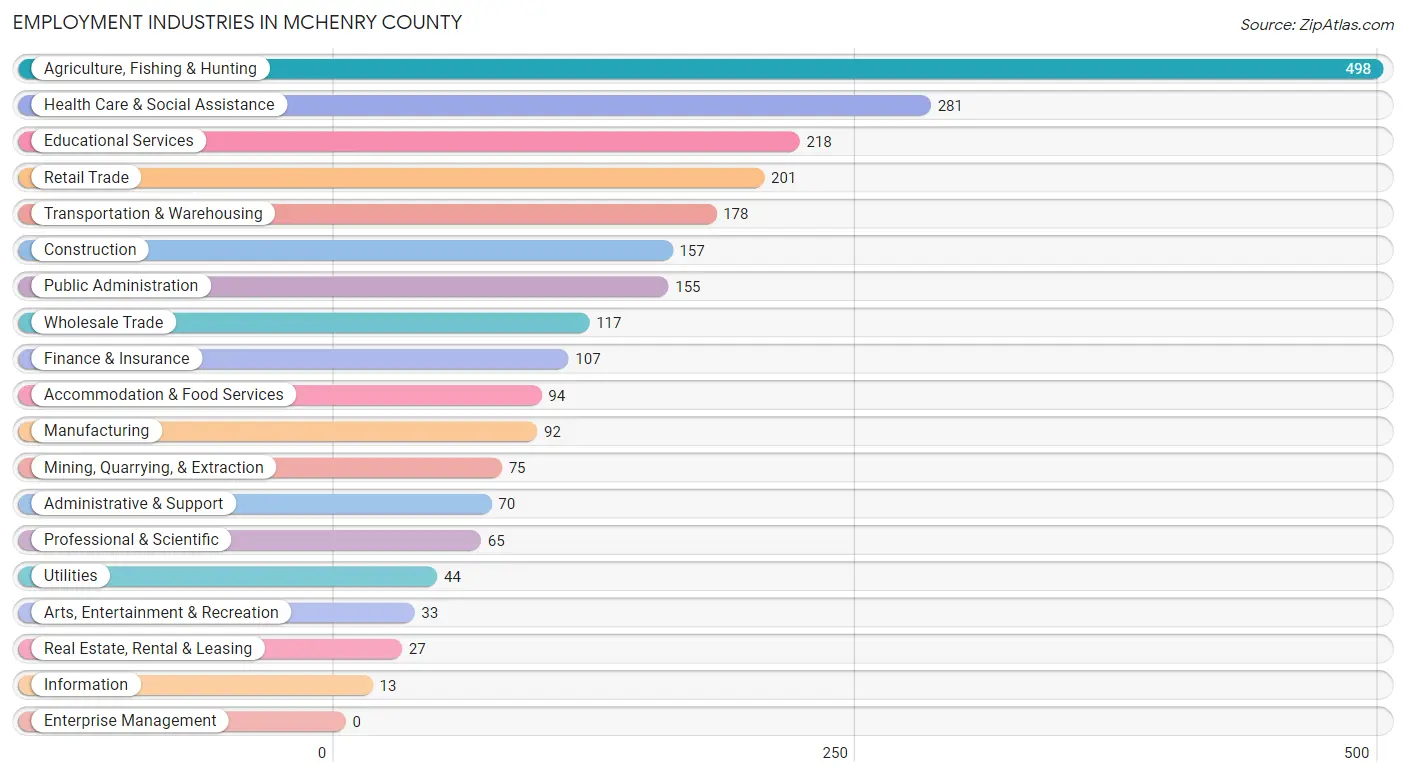
Employment Industries by Sex in McHenry County
The McHenry County industries that see more men than women are Construction (97.5%), Mining, Quarrying, & Extraction (97.3%), and Utilities (95.5%), whereas the industries that tend to have a higher number of women are Health Care & Social Assistance (90.7%), Finance & Insurance (87.8%), and Accommodation & Food Services (85.1%).
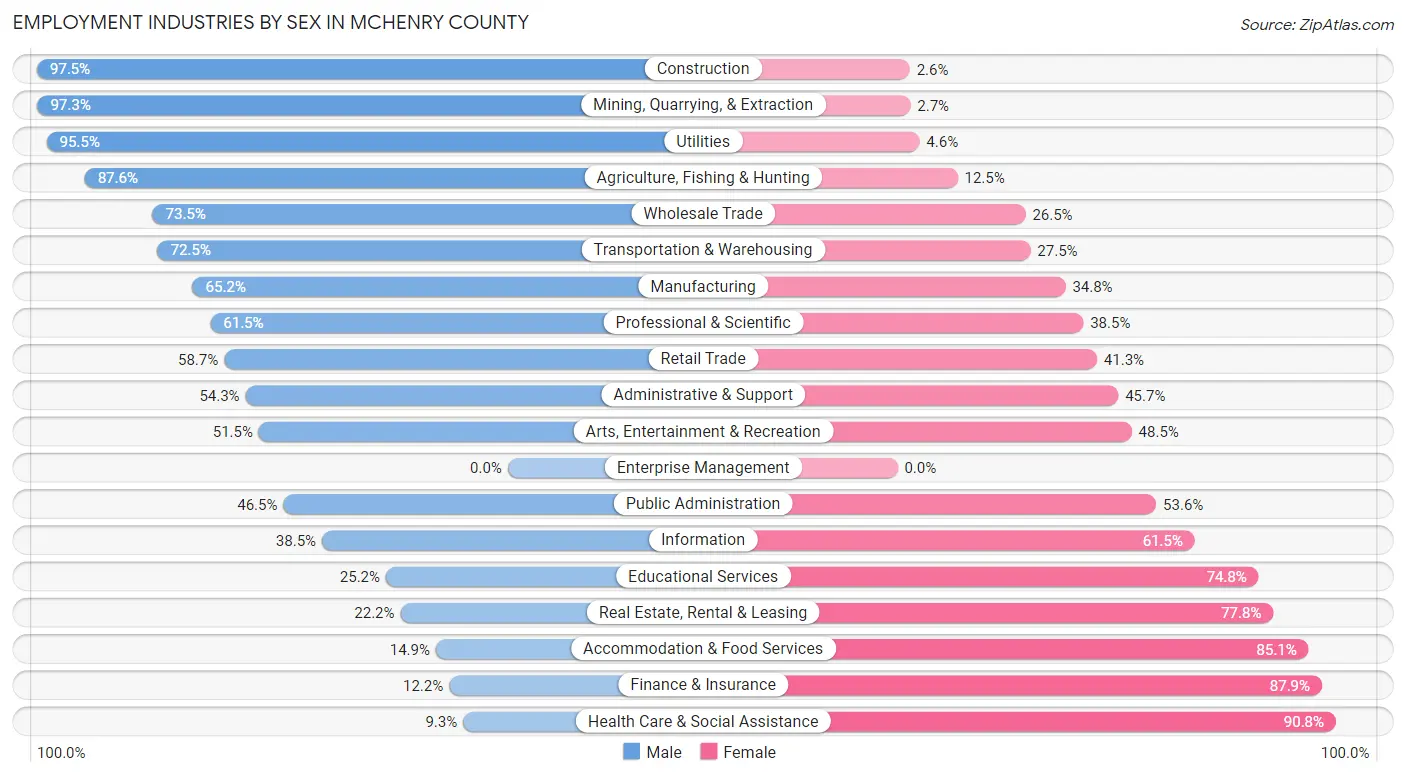
| Industry | Male | Female |
| Agriculture, Fishing & Hunting | 436 (87.5%) | 62 (12.4%) |
| Mining, Quarrying, & Extraction | 73 (97.3%) | 2 (2.7%) |
| Construction | 153 (97.5%) | 4 (2.5%) |
| Manufacturing | 60 (65.2%) | 32 (34.8%) |
| Wholesale Trade | 86 (73.5%) | 31 (26.5%) |
| Retail Trade | 118 (58.7%) | 83 (41.3%) |
| Transportation & Warehousing | 129 (72.5%) | 49 (27.5%) |
| Utilities | 42 (95.5%) | 2 (4.5%) |
| Information | 5 (38.5%) | 8 (61.5%) |
| Finance & Insurance | 13 (12.1%) | 94 (87.8%) |
| Real Estate, Rental & Leasing | 6 (22.2%) | 21 (77.8%) |
| Professional & Scientific | 40 (61.5%) | 25 (38.5%) |
| Enterprise Management | 0 (0.0%) | 0 (0.0%) |
| Administrative & Support | 38 (54.3%) | 32 (45.7%) |
| Educational Services | 55 (25.2%) | 163 (74.8%) |
| Health Care & Social Assistance | 26 (9.2%) | 255 (90.7%) |
| Arts, Entertainment & Recreation | 17 (51.5%) | 16 (48.5%) |
| Accommodation & Food Services | 14 (14.9%) | 80 (85.1%) |
| Public Administration | 72 (46.5%) | 83 (53.5%) |
| Total | 1,448 (57.1%) | 1,088 (42.9%) |
Education in McHenry County
School Enrollment in McHenry County
The most common levels of schooling among the 1,161 students in McHenry County are middle school (335 | 28.8%), elementary school (307 | 26.4%), and high school (275 | 23.7%).
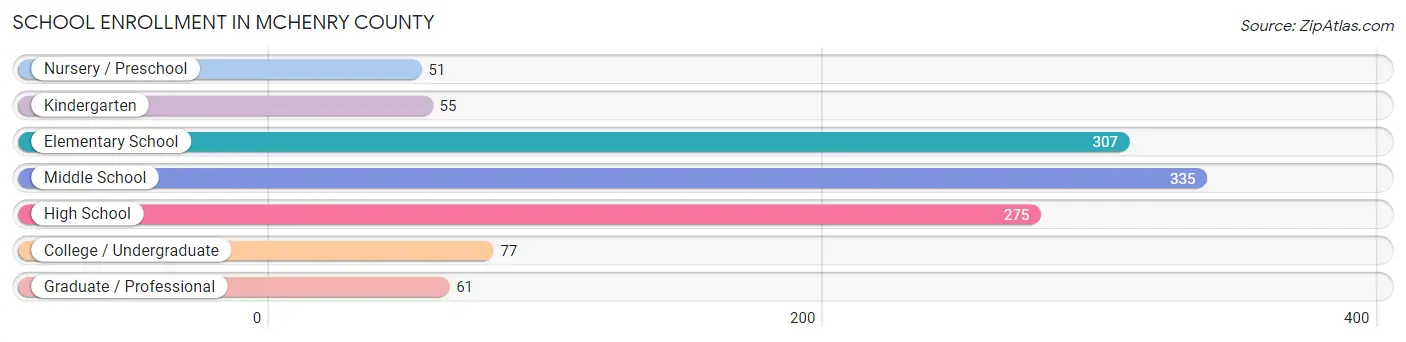
| School Level | # Students | % Students |
| Nursery / Preschool | 51 | 4.4% |
| Kindergarten | 55 | 4.7% |
| Elementary School | 307 | 26.4% |
| Middle School | 335 | 28.8% |
| High School | 275 | 23.7% |
| College / Undergraduate | 77 | 6.6% |
| Graduate / Professional | 61 | 5.2% |
| Total | 1,161 | 100.0% |
School Enrollment by Age by Funding Source in McHenry County
Out of a total of 1,161 students who are enrolled in schools in McHenry County, 78 (6.7%) attend a private institution, while the remaining 1,083 (93.3%) are enrolled in public schools. The age group of 3 to 4 year olds has the highest likelihood of being enrolled in private schools, with 6 (33.3% in the age bracket) enrolled. Conversely, the age group of 15 to 17 year olds has the lowest likelihood of being enrolled in a private school, with 206 (100.0% in the age bracket) attending a public institution.
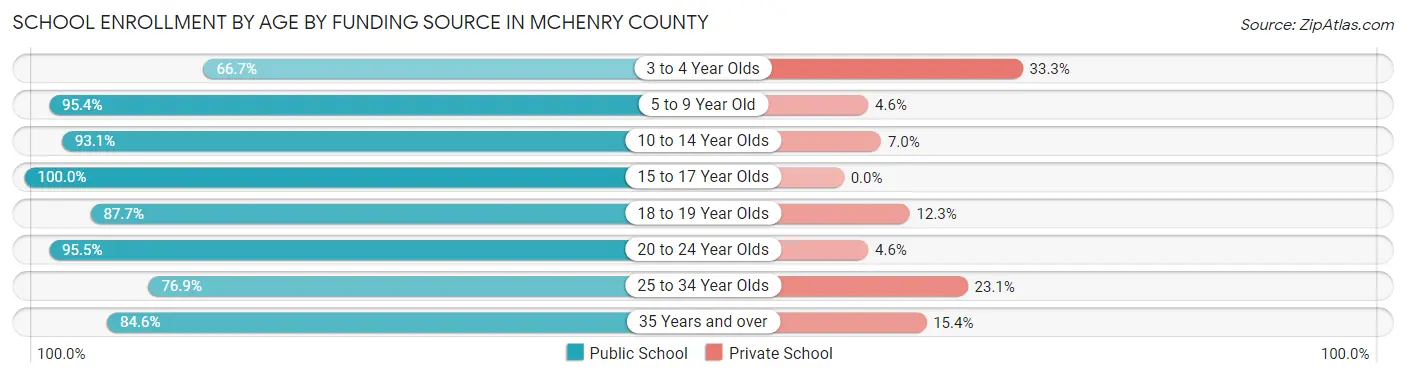
| Age Bracket | Public School | Private School |
| 3 to 4 Year Olds | 12 (66.7%) | 6 (33.3%) |
| 5 to 9 Year Old | 335 (95.4%) | 16 (4.6%) |
| 10 to 14 Year Olds | 375 (93.0%) | 28 (7.0%) |
| 15 to 17 Year Olds | 206 (100.0%) | 0 (0.0%) |
| 18 to 19 Year Olds | 50 (87.7%) | 7 (12.3%) |
| 20 to 24 Year Olds | 21 (95.5%) | 1 (4.5%) |
| 25 to 34 Year Olds | 40 (76.9%) | 12 (23.1%) |
| 35 Years and over | 44 (84.6%) | 8 (15.4%) |
| Total | 1,083 (93.3%) | 78 (6.7%) |
Educational Attainment by Field of Study in McHenry County
Education (208 | 26.5%), business (141 | 18.0%), science & technology (122 | 15.6%), bio, nature & agricultural (104 | 13.3%), and arts & humanities (92 | 11.7%) are the most common fields of study among 784 individuals in McHenry County who have obtained a bachelor's degree or higher.
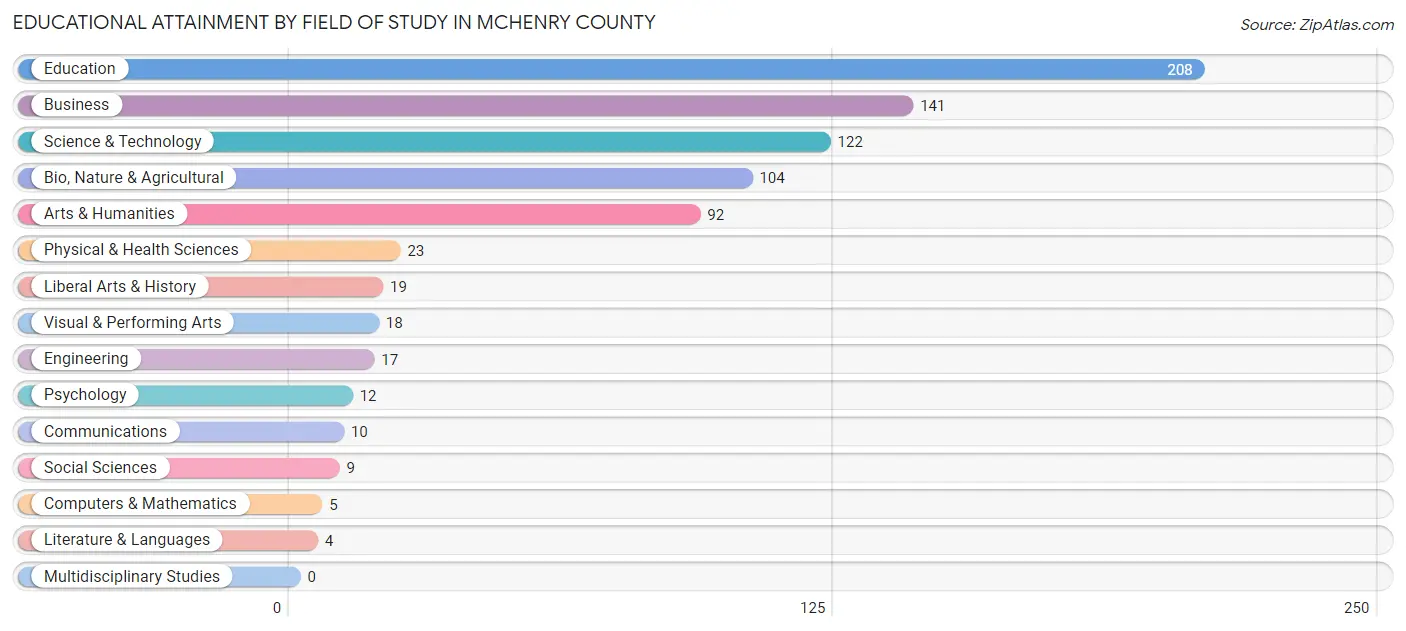
| Field of Study | # Graduates | % Graduates |
| Computers & Mathematics | 5 | 0.6% |
| Bio, Nature & Agricultural | 104 | 13.3% |
| Physical & Health Sciences | 23 | 2.9% |
| Psychology | 12 | 1.5% |
| Social Sciences | 9 | 1.1% |
| Engineering | 17 | 2.2% |
| Multidisciplinary Studies | 0 | 0.0% |
| Science & Technology | 122 | 15.6% |
| Business | 141 | 18.0% |
| Education | 208 | 26.5% |
| Literature & Languages | 4 | 0.5% |
| Liberal Arts & History | 19 | 2.4% |
| Visual & Performing Arts | 18 | 2.3% |
| Communications | 10 | 1.3% |
| Arts & Humanities | 92 | 11.7% |
| Total | 784 | 100.0% |
Transportation & Commute in McHenry County
Vehicle Availability by Sex in McHenry County
The most prevalent vehicle ownership categories in McHenry County are males with 2 vehicles (466, accounting for 32.4%) and females with 2 vehicles (379, making up 44.6%).
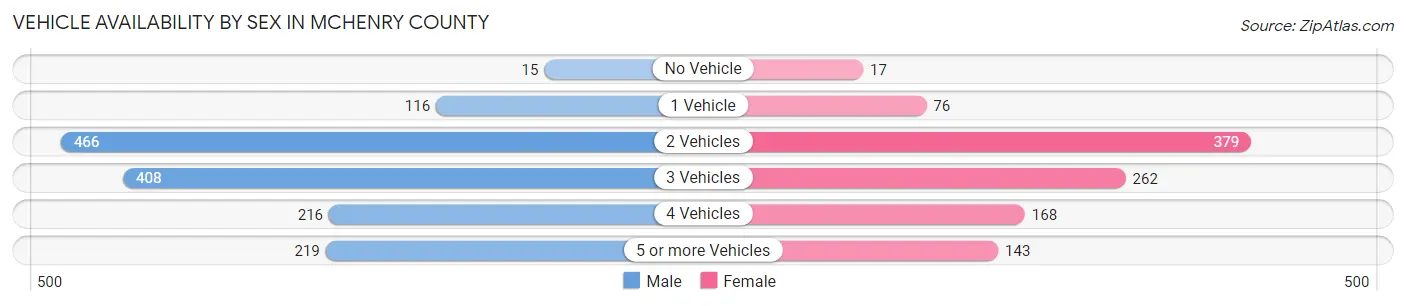
| Vehicles Available | Male | Female |
| No Vehicle | 15 (1.0%) | 17 (1.6%) |
| 1 Vehicle | 116 (8.1%) | 76 (7.3%) |
| 2 Vehicles | 466 (32.4%) | 379 (36.3%) |
| 3 Vehicles | 408 (28.3%) | 262 (25.1%) |
| 4 Vehicles | 216 (15.0%) | 168 (16.1%) |
| 5 or more Vehicles | 219 (15.2%) | 143 (13.7%) |
| Total | 1,440 (100.0%) | 1,045 (100.0%) |
Commute Time in McHenry County
The most frequently occuring commute durations in McHenry County are 30 to 34 minutes (478 commuters, 22.3%), less than 5 minutes (396 commuters, 18.5%), and 5 to 9 minutes (301 commuters, 14.0%).
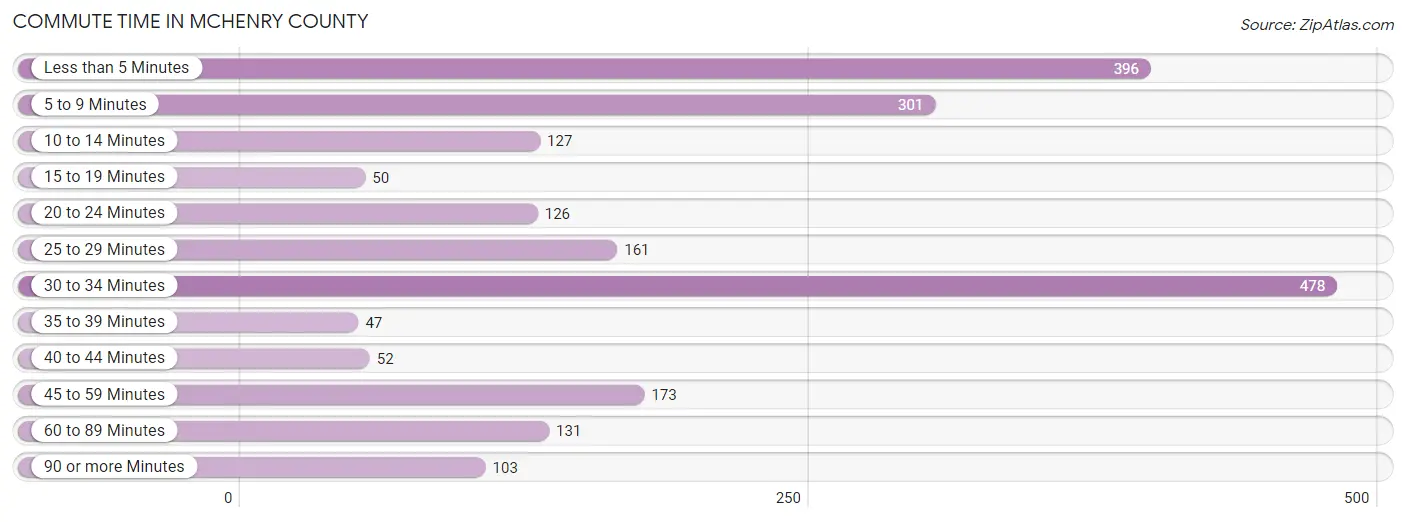
| Commute Time | # Commuters | % Commuters |
| Less than 5 Minutes | 396 | 18.5% |
| 5 to 9 Minutes | 301 | 14.0% |
| 10 to 14 Minutes | 127 | 5.9% |
| 15 to 19 Minutes | 50 | 2.3% |
| 20 to 24 Minutes | 126 | 5.9% |
| 25 to 29 Minutes | 161 | 7.5% |
| 30 to 34 Minutes | 478 | 22.3% |
| 35 to 39 Minutes | 47 | 2.2% |
| 40 to 44 Minutes | 52 | 2.4% |
| 45 to 59 Minutes | 173 | 8.1% |
| 60 to 89 Minutes | 131 | 6.1% |
| 90 or more Minutes | 103 | 4.8% |
Commute Time by Sex in McHenry County
The most common commute times in McHenry County are 30 to 34 minutes (217 commuters, 17.5%) for males and 30 to 34 minutes (261 commuters, 28.9%) for females.
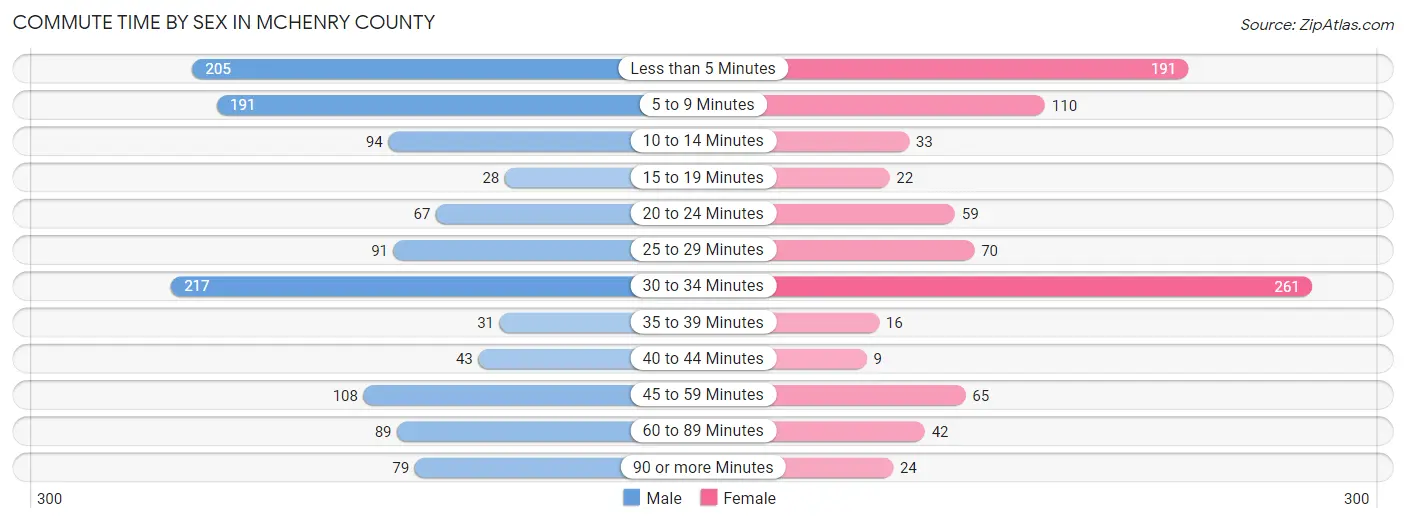
| Commute Time | Male | Female |
| Less than 5 Minutes | 205 (16.5%) | 191 (21.2%) |
| 5 to 9 Minutes | 191 (15.4%) | 110 (12.2%) |
| 10 to 14 Minutes | 94 (7.6%) | 33 (3.7%) |
| 15 to 19 Minutes | 28 (2.2%) | 22 (2.4%) |
| 20 to 24 Minutes | 67 (5.4%) | 59 (6.5%) |
| 25 to 29 Minutes | 91 (7.3%) | 70 (7.8%) |
| 30 to 34 Minutes | 217 (17.5%) | 261 (28.9%) |
| 35 to 39 Minutes | 31 (2.5%) | 16 (1.8%) |
| 40 to 44 Minutes | 43 (3.5%) | 9 (1.0%) |
| 45 to 59 Minutes | 108 (8.7%) | 65 (7.2%) |
| 60 to 89 Minutes | 89 (7.2%) | 42 (4.7%) |
| 90 or more Minutes | 79 (6.4%) | 24 (2.7%) |
Time of Departure to Work by Sex in McHenry County
The most frequent times of departure to work in McHenry County are 7:00 AM to 7:29 AM (204, 16.4%) for males and 7:30 AM to 7:59 AM (220, 24.4%) for females.
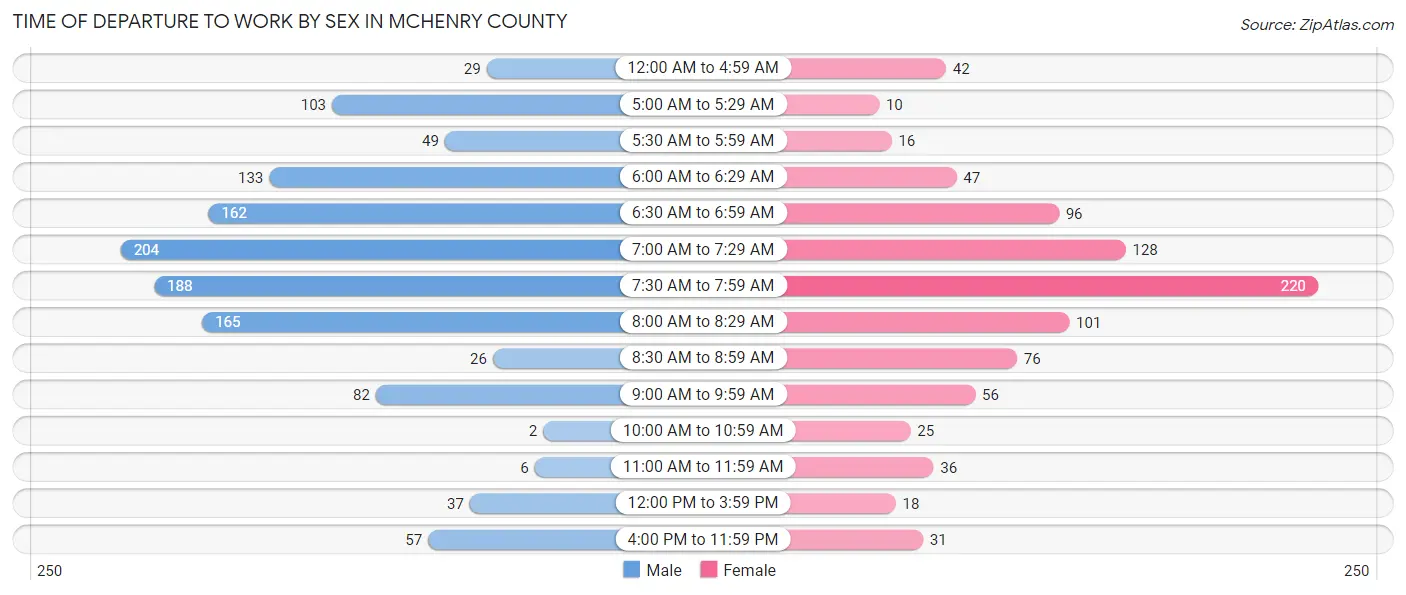
| Time of Departure | Male | Female |
| 12:00 AM to 4:59 AM | 29 (2.3%) | 42 (4.7%) |
| 5:00 AM to 5:29 AM | 103 (8.3%) | 10 (1.1%) |
| 5:30 AM to 5:59 AM | 49 (3.9%) | 16 (1.8%) |
| 6:00 AM to 6:29 AM | 133 (10.7%) | 47 (5.2%) |
| 6:30 AM to 6:59 AM | 162 (13.0%) | 96 (10.6%) |
| 7:00 AM to 7:29 AM | 204 (16.4%) | 128 (14.2%) |
| 7:30 AM to 7:59 AM | 188 (15.1%) | 220 (24.4%) |
| 8:00 AM to 8:29 AM | 165 (13.3%) | 101 (11.2%) |
| 8:30 AM to 8:59 AM | 26 (2.1%) | 76 (8.4%) |
| 9:00 AM to 9:59 AM | 82 (6.6%) | 56 (6.2%) |
| 10:00 AM to 10:59 AM | 2 (0.2%) | 25 (2.8%) |
| 11:00 AM to 11:59 AM | 6 (0.5%) | 36 (4.0%) |
| 12:00 PM to 3:59 PM | 37 (3.0%) | 18 (2.0%) |
| 4:00 PM to 11:59 PM | 57 (4.6%) | 31 (3.4%) |
| Total | 1,243 (100.0%) | 902 (100.0%) |
Housing Occupancy in McHenry County
Occupancy by Ownership in McHenry County
Of the total 2,312 dwellings in McHenry County, owner-occupied units account for 1,893 (81.9%), while renter-occupied units make up 419 (18.1%).
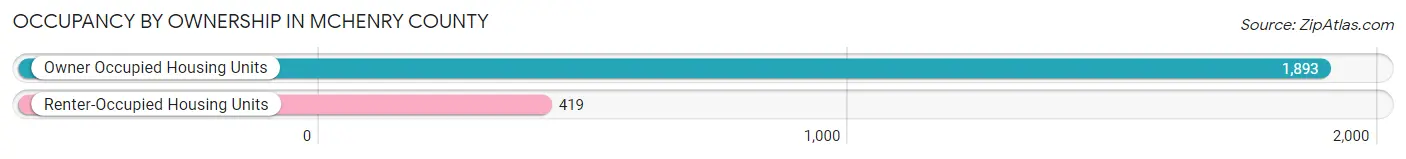
| Occupancy | # Housing Units | % Housing Units |
| Owner Occupied Housing Units | 1,893 | 81.9% |
| Renter-Occupied Housing Units | 419 | 18.1% |
| Total Occupied Housing Units | 2,312 | 100.0% |
Occupancy by Household Size in McHenry County
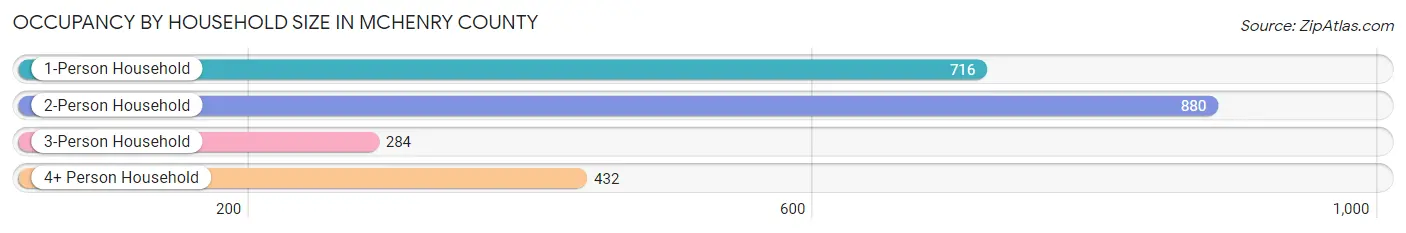
| Household Size | # Housing Units | % Housing Units |
| 1-Person Household | 716 | 31.0% |
| 2-Person Household | 880 | 38.1% |
| 3-Person Household | 284 | 12.3% |
| 4+ Person Household | 432 | 18.7% |
| Total Housing Units | 2,312 | 100.0% |
Occupancy by Ownership by Household Size in McHenry County
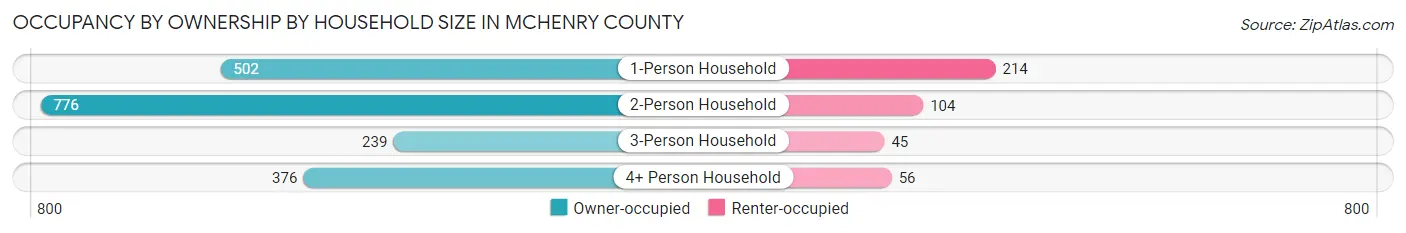
| Household Size | Owner-occupied | Renter-occupied |
| 1-Person Household | 502 (70.1%) | 214 (29.9%) |
| 2-Person Household | 776 (88.2%) | 104 (11.8%) |
| 3-Person Household | 239 (84.2%) | 45 (15.9%) |
| 4+ Person Household | 376 (87.0%) | 56 (13.0%) |
| Total Housing Units | 1,893 (81.9%) | 419 (18.1%) |
Occupancy by Educational Attainment in McHenry County
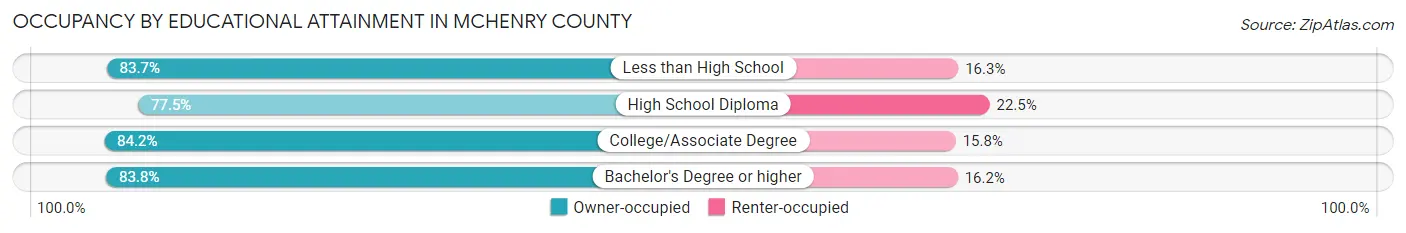
| Household Size | Owner-occupied | Renter-occupied |
| Less than High School | 211 (83.7%) | 41 (16.3%) |
| High School Diploma | 593 (77.5%) | 172 (22.5%) |
| College/Associate Degree | 705 (84.2%) | 132 (15.8%) |
| Bachelor's Degree or higher | 384 (83.8%) | 74 (16.2%) |
Occupancy by Age of Householder in McHenry County
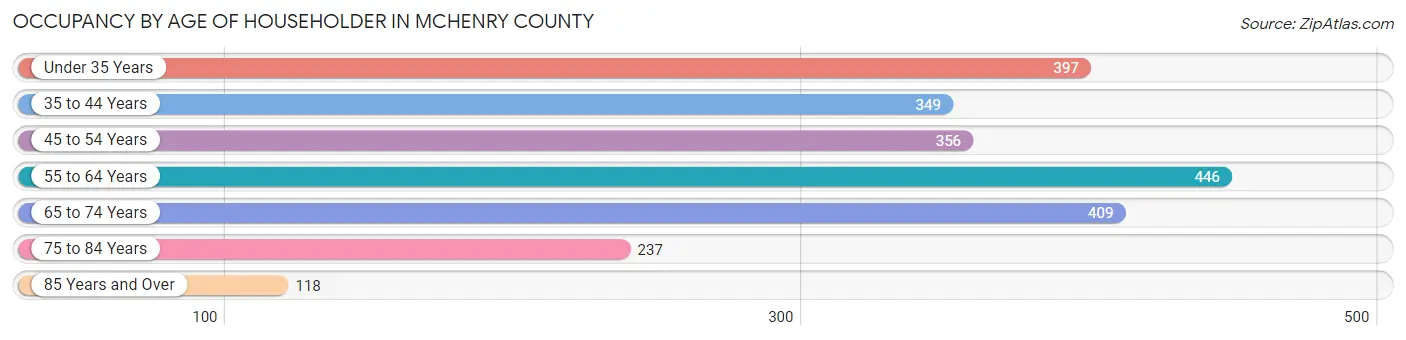
| Age Bracket | # Households | % Households |
| Under 35 Years | 397 | 17.2% |
| 35 to 44 Years | 349 | 15.1% |
| 45 to 54 Years | 356 | 15.4% |
| 55 to 64 Years | 446 | 19.3% |
| 65 to 74 Years | 409 | 17.7% |
| 75 to 84 Years | 237 | 10.2% |
| 85 Years and Over | 118 | 5.1% |
| Total | 2,312 | 100.0% |
Housing Finances in McHenry County
Median Income by Occupancy in McHenry County
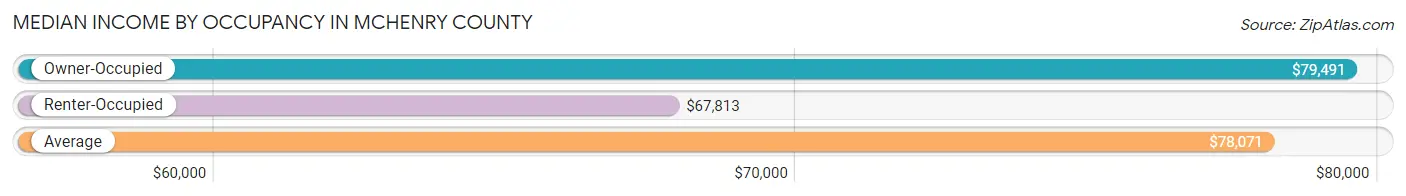
| Occupancy Type | # Households | Median Income |
| Owner-Occupied | 1,893 (81.9%) | $79,491 |
| Renter-Occupied | 419 (18.1%) | $67,813 |
| Average | 2,312 (100.0%) | $78,071 |
Occupancy by Householder Income Bracket in McHenry County
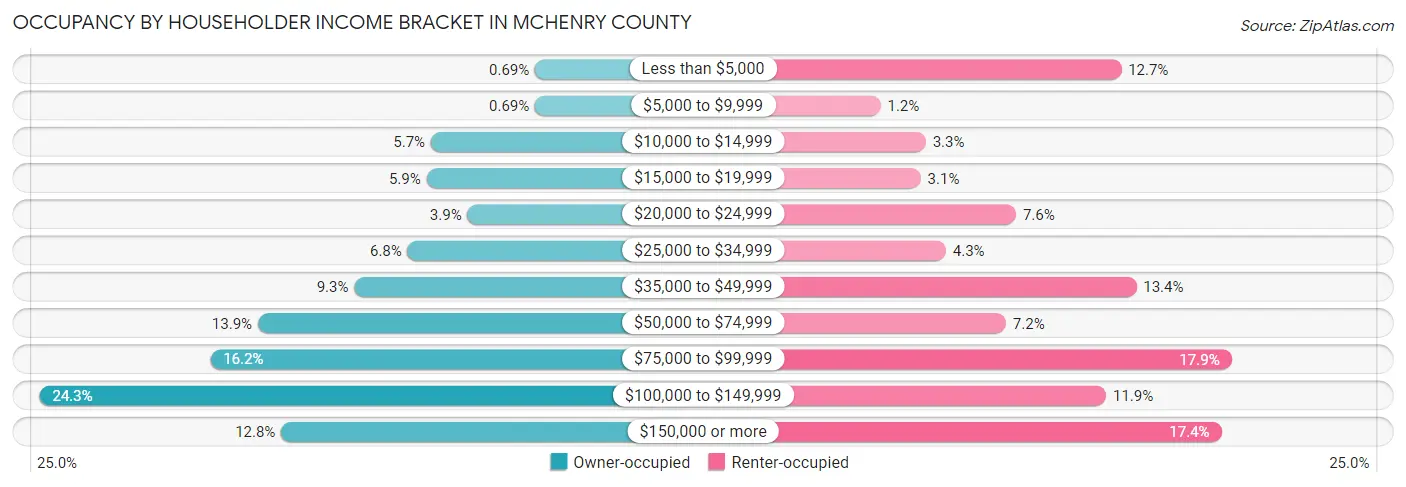
| Income Bracket | Owner-occupied | Renter-occupied |
| Less than $5,000 | 13 (0.7%) | 53 (12.7%) |
| $5,000 to $9,999 | 13 (0.7%) | 5 (1.2%) |
| $10,000 to $14,999 | 107 (5.7%) | 14 (3.3%) |
| $15,000 to $19,999 | 111 (5.9%) | 13 (3.1%) |
| $20,000 to $24,999 | 74 (3.9%) | 32 (7.6%) |
| $25,000 to $34,999 | 128 (6.8%) | 18 (4.3%) |
| $35,000 to $49,999 | 176 (9.3%) | 56 (13.4%) |
| $50,000 to $74,999 | 263 (13.9%) | 30 (7.2%) |
| $75,000 to $99,999 | 306 (16.2%) | 75 (17.9%) |
| $100,000 to $149,999 | 460 (24.3%) | 50 (11.9%) |
| $150,000 or more | 242 (12.8%) | 73 (17.4%) |
| Total | 1,893 (100.0%) | 419 (100.0%) |
Monthly Housing Cost Tiers in McHenry County
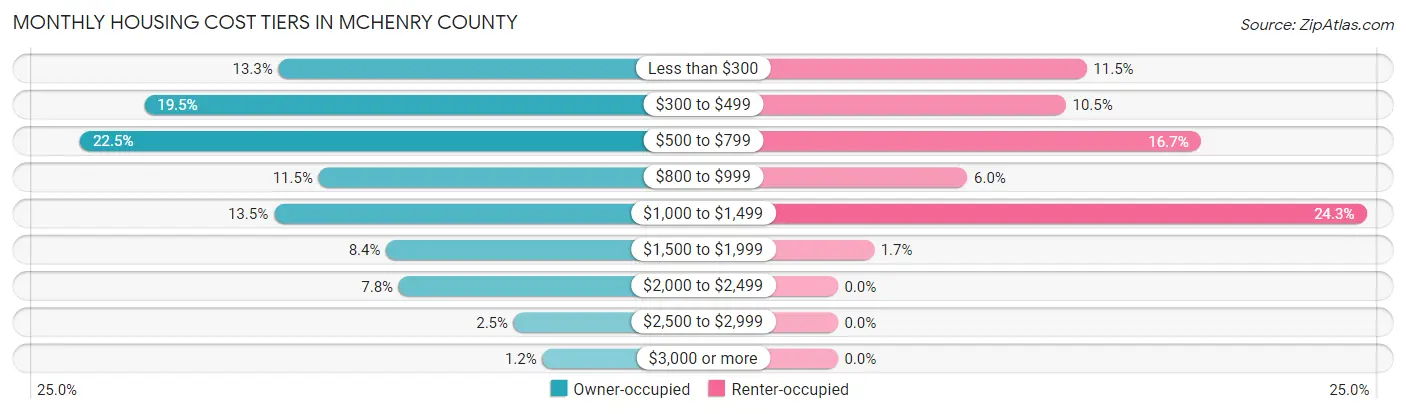
| Monthly Cost | Owner-occupied | Renter-occupied |
| Less than $300 | 252 (13.3%) | 48 (11.5%) |
| $300 to $499 | 369 (19.5%) | 44 (10.5%) |
| $500 to $799 | 425 (22.5%) | 70 (16.7%) |
| $800 to $999 | 217 (11.5%) | 25 (6.0%) |
| $1,000 to $1,499 | 256 (13.5%) | 102 (24.3%) |
| $1,500 to $1,999 | 158 (8.4%) | 7 (1.7%) |
| $2,000 to $2,499 | 147 (7.8%) | 0 (0.0%) |
| $2,500 to $2,999 | 47 (2.5%) | 0 (0.0%) |
| $3,000 or more | 22 (1.2%) | 0 (0.0%) |
| Total | 1,893 (100.0%) | 419 (100.0%) |
Physical Housing Characteristics in McHenry County
Housing Structures in McHenry County
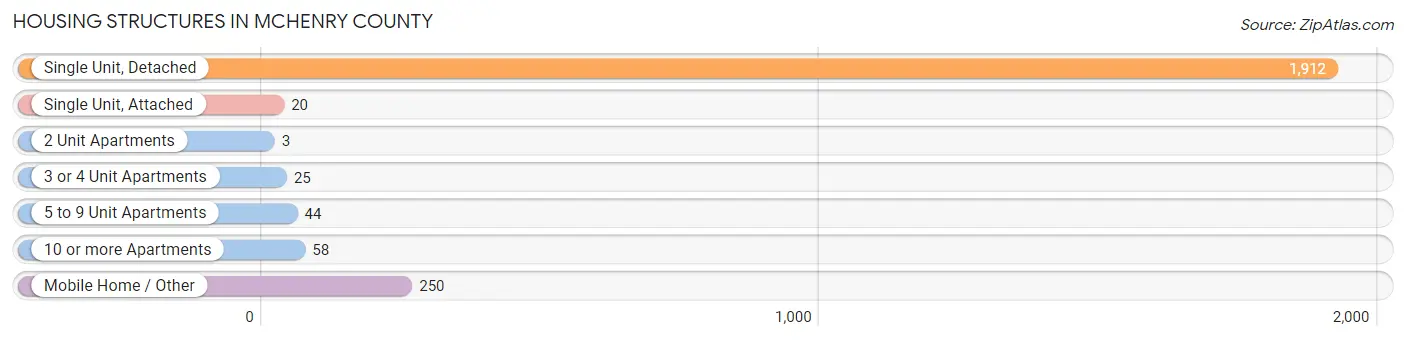
| Structure Type | # Housing Units | % Housing Units |
| Single Unit, Detached | 1,912 | 82.7% |
| Single Unit, Attached | 20 | 0.9% |
| 2 Unit Apartments | 3 | 0.1% |
| 3 or 4 Unit Apartments | 25 | 1.1% |
| 5 to 9 Unit Apartments | 44 | 1.9% |
| 10 or more Apartments | 58 | 2.5% |
| Mobile Home / Other | 250 | 10.8% |
| Total | 2,312 | 100.0% |
Housing Structures by Occupancy in McHenry County
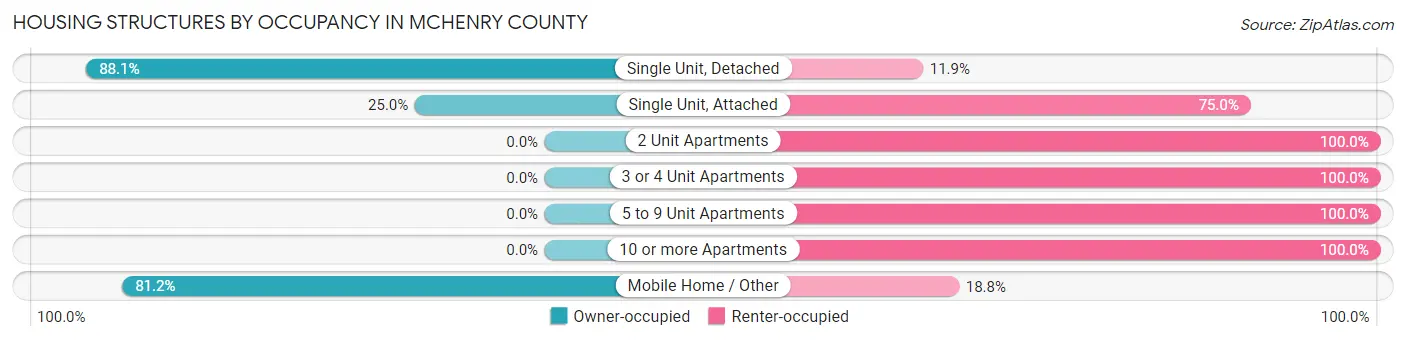
| Structure Type | Owner-occupied | Renter-occupied |
| Single Unit, Detached | 1,685 (88.1%) | 227 (11.9%) |
| Single Unit, Attached | 5 (25.0%) | 15 (75.0%) |
| 2 Unit Apartments | 0 (0.0%) | 3 (100.0%) |
| 3 or 4 Unit Apartments | 0 (0.0%) | 25 (100.0%) |
| 5 to 9 Unit Apartments | 0 (0.0%) | 44 (100.0%) |
| 10 or more Apartments | 0 (0.0%) | 58 (100.0%) |
| Mobile Home / Other | 203 (81.2%) | 47 (18.8%) |
| Total | 1,893 (81.9%) | 419 (18.1%) |
Housing Structures by Number of Rooms in McHenry County
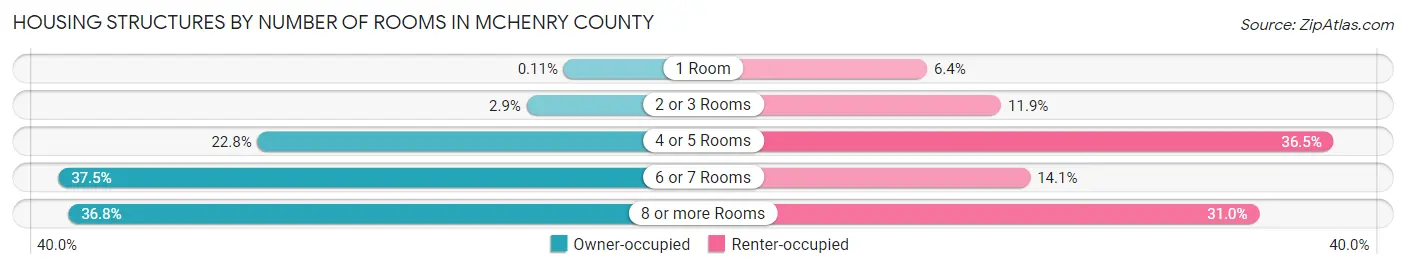
| Number of Rooms | Owner-occupied | Renter-occupied |
| 1 Room | 2 (0.1%) | 27 (6.4%) |
| 2 or 3 Rooms | 54 (2.9%) | 50 (11.9%) |
| 4 or 5 Rooms | 431 (22.8%) | 153 (36.5%) |
| 6 or 7 Rooms | 710 (37.5%) | 59 (14.1%) |
| 8 or more Rooms | 696 (36.8%) | 130 (31.0%) |
| Total | 1,893 (100.0%) | 419 (100.0%) |
Housing Structure by Heating Type in McHenry County
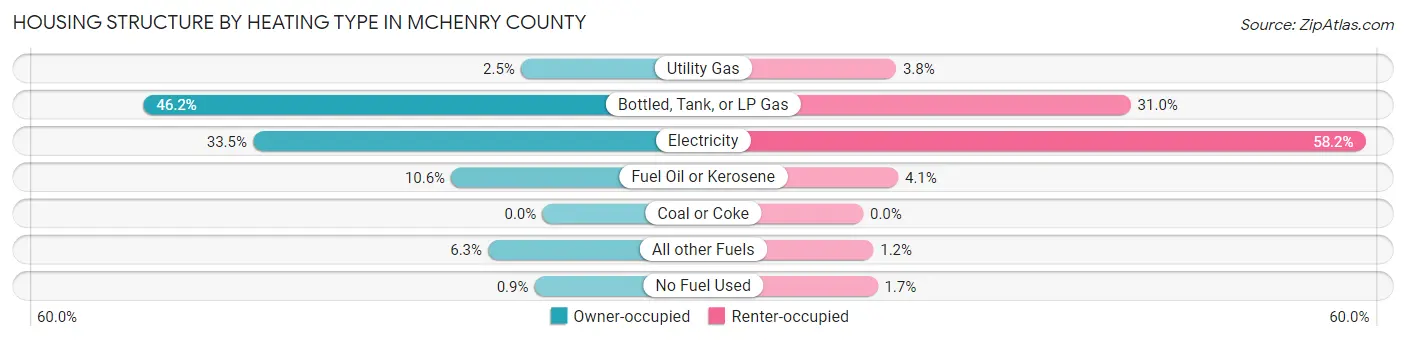
| Heating Type | Owner-occupied | Renter-occupied |
| Utility Gas | 47 (2.5%) | 16 (3.8%) |
| Bottled, Tank, or LP Gas | 875 (46.2%) | 130 (31.0%) |
| Electricity | 635 (33.5%) | 244 (58.2%) |
| Fuel Oil or Kerosene | 200 (10.6%) | 17 (4.1%) |
| Coal or Coke | 0 (0.0%) | 0 (0.0%) |
| All other Fuels | 119 (6.3%) | 5 (1.2%) |
| No Fuel Used | 17 (0.9%) | 7 (1.7%) |
| Total | 1,893 (100.0%) | 419 (100.0%) |
Household Vehicle Usage in McHenry County
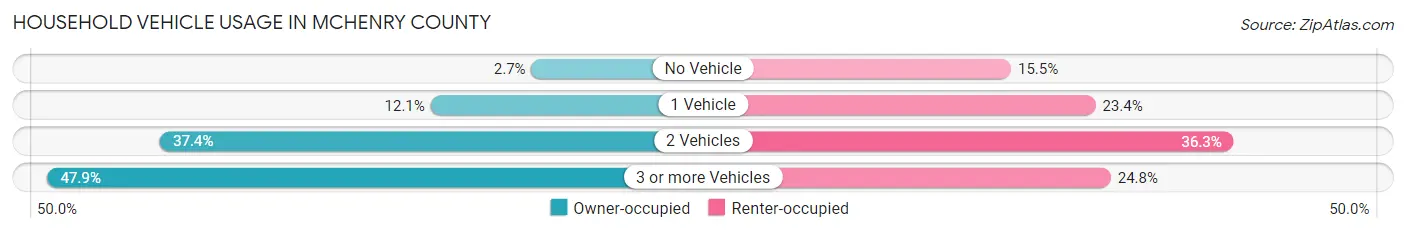
| Vehicles per Household | Owner-occupied | Renter-occupied |
| No Vehicle | 51 (2.7%) | 65 (15.5%) |
| 1 Vehicle | 229 (12.1%) | 98 (23.4%) |
| 2 Vehicles | 707 (37.3%) | 152 (36.3%) |
| 3 or more Vehicles | 906 (47.9%) | 104 (24.8%) |
| Total | 1,893 (100.0%) | 419 (100.0%) |
Real Estate & Mortgages in McHenry County
Real Estate and Mortgage Overview in McHenry County
| Characteristic | Without Mortgage | With Mortgage |
| Housing Units | 1,128 | 765 |
| Median Property Value | $109,200 | $182,800 |
| Median Household Income | $63,750 | $130 |
| Monthly Housing Costs | $477 | $22 |
| Real Estate Taxes | $784 | $29 |
Property Value by Mortgage Status in McHenry County
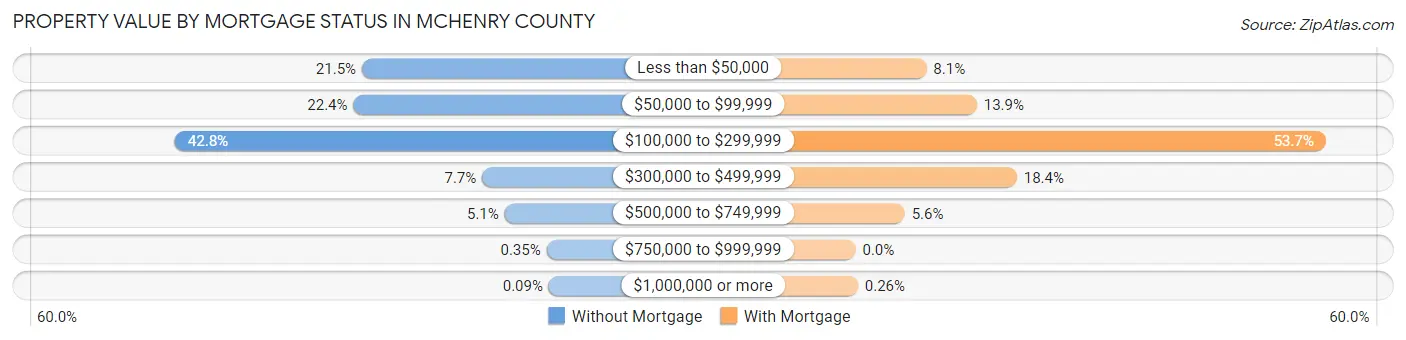
| Property Value | Without Mortgage | With Mortgage |
| Less than $50,000 | 242 (21.4%) | 62 (8.1%) |
| $50,000 to $99,999 | 253 (22.4%) | 106 (13.9%) |
| $100,000 to $299,999 | 483 (42.8%) | 411 (53.7%) |
| $300,000 to $499,999 | 87 (7.7%) | 141 (18.4%) |
| $500,000 to $749,999 | 58 (5.1%) | 43 (5.6%) |
| $750,000 to $999,999 | 4 (0.4%) | 0 (0.0%) |
| $1,000,000 or more | 1 (0.1%) | 2 (0.3%) |
| Total | 1,128 (100.0%) | 765 (100.0%) |
Household Income by Mortgage Status in McHenry County
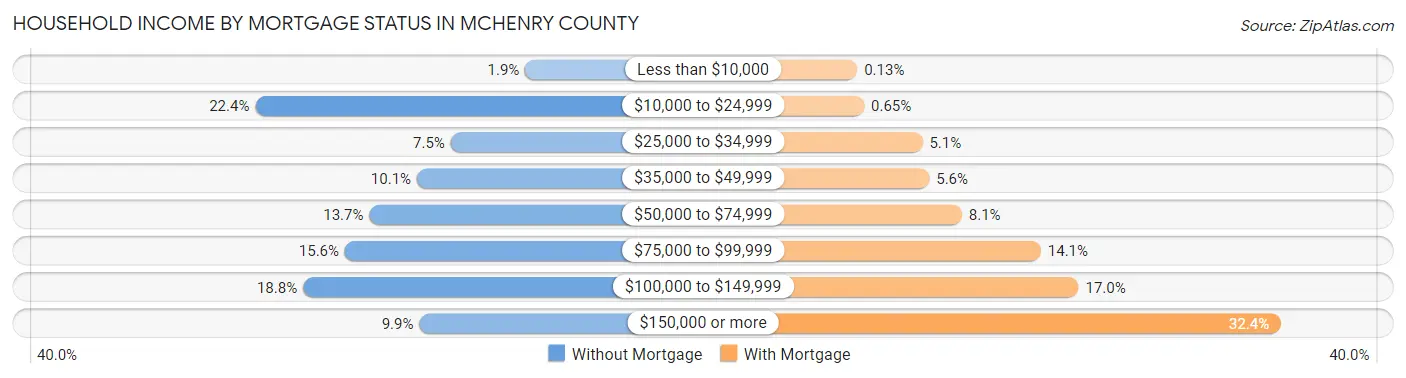
| Household Income | Without Mortgage | With Mortgage |
| Less than $10,000 | 21 (1.9%) | 1 (0.1%) |
| $10,000 to $24,999 | 253 (22.4%) | 5 (0.6%) |
| $25,000 to $34,999 | 85 (7.5%) | 39 (5.1%) |
| $35,000 to $49,999 | 114 (10.1%) | 43 (5.6%) |
| $50,000 to $74,999 | 155 (13.7%) | 62 (8.1%) |
| $75,000 to $99,999 | 176 (15.6%) | 108 (14.1%) |
| $100,000 to $149,999 | 212 (18.8%) | 130 (17.0%) |
| $150,000 or more | 112 (9.9%) | 248 (32.4%) |
| Total | 1,128 (100.0%) | 765 (100.0%) |
Property Value to Household Income Ratio in McHenry County
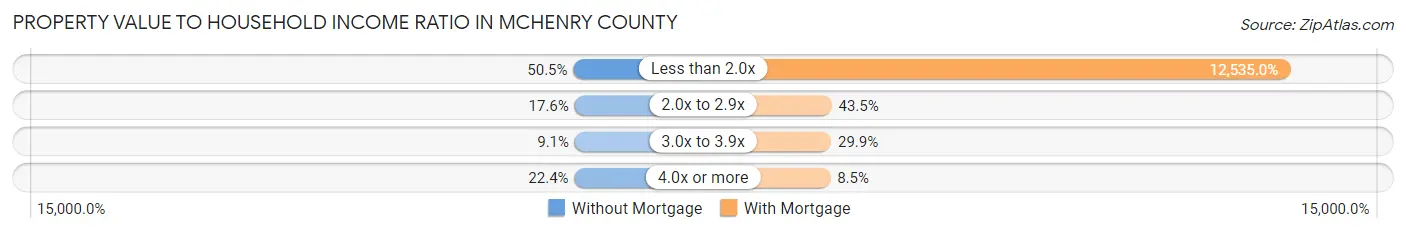
| Value-to-Income Ratio | Without Mortgage | With Mortgage |
| Less than 2.0x | 570 (50.5%) | 95,893 (12,535.0%) |
| 2.0x to 2.9x | 199 (17.6%) | 333 (43.5%) |
| 3.0x to 3.9x | 103 (9.1%) | 229 (29.9%) |
| 4.0x or more | 253 (22.4%) | 65 (8.5%) |
| Total | 1,128 (100.0%) | 765 (100.0%) |
Real Estate Taxes by Mortgage Status in McHenry County
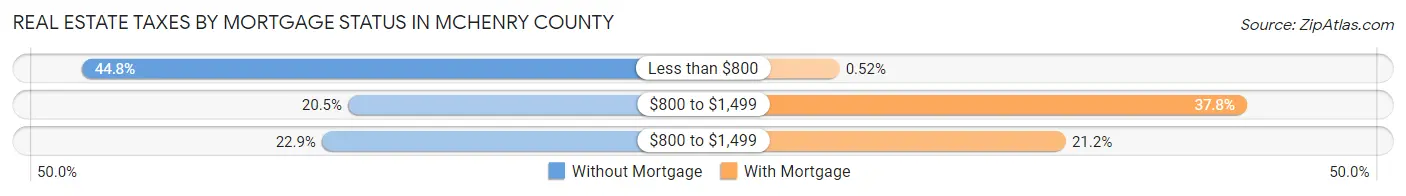
| Property Taxes | Without Mortgage | With Mortgage |
| Less than $800 | 505 (44.8%) | 4 (0.5%) |
| $800 to $1,499 | 231 (20.5%) | 289 (37.8%) |
| $800 to $1,499 | 258 (22.9%) | 162 (21.2%) |
| Total | 1,128 (100.0%) | 765 (100.0%) |
Health & Disability in McHenry County
Health Insurance Coverage by Age in McHenry County
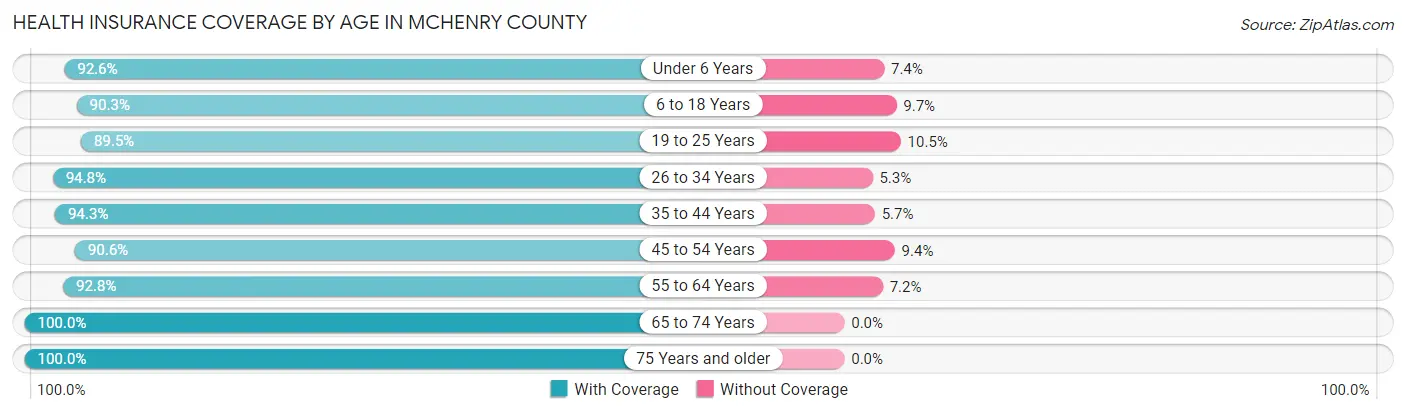
| Age Bracket | With Coverage | Without Coverage |
| Under 6 Years | 350 (92.6%) | 28 (7.4%) |
| 6 to 18 Years | 856 (90.3%) | 92 (9.7%) |
| 19 to 25 Years | 230 (89.5%) | 27 (10.5%) |
| 26 to 34 Years | 487 (94.8%) | 27 (5.2%) |
| 35 to 44 Years | 616 (94.3%) | 37 (5.7%) |
| 45 to 54 Years | 550 (90.6%) | 57 (9.4%) |
| 55 to 64 Years | 738 (92.8%) | 57 (7.2%) |
| 65 to 74 Years | 625 (100.0%) | 0 (0.0%) |
| 75 Years and older | 476 (100.0%) | 0 (0.0%) |
| Total | 4,928 (93.8%) | 325 (6.2%) |
Health Insurance Coverage by Citizenship Status in McHenry County

| Citizenship Status | With Coverage | Without Coverage |
| Native Born | 350 (92.6%) | 28 (7.4%) |
| Foreign Born, Citizen | 856 (90.3%) | 92 (9.7%) |
| Foreign Born, not a Citizen | 230 (89.5%) | 27 (10.5%) |
Health Insurance Coverage by Household Income in McHenry County
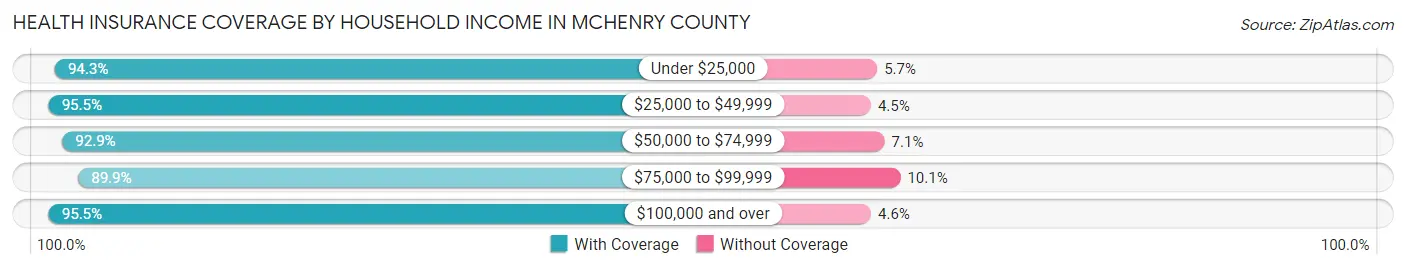
| Household Income | With Coverage | Without Coverage |
| Under $25,000 | 596 (94.3%) | 36 (5.7%) |
| $25,000 to $49,999 | 674 (95.5%) | 32 (4.5%) |
| $50,000 to $74,999 | 668 (92.9%) | 51 (7.1%) |
| $75,000 to $99,999 | 966 (89.9%) | 108 (10.1%) |
| $100,000 and over | 2,016 (95.5%) | 96 (4.5%) |
Public vs Private Health Insurance Coverage by Age in McHenry County
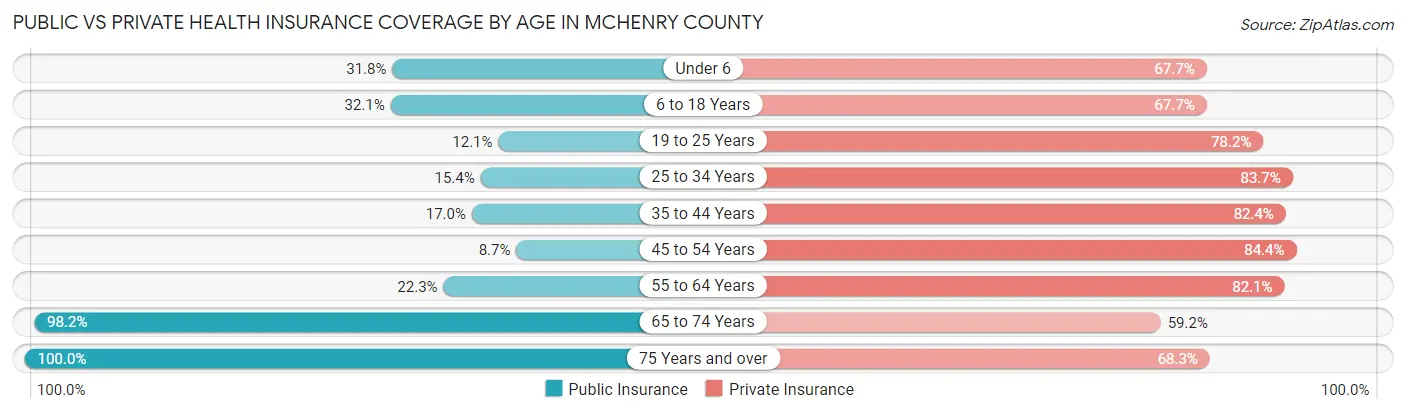
| Age Bracket | Public Insurance | Private Insurance |
| Under 6 | 120 (31.8%) | 256 (67.7%) |
| 6 to 18 Years | 304 (32.1%) | 642 (67.7%) |
| 19 to 25 Years | 31 (12.1%) | 201 (78.2%) |
| 25 to 34 Years | 79 (15.4%) | 430 (83.7%) |
| 35 to 44 Years | 111 (17.0%) | 538 (82.4%) |
| 45 to 54 Years | 53 (8.7%) | 512 (84.4%) |
| 55 to 64 Years | 177 (22.3%) | 653 (82.1%) |
| 65 to 74 Years | 614 (98.2%) | 370 (59.2%) |
| 75 Years and over | 476 (100.0%) | 325 (68.3%) |
| Total | 1,965 (37.4%) | 3,927 (74.8%) |
Disability Status by Sex by Age in McHenry County
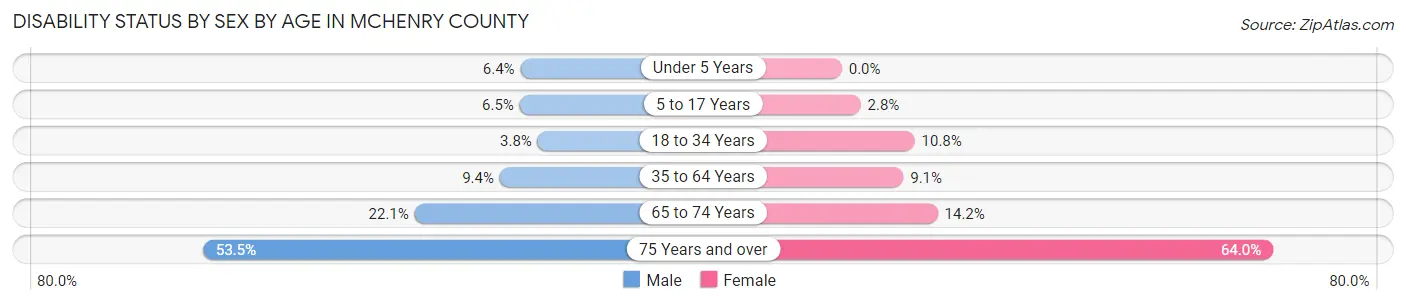
| Age Bracket | Male | Female |
| Under 5 Years | 10 (6.4%) | 0 (0.0%) |
| 5 to 17 Years | 31 (6.5%) | 14 (2.8%) |
| 18 to 34 Years | 16 (3.8%) | 44 (10.8%) |
| 35 to 64 Years | 103 (9.4%) | 88 (9.1%) |
| 65 to 74 Years | 76 (22.1%) | 40 (14.2%) |
| 75 Years and over | 106 (53.5%) | 178 (64.0%) |
Disability Class by Sex by Age in McHenry County
Disability Class: Hearing Difficulty
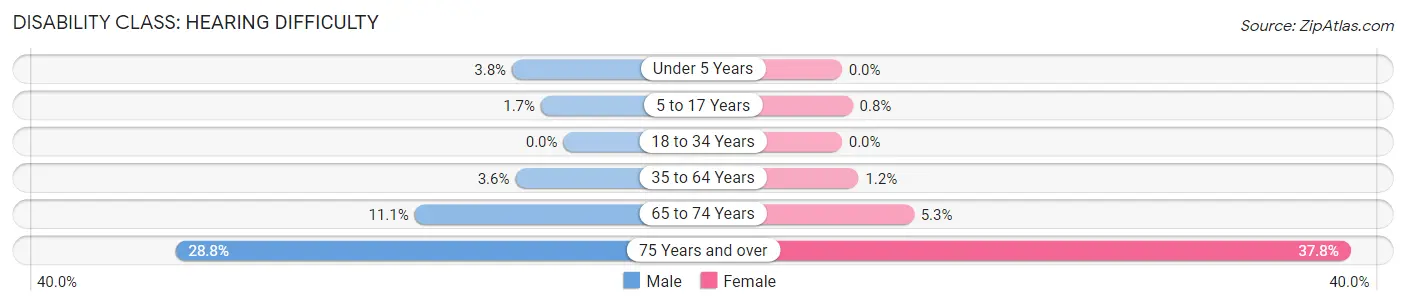
| Age Bracket | Male | Female |
| Under 5 Years | 6 (3.8%) | 0 (0.0%) |
| 5 to 17 Years | 8 (1.7%) | 4 (0.8%) |
| 18 to 34 Years | 0 (0.0%) | 0 (0.0%) |
| 35 to 64 Years | 39 (3.6%) | 12 (1.2%) |
| 65 to 74 Years | 38 (11.1%) | 15 (5.3%) |
| 75 Years and over | 57 (28.8%) | 105 (37.8%) |
Disability Class: Vision Difficulty
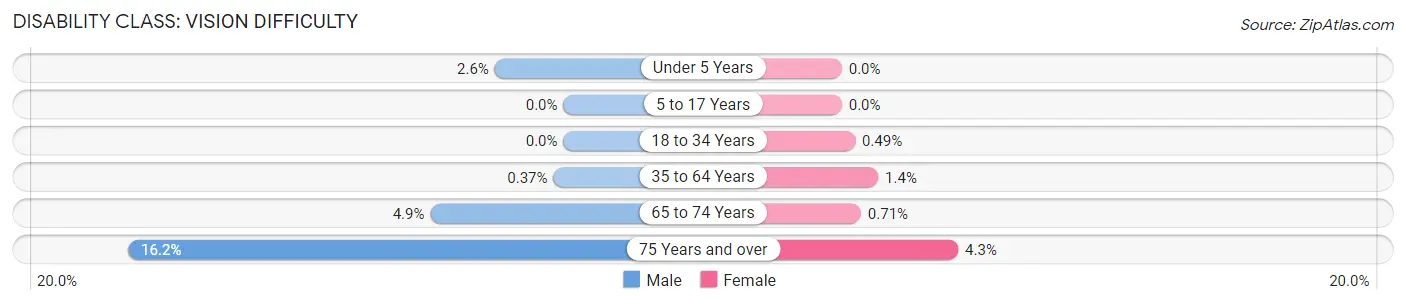
| Age Bracket | Male | Female |
| Under 5 Years | 4 (2.5%) | 0 (0.0%) |
| 5 to 17 Years | 0 (0.0%) | 0 (0.0%) |
| 18 to 34 Years | 0 (0.0%) | 2 (0.5%) |
| 35 to 64 Years | 4 (0.4%) | 13 (1.3%) |
| 65 to 74 Years | 17 (4.9%) | 2 (0.7%) |
| 75 Years and over | 32 (16.2%) | 12 (4.3%) |
Disability Class: Cognitive Difficulty
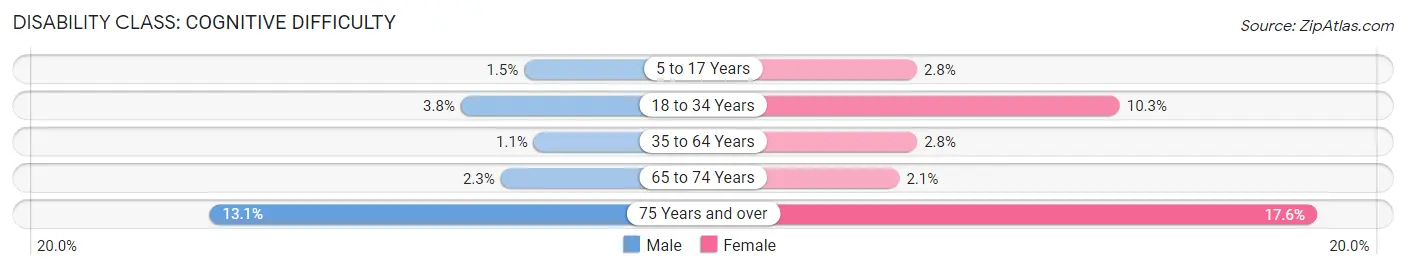
| Age Bracket | Male | Female |
| 5 to 17 Years | 7 (1.5%) | 14 (2.8%) |
| 18 to 34 Years | 16 (3.8%) | 42 (10.3%) |
| 35 to 64 Years | 12 (1.1%) | 27 (2.8%) |
| 65 to 74 Years | 8 (2.3%) | 6 (2.1%) |
| 75 Years and over | 26 (13.1%) | 49 (17.6%) |
Disability Class: Ambulatory Difficulty
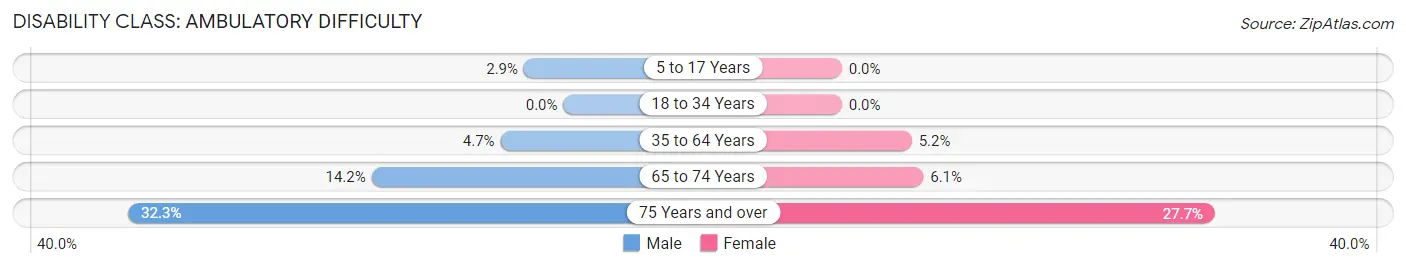
| Age Bracket | Male | Female |
| 5 to 17 Years | 14 (2.9%) | 0 (0.0%) |
| 18 to 34 Years | 0 (0.0%) | 0 (0.0%) |
| 35 to 64 Years | 51 (4.7%) | 50 (5.2%) |
| 65 to 74 Years | 49 (14.2%) | 17 (6.0%) |
| 75 Years and over | 64 (32.3%) | 77 (27.7%) |
Disability Class: Self-Care Difficulty
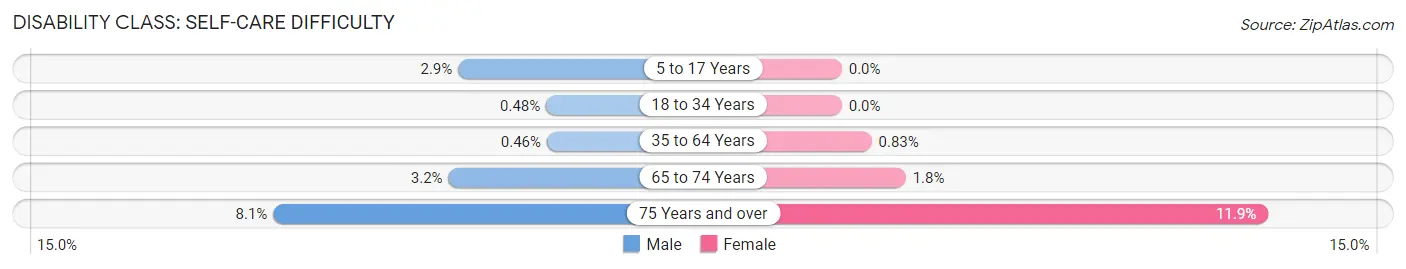
| Age Bracket | Male | Female |
| 5 to 17 Years | 14 (2.9%) | 0 (0.0%) |
| 18 to 34 Years | 2 (0.5%) | 0 (0.0%) |
| 35 to 64 Years | 5 (0.5%) | 8 (0.8%) |
| 65 to 74 Years | 11 (3.2%) | 5 (1.8%) |
| 75 Years and over | 16 (8.1%) | 33 (11.9%) |
Technology Access in McHenry County
Computing Device Access in McHenry County
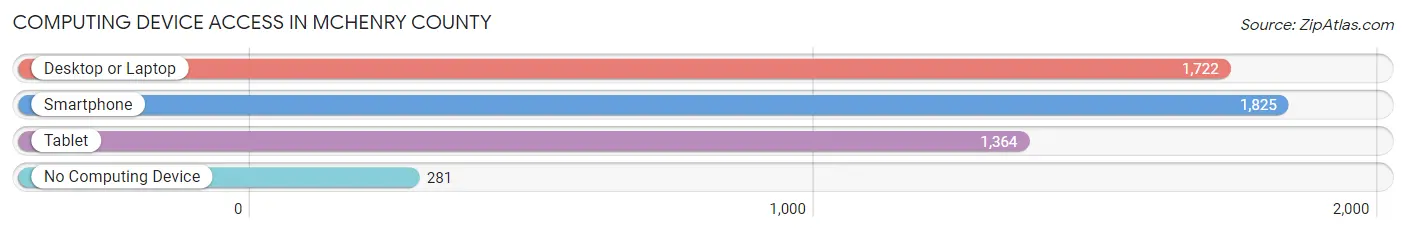
| Device Type | # Households | % Households |
| Desktop or Laptop | 1,722 | 74.5% |
| Smartphone | 1,825 | 78.9% |
| Tablet | 1,364 | 59.0% |
| No Computing Device | 281 | 12.1% |
| Total | 2,312 | 100.0% |
Internet Access in McHenry County
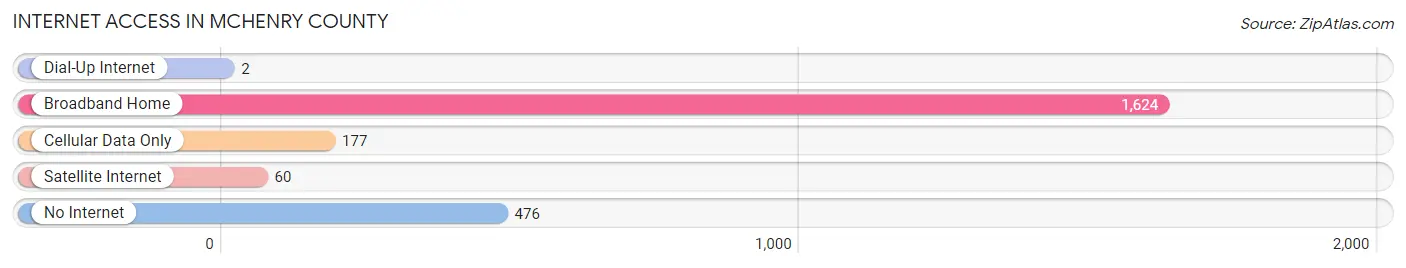
| Internet Type | # Households | % Households |
| Dial-Up Internet | 2 | 0.1% |
| Broadband Home | 1,624 | 70.2% |
| Cellular Data Only | 177 | 7.7% |
| Satellite Internet | 60 | 2.6% |
| No Internet | 476 | 20.6% |
| Total | 2,312 | 100.0% |
McHenry County Summary
McHenry County is located in the north-central region of North Dakota, and is the sixth largest county in the state. It is bordered by Ward County to the north, Mountrail County to the east, Burke County to the south, and Williams County to the west. The county seat is Towner, and the largest city is Velva.
History
McHenry County was established in 1873, and was named after James McHenry, a signer of the United States Constitution. The county was originally part of the Dakota Territory, and was later included in the state of North Dakota when it was admitted to the Union in 1889.
The first settlers in the area were mostly of German and Norwegian descent, and they established small farms and ranches. The county was largely agricultural, and the main crops were wheat, oats, barley, and flax. The county also had a thriving dairy industry, and the first creamery was established in Velva in 1891.
Geography
McHenry County covers an area of 1,845 square miles, and is located in the north-central region of North Dakota. The county is mostly flat, with rolling hills in the east and south. The Souris River runs through the county, and there are several small lakes and ponds scattered throughout the area. The county is mostly covered in grasslands, with some areas of forest.
The county has a humid continental climate, with cold winters and hot summers. The average annual temperature is 45°F, and the average annual precipitation is 17 inches.
Economy
McHenry County’s economy is largely based on agriculture. The main crops are wheat, oats, barley, and flax, and the county also has a thriving dairy industry. Other industries in the county include manufacturing, retail, and tourism.
The county is home to several large employers, including the Velva Creamery, the Towner County Grain Elevator, and the McHenry County Hospital. The county also has a number of small businesses, including restaurants, shops, and service providers.
Demographics
As of the 2010 census, McHenry County had a population of 6,845. The population is mostly white (96.2%), with small percentages of Native American (1.2%), African American (0.5%), and Asian (0.3%) residents. The median household income is $45,813, and the median age is 44.
The county is served by the McHenry County School District, which includes four elementary schools, one middle school, and one high school. The county also has several private schools, including the Velva Christian Academy and the Towner Lutheran School.
Common Questions
What is the Total Population of McHenry County?
Total Population of McHenry County is 5,326.
What is the Total Male Population of McHenry County?
Total Male Population of McHenry County is 2,736.
What is the Total Female Population of McHenry County?
Total Female Population of McHenry County is 2,590.
What is the Ratio of Males per 100 Females in McHenry County?
There are 105.64 Males per 100 Females in McHenry County.
What is the Ratio of Females per 100 Males in McHenry County?
There are 94.66 Females per 100 Males in McHenry County.
What is the Median Population Age in McHenry County?
Median Population Age in McHenry County is 43.0 Years.
What is the Average Family Size in McHenry County
Average Family Size in McHenry County is 2.8 People.
What is the Average Household Size in McHenry County
Average Household Size in McHenry County is 2.3 People.
What is Per Capita Income in McHenry County?
Per Capita income in McHenry County is $39,973.
What is the Median Family Income in McHenry County?
Median Family Income in McHenry County is $95,268.
What is the Median Household income in McHenry County?
Median Household Income in McHenry County is $78,071.
What is Income or Wage Gap in McHenry County?
Income or Wage Gap in McHenry County is 37.8%.
Women in McHenry County earn 62.2 cents for every dollar earned by a man.
What is Family Income Deficit in McHenry County?
Family Income Deficit in McHenry County is $11,491.
Families that are below poverty line in McHenry County earn $11,491 less on average than the poverty threshold level.
What is Inequality or Gini Index in McHenry County?
Inequality or Gini Index in McHenry County is 0.43.
How Large is the Labor Force in McHenry County?
There are 2,674 People in the Labor Forcein in McHenry County.
What is the Percentage of People in the Labor Force in McHenry County?
64.2% of People are in the Labor Force in McHenry County.
What is the Unemployment Rate in McHenry County?
Unemployment Rate in McHenry County is 4.4%.