LaMoure County, ND
LaMoure County Map
LaMoure County Overview
4,135
TOTAL POPULATION
2,134
MALE POPULATION
2,001
FEMALE POPULATION
106.65
MALES / 100 FEMALES
93.77
FEMALES / 100 MALES
45.8
MEDIAN AGE
2.9
AVG FAMILY SIZE
2.4
AVG HOUSEHOLD SIZE
$37,453
PER CAPITA INCOME
$94,313
AVG FAMILY INCOME
$70,227
AVG HOUSEHOLD INCOME
45.0%
WAGE / INCOME GAP [ % ]
55.0¢/ $1
WAGE / INCOME GAP [ $ ]
$9,696
FAMILY INCOME DEFICIT
0.41
INEQUALITY / GINI INDEX
2,084
LABOR FORCE [ PEOPLE ]
62.7%
PERCENT IN LABOR FORCE
1.7%
UNEMPLOYMENT RATE
LaMoure County Area Codes
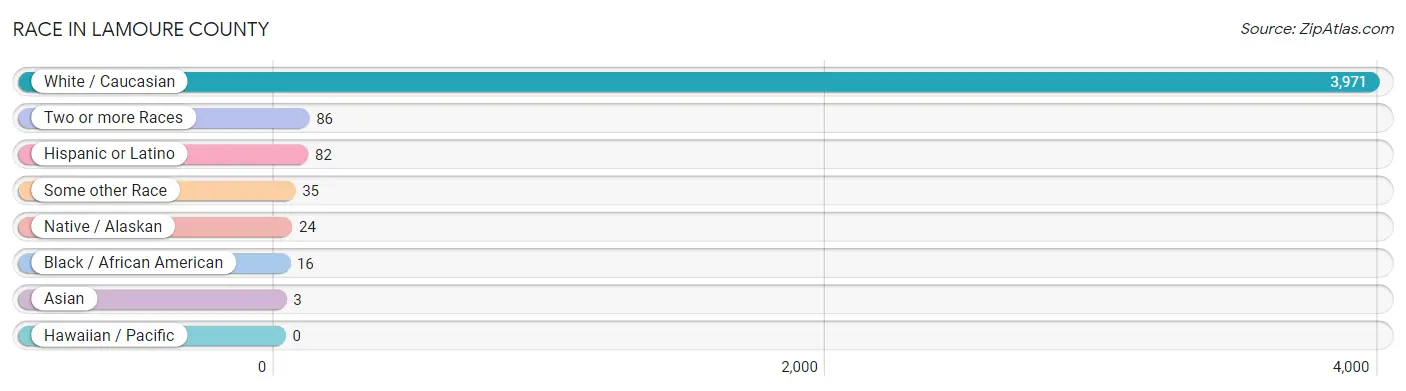
Race in LaMoure County
The most populous races in LaMoure County are White / Caucasian (3,971 | 96.0%), Two or more Races (86 | 2.1%), and Hispanic or Latino (82 | 2.0%).
| Race | # Population | % Population |
| Asian | 3 | 0.1% |
| Black / African American | 16 | 0.4% |
| Hawaiian / Pacific | 0 | 0.0% |
| Hispanic or Latino | 82 | 2.0% |
| Native / Alaskan | 24 | 0.6% |
| White / Caucasian | 3,971 | 96.0% |
| Two or more Races | 86 | 2.1% |
| Some other Race | 35 | 0.9% |
| Total | 4,135 | 100.0% |
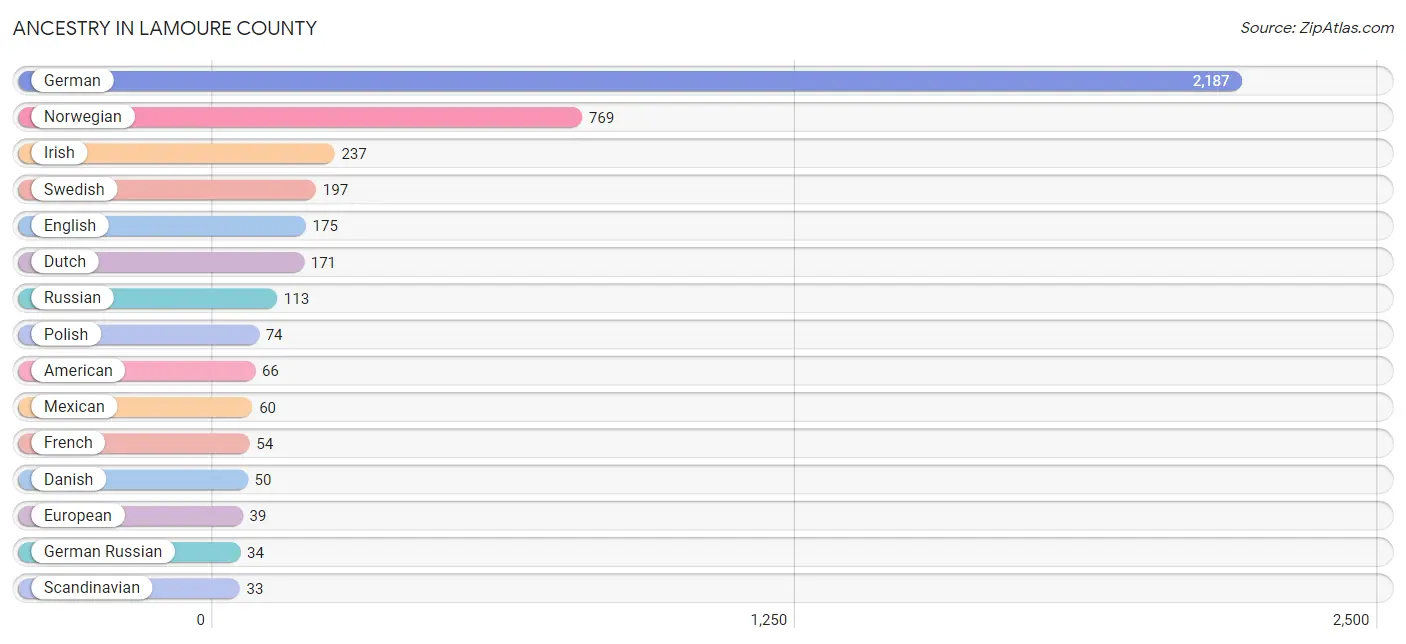
Ancestry in LaMoure County
The most populous ancestries reported in LaMoure County are German (2,187 | 52.9%), Norwegian (769 | 18.6%), Irish (237 | 5.7%), Swedish (197 | 4.8%), and English (175 | 4.2%), together accounting for 86.2% of all LaMoure County residents.
| Ancestry | # Population | % Population |
| African | 5 | 0.1% |
| American | 66 | 1.6% |
| Austrian | 4 | 0.1% |
| Belgian | 15 | 0.4% |
| Blackfeet | 5 | 0.1% |
| British | 6 | 0.2% |
| Burmese | 1 | 0.0% |
| Canadian | 25 | 0.6% |
| Central American | 7 | 0.2% |
| Cherokee | 4 | 0.1% |
| Colombian | 4 | 0.1% |
| Croatian | 2 | 0.1% |
| Czech | 28 | 0.7% |
| Danish | 50 | 1.2% |
| Dutch | 171 | 4.1% |
| English | 175 | 4.2% |
| European | 39 | 0.9% |
| Finnish | 8 | 0.2% |
| French | 54 | 1.3% |
| French American Indian | 8 | 0.2% |
| French Canadian | 11 | 0.3% |
| German | 2,187 | 52.9% |
| German Russian | 34 | 0.8% |
| Indian (Asian) | 2 | 0.1% |
| Irish | 237 | 5.7% |
| Italian | 18 | 0.4% |
| Korean | 16 | 0.4% |
| Luxembourger | 6 | 0.2% |
| Mexican | 60 | 1.5% |
| Native Hawaiian | 16 | 0.4% |
| Nigerian | 3 | 0.1% |
| Norwegian | 769 | 18.6% |
| Pennsylvania German | 5 | 0.1% |
| Polish | 74 | 1.8% |
| Russian | 113 | 2.7% |
| Salvadoran | 7 | 0.2% |
| Scandinavian | 33 | 0.8% |
| Scotch-Irish | 26 | 0.6% |
| Scottish | 30 | 0.7% |
| Sioux | 23 | 0.6% |
| South American | 4 | 0.1% |
| South American Indian | 2 | 0.1% |
| Subsaharan African | 8 | 0.2% |
| Swedish | 197 | 4.8% |
| Swiss | 5 | 0.1% |
| Ukrainian | 3 | 0.1% |
| Welsh | 5 | 0.1% |
| Yugoslavian | 5 | 0.1% | View All 48 Rows |
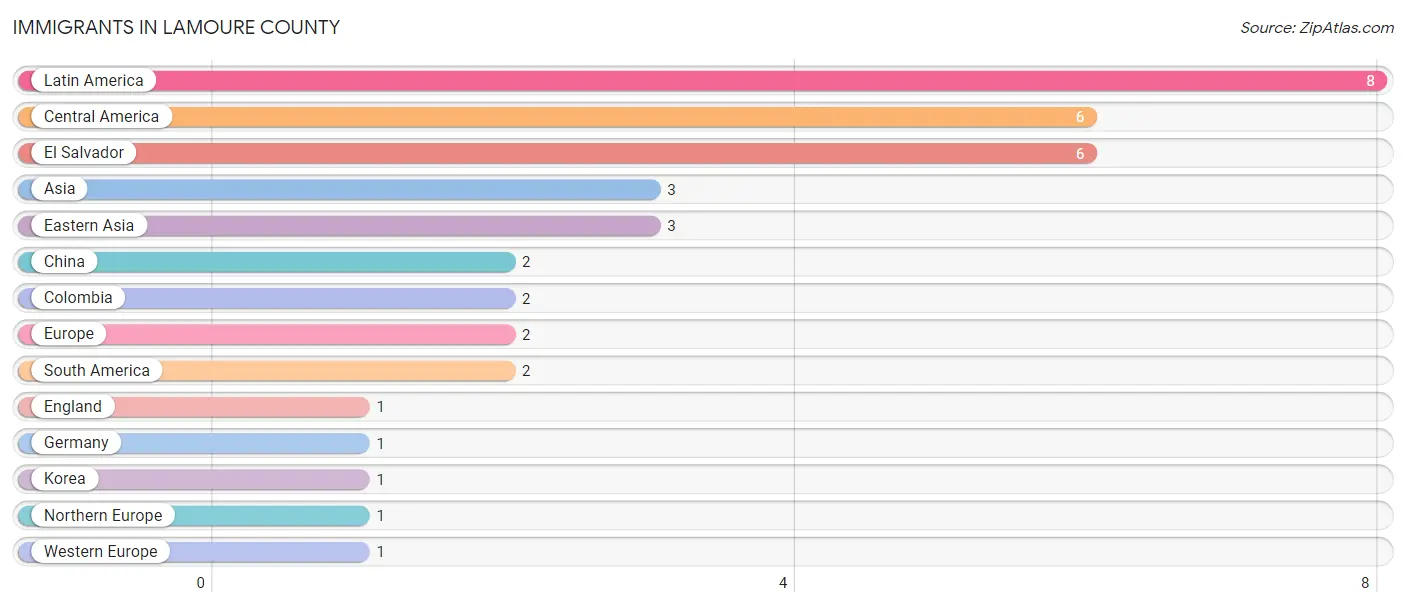
Immigrants in LaMoure County
The most numerous immigrant groups reported in LaMoure County came from Latin America (8 | 0.2%), Central America (6 | 0.2%), El Salvador (6 | 0.2%), Asia (3 | 0.1%), and Eastern Asia (3 | 0.1%), together accounting for 0.6% of all LaMoure County residents.
| Immigration Origin | # Population | % Population |
| Asia | 3 | 0.1% |
| Central America | 6 | 0.2% |
| China | 2 | 0.1% |
| Colombia | 2 | 0.1% |
| Eastern Asia | 3 | 0.1% |
| El Salvador | 6 | 0.2% |
| England | 1 | 0.0% |
| Europe | 2 | 0.1% |
| Germany | 1 | 0.0% |
| Korea | 1 | 0.0% |
| Latin America | 8 | 0.2% |
| Northern Europe | 1 | 0.0% |
| South America | 2 | 0.1% |
| Western Europe | 1 | 0.0% | View All 14 Rows |
Sex and Age in LaMoure County
Sex and Age in LaMoure County
The most populous age groups in LaMoure County are 60 to 64 Years (166 | 7.8%) for men and 30 to 34 Years (161 | 8.1%) for women.
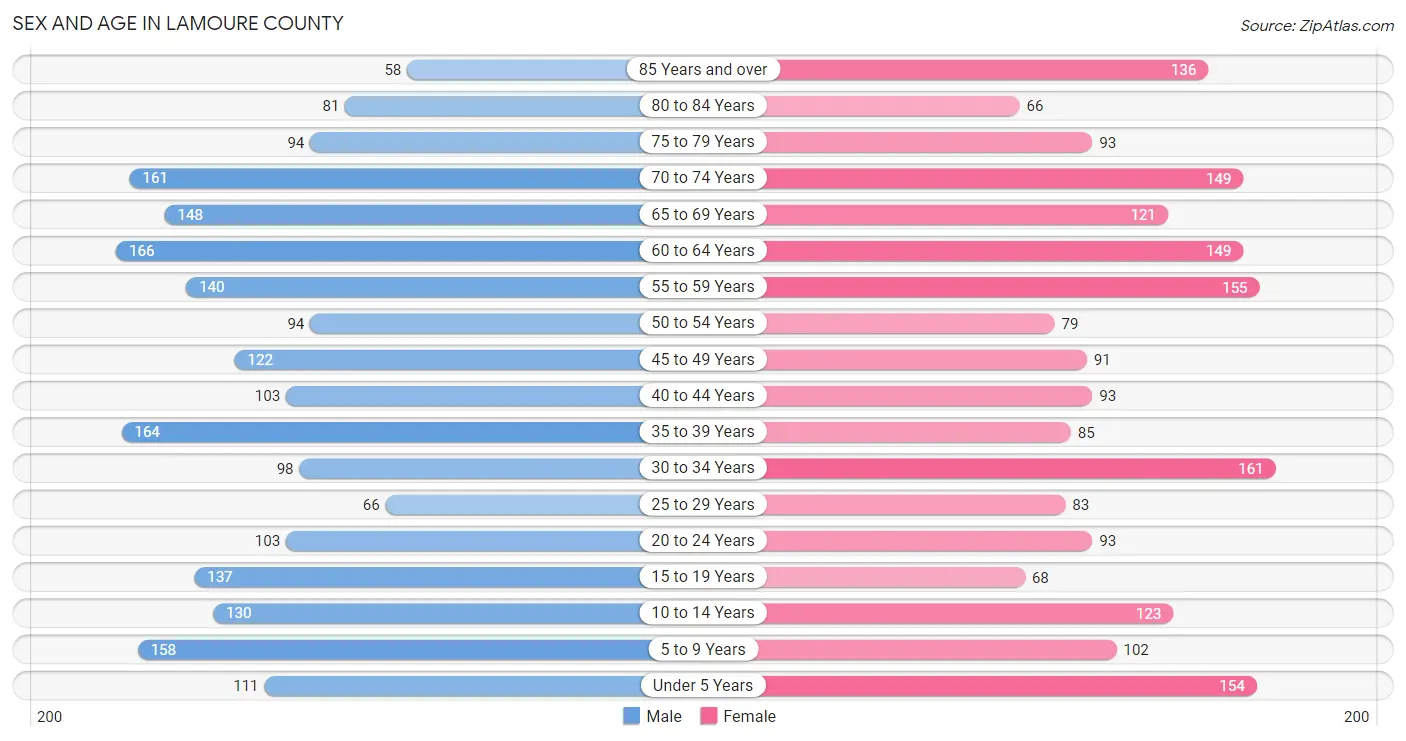
| Age Bracket | Male | Female |
| Under 5 Years | 111 (5.2%) | 154 (7.7%) |
| 5 to 9 Years | 158 (7.4%) | 102 (5.1%) |
| 10 to 14 Years | 130 (6.1%) | 123 (6.1%) |
| 15 to 19 Years | 137 (6.4%) | 68 (3.4%) |
| 20 to 24 Years | 103 (4.8%) | 93 (4.6%) |
| 25 to 29 Years | 66 (3.1%) | 83 (4.2%) |
| 30 to 34 Years | 98 (4.6%) | 161 (8.1%) |
| 35 to 39 Years | 164 (7.7%) | 85 (4.3%) |
| 40 to 44 Years | 103 (4.8%) | 93 (4.6%) |
| 45 to 49 Years | 122 (5.7%) | 91 (4.5%) |
| 50 to 54 Years | 94 (4.4%) | 79 (4.0%) |
| 55 to 59 Years | 140 (6.6%) | 155 (7.7%) |
| 60 to 64 Years | 166 (7.8%) | 149 (7.4%) |
| 65 to 69 Years | 148 (6.9%) | 121 (6.0%) |
| 70 to 74 Years | 161 (7.5%) | 149 (7.4%) |
| 75 to 79 Years | 94 (4.4%) | 93 (4.6%) |
| 80 to 84 Years | 81 (3.8%) | 66 (3.3%) |
| 85 Years and over | 58 (2.7%) | 136 (6.8%) |
| Total | 2,134 (100.0%) | 2,001 (100.0%) |
Families and Households in LaMoure County
Median Family Size in LaMoure County
The median family size in LaMoure County is 2.93 persons per family, with single female/mother families (75 | 6.8%) accounting for the largest median family size of 3.2 persons per family. On the other hand, single male/father families (38 | 3.4%) represent the smallest median family size with 2.55 persons per family.
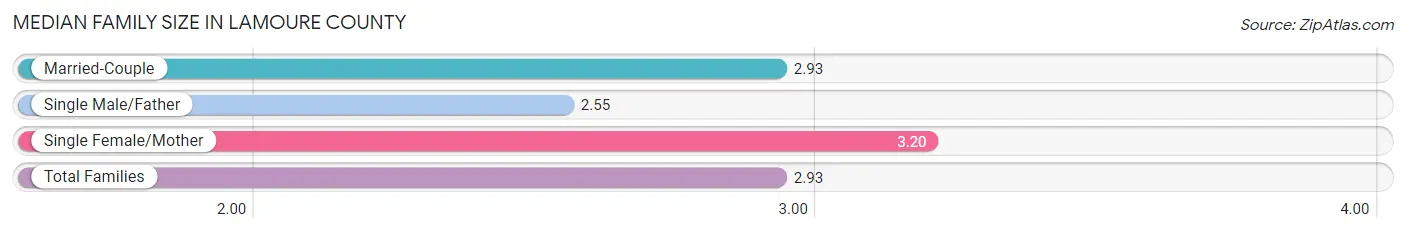
| Family Type | # Families | Family Size |
| Married-Couple | 998 (89.8%) | 2.93 |
| Single Male/Father | 38 (3.4%) | 2.55 |
| Single Female/Mother | 75 (6.8%) | 3.20 |
| Total Families | 1,111 (100.0%) | 2.93 |
Median Household Size in LaMoure County
The median household size in LaMoure County is 2.35 persons per household, with single female/mother households (75 | 4.4%) accounting for the largest median household size of 3.37 persons per household. non-family households (587 | 34.6%) represent the smallest median household size with 1.15 persons per household.
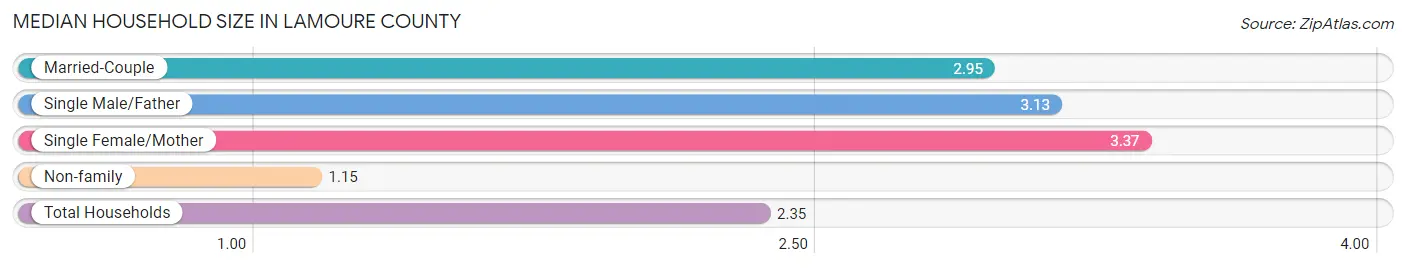
| Household Type | # Households | Household Size |
| Married-Couple | 998 (58.8%) | 2.95 |
| Single Male/Father | 38 (2.2%) | 3.13 |
| Single Female/Mother | 75 (4.4%) | 3.37 |
| Non-family | 587 (34.6%) | 1.15 |
| Total Households | 1,698 (100.0%) | 2.35 |
Household Size by Marriage Status in LaMoure County
Out of a total of 1,698 households in LaMoure County, 1,111 (65.4%) are family households, while 587 (34.6%) are nonfamily households. The most numerous type of family households are 2-person households, comprising 648, and the most common type of nonfamily households are 1-person households, comprising 524.
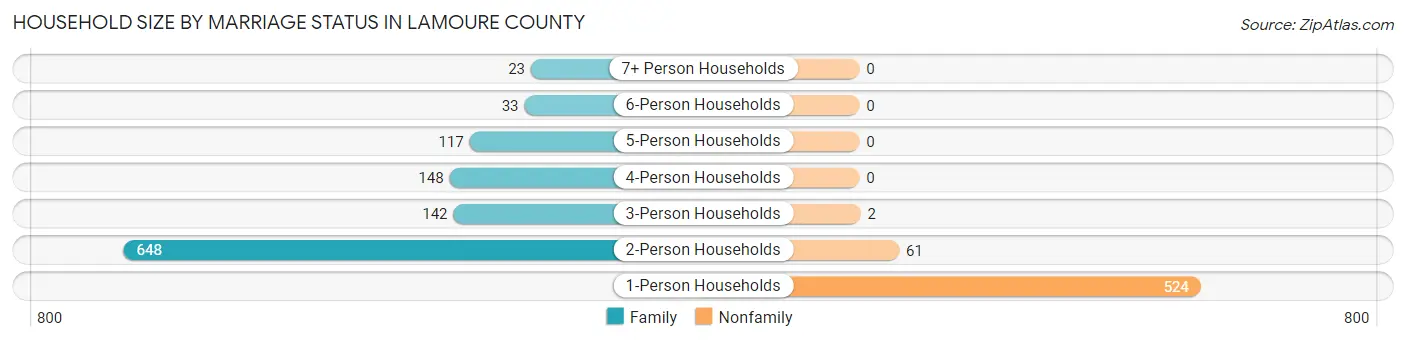
| Household Size | Family Households | Nonfamily Households |
| 1-Person Households | - | 524 (30.9%) |
| 2-Person Households | 648 (38.2%) | 61 (3.6%) |
| 3-Person Households | 142 (8.4%) | 2 (0.1%) |
| 4-Person Households | 148 (8.7%) | 0 (0.0%) |
| 5-Person Households | 117 (6.9%) | 0 (0.0%) |
| 6-Person Households | 33 (1.9%) | 0 (0.0%) |
| 7+ Person Households | 23 (1.3%) | 0 (0.0%) |
| Total | 1,111 (65.4%) | 587 (34.6%) |
Female Fertility in LaMoure County
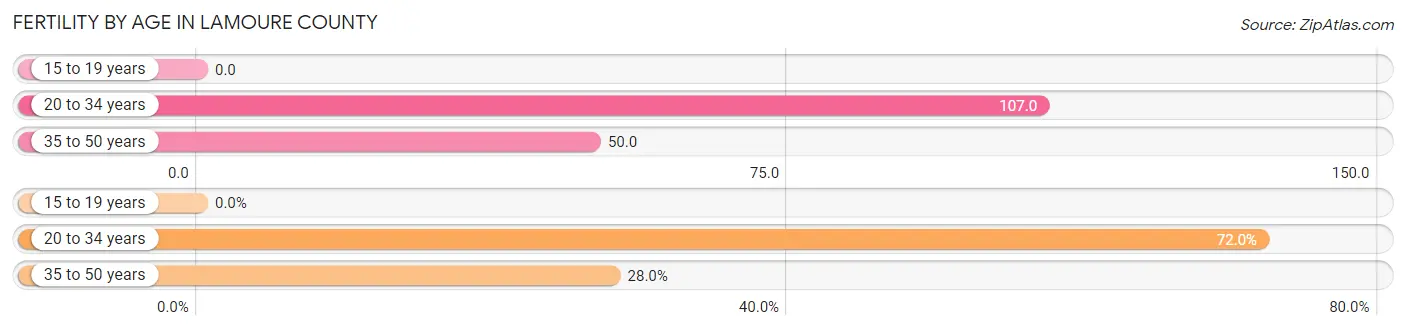
Fertility by Age in LaMoure County
Average fertility rate in LaMoure County is 73.0 births per 1,000 women. Women in the age bracket of 20 to 34 years have the highest fertility rate with 107.0 births per 1,000 women. Women in the age bracket of 20 to 34 years acount for 72.0% of all women with births.
| Age Bracket | Women with Births | Births / 1,000 Women |
| 15 to 19 years | 0 (0.0%) | 0.0 |
| 20 to 34 years | 36 (72.0%) | 107.0 |
| 35 to 50 years | 14 (28.0%) | 50.0 |
| Total | 50 (100.0%) | 73.0 |
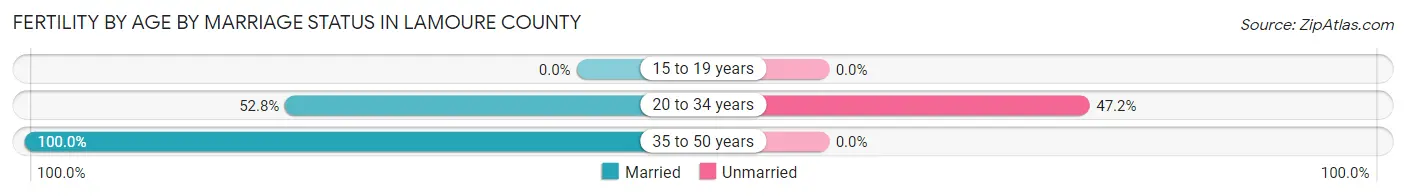
Fertility by Age by Marriage Status in LaMoure County
66.0% of women with births (50) in LaMoure County are married. The highest percentage of unmarried women with births falls into 20 to 34 years age bracket with 47.2% of them unmarried at the time of birth, while the lowest percentage of unmarried women with births belong to 35 to 50 years age bracket with 0.0% of them unmarried.
| Age Bracket | Married | Unmarried |
| 15 to 19 years | 0 (0.0%) | 0 (0.0%) |
| 20 to 34 years | 19 (52.8%) | 17 (47.2%) |
| 35 to 50 years | 14 (100.0%) | 0 (0.0%) |
| Total | 33 (66.0%) | 17 (34.0%) |
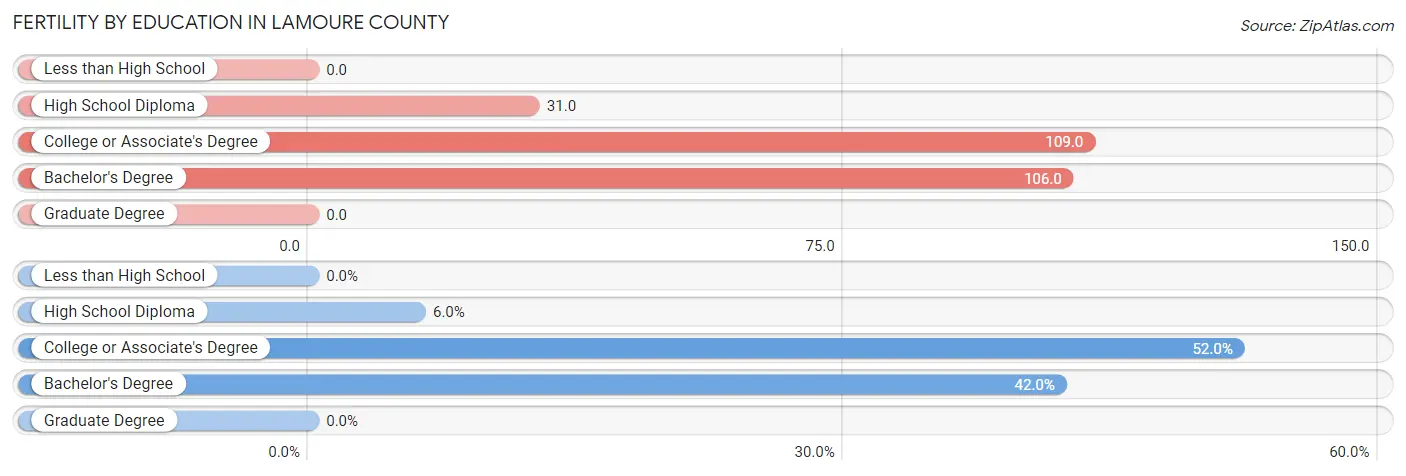
Fertility by Education in LaMoure County
| Educational Attainment | Women with Births | Births / 1,000 Women |
| Less than High School | 0 (0.0%) | 0.0 |
| High School Diploma | 3 (6.0%) | 31.0 |
| College or Associate's Degree | 26 (52.0%) | 109.0 |
| Bachelor's Degree | 21 (42.0%) | 106.0 |
| Graduate Degree | 0 (0.0%) | 0.0 |
| Total | 50 (100.0%) | 73.0 |
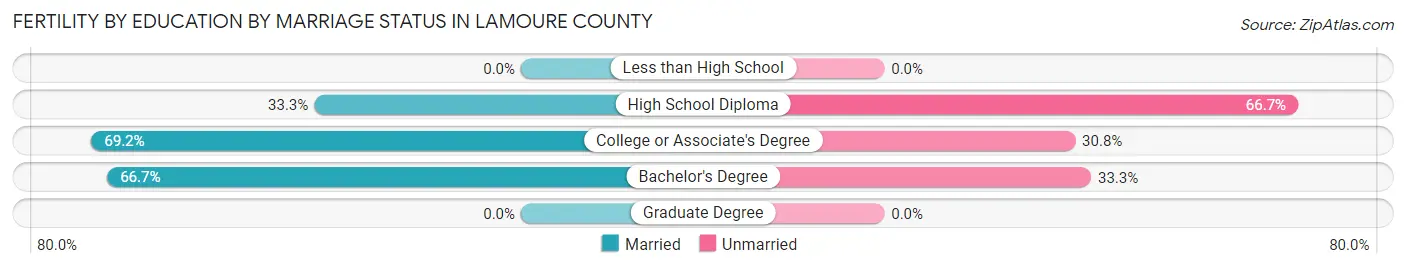
Fertility by Education by Marriage Status in LaMoure County
34.0% of women with births in LaMoure County are unmarried. Women with the educational attainment of college or associate's degree are most likely to be married with 69.2% of them married at childbirth, while women with the educational attainment of high school diploma are least likely to be married with 66.7% of them unmarried at childbirth.
| Educational Attainment | Married | Unmarried |
| Less than High School | 0 (0.0%) | 0 (0.0%) |
| High School Diploma | 1 (33.3%) | 2 (66.7%) |
| College or Associate's Degree | 18 (69.2%) | 8 (30.8%) |
| Bachelor's Degree | 14 (66.7%) | 7 (33.3%) |
| Graduate Degree | 0 (0.0%) | 0 (0.0%) |
| Total | 33 (66.0%) | 17 (34.0%) |
Income in LaMoure County
Income Overview in LaMoure County
Per Capita Income in LaMoure County is $37,453, while median incomes of families and households are $94,313 and $70,227 respectively.
| Characteristic | Number | Measure |
| Per Capita Income | 4,135 | $37,453 |
| Median Family Income | 1,111 | $94,313 |
| Mean Family Income | 1,111 | $106,531 |
| Median Household Income | 1,698 | $70,227 |
| Mean Household Income | 1,698 | $87,690 |
| Income Deficit | 1,111 | $9,696 |
| Wage / Income Gap (%) | 4,135 | 45.00% |
| Wage / Income Gap ($) | 4,135 | 55.00¢ per $1 |
| Gini / Inequality Index | 4,135 | 0.41 |
Earnings by Sex in LaMoure County
Average Earnings in LaMoure County are $39,627, $52,740 for men and $29,006 for women, a difference of 45.0%.
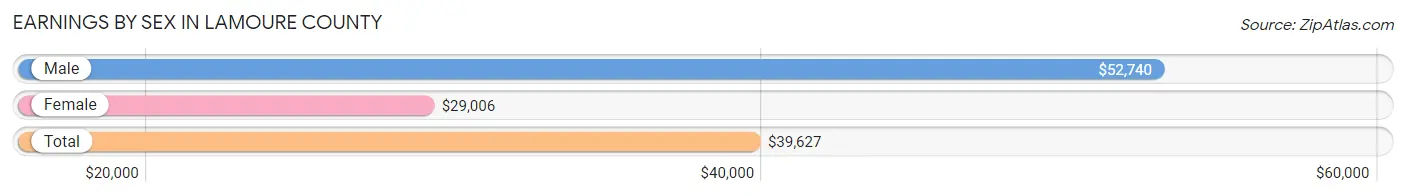
| Sex | Number | Average Earnings |
| Male | 1,271 (56.1%) | $52,740 |
| Female | 994 (43.9%) | $29,006 |
| Total | 2,265 (100.0%) | $39,627 |
Earnings by Sex by Income Bracket in LaMoure County
The most common earnings brackets in LaMoure County are $100,000+ for men (185 | 14.6%) and $25,000 to $29,999 for women (133 | 13.4%).
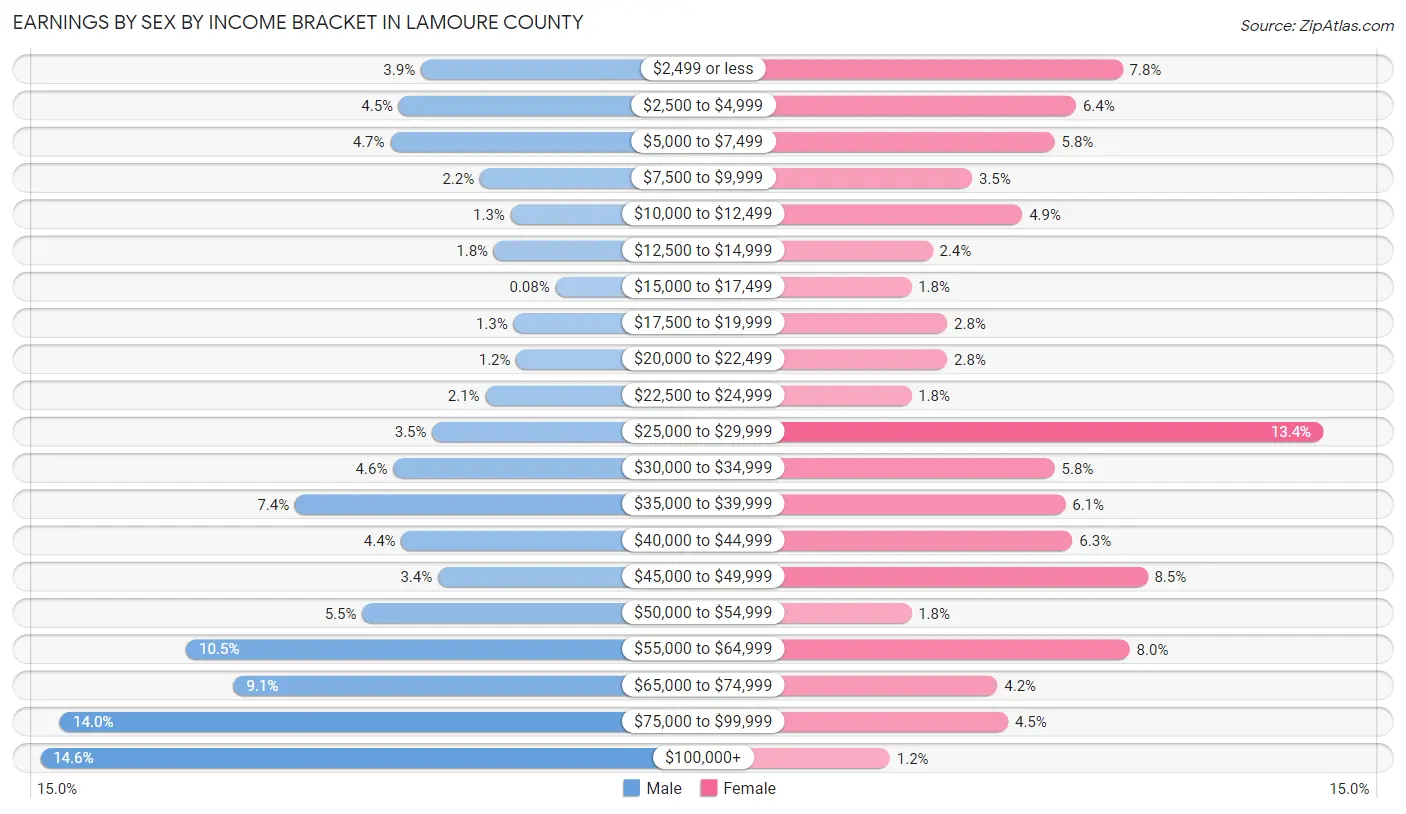
| Income | Male | Female |
| $2,499 or less | 49 (3.9%) | 77 (7.7%) |
| $2,500 to $4,999 | 57 (4.5%) | 64 (6.4%) |
| $5,000 to $7,499 | 60 (4.7%) | 58 (5.8%) |
| $7,500 to $9,999 | 28 (2.2%) | 35 (3.5%) |
| $10,000 to $12,499 | 17 (1.3%) | 49 (4.9%) |
| $12,500 to $14,999 | 23 (1.8%) | 24 (2.4%) |
| $15,000 to $17,499 | 1 (0.1%) | 18 (1.8%) |
| $17,500 to $19,999 | 16 (1.3%) | 28 (2.8%) |
| $20,000 to $22,499 | 15 (1.2%) | 28 (2.8%) |
| $22,500 to $24,999 | 26 (2.1%) | 18 (1.8%) |
| $25,000 to $29,999 | 45 (3.5%) | 133 (13.4%) |
| $30,000 to $34,999 | 59 (4.6%) | 58 (5.8%) |
| $35,000 to $39,999 | 94 (7.4%) | 61 (6.1%) |
| $40,000 to $44,999 | 56 (4.4%) | 63 (6.3%) |
| $45,000 to $49,999 | 43 (3.4%) | 84 (8.5%) |
| $50,000 to $54,999 | 70 (5.5%) | 18 (1.8%) |
| $55,000 to $64,999 | 133 (10.5%) | 79 (8.0%) |
| $65,000 to $74,999 | 116 (9.1%) | 42 (4.2%) |
| $75,000 to $99,999 | 178 (14.0%) | 45 (4.5%) |
| $100,000+ | 185 (14.6%) | 12 (1.2%) |
| Total | 1,271 (100.0%) | 994 (100.0%) |
Earnings by Sex by Educational Attainment in LaMoure County
Average earnings in LaMoure County are $56,429 for men and $31,339 for women, a difference of 44.5%. Men with an educational attainment of college or associate's degree enjoy the highest average annual earnings of $66,250, while those with less than high school education earn the least with $39,500. Women with an educational attainment of graduate degree earn the most with the average annual earnings of $63,750, while those with high school diploma education have the smallest earnings of $23,333.
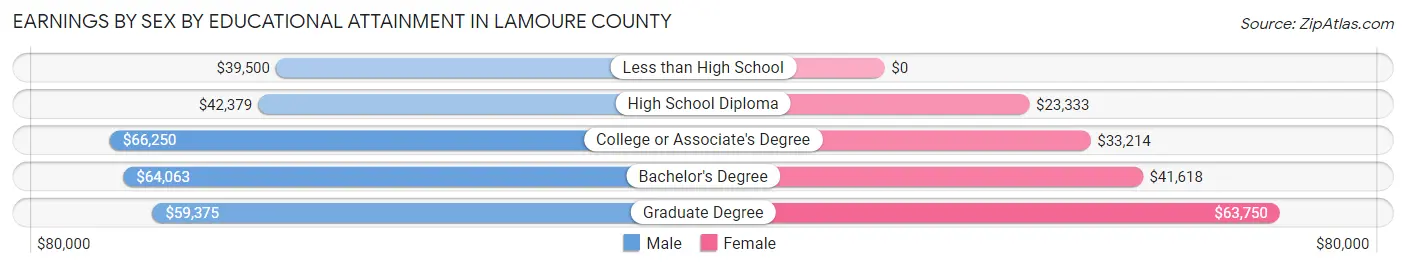
| Educational Attainment | Male Income | Female Income |
| Less than High School | $39,500 | $0 |
| High School Diploma | $42,379 | $23,333 |
| College or Associate's Degree | $66,250 | $33,214 |
| Bachelor's Degree | $64,063 | $41,618 |
| Graduate Degree | $59,375 | $63,750 |
| Total | $56,429 | $31,339 |
Family Income in LaMoure County
Family Income Brackets in LaMoure County
According to the LaMoure County family income data, there are 281 families falling into the $100,000 to $149,999 income range, which is the most common income bracket and makes up 25.3% of all families. Conversely, the $10,000 to $14,999 income bracket is the least frequent group with only 17 families (1.5%) belonging to this category.
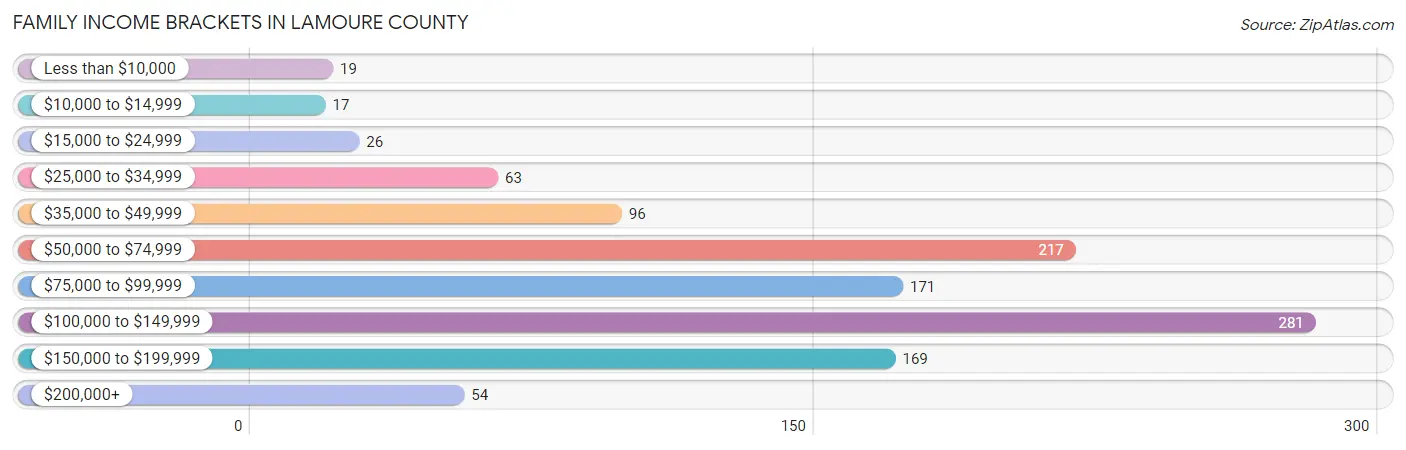
| Income Bracket | # Families | % Families |
| Less than $10,000 | 19 | 1.7% |
| $10,000 to $14,999 | 17 | 1.5% |
| $15,000 to $24,999 | 26 | 2.3% |
| $25,000 to $34,999 | 63 | 5.7% |
| $35,000 to $49,999 | 96 | 8.6% |
| $50,000 to $74,999 | 217 | 19.5% |
| $75,000 to $99,999 | 171 | 15.4% |
| $100,000 to $149,999 | 281 | 25.3% |
| $150,000 to $199,999 | 169 | 15.2% |
| $200,000+ | 54 | 4.9% |
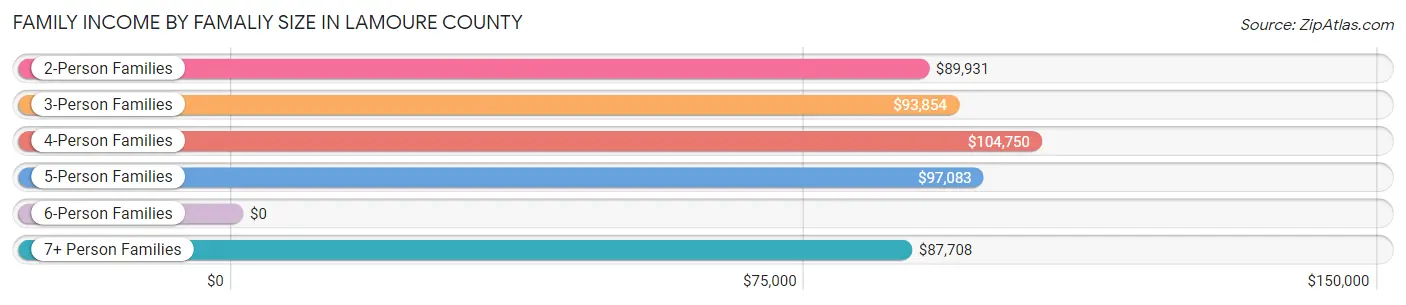
Family Income by Famaliy Size in LaMoure County
4-person families (147 | 13.2%) account for the highest median family income in LaMoure County with $104,750 per family, while 2-person families (669 | 60.2%) have the highest median income of $44,966 per family member.
| Income Bracket | # Families | Median Income |
| 2-Person Families | 669 (60.2%) | $89,931 |
| 3-Person Families | 127 (11.4%) | $93,854 |
| 4-Person Families | 147 (13.2%) | $104,750 |
| 5-Person Families | 112 (10.1%) | $97,083 |
| 6-Person Families | 33 (3.0%) | $0 |
| 7+ Person Families | 23 (2.1%) | $87,708 |
| Total | 1,111 (100.0%) | $94,313 |
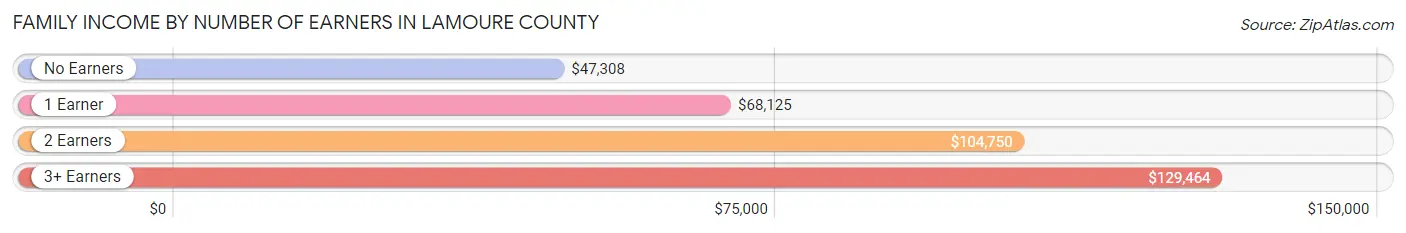
Family Income by Number of Earners in LaMoure County
The median family income in LaMoure County is $94,313, with families comprising 3+ earners (91) having the highest median family income of $129,464, while families with no earners (158) have the lowest median family income of $47,308, accounting for 8.2% and 14.2% of families, respectively.
| Number of Earners | # Families | Median Income |
| No Earners | 158 (14.2%) | $47,308 |
| 1 Earner | 324 (29.2%) | $68,125 |
| 2 Earners | 538 (48.4%) | $104,750 |
| 3+ Earners | 91 (8.2%) | $129,464 |
| Total | 1,111 (100.0%) | $94,313 |
Household Income in LaMoure County
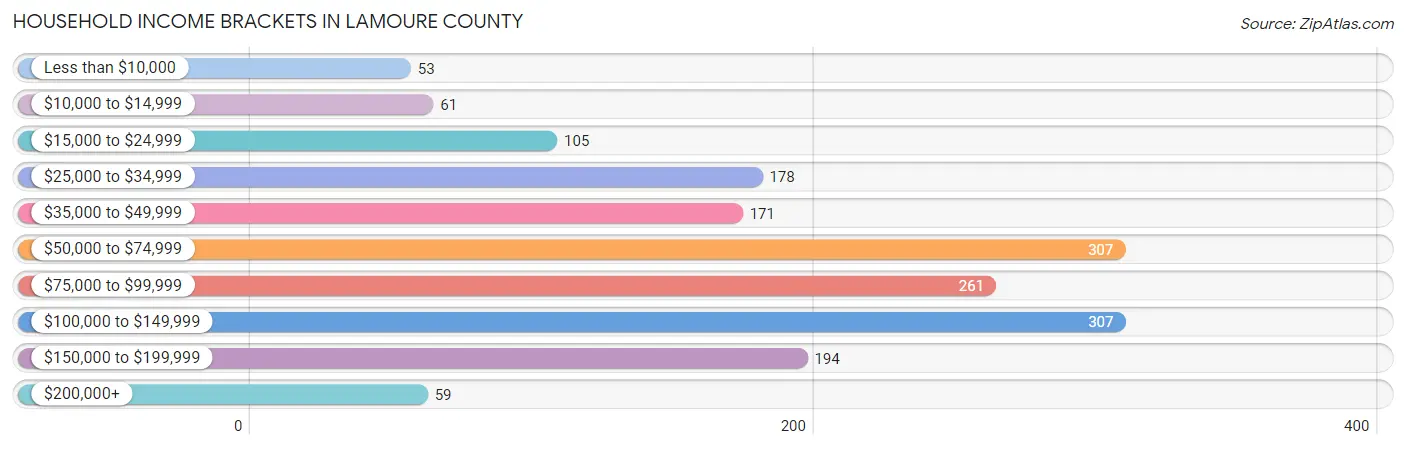
Household Income Brackets in LaMoure County
With 307 households falling in the category, the $50,000 to $74,999 income range is the most frequent in LaMoure County, accounting for 18.1% of all households. In contrast, only 53 households (3.1%) fall into the less than $10,000 income bracket, making it the least populous group.
| Income Bracket | # Households | % Households |
| Less than $10,000 | 53 | 3.1% |
| $10,000 to $14,999 | 61 | 3.6% |
| $15,000 to $24,999 | 105 | 6.2% |
| $25,000 to $34,999 | 178 | 10.5% |
| $35,000 to $49,999 | 171 | 10.1% |
| $50,000 to $74,999 | 307 | 18.1% |
| $75,000 to $99,999 | 261 | 15.4% |
| $100,000 to $149,999 | 307 | 18.1% |
| $150,000 to $199,999 | 194 | 11.4% |
| $200,000+ | 59 | 3.5% |
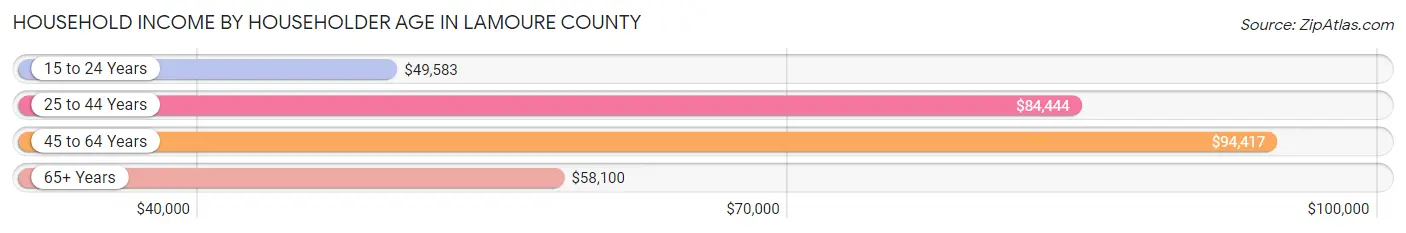
Household Income by Householder Age in LaMoure County
The median household income in LaMoure County is $70,227, with the highest median household income of $94,417 found in the 45 to 64 years age bracket for the primary householder. A total of 569 households (33.5%) fall into this category. Meanwhile, the 15 to 24 years age bracket for the primary householder has the lowest median household income of $49,583, with 53 households (3.1%) in this group.
| Income Bracket | # Households | Median Income |
| 15 to 24 Years | 53 (3.1%) | $49,583 |
| 25 to 44 Years | 400 (23.6%) | $84,444 |
| 45 to 64 Years | 569 (33.5%) | $94,417 |
| 65+ Years | 676 (39.8%) | $58,100 |
| Total | 1,698 (100.0%) | $70,227 |
Poverty in LaMoure County
Income Below Poverty by Sex and Age in LaMoure County
With 9.9% poverty level for males and 14.6% for females among the residents of LaMoure County, 15 year old males and 18 to 24 year old females are the most vulnerable to poverty, with 7 males (26.9%) and 63 females (50.4%) in their respective age groups living below the poverty level.
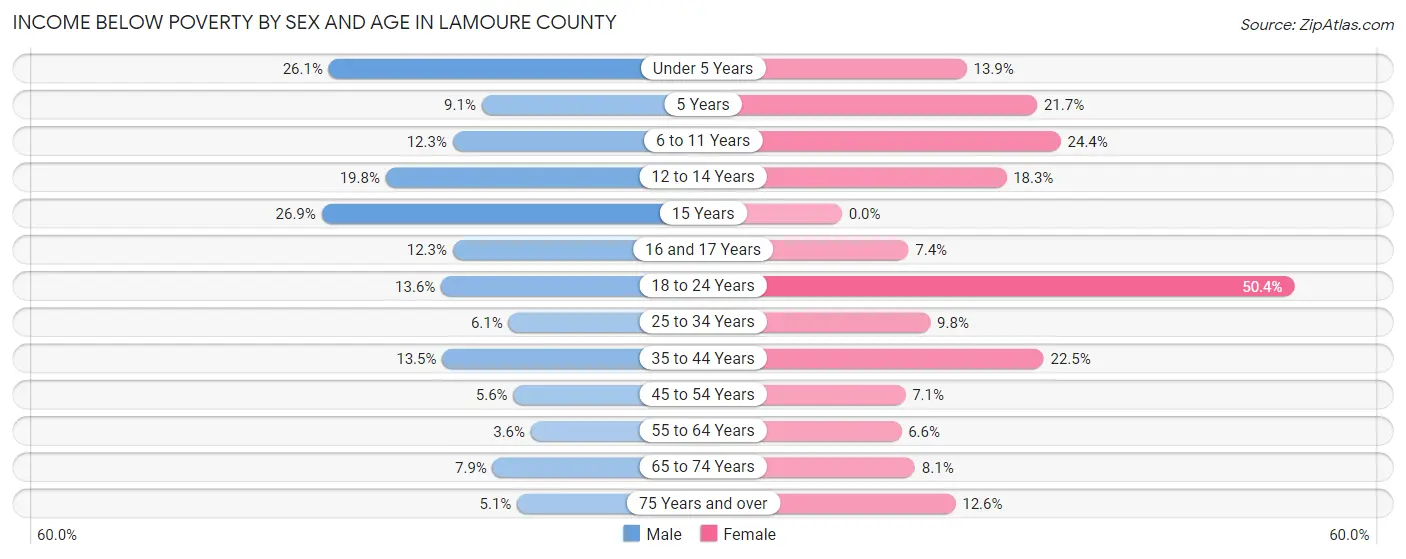
| Age Bracket | Male | Female |
| Under 5 Years | 29 (26.1%) | 20 (13.9%) |
| 5 Years | 3 (9.1%) | 5 (21.7%) |
| 6 to 11 Years | 17 (12.3%) | 29 (24.4%) |
| 12 to 14 Years | 18 (19.8%) | 13 (18.3%) |
| 15 Years | 7 (26.9%) | 0 (0.0%) |
| 16 and 17 Years | 8 (12.3%) | 2 (7.4%) |
| 18 to 24 Years | 20 (13.6%) | 63 (50.4%) |
| 25 to 34 Years | 10 (6.1%) | 24 (9.8%) |
| 35 to 44 Years | 36 (13.5%) | 40 (22.5%) |
| 45 to 54 Years | 12 (5.6%) | 12 (7.1%) |
| 55 to 64 Years | 11 (3.6%) | 20 (6.6%) |
| 65 to 74 Years | 24 (7.9%) | 21 (8.1%) |
| 75 Years and over | 11 (5.1%) | 33 (12.6%) |
| Total | 206 (9.9%) | 282 (14.6%) |
Income Above Poverty by Sex and Age in LaMoure County
According to the poverty statistics in LaMoure County, males aged 55 to 64 years and females aged 15 years are the age groups that are most secure financially, with 96.4% of males and 100.0% of females in these age groups living above the poverty line.
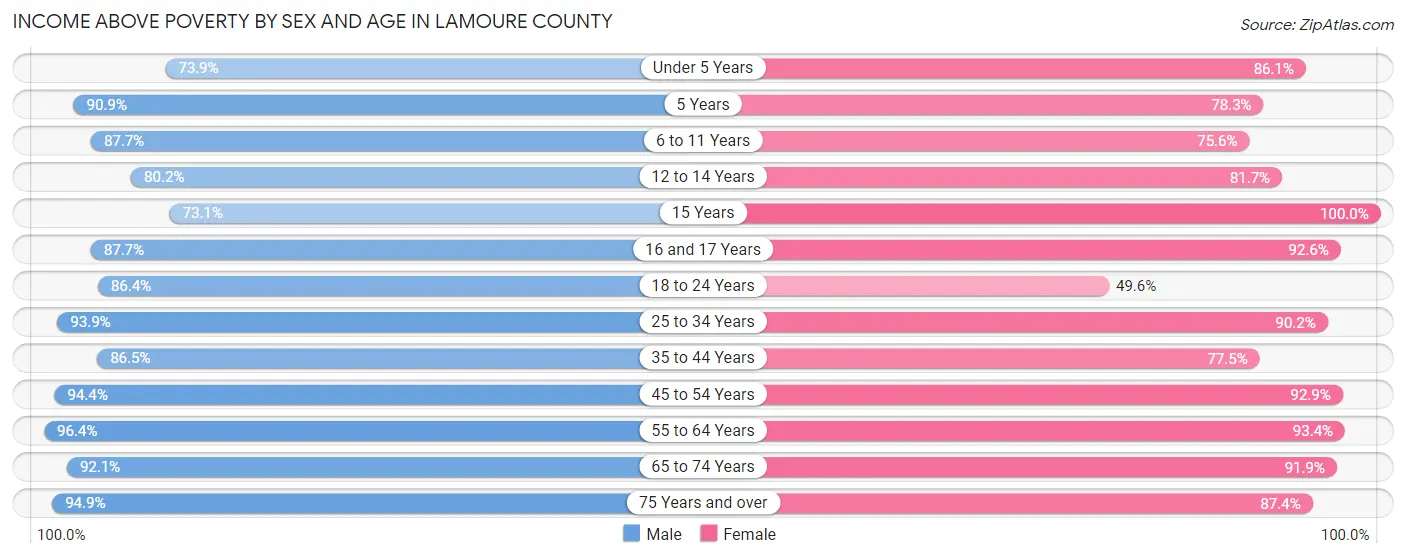
| Age Bracket | Male | Female |
| Under 5 Years | 82 (73.9%) | 124 (86.1%) |
| 5 Years | 30 (90.9%) | 18 (78.3%) |
| 6 to 11 Years | 121 (87.7%) | 90 (75.6%) |
| 12 to 14 Years | 73 (80.2%) | 58 (81.7%) |
| 15 Years | 19 (73.1%) | 8 (100.0%) |
| 16 and 17 Years | 57 (87.7%) | 25 (92.6%) |
| 18 to 24 Years | 127 (86.4%) | 62 (49.6%) |
| 25 to 34 Years | 154 (93.9%) | 220 (90.2%) |
| 35 to 44 Years | 231 (86.5%) | 138 (77.5%) |
| 45 to 54 Years | 204 (94.4%) | 158 (92.9%) |
| 55 to 64 Years | 293 (96.4%) | 282 (93.4%) |
| 65 to 74 Years | 281 (92.1%) | 237 (91.9%) |
| 75 Years and over | 203 (94.9%) | 228 (87.4%) |
| Total | 1,875 (90.1%) | 1,648 (85.4%) |
Income Below Poverty Among Married-Couple Families in LaMoure County
The poverty statistics for married-couple families in LaMoure County show that 7.0% or 70 of the total 998 families live below the poverty line. Families with 5 or more children have the highest poverty rate of 47.8%, comprising of 11 families. On the other hand, families with no children have the lowest poverty rate of 3.6%, which includes 24 families.
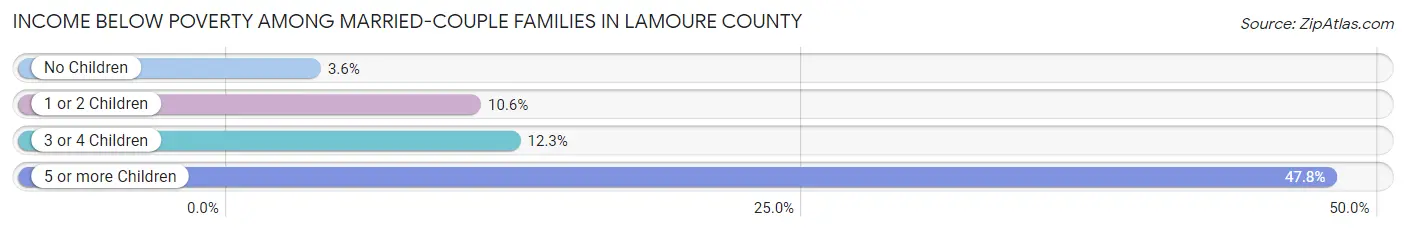
| Children | Above Poverty | Below Poverty |
| No Children | 640 (96.4%) | 24 (3.6%) |
| 1 or 2 Children | 169 (89.4%) | 20 (10.6%) |
| 3 or 4 Children | 107 (87.7%) | 15 (12.3%) |
| 5 or more Children | 12 (52.2%) | 11 (47.8%) |
| Total | 928 (93.0%) | 70 (7.0%) |
Income Below Poverty Among Single-Parent Households in LaMoure County
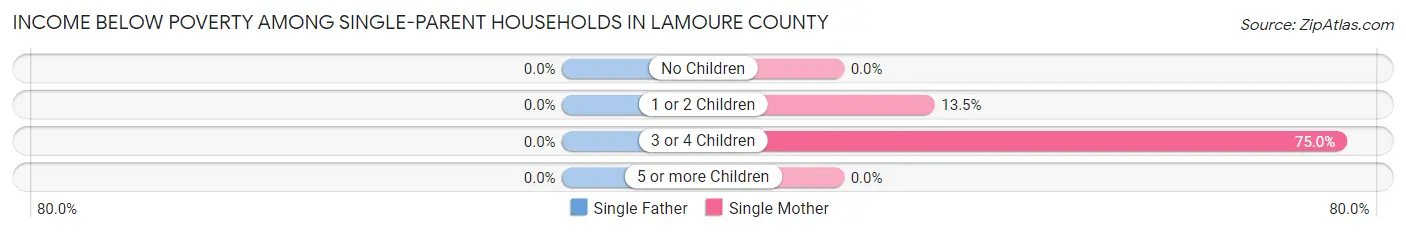
| Children | Single Father | Single Mother |
| No Children | 0 (0.0%) | 0 (0.0%) |
| 1 or 2 Children | 0 (0.0%) | 5 (13.5%) |
| 3 or 4 Children | 0 (0.0%) | 3 (75.0%) |
| 5 or more Children | 0 (0.0%) | 0 (0.0%) |
| Total | 0 (0.0%) | 8 (10.7%) |
Income Below Poverty Among Married-Couple vs Single-Parent Households in LaMoure County
The poverty data for LaMoure County shows that 70 of the married-couple family households (7.0%) and 8 of the single-parent households (7.1%) are living below the poverty level. Within the married-couple family households, those with 5 or more children have the highest poverty rate, with 11 households (47.8%) falling below the poverty line. Among the single-parent households, those with 3 or 4 children have the highest poverty rate, with 3 household (75.0%) living below poverty.
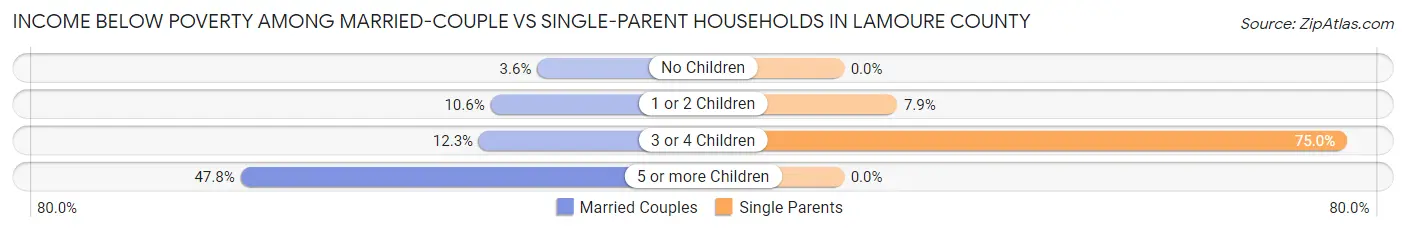
| Children | Married-Couple Families | Single-Parent Households |
| No Children | 24 (3.6%) | 0 (0.0%) |
| 1 or 2 Children | 20 (10.6%) | 5 (7.9%) |
| 3 or 4 Children | 15 (12.3%) | 3 (75.0%) |
| 5 or more Children | 11 (47.8%) | 0 (0.0%) |
| Total | 70 (7.0%) | 8 (7.1%) |
Employment Characteristics in LaMoure County
Employment by Class of Employer in LaMoure County
Among the 2,036 employed individuals in LaMoure County, private company employees (1,071 | 52.6%), self-employed (not incorporated) (385 | 18.9%), and not-for-profit organizations (185 | 9.1%) make up the most common classes of employment.
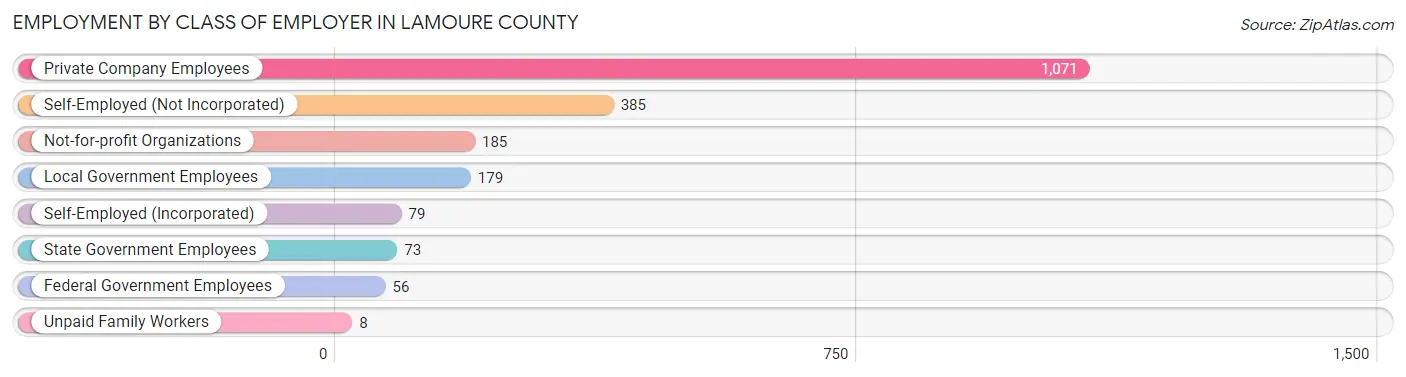
| Employer Class | # Employees | % Employees |
| Private Company Employees | 1,071 | 52.6% |
| Self-Employed (Incorporated) | 79 | 3.9% |
| Self-Employed (Not Incorporated) | 385 | 18.9% |
| Not-for-profit Organizations | 185 | 9.1% |
| Local Government Employees | 179 | 8.8% |
| State Government Employees | 73 | 3.6% |
| Federal Government Employees | 56 | 2.8% |
| Unpaid Family Workers | 8 | 0.4% |
| Total | 2,036 | 100.0% |
Employment Status by Age in LaMoure County
According to the labor force statistics for LaMoure County, out of the total population over 16 years of age (3,323), 62.7% or 2,084 individuals are in the labor force, with 1.7% or 35 of them unemployed. The age group with the highest labor force participation rate is 20 to 24 years, with 89.8% or 176 individuals in the labor force. Within the labor force, the 60 to 64 years age range has the highest percentage of unemployed individuals, with 8.8% or 20 of them being unemployed.
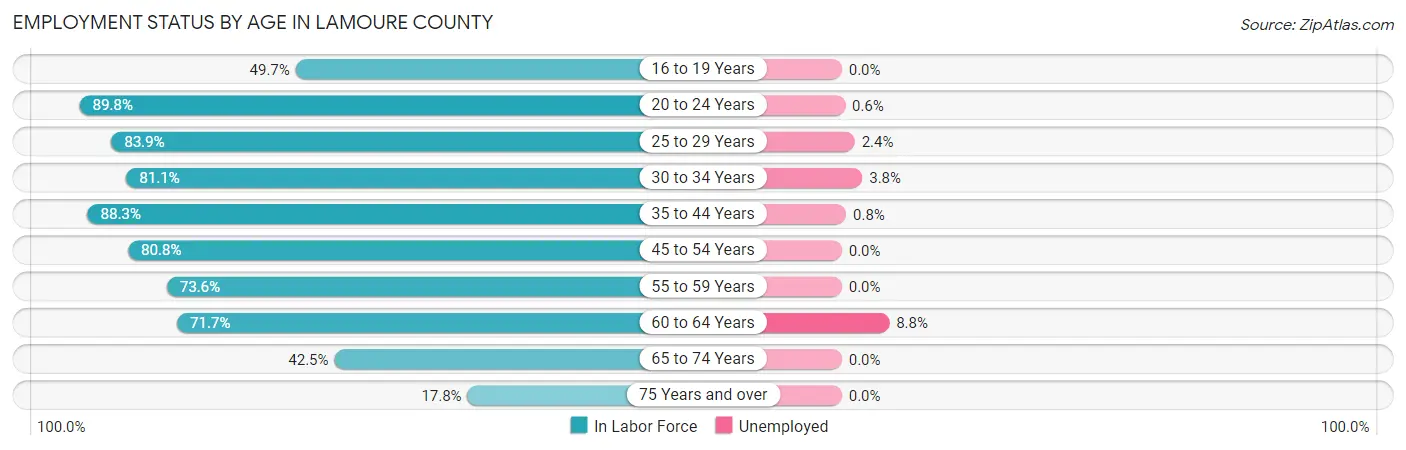
| Age Bracket | In Labor Force | Unemployed |
| 16 to 19 Years | 85 (49.7%) | 0 (0.0%) |
| 20 to 24 Years | 176 (89.8%) | 1 (0.6%) |
| 25 to 29 Years | 125 (83.9%) | 3 (2.4%) |
| 30 to 34 Years | 210 (81.1%) | 8 (3.8%) |
| 35 to 44 Years | 393 (88.3%) | 3 (0.8%) |
| 45 to 54 Years | 312 (80.8%) | 0 (0.0%) |
| 55 to 59 Years | 217 (73.6%) | 0 (0.0%) |
| 60 to 64 Years | 226 (71.7%) | 20 (8.8%) |
| 65 to 74 Years | 246 (42.5%) | 0 (0.0%) |
| 75 Years and over | 94 (17.8%) | 0 (0.0%) |
| Total | 2,084 (62.7%) | 35 (1.7%) |
Employment Status by Educational Attainment in LaMoure County
According to labor force statistics for LaMoure County, 80.2% of individuals (1,483) out of the total population between 25 and 64 years of age (1,849) are in the labor force, with 2.3% or 34 of them being unemployed. The group with the highest labor force participation rate are those with the educational attainment of college / associate degree, with 85.7% or 625 individuals in the labor force. Within the labor force, individuals with less than high school education have the highest percentage of unemployment, with 8.7% or 8 of them being unemployed.
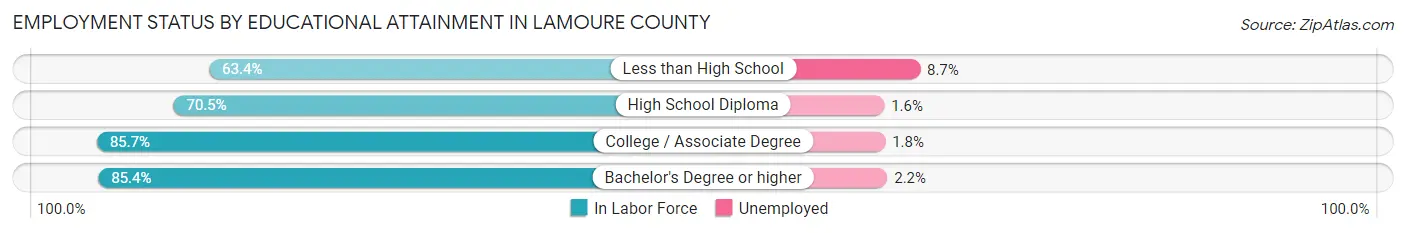
| Educational Attainment | In Labor Force | Unemployed |
| Less than High School | 92 (63.4%) | 13 (8.7%) |
| High School Diploma | 316 (70.5%) | 7 (1.6%) |
| College / Associate Degree | 625 (85.7%) | 13 (1.8%) |
| Bachelor's Degree or higher | 450 (85.4%) | 12 (2.2%) |
| Total | 1,483 (80.2%) | 43 (2.3%) |
Employment Occupations by Sex in LaMoure County
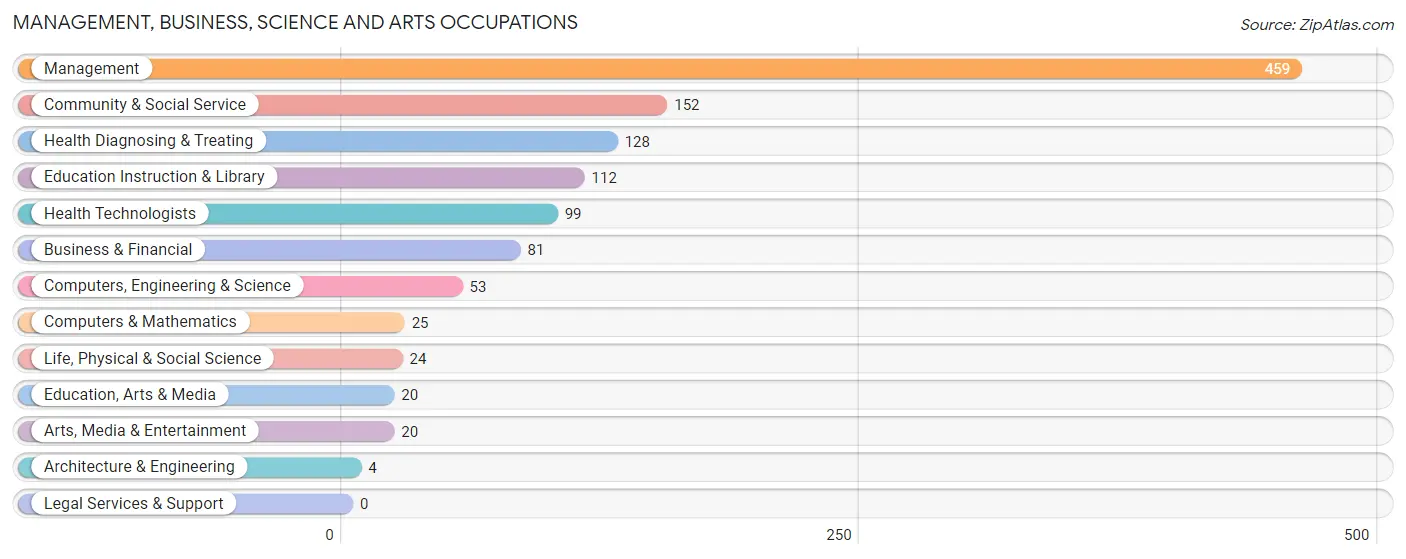
Management, Business, Science and Arts Occupations
The most common Management, Business, Science and Arts occupations in LaMoure County are Management (459 | 22.4%), Community & Social Service (152 | 7.4%), Health Diagnosing & Treating (128 | 6.2%), Education Instruction & Library (112 | 5.5%), and Health Technologists (99 | 4.8%).
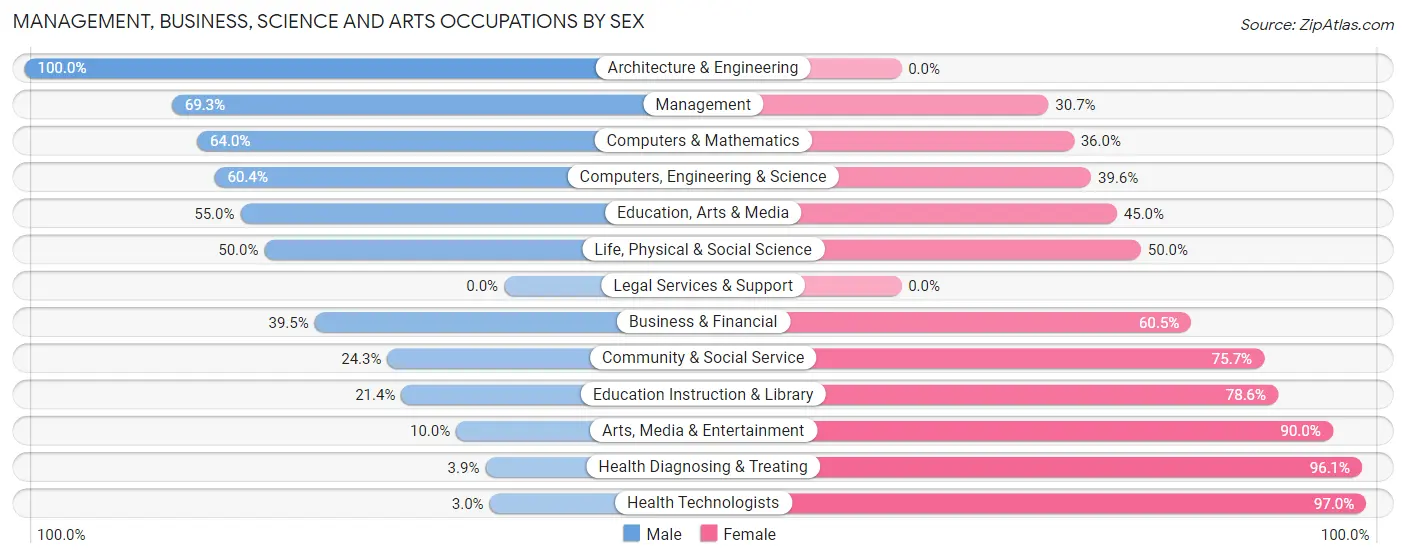
Management, Business, Science and Arts Occupations by Sex
Within the Management, Business, Science and Arts occupations in LaMoure County, the most male-oriented occupations are Architecture & Engineering (100.0%), Management (69.3%), and Computers & Mathematics (64.0%), while the most female-oriented occupations are Health Technologists (97.0%), Health Diagnosing & Treating (96.1%), and Arts, Media & Entertainment (90.0%).
| Occupation | Male | Female |
| Management | 318 (69.3%) | 141 (30.7%) |
| Business & Financial | 32 (39.5%) | 49 (60.5%) |
| Computers, Engineering & Science | 32 (60.4%) | 21 (39.6%) |
| Computers & Mathematics | 16 (64.0%) | 9 (36.0%) |
| Architecture & Engineering | 4 (100.0%) | 0 (0.0%) |
| Life, Physical & Social Science | 12 (50.0%) | 12 (50.0%) |
| Community & Social Service | 37 (24.3%) | 115 (75.7%) |
| Education, Arts & Media | 11 (55.0%) | 9 (45.0%) |
| Legal Services & Support | 0 (0.0%) | 0 (0.0%) |
| Education Instruction & Library | 24 (21.4%) | 88 (78.6%) |
| Arts, Media & Entertainment | 2 (10.0%) | 18 (90.0%) |
| Health Diagnosing & Treating | 5 (3.9%) | 123 (96.1%) |
| Health Technologists | 3 (3.0%) | 96 (97.0%) |
| Total (Category) | 424 (48.6%) | 449 (51.4%) |
| Total (Overall) | 1,141 (55.7%) | 908 (44.3%) |
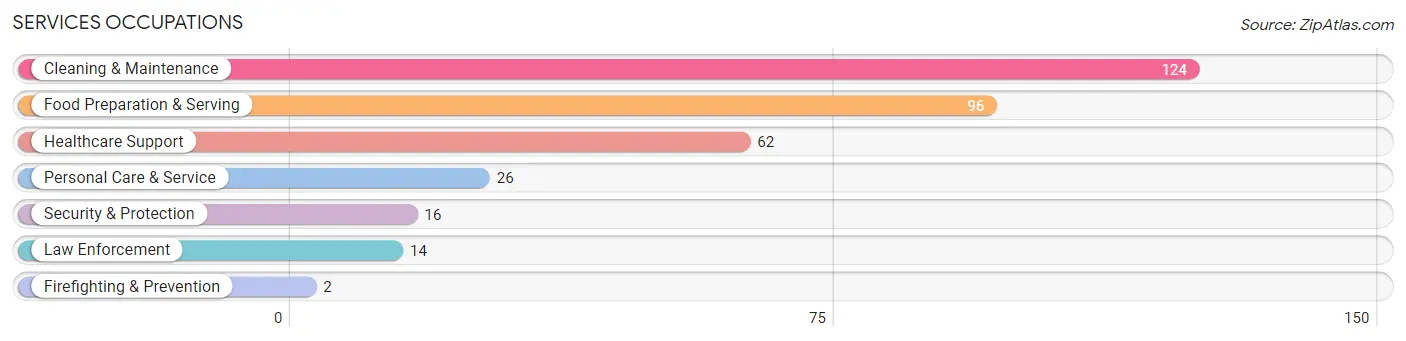
Services Occupations
The most common Services occupations in LaMoure County are Cleaning & Maintenance (124 | 6.0%), Food Preparation & Serving (96 | 4.7%), Healthcare Support (62 | 3.0%), Personal Care & Service (26 | 1.3%), and Security & Protection (16 | 0.8%).
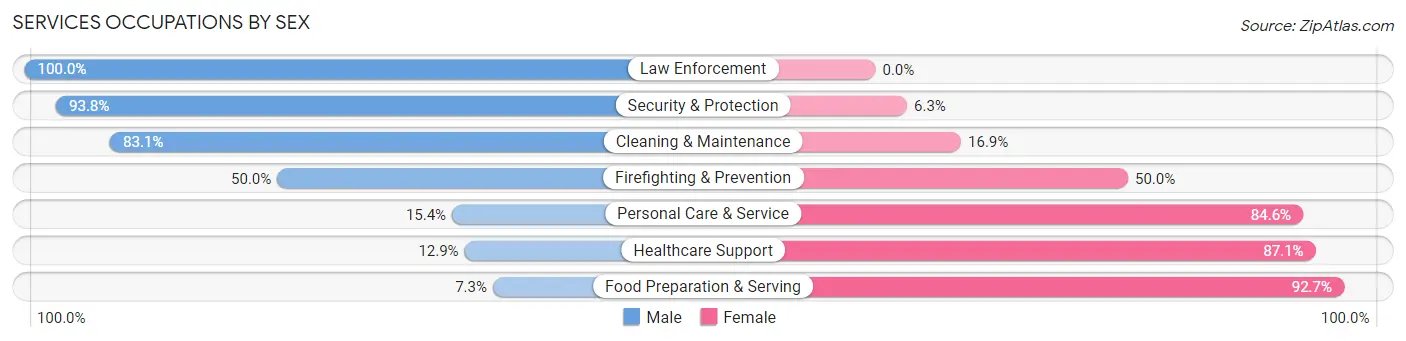
Services Occupations by Sex
Within the Services occupations in LaMoure County, the most male-oriented occupations are Law Enforcement (100.0%), Security & Protection (93.8%), and Cleaning & Maintenance (83.1%), while the most female-oriented occupations are Food Preparation & Serving (92.7%), Healthcare Support (87.1%), and Personal Care & Service (84.6%).
| Occupation | Male | Female |
| Healthcare Support | 8 (12.9%) | 54 (87.1%) |
| Security & Protection | 15 (93.8%) | 1 (6.2%) |
| Firefighting & Prevention | 1 (50.0%) | 1 (50.0%) |
| Law Enforcement | 14 (100.0%) | 0 (0.0%) |
| Food Preparation & Serving | 7 (7.3%) | 89 (92.7%) |
| Cleaning & Maintenance | 103 (83.1%) | 21 (16.9%) |
| Personal Care & Service | 4 (15.4%) | 22 (84.6%) |
| Total (Category) | 137 (42.3%) | 187 (57.7%) |
| Total (Overall) | 1,141 (55.7%) | 908 (44.3%) |
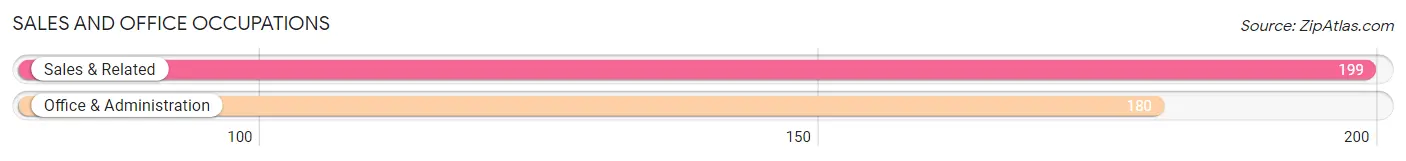
Sales and Office Occupations
The most common Sales and Office occupations in LaMoure County are Sales & Related (199 | 9.7%), and Office & Administration (180 | 8.8%).
Sales and Office Occupations by Sex
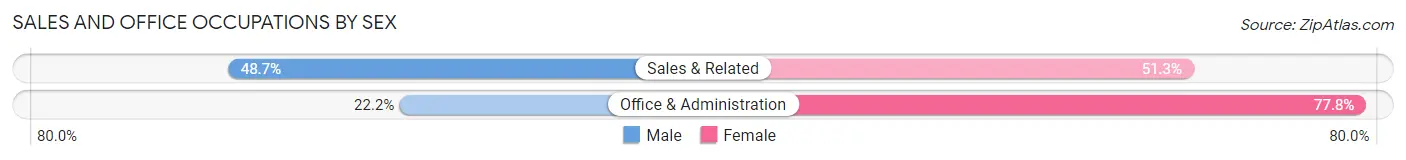
| Occupation | Male | Female |
| Sales & Related | 97 (48.7%) | 102 (51.3%) |
| Office & Administration | 40 (22.2%) | 140 (77.8%) |
| Total (Category) | 137 (36.1%) | 242 (63.8%) |
| Total (Overall) | 1,141 (55.7%) | 908 (44.3%) |
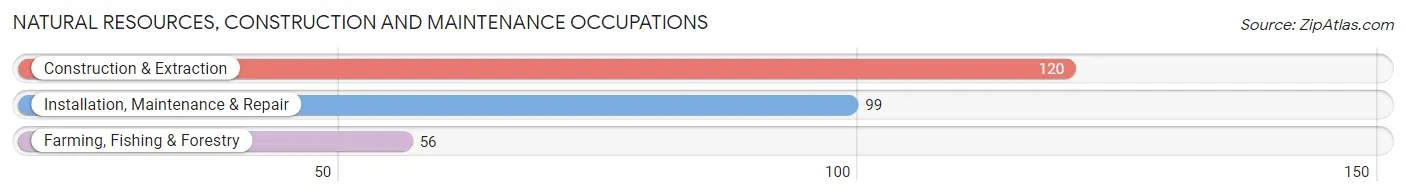
Natural Resources, Construction and Maintenance Occupations
The most common Natural Resources, Construction and Maintenance occupations in LaMoure County are Construction & Extraction (120 | 5.9%), Installation, Maintenance & Repair (99 | 4.8%), and Farming, Fishing & Forestry (56 | 2.7%).
Natural Resources, Construction and Maintenance Occupations by Sex
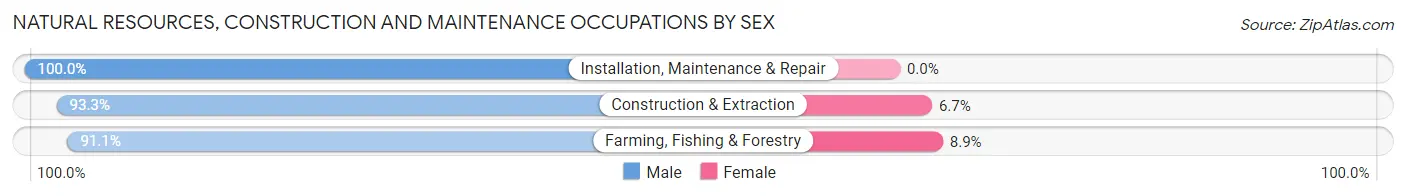
| Occupation | Male | Female |
| Farming, Fishing & Forestry | 51 (91.1%) | 5 (8.9%) |
| Construction & Extraction | 112 (93.3%) | 8 (6.7%) |
| Installation, Maintenance & Repair | 99 (100.0%) | 0 (0.0%) |
| Total (Category) | 262 (95.3%) | 13 (4.7%) |
| Total (Overall) | 1,141 (55.7%) | 908 (44.3%) |
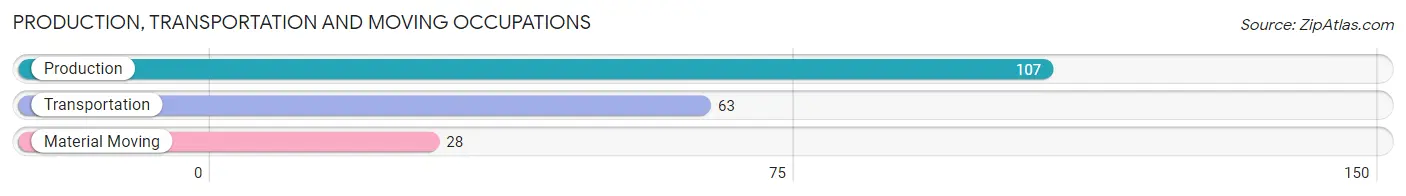
Production, Transportation and Moving Occupations
The most common Production, Transportation and Moving occupations in LaMoure County are Production (107 | 5.2%), Transportation (63 | 3.1%), and Material Moving (28 | 1.4%).
Production, Transportation and Moving Occupations by Sex
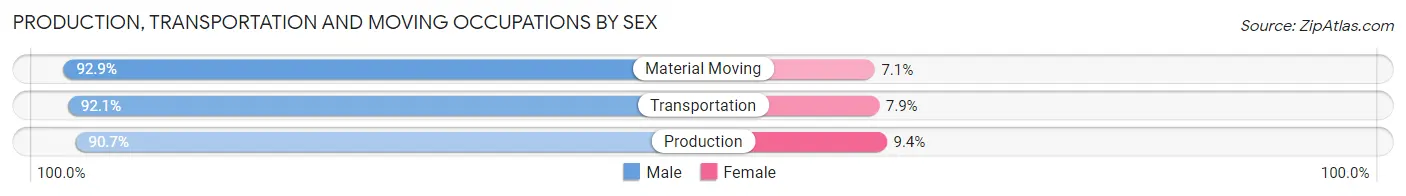
| Occupation | Male | Female |
| Production | 97 (90.6%) | 10 (9.3%) |
| Transportation | 58 (92.1%) | 5 (7.9%) |
| Material Moving | 26 (92.9%) | 2 (7.1%) |
| Total (Category) | 181 (91.4%) | 17 (8.6%) |
| Total (Overall) | 1,141 (55.7%) | 908 (44.3%) |
Employment Industries by Sex in LaMoure County
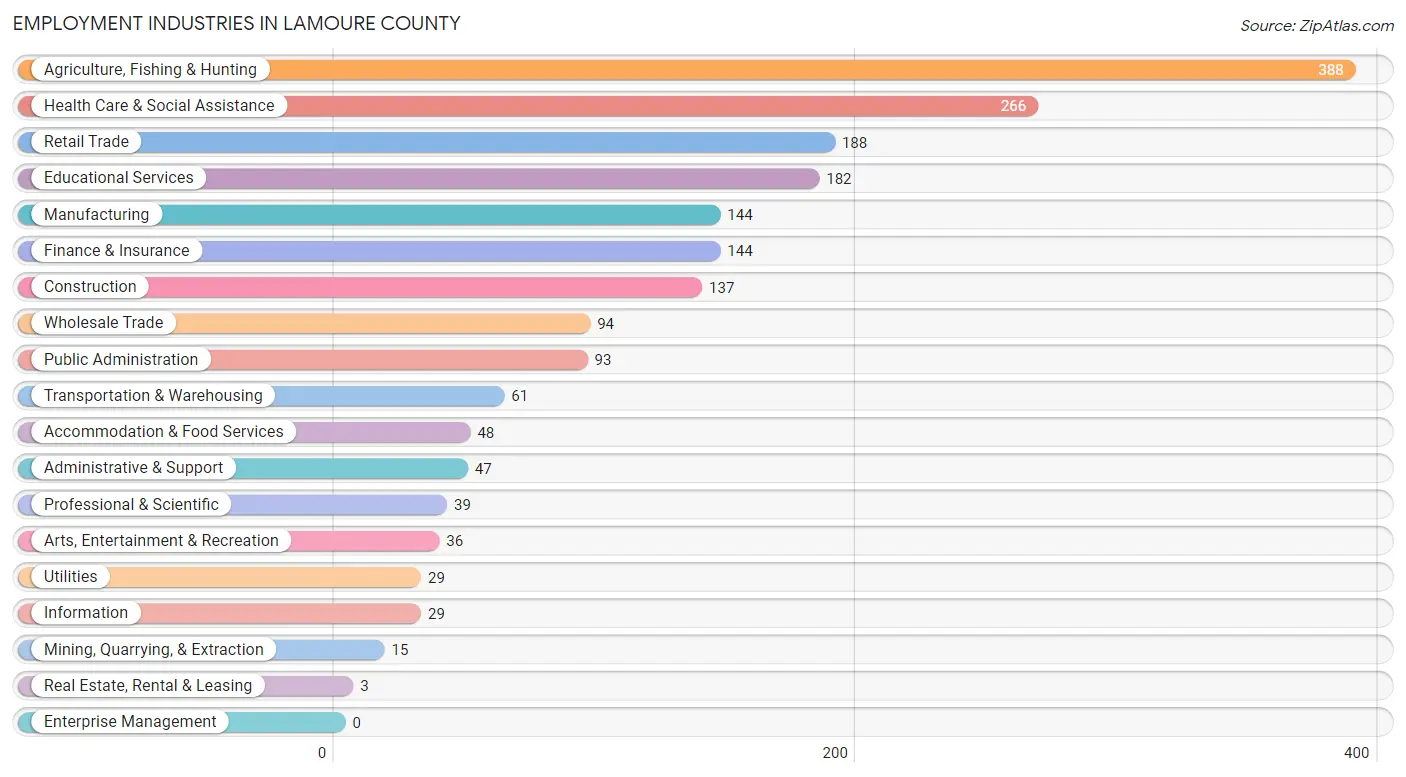
Employment Industries in LaMoure County
The major employment industries in LaMoure County include Agriculture, Fishing & Hunting (388 | 18.9%), Health Care & Social Assistance (266 | 13.0%), Retail Trade (188 | 9.2%), Educational Services (182 | 8.9%), and Manufacturing (144 | 7.0%).
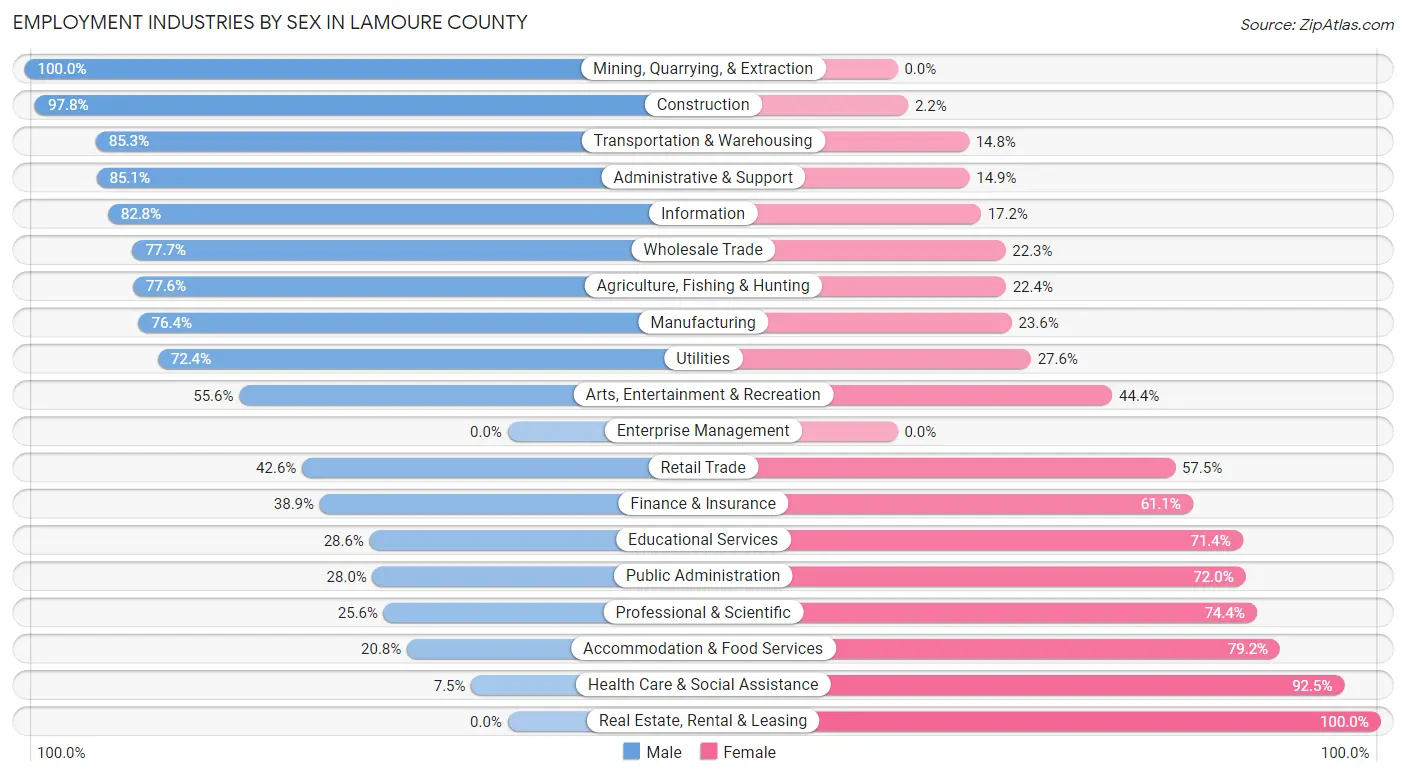
Employment Industries by Sex in LaMoure County
The LaMoure County industries that see more men than women are Mining, Quarrying, & Extraction (100.0%), Construction (97.8%), and Transportation & Warehousing (85.3%), whereas the industries that tend to have a higher number of women are Real Estate, Rental & Leasing (100.0%), Health Care & Social Assistance (92.5%), and Accommodation & Food Services (79.2%).
| Industry | Male | Female |
| Agriculture, Fishing & Hunting | 301 (77.6%) | 87 (22.4%) |
| Mining, Quarrying, & Extraction | 15 (100.0%) | 0 (0.0%) |
| Construction | 134 (97.8%) | 3 (2.2%) |
| Manufacturing | 110 (76.4%) | 34 (23.6%) |
| Wholesale Trade | 73 (77.7%) | 21 (22.3%) |
| Retail Trade | 80 (42.5%) | 108 (57.5%) |
| Transportation & Warehousing | 52 (85.3%) | 9 (14.7%) |
| Utilities | 21 (72.4%) | 8 (27.6%) |
| Information | 24 (82.8%) | 5 (17.2%) |
| Finance & Insurance | 56 (38.9%) | 88 (61.1%) |
| Real Estate, Rental & Leasing | 0 (0.0%) | 3 (100.0%) |
| Professional & Scientific | 10 (25.6%) | 29 (74.4%) |
| Enterprise Management | 0 (0.0%) | 0 (0.0%) |
| Administrative & Support | 40 (85.1%) | 7 (14.9%) |
| Educational Services | 52 (28.6%) | 130 (71.4%) |
| Health Care & Social Assistance | 20 (7.5%) | 246 (92.5%) |
| Arts, Entertainment & Recreation | 20 (55.6%) | 16 (44.4%) |
| Accommodation & Food Services | 10 (20.8%) | 38 (79.2%) |
| Public Administration | 26 (28.0%) | 67 (72.0%) |
| Total | 1,141 (55.7%) | 908 (44.3%) |
Education in LaMoure County
School Enrollment in LaMoure County
The most common levels of schooling among the 768 students in LaMoure County are middle school (212 | 27.6%), high school (185 | 24.1%), and elementary school (160 | 20.8%).
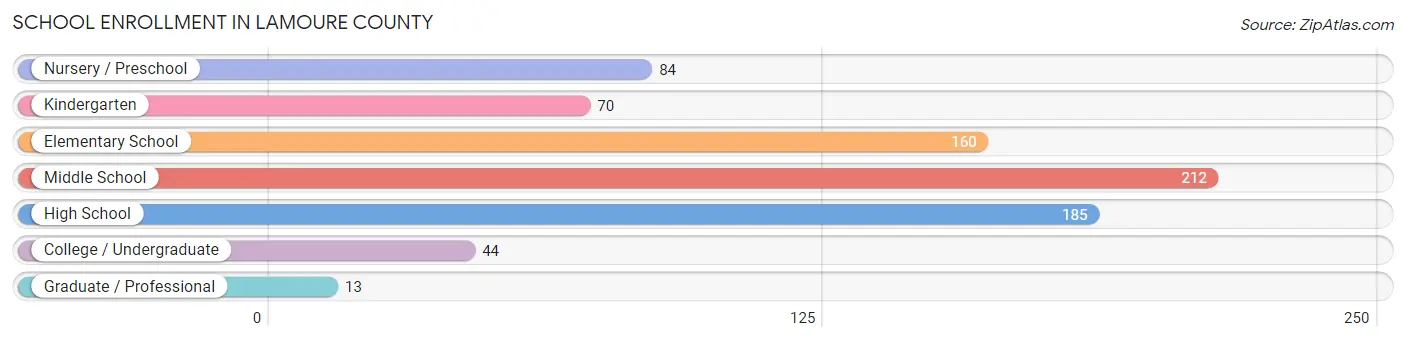
| School Level | # Students | % Students |
| Nursery / Preschool | 84 | 10.9% |
| Kindergarten | 70 | 9.1% |
| Elementary School | 160 | 20.8% |
| Middle School | 212 | 27.6% |
| High School | 185 | 24.1% |
| College / Undergraduate | 44 | 5.7% |
| Graduate / Professional | 13 | 1.7% |
| Total | 768 | 100.0% |
School Enrollment by Age by Funding Source in LaMoure County
Out of a total of 768 students who are enrolled in schools in LaMoure County, 116 (15.1%) attend a private institution, while the remaining 652 (84.9%) are enrolled in public schools. The age group of 25 to 34 year olds has the highest likelihood of being enrolled in private schools, with 15 (88.2% in the age bracket) enrolled. Conversely, the age group of 35 years and over has the lowest likelihood of being enrolled in a private school, with 13 (100.0% in the age bracket) attending a public institution.
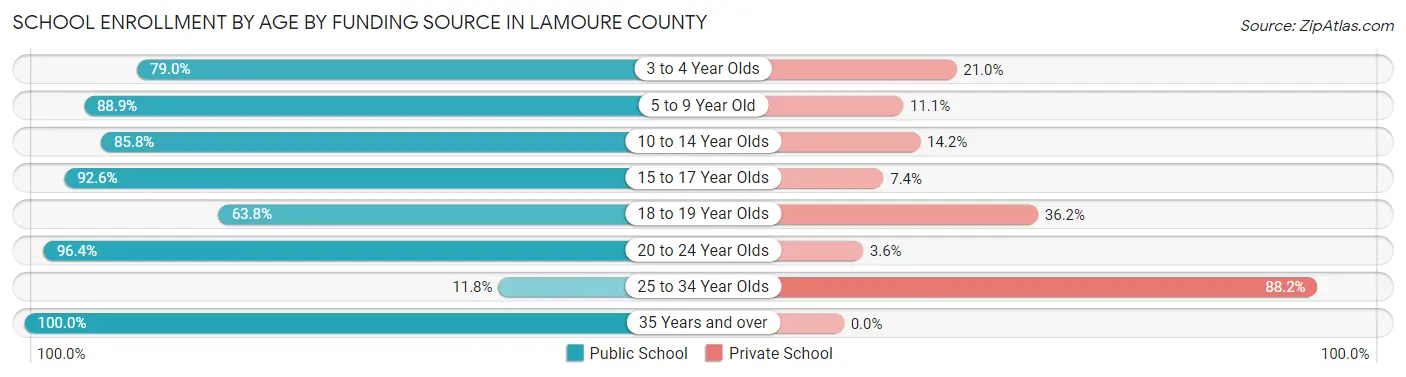
| Age Bracket | Public School | Private School |
| 3 to 4 Year Olds | 49 (79.0%) | 13 (21.0%) |
| 5 to 9 Year Old | 201 (88.9%) | 25 (11.1%) |
| 10 to 14 Year Olds | 217 (85.8%) | 36 (14.2%) |
| 15 to 17 Year Olds | 113 (92.6%) | 9 (7.4%) |
| 18 to 19 Year Olds | 30 (63.8%) | 17 (36.2%) |
| 20 to 24 Year Olds | 27 (96.4%) | 1 (3.6%) |
| 25 to 34 Year Olds | 2 (11.8%) | 15 (88.2%) |
| 35 Years and over | 13 (100.0%) | 0 (0.0%) |
| Total | 652 (84.9%) | 116 (15.1%) |
Educational Attainment by Field of Study in LaMoure County
Education (195 | 25.2%), bio, nature & agricultural (175 | 22.6%), business (111 | 14.3%), science & technology (105 | 13.6%), and social sciences (45 | 5.8%) are the most common fields of study among 774 individuals in LaMoure County who have obtained a bachelor's degree or higher.
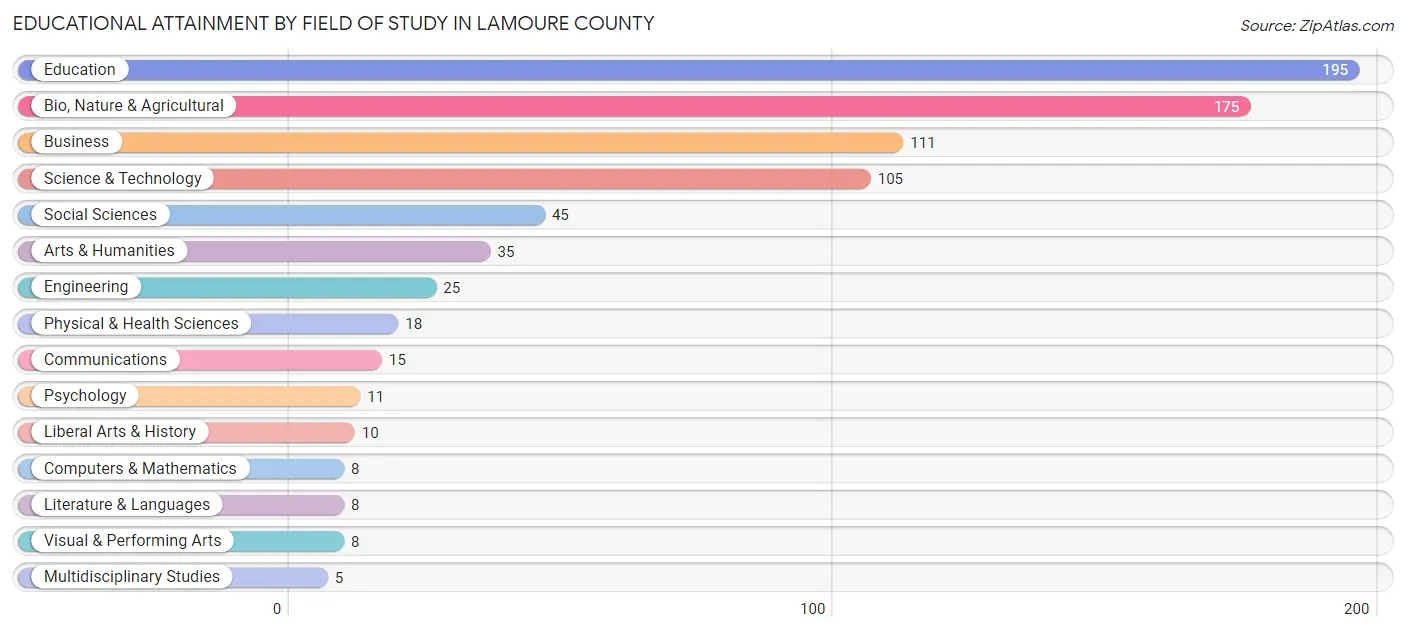
| Field of Study | # Graduates | % Graduates |
| Computers & Mathematics | 8 | 1.0% |
| Bio, Nature & Agricultural | 175 | 22.6% |
| Physical & Health Sciences | 18 | 2.3% |
| Psychology | 11 | 1.4% |
| Social Sciences | 45 | 5.8% |
| Engineering | 25 | 3.2% |
| Multidisciplinary Studies | 5 | 0.6% |
| Science & Technology | 105 | 13.6% |
| Business | 111 | 14.3% |
| Education | 195 | 25.2% |
| Literature & Languages | 8 | 1.0% |
| Liberal Arts & History | 10 | 1.3% |
| Visual & Performing Arts | 8 | 1.0% |
| Communications | 15 | 1.9% |
| Arts & Humanities | 35 | 4.5% |
| Total | 774 | 100.0% |
Transportation & Commute in LaMoure County
Vehicle Availability by Sex in LaMoure County
The most prevalent vehicle ownership categories in LaMoure County are males with 2 vehicles (332, accounting for 29.4%) and females with 2 vehicles (248, making up 38.3%).
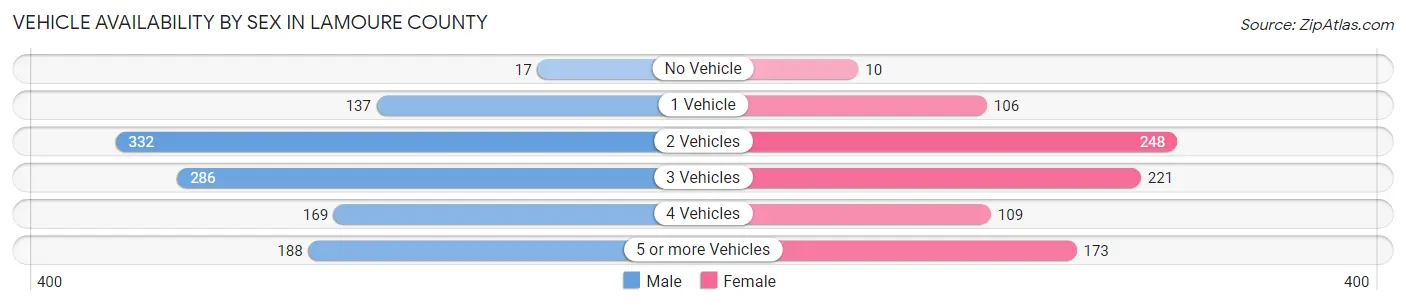
| Vehicles Available | Male | Female |
| No Vehicle | 17 (1.5%) | 10 (1.1%) |
| 1 Vehicle | 137 (12.1%) | 106 (12.2%) |
| 2 Vehicles | 332 (29.4%) | 248 (28.6%) |
| 3 Vehicles | 286 (25.3%) | 221 (25.5%) |
| 4 Vehicles | 169 (15.0%) | 109 (12.6%) |
| 5 or more Vehicles | 188 (16.7%) | 173 (20.0%) |
| Total | 1,129 (100.0%) | 867 (100.0%) |
Commute Time in LaMoure County
The most frequently occuring commute durations in LaMoure County are 5 to 9 minutes (405 commuters, 22.9%), less than 5 minutes (354 commuters, 20.1%), and 10 to 14 minutes (255 commuters, 14.4%).
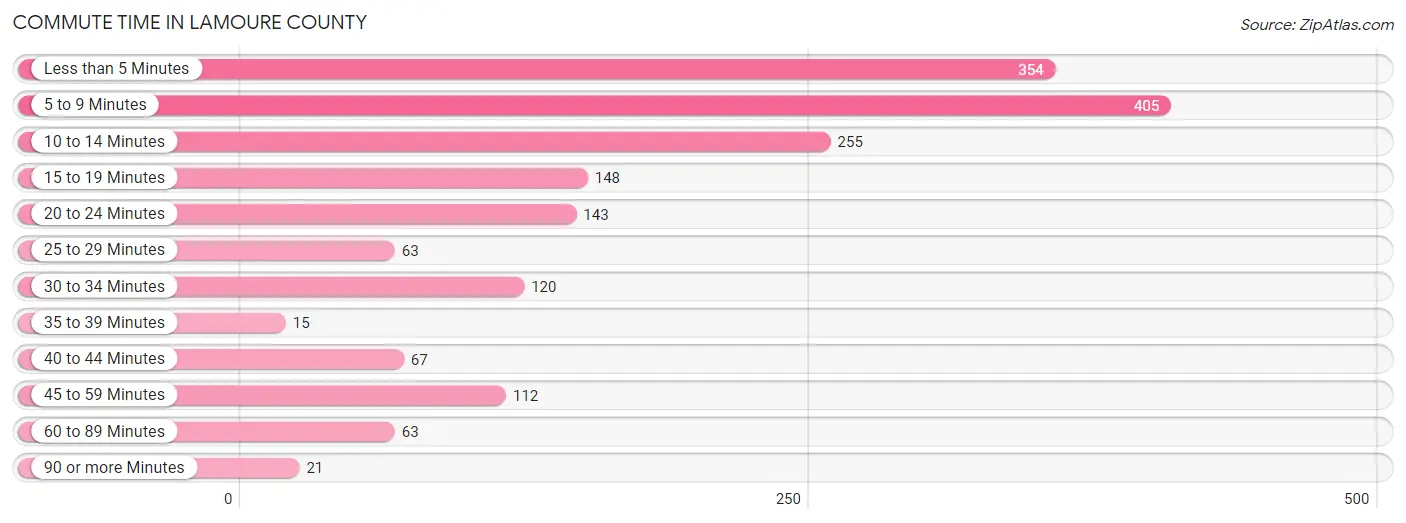
| Commute Time | # Commuters | % Commuters |
| Less than 5 Minutes | 354 | 20.1% |
| 5 to 9 Minutes | 405 | 22.9% |
| 10 to 14 Minutes | 255 | 14.4% |
| 15 to 19 Minutes | 148 | 8.4% |
| 20 to 24 Minutes | 143 | 8.1% |
| 25 to 29 Minutes | 63 | 3.6% |
| 30 to 34 Minutes | 120 | 6.8% |
| 35 to 39 Minutes | 15 | 0.9% |
| 40 to 44 Minutes | 67 | 3.8% |
| 45 to 59 Minutes | 112 | 6.3% |
| 60 to 89 Minutes | 63 | 3.6% |
| 90 or more Minutes | 21 | 1.2% |
Commute Time by Sex in LaMoure County
The most common commute times in LaMoure County are 10 to 14 minutes (194 commuters, 19.8%) for males and 5 to 9 minutes (235 commuters, 29.9%) for females.
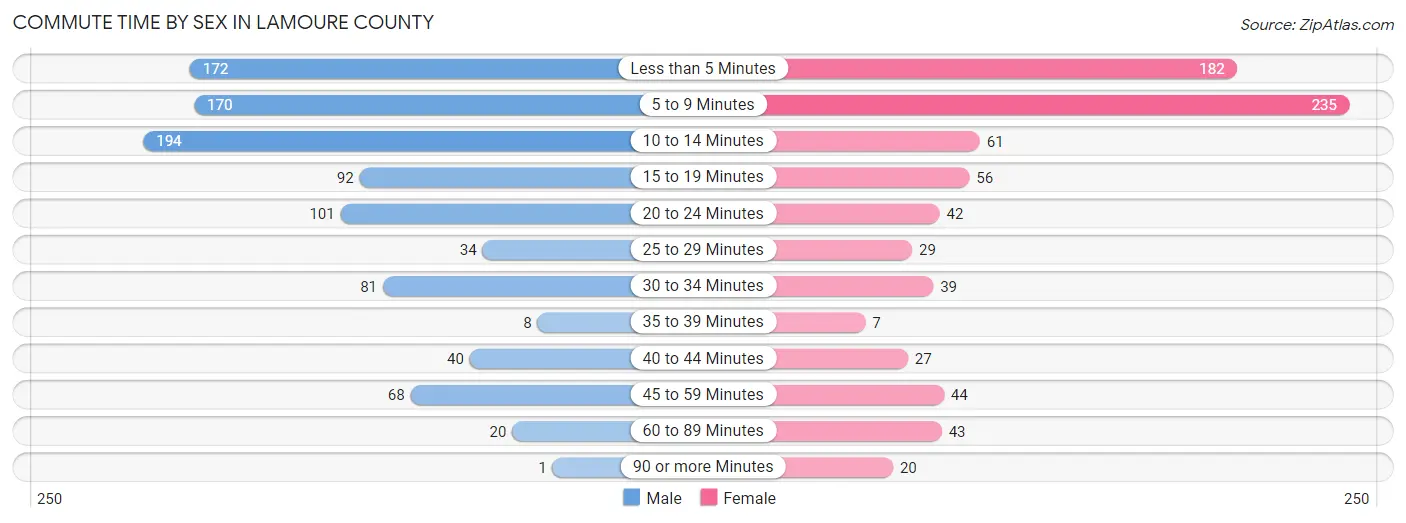
| Commute Time | Male | Female |
| Less than 5 Minutes | 172 (17.5%) | 182 (23.2%) |
| 5 to 9 Minutes | 170 (17.3%) | 235 (29.9%) |
| 10 to 14 Minutes | 194 (19.8%) | 61 (7.8%) |
| 15 to 19 Minutes | 92 (9.4%) | 56 (7.1%) |
| 20 to 24 Minutes | 101 (10.3%) | 42 (5.3%) |
| 25 to 29 Minutes | 34 (3.5%) | 29 (3.7%) |
| 30 to 34 Minutes | 81 (8.3%) | 39 (5.0%) |
| 35 to 39 Minutes | 8 (0.8%) | 7 (0.9%) |
| 40 to 44 Minutes | 40 (4.1%) | 27 (3.4%) |
| 45 to 59 Minutes | 68 (6.9%) | 44 (5.6%) |
| 60 to 89 Minutes | 20 (2.0%) | 43 (5.5%) |
| 90 or more Minutes | 1 (0.1%) | 20 (2.5%) |
Time of Departure to Work by Sex in LaMoure County
The most frequent times of departure to work in LaMoure County are 7:30 AM to 7:59 AM (230, 23.4%) for males and 7:30 AM to 7:59 AM (252, 32.1%) for females.
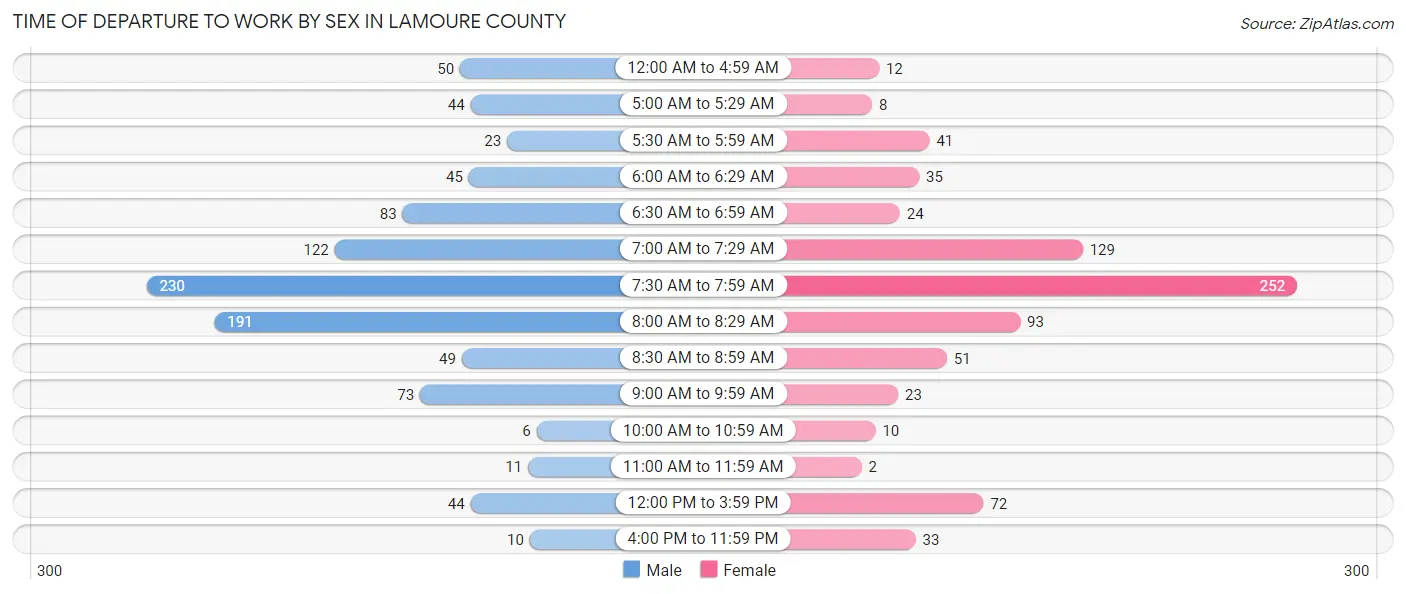
| Time of Departure | Male | Female |
| 12:00 AM to 4:59 AM | 50 (5.1%) | 12 (1.5%) |
| 5:00 AM to 5:29 AM | 44 (4.5%) | 8 (1.0%) |
| 5:30 AM to 5:59 AM | 23 (2.3%) | 41 (5.2%) |
| 6:00 AM to 6:29 AM | 45 (4.6%) | 35 (4.5%) |
| 6:30 AM to 6:59 AM | 83 (8.5%) | 24 (3.1%) |
| 7:00 AM to 7:29 AM | 122 (12.4%) | 129 (16.4%) |
| 7:30 AM to 7:59 AM | 230 (23.4%) | 252 (32.1%) |
| 8:00 AM to 8:29 AM | 191 (19.5%) | 93 (11.8%) |
| 8:30 AM to 8:59 AM | 49 (5.0%) | 51 (6.5%) |
| 9:00 AM to 9:59 AM | 73 (7.4%) | 23 (2.9%) |
| 10:00 AM to 10:59 AM | 6 (0.6%) | 10 (1.3%) |
| 11:00 AM to 11:59 AM | 11 (1.1%) | 2 (0.3%) |
| 12:00 PM to 3:59 PM | 44 (4.5%) | 72 (9.2%) |
| 4:00 PM to 11:59 PM | 10 (1.0%) | 33 (4.2%) |
| Total | 981 (100.0%) | 785 (100.0%) |
Housing Occupancy in LaMoure County
Occupancy by Ownership in LaMoure County
Of the total 1,698 dwellings in LaMoure County, owner-occupied units account for 1,433 (84.4%), while renter-occupied units make up 265 (15.6%).
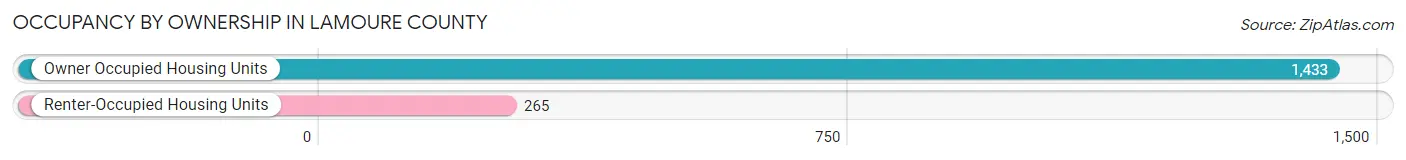
| Occupancy | # Housing Units | % Housing Units |
| Owner Occupied Housing Units | 1,433 | 84.4% |
| Renter-Occupied Housing Units | 265 | 15.6% |
| Total Occupied Housing Units | 1,698 | 100.0% |
Occupancy by Household Size in LaMoure County
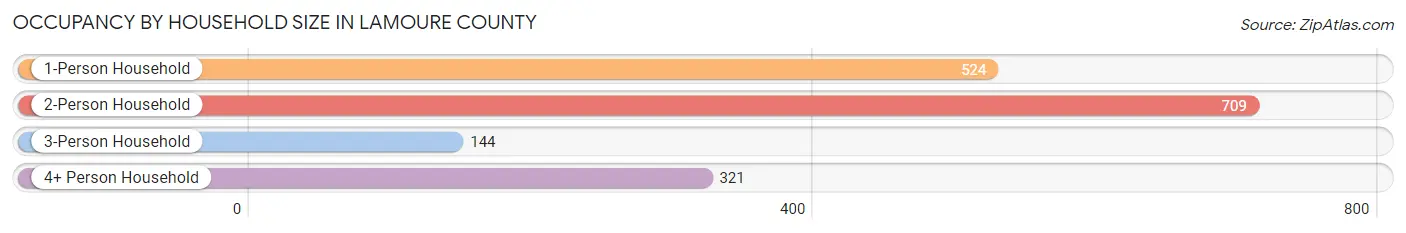
| Household Size | # Housing Units | % Housing Units |
| 1-Person Household | 524 | 30.9% |
| 2-Person Household | 709 | 41.8% |
| 3-Person Household | 144 | 8.5% |
| 4+ Person Household | 321 | 18.9% |
| Total Housing Units | 1,698 | 100.0% |
Occupancy by Ownership by Household Size in LaMoure County
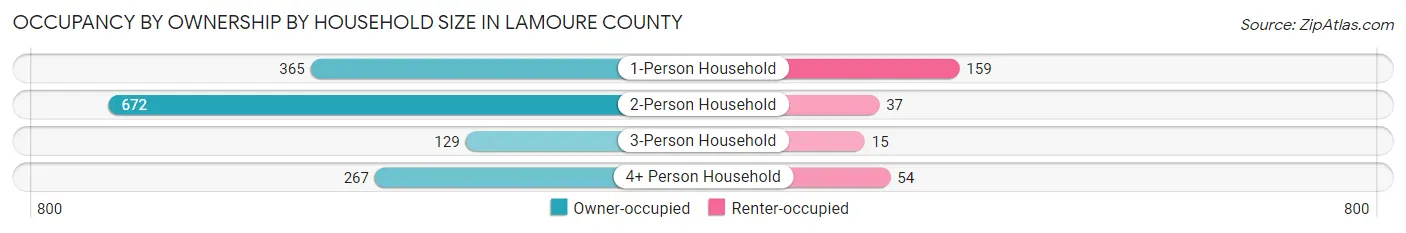
| Household Size | Owner-occupied | Renter-occupied |
| 1-Person Household | 365 (69.7%) | 159 (30.3%) |
| 2-Person Household | 672 (94.8%) | 37 (5.2%) |
| 3-Person Household | 129 (89.6%) | 15 (10.4%) |
| 4+ Person Household | 267 (83.2%) | 54 (16.8%) |
| Total Housing Units | 1,433 (84.4%) | 265 (15.6%) |
Occupancy by Educational Attainment in LaMoure County
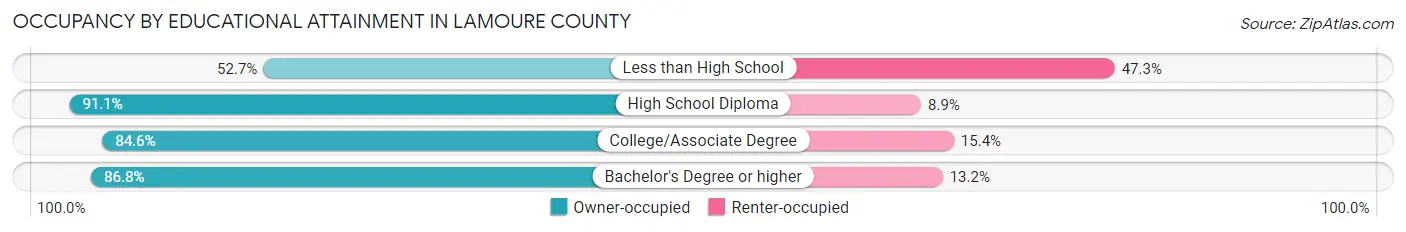
| Household Size | Owner-occupied | Renter-occupied |
| Less than High School | 78 (52.7%) | 70 (47.3%) |
| High School Diploma | 471 (91.1%) | 46 (8.9%) |
| College/Associate Degree | 483 (84.6%) | 88 (15.4%) |
| Bachelor's Degree or higher | 401 (86.8%) | 61 (13.2%) |
Occupancy by Age of Householder in LaMoure County
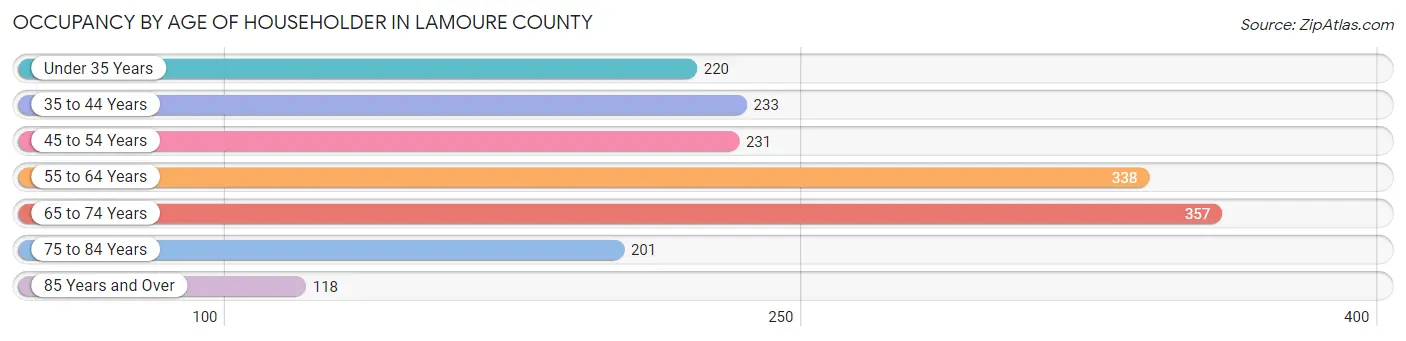
| Age Bracket | # Households | % Households |
| Under 35 Years | 220 | 13.0% |
| 35 to 44 Years | 233 | 13.7% |
| 45 to 54 Years | 231 | 13.6% |
| 55 to 64 Years | 338 | 19.9% |
| 65 to 74 Years | 357 | 21.0% |
| 75 to 84 Years | 201 | 11.8% |
| 85 Years and Over | 118 | 7.0% |
| Total | 1,698 | 100.0% |
Housing Finances in LaMoure County
Median Income by Occupancy in LaMoure County
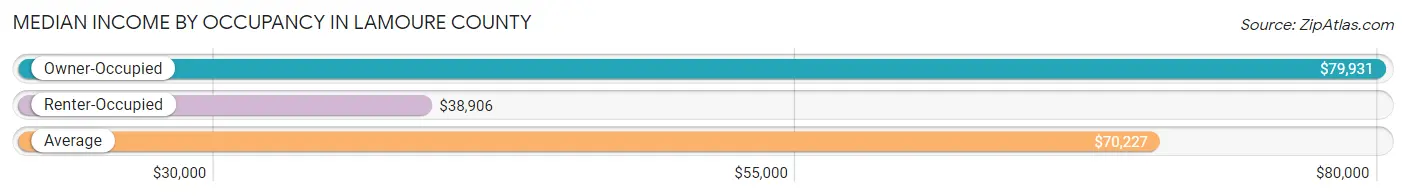
| Occupancy Type | # Households | Median Income |
| Owner-Occupied | 1,433 (84.4%) | $79,931 |
| Renter-Occupied | 265 (15.6%) | $38,906 |
| Average | 1,698 (100.0%) | $70,227 |
Occupancy by Householder Income Bracket in LaMoure County
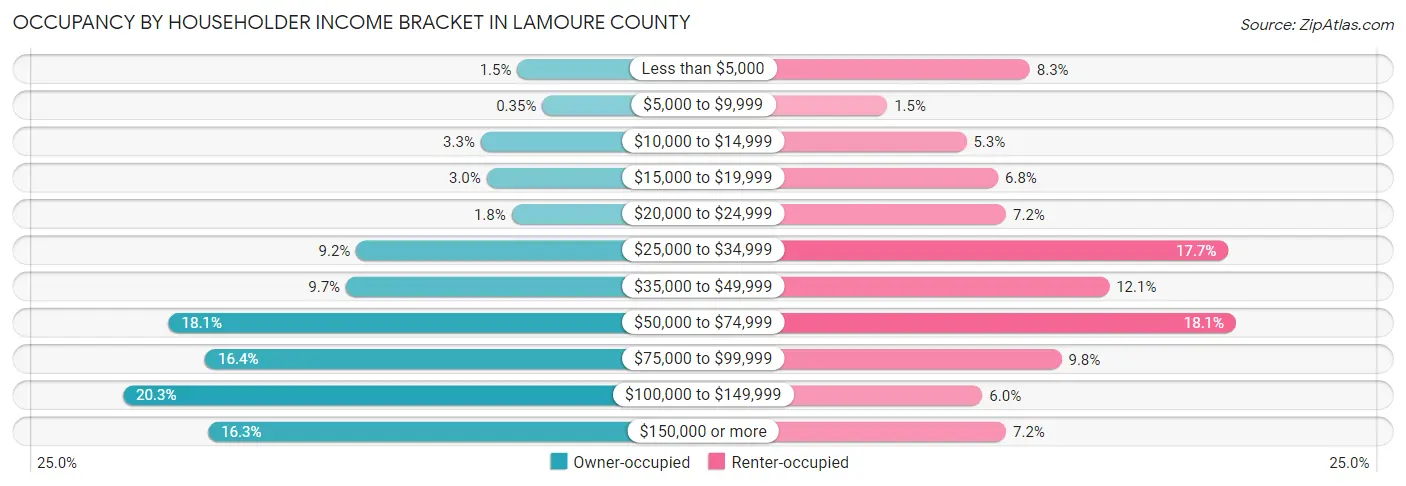
| Income Bracket | Owner-occupied | Renter-occupied |
| Less than $5,000 | 22 (1.5%) | 22 (8.3%) |
| $5,000 to $9,999 | 5 (0.4%) | 4 (1.5%) |
| $10,000 to $14,999 | 47 (3.3%) | 14 (5.3%) |
| $15,000 to $19,999 | 43 (3.0%) | 18 (6.8%) |
| $20,000 to $24,999 | 26 (1.8%) | 19 (7.2%) |
| $25,000 to $34,999 | 132 (9.2%) | 47 (17.7%) |
| $35,000 to $49,999 | 139 (9.7%) | 32 (12.1%) |
| $50,000 to $74,999 | 260 (18.1%) | 48 (18.1%) |
| $75,000 to $99,999 | 235 (16.4%) | 26 (9.8%) |
| $100,000 to $149,999 | 291 (20.3%) | 16 (6.0%) |
| $150,000 or more | 233 (16.3%) | 19 (7.2%) |
| Total | 1,433 (100.0%) | 265 (100.0%) |
Monthly Housing Cost Tiers in LaMoure County
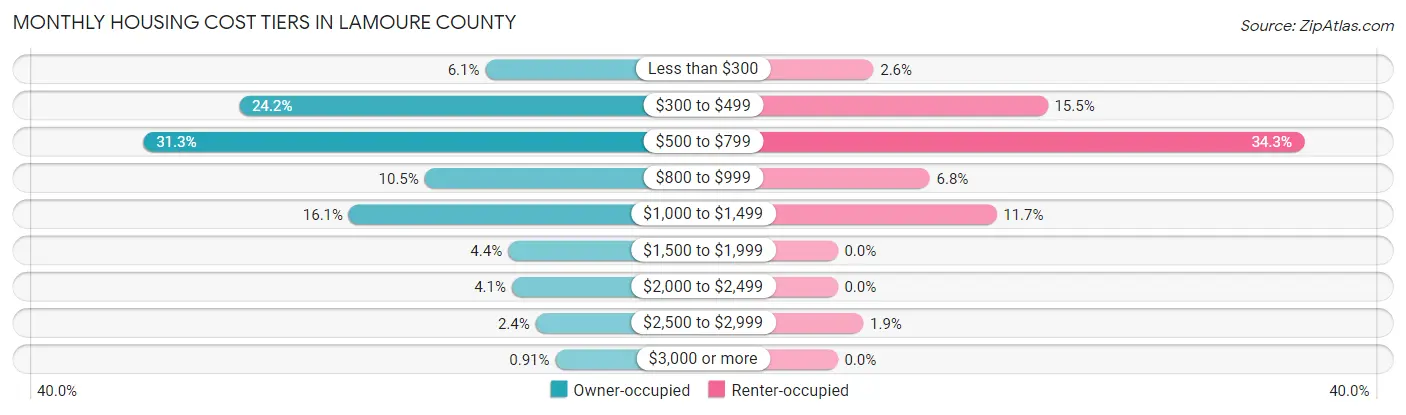
| Monthly Cost | Owner-occupied | Renter-occupied |
| Less than $300 | 87 (6.1%) | 7 (2.6%) |
| $300 to $499 | 347 (24.2%) | 41 (15.5%) |
| $500 to $799 | 448 (31.3%) | 91 (34.3%) |
| $800 to $999 | 151 (10.5%) | 18 (6.8%) |
| $1,000 to $1,499 | 231 (16.1%) | 31 (11.7%) |
| $1,500 to $1,999 | 63 (4.4%) | 0 (0.0%) |
| $2,000 to $2,499 | 59 (4.1%) | 0 (0.0%) |
| $2,500 to $2,999 | 34 (2.4%) | 5 (1.9%) |
| $3,000 or more | 13 (0.9%) | 0 (0.0%) |
| Total | 1,433 (100.0%) | 265 (100.0%) |
Physical Housing Characteristics in LaMoure County
Housing Structures in LaMoure County
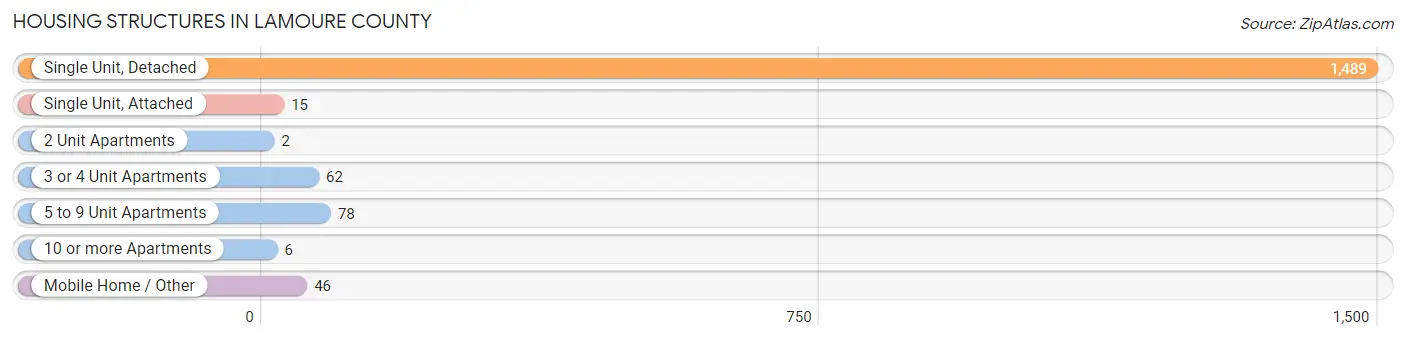
| Structure Type | # Housing Units | % Housing Units |
| Single Unit, Detached | 1,489 | 87.7% |
| Single Unit, Attached | 15 | 0.9% |
| 2 Unit Apartments | 2 | 0.1% |
| 3 or 4 Unit Apartments | 62 | 3.6% |
| 5 to 9 Unit Apartments | 78 | 4.6% |
| 10 or more Apartments | 6 | 0.4% |
| Mobile Home / Other | 46 | 2.7% |
| Total | 1,698 | 100.0% |
Housing Structures by Occupancy in LaMoure County
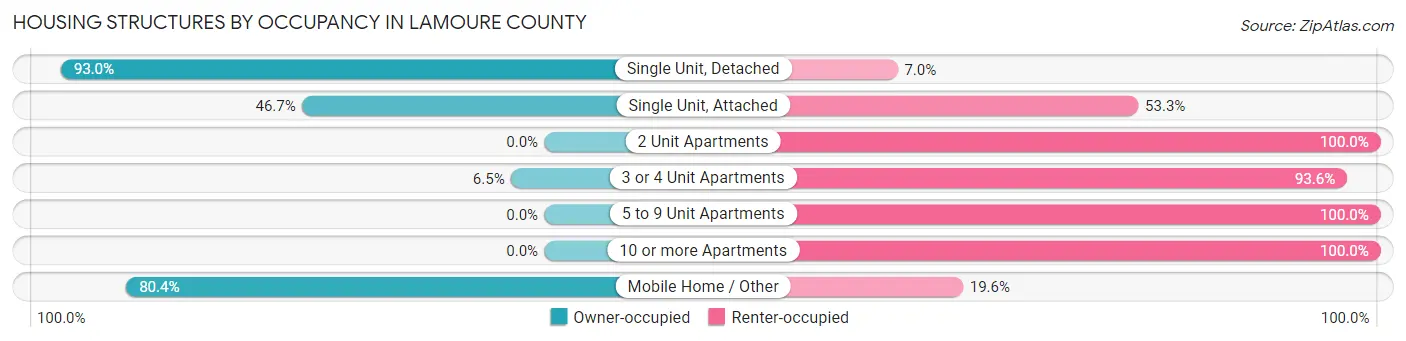
| Structure Type | Owner-occupied | Renter-occupied |
| Single Unit, Detached | 1,385 (93.0%) | 104 (7.0%) |
| Single Unit, Attached | 7 (46.7%) | 8 (53.3%) |
| 2 Unit Apartments | 0 (0.0%) | 2 (100.0%) |
| 3 or 4 Unit Apartments | 4 (6.5%) | 58 (93.5%) |
| 5 to 9 Unit Apartments | 0 (0.0%) | 78 (100.0%) |
| 10 or more Apartments | 0 (0.0%) | 6 (100.0%) |
| Mobile Home / Other | 37 (80.4%) | 9 (19.6%) |
| Total | 1,433 (84.4%) | 265 (15.6%) |
Housing Structures by Number of Rooms in LaMoure County
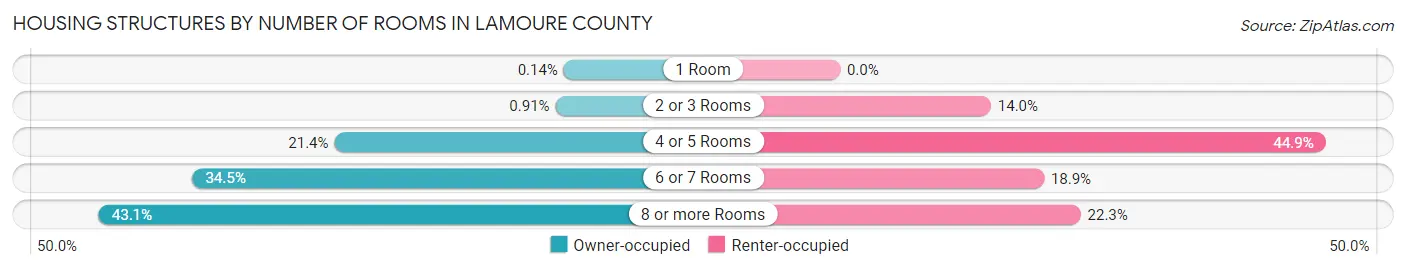
| Number of Rooms | Owner-occupied | Renter-occupied |
| 1 Room | 2 (0.1%) | 0 (0.0%) |
| 2 or 3 Rooms | 13 (0.9%) | 37 (14.0%) |
| 4 or 5 Rooms | 306 (21.3%) | 119 (44.9%) |
| 6 or 7 Rooms | 494 (34.5%) | 50 (18.9%) |
| 8 or more Rooms | 618 (43.1%) | 59 (22.3%) |
| Total | 1,433 (100.0%) | 265 (100.0%) |
Housing Structure by Heating Type in LaMoure County
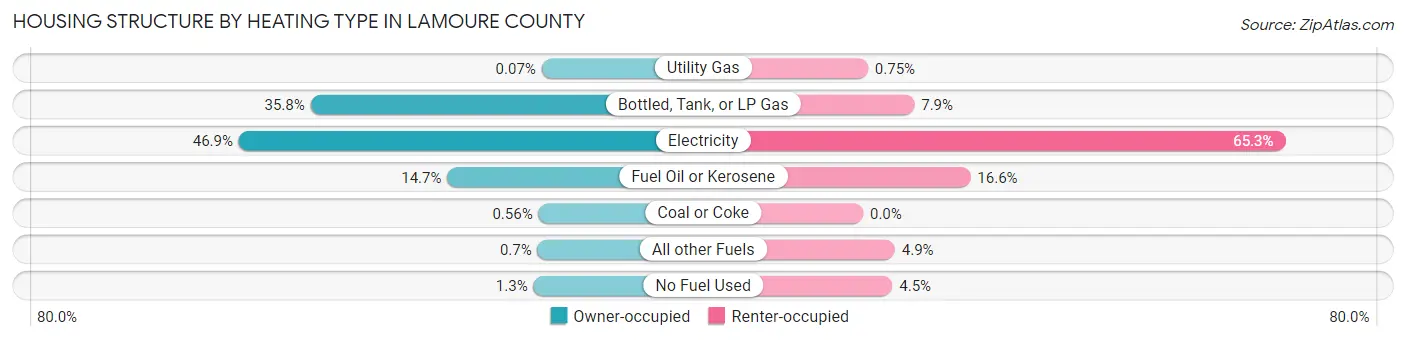
| Heating Type | Owner-occupied | Renter-occupied |
| Utility Gas | 1 (0.1%) | 2 (0.7%) |
| Bottled, Tank, or LP Gas | 513 (35.8%) | 21 (7.9%) |
| Electricity | 672 (46.9%) | 173 (65.3%) |
| Fuel Oil or Kerosene | 210 (14.6%) | 44 (16.6%) |
| Coal or Coke | 8 (0.6%) | 0 (0.0%) |
| All other Fuels | 10 (0.7%) | 13 (4.9%) |
| No Fuel Used | 19 (1.3%) | 12 (4.5%) |
| Total | 1,433 (100.0%) | 265 (100.0%) |
Household Vehicle Usage in LaMoure County
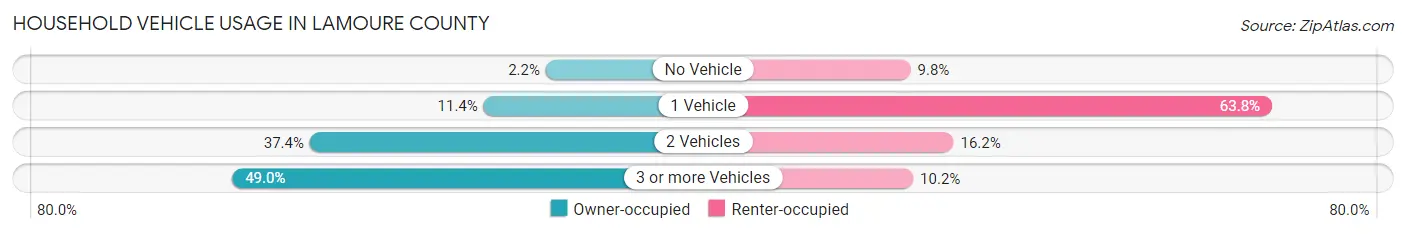
| Vehicles per Household | Owner-occupied | Renter-occupied |
| No Vehicle | 31 (2.2%) | 26 (9.8%) |
| 1 Vehicle | 164 (11.4%) | 169 (63.8%) |
| 2 Vehicles | 536 (37.4%) | 43 (16.2%) |
| 3 or more Vehicles | 702 (49.0%) | 27 (10.2%) |
| Total | 1,433 (100.0%) | 265 (100.0%) |
Real Estate & Mortgages in LaMoure County
Real Estate and Mortgage Overview in LaMoure County
| Characteristic | Without Mortgage | With Mortgage |
| Housing Units | 965 | 468 |
| Median Property Value | $109,200 | $132,200 |
| Median Household Income | $68,203 | $100 |
| Monthly Housing Costs | $527 | $13 |
| Real Estate Taxes | $1,124 | $30 |
Property Value by Mortgage Status in LaMoure County
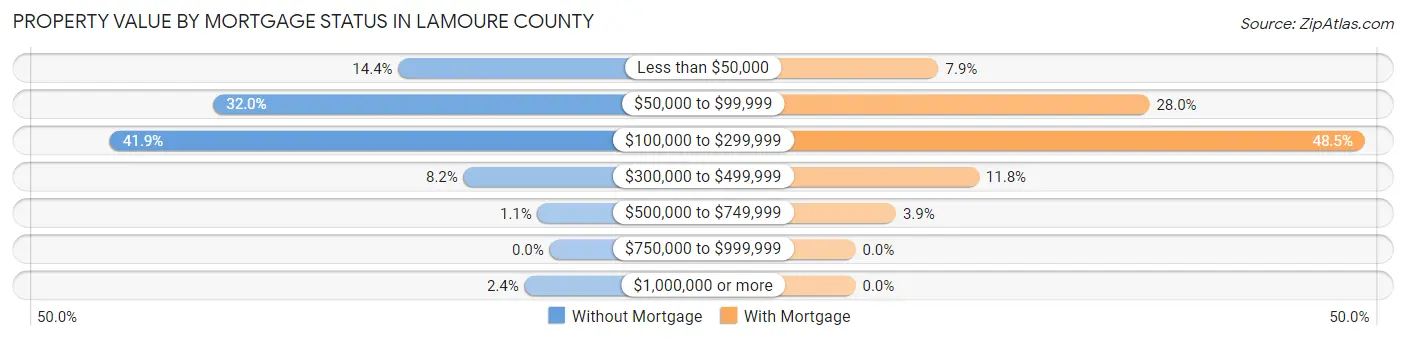
| Property Value | Without Mortgage | With Mortgage |
| Less than $50,000 | 139 (14.4%) | 37 (7.9%) |
| $50,000 to $99,999 | 309 (32.0%) | 131 (28.0%) |
| $100,000 to $299,999 | 404 (41.9%) | 227 (48.5%) |
| $300,000 to $499,999 | 79 (8.2%) | 55 (11.7%) |
| $500,000 to $749,999 | 11 (1.1%) | 18 (3.8%) |
| $750,000 to $999,999 | 0 (0.0%) | 0 (0.0%) |
| $1,000,000 or more | 23 (2.4%) | 0 (0.0%) |
| Total | 965 (100.0%) | 468 (100.0%) |
Household Income by Mortgage Status in LaMoure County
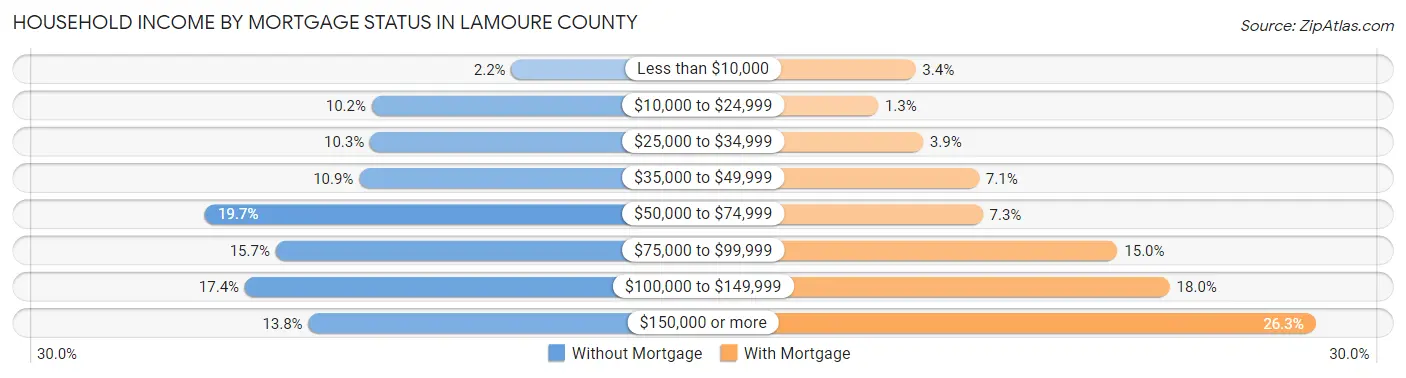
| Household Income | Without Mortgage | With Mortgage |
| Less than $10,000 | 21 (2.2%) | 16 (3.4%) |
| $10,000 to $24,999 | 98 (10.2%) | 6 (1.3%) |
| $25,000 to $34,999 | 99 (10.3%) | 18 (3.8%) |
| $35,000 to $49,999 | 105 (10.9%) | 33 (7.0%) |
| $50,000 to $74,999 | 190 (19.7%) | 34 (7.3%) |
| $75,000 to $99,999 | 151 (15.7%) | 70 (15.0%) |
| $100,000 to $149,999 | 168 (17.4%) | 84 (17.9%) |
| $150,000 or more | 133 (13.8%) | 123 (26.3%) |
| Total | 965 (100.0%) | 468 (100.0%) |
Property Value to Household Income Ratio in LaMoure County
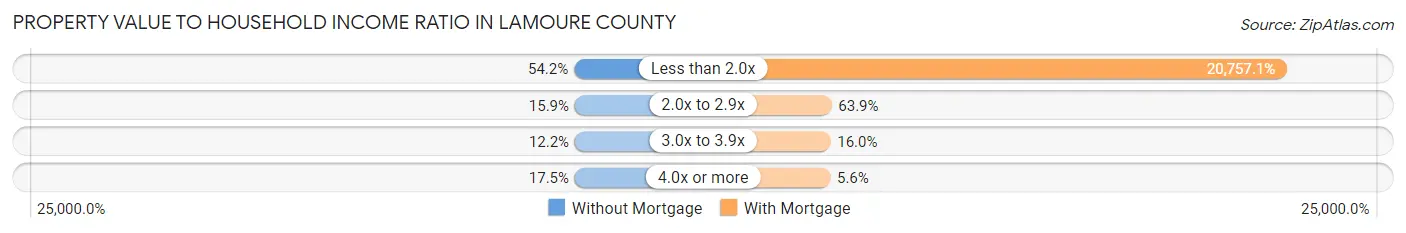
| Value-to-Income Ratio | Without Mortgage | With Mortgage |
| Less than 2.0x | 523 (54.2%) | 97,143 (20,757.1%) |
| 2.0x to 2.9x | 153 (15.9%) | 299 (63.9%) |
| 3.0x to 3.9x | 118 (12.2%) | 75 (16.0%) |
| 4.0x or more | 169 (17.5%) | 26 (5.6%) |
| Total | 965 (100.0%) | 468 (100.0%) |
Real Estate Taxes by Mortgage Status in LaMoure County
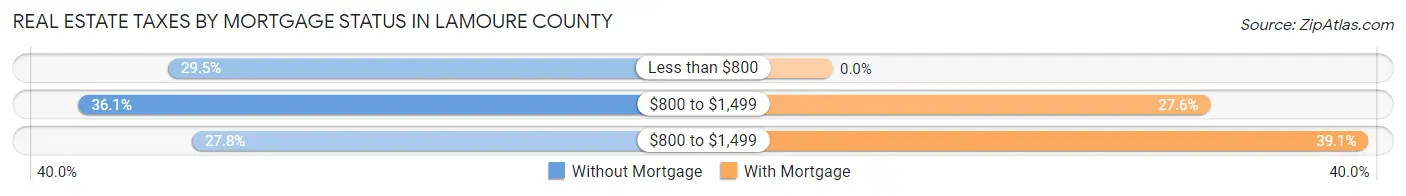
| Property Taxes | Without Mortgage | With Mortgage |
| Less than $800 | 285 (29.5%) | 0 (0.0%) |
| $800 to $1,499 | 348 (36.1%) | 129 (27.6%) |
| $800 to $1,499 | 268 (27.8%) | 183 (39.1%) |
| Total | 965 (100.0%) | 468 (100.0%) |
Health & Disability in LaMoure County
Health Insurance Coverage by Age in LaMoure County
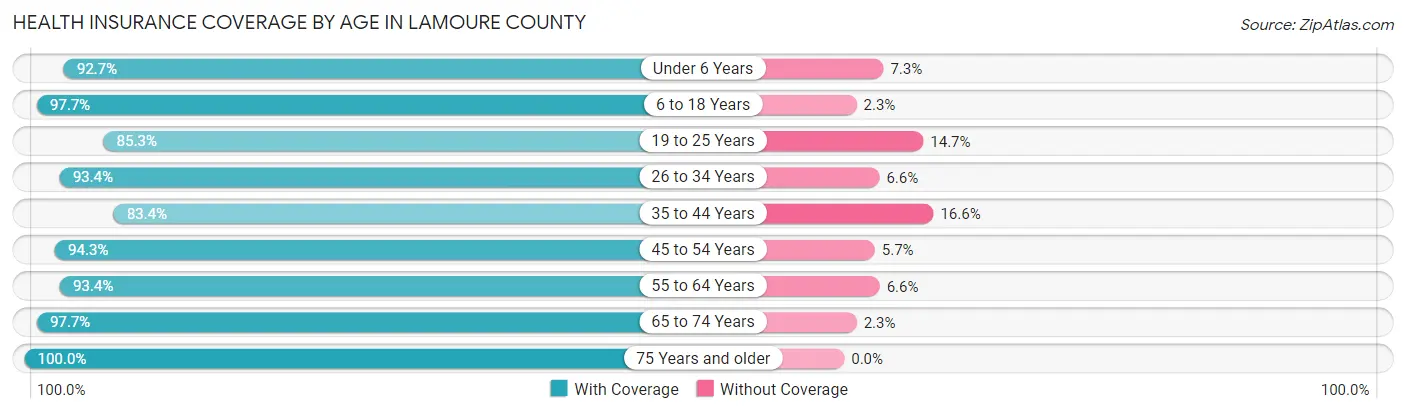
| Age Bracket | With Coverage | Without Coverage |
| Under 6 Years | 317 (92.7%) | 25 (7.3%) |
| 6 to 18 Years | 595 (97.7%) | 14 (2.3%) |
| 19 to 25 Years | 214 (85.3%) | 37 (14.7%) |
| 26 to 34 Years | 356 (93.4%) | 25 (6.6%) |
| 35 to 44 Years | 371 (83.4%) | 74 (16.6%) |
| 45 to 54 Years | 364 (94.3%) | 22 (5.7%) |
| 55 to 64 Years | 566 (93.4%) | 40 (6.6%) |
| 65 to 74 Years | 550 (97.7%) | 13 (2.3%) |
| 75 Years and older | 475 (100.0%) | 0 (0.0%) |
| Total | 3,808 (93.8%) | 250 (6.2%) |
Health Insurance Coverage by Citizenship Status in LaMoure County
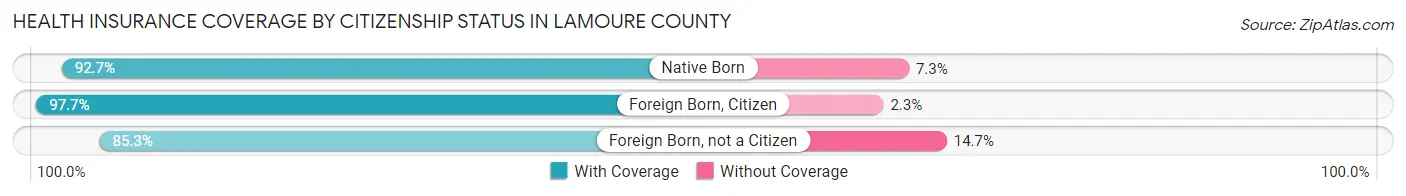
| Citizenship Status | With Coverage | Without Coverage |
| Native Born | 317 (92.7%) | 25 (7.3%) |
| Foreign Born, Citizen | 595 (97.7%) | 14 (2.3%) |
| Foreign Born, not a Citizen | 214 (85.3%) | 37 (14.7%) |
Health Insurance Coverage by Household Income in LaMoure County
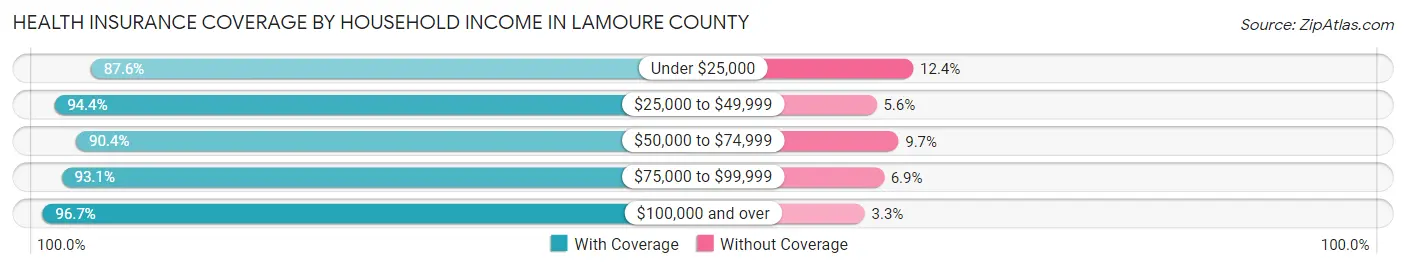
| Household Income | With Coverage | Without Coverage |
| Under $25,000 | 296 (87.6%) | 42 (12.4%) |
| $25,000 to $49,999 | 611 (94.4%) | 36 (5.6%) |
| $50,000 to $74,999 | 693 (90.3%) | 74 (9.7%) |
| $75,000 to $99,999 | 605 (93.1%) | 45 (6.9%) |
| $100,000 and over | 1,532 (96.7%) | 53 (3.3%) |
Public vs Private Health Insurance Coverage by Age in LaMoure County
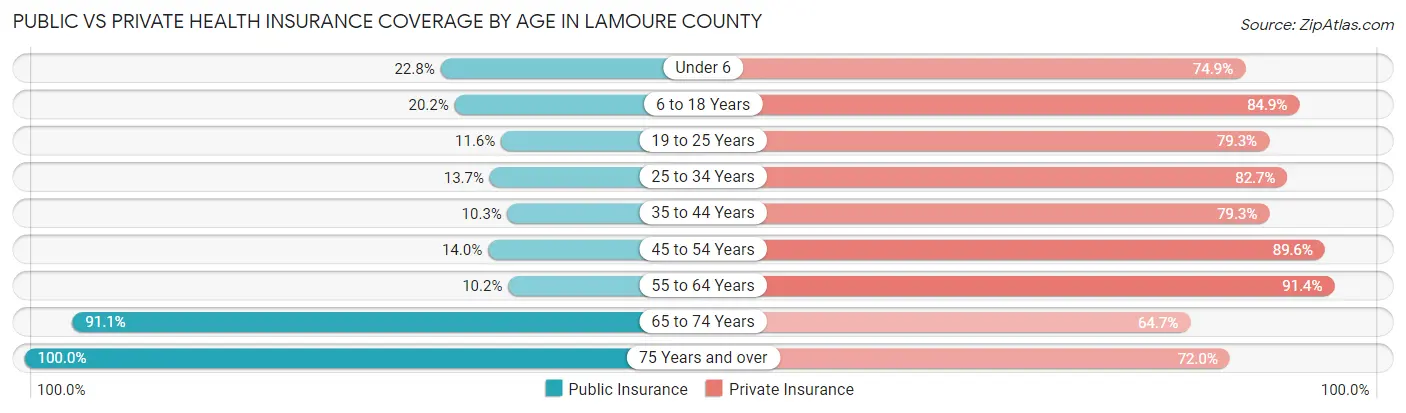
| Age Bracket | Public Insurance | Private Insurance |
| Under 6 | 78 (22.8%) | 256 (74.9%) |
| 6 to 18 Years | 123 (20.2%) | 517 (84.9%) |
| 19 to 25 Years | 29 (11.6%) | 199 (79.3%) |
| 25 to 34 Years | 52 (13.7%) | 315 (82.7%) |
| 35 to 44 Years | 46 (10.3%) | 353 (79.3%) |
| 45 to 54 Years | 54 (14.0%) | 346 (89.6%) |
| 55 to 64 Years | 62 (10.2%) | 554 (91.4%) |
| 65 to 74 Years | 513 (91.1%) | 364 (64.6%) |
| 75 Years and over | 475 (100.0%) | 342 (72.0%) |
| Total | 1,432 (35.3%) | 3,246 (80.0%) |
Disability Status by Sex by Age in LaMoure County
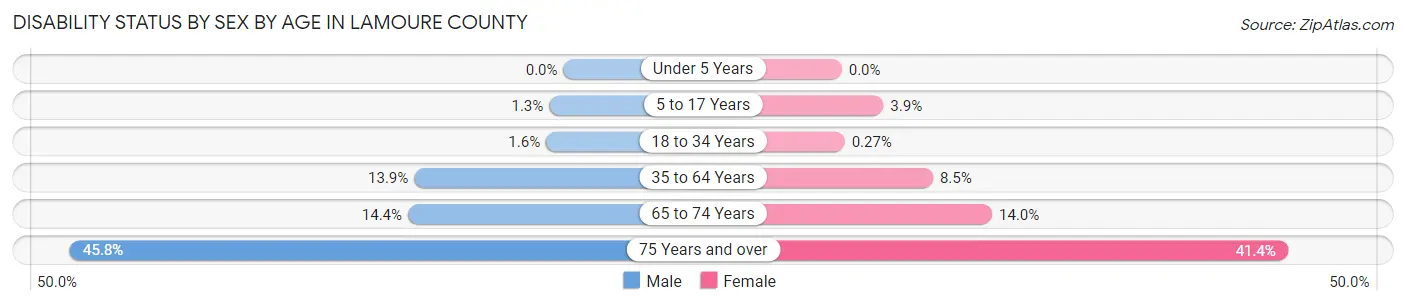
| Age Bracket | Male | Female |
| Under 5 Years | 0 (0.0%) | 0 (0.0%) |
| 5 to 17 Years | 5 (1.3%) | 10 (3.9%) |
| 18 to 34 Years | 5 (1.6%) | 1 (0.3%) |
| 35 to 64 Years | 109 (13.9%) | 55 (8.5%) |
| 65 to 74 Years | 44 (14.4%) | 36 (14.0%) |
| 75 Years and over | 98 (45.8%) | 108 (41.4%) |
Disability Class by Sex by Age in LaMoure County
Disability Class: Hearing Difficulty
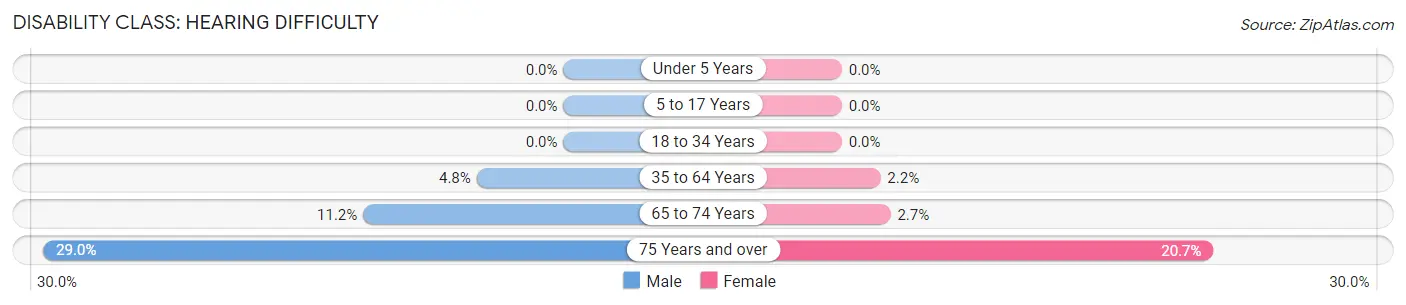
| Age Bracket | Male | Female |
| Under 5 Years | 0 (0.0%) | 0 (0.0%) |
| 5 to 17 Years | 0 (0.0%) | 0 (0.0%) |
| 18 to 34 Years | 0 (0.0%) | 0 (0.0%) |
| 35 to 64 Years | 38 (4.8%) | 14 (2.1%) |
| 65 to 74 Years | 34 (11.2%) | 7 (2.7%) |
| 75 Years and over | 62 (29.0%) | 54 (20.7%) |
Disability Class: Vision Difficulty
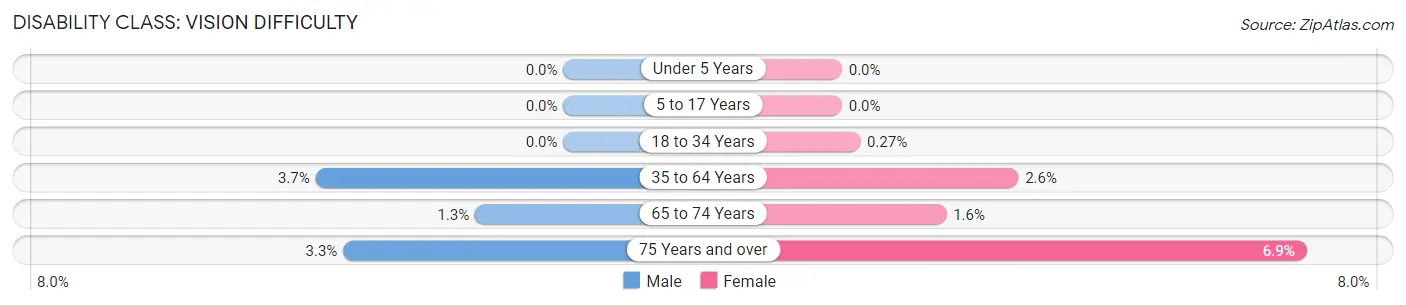
| Age Bracket | Male | Female |
| Under 5 Years | 0 (0.0%) | 0 (0.0%) |
| 5 to 17 Years | 0 (0.0%) | 0 (0.0%) |
| 18 to 34 Years | 0 (0.0%) | 1 (0.3%) |
| 35 to 64 Years | 29 (3.7%) | 17 (2.6%) |
| 65 to 74 Years | 4 (1.3%) | 4 (1.5%) |
| 75 Years and over | 7 (3.3%) | 18 (6.9%) |
Disability Class: Cognitive Difficulty
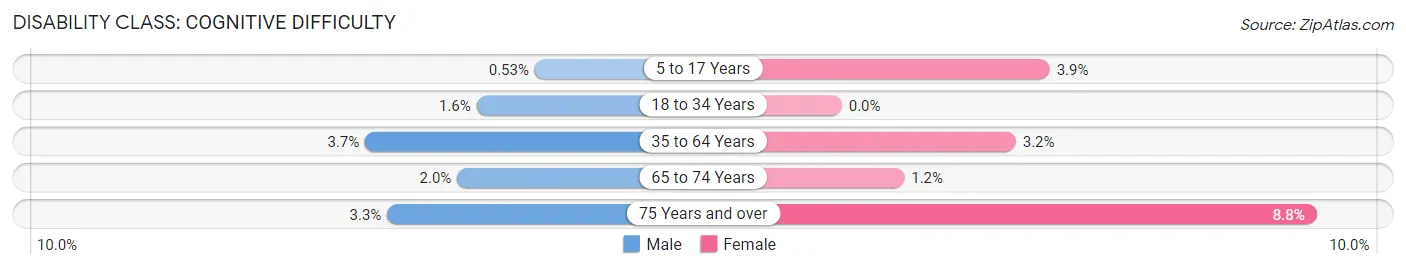
| Age Bracket | Male | Female |
| 5 to 17 Years | 2 (0.5%) | 10 (3.9%) |
| 18 to 34 Years | 5 (1.6%) | 0 (0.0%) |
| 35 to 64 Years | 29 (3.7%) | 21 (3.2%) |
| 65 to 74 Years | 6 (2.0%) | 3 (1.2%) |
| 75 Years and over | 7 (3.3%) | 23 (8.8%) |
Disability Class: Ambulatory Difficulty
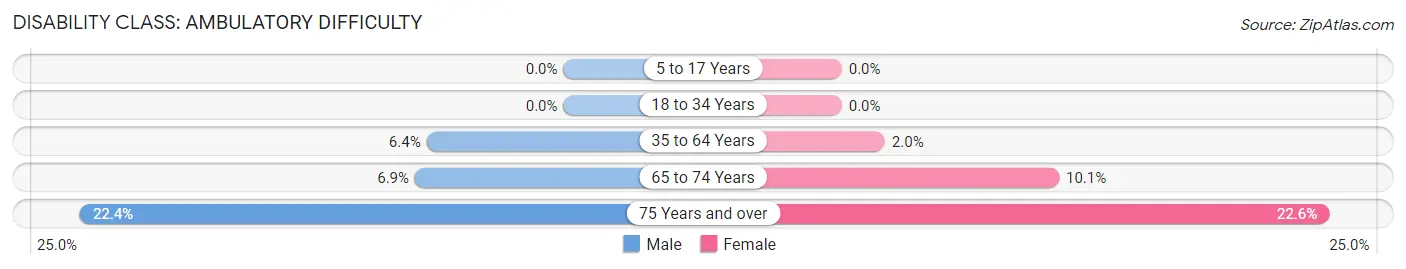
| Age Bracket | Male | Female |
| 5 to 17 Years | 0 (0.0%) | 0 (0.0%) |
| 18 to 34 Years | 0 (0.0%) | 0 (0.0%) |
| 35 to 64 Years | 50 (6.4%) | 13 (2.0%) |
| 65 to 74 Years | 21 (6.9%) | 26 (10.1%) |
| 75 Years and over | 48 (22.4%) | 59 (22.6%) |
Disability Class: Self-Care Difficulty
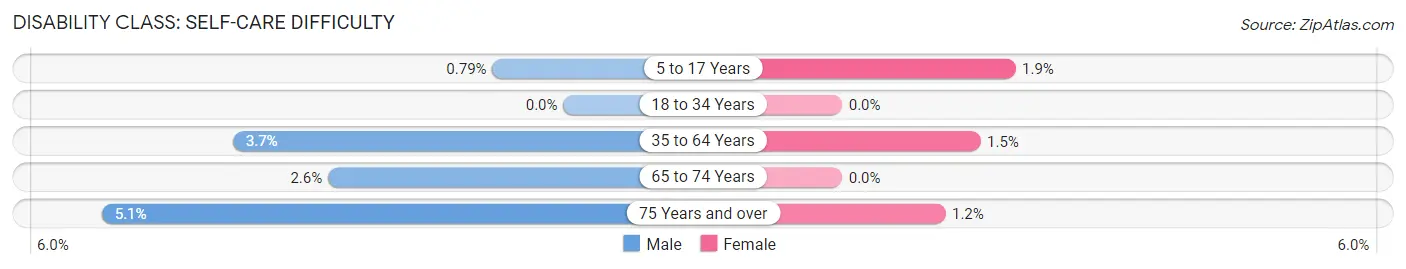
| Age Bracket | Male | Female |
| 5 to 17 Years | 3 (0.8%) | 5 (1.9%) |
| 18 to 34 Years | 0 (0.0%) | 0 (0.0%) |
| 35 to 64 Years | 29 (3.7%) | 10 (1.5%) |
| 65 to 74 Years | 8 (2.6%) | 0 (0.0%) |
| 75 Years and over | 11 (5.1%) | 3 (1.1%) |
Technology Access in LaMoure County
Computing Device Access in LaMoure County
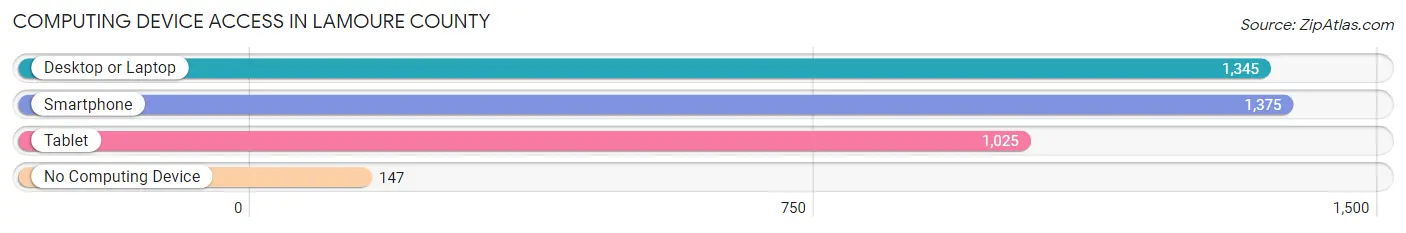
| Device Type | # Households | % Households |
| Desktop or Laptop | 1,345 | 79.2% |
| Smartphone | 1,375 | 81.0% |
| Tablet | 1,025 | 60.4% |
| No Computing Device | 147 | 8.7% |
| Total | 1,698 | 100.0% |
Internet Access in LaMoure County
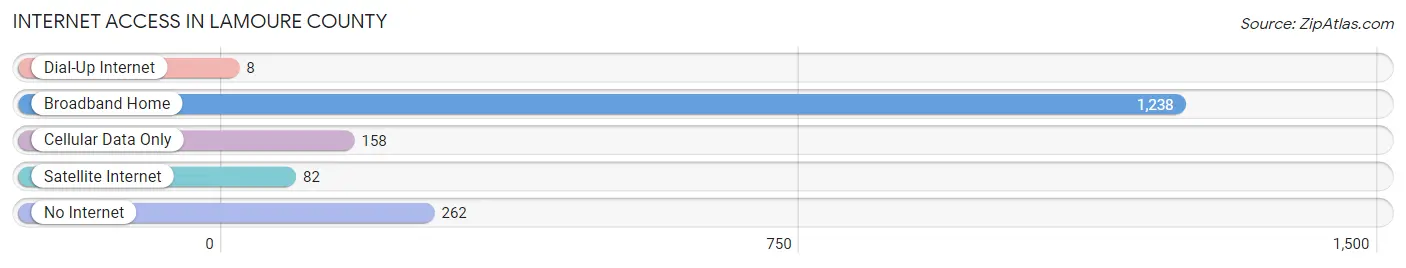
| Internet Type | # Households | % Households |
| Dial-Up Internet | 8 | 0.5% |
| Broadband Home | 1,238 | 72.9% |
| Cellular Data Only | 158 | 9.3% |
| Satellite Internet | 82 | 4.8% |
| No Internet | 262 | 15.4% |
| Total | 1,698 | 100.0% |
LaMoure County Summary
Lamoure County is located in the east-central region of North Dakota, United States. It is bordered by Dickey County to the north, Stutsman County to the east, Ransom County to the south, and McIntosh County to the west. The county seat is Lamoure, and the largest city is Edgeley. The county was created in 1873 and named for Pierre-Gaspard Lamoure, a French-Canadian fur trader who was active in the area in the early 19th century.
Geography
Lamoure County covers an area of 1,072 square miles, of which 1,062 square miles is land and 10 square miles is water. The county is located in the Red River Valley, a flat, fertile region of the Great Plains. The James River flows through the county, and the Sheyenne River forms part of its western border. The county is mostly flat, with some rolling hills in the western part. The highest point in the county is located in the northwest corner, at an elevation of 1,717 feet.
The county is home to several wildlife management areas, including the Lamoure County Wildlife Management Area, the Sheyenne National Grassland, and the Sheyenne River Wildlife Management Area.
Demographics
As of the 2010 United States Census, there were 4,711 people, 1,945 households, and 1,323 families living in the county. The population density was 4.4 people per square mile. The racial makeup of the county was 97.3% White, 0.3% Native American, 0.2% Asian, 0.1% Black or African American, 0.1% Pacific Islander, 0.7% from other races, and 1.3% from two or more races. Hispanic or Latino of any race were 1.7% of the population.
The median income for a household in the county was $45,938, and the median income for a family was $54,844. The per capita income for the county was $21,945. About 8.2% of families and 10.7% of the population were below the poverty line, including 13.2% of those under age 18 and 11.2% of those age 65 or over.
Economy
Agriculture is the main economic activity in Lamoure County. The county is home to a variety of crops, including wheat, corn, soybeans, and sunflowers. Livestock production is also important, with cattle, hogs, and sheep being raised in the area.
The county is also home to several manufacturing companies, including a furniture factory, a plastics factory, and a metal fabrication plant. The county is served by two railroads, the BNSF Railway and the Dakota, Minnesota & Eastern Railroad.
History
The area that is now Lamoure County was first settled by European-Americans in the 1870s. The county was created in 1873 and named for Pierre-Gaspard Lamoure, a French-Canadian fur trader who was active in the area in the early 19th century.
The county was largely agricultural in its early years, with wheat being the main crop. The county was also home to several small towns, including Edgeley, which was founded in 1881 and became the county seat in 1883.
In the early 20th century, the county experienced a population boom, as immigrants from Germany, Norway, and other European countries moved to the area. The county also experienced an economic boom, as new businesses opened and the agricultural industry flourished.
The county continued to grow in the mid-20th century, as new industries opened and the population increased. The county has experienced a population decline in recent years, as many young people have moved away in search of better job opportunities. Despite this, the county remains an important agricultural center, and its economy is still largely based on farming and ranching.
Common Questions
What is the Total Population of LaMoure County?
Total Population of LaMoure County is 4,135.
What is the Total Male Population of LaMoure County?
Total Male Population of LaMoure County is 2,134.
What is the Total Female Population of LaMoure County?
Total Female Population of LaMoure County is 2,001.
What is the Ratio of Males per 100 Females in LaMoure County?
There are 106.65 Males per 100 Females in LaMoure County.
What is the Ratio of Females per 100 Males in LaMoure County?
There are 93.77 Females per 100 Males in LaMoure County.
What is the Median Population Age in LaMoure County?
Median Population Age in LaMoure County is 45.8 Years.
What is the Average Family Size in LaMoure County
Average Family Size in LaMoure County is 2.9 People.
What is the Average Household Size in LaMoure County
Average Household Size in LaMoure County is 2.4 People.
What is Per Capita Income in LaMoure County?
Per Capita income in LaMoure County is $37,453.
What is the Median Family Income in LaMoure County?
Median Family Income in LaMoure County is $94,313.
What is the Median Household income in LaMoure County?
Median Household Income in LaMoure County is $70,227.
What is Income or Wage Gap in LaMoure County?
Income or Wage Gap in LaMoure County is 45.0%.
Women in LaMoure County earn 55.0 cents for every dollar earned by a man.
What is Family Income Deficit in LaMoure County?
Family Income Deficit in LaMoure County is $9,696.
Families that are below poverty line in LaMoure County earn $9,696 less on average than the poverty threshold level.
What is Inequality or Gini Index in LaMoure County?
Inequality or Gini Index in LaMoure County is 0.41.
How Large is the Labor Force in LaMoure County?
There are 2,084 People in the Labor Forcein in LaMoure County.
What is the Percentage of People in the Labor Force in LaMoure County?
62.7% of People are in the Labor Force in LaMoure County.
What is the Unemployment Rate in LaMoure County?
Unemployment Rate in LaMoure County is 1.7%.