Hettinger County, ND
Hettinger County Overview
2,477
TOTAL POPULATION
1,183
MALE POPULATION
1,294
FEMALE POPULATION
91.42
MALES / 100 FEMALES
109.38
FEMALES / 100 MALES
41.3
MEDIAN AGE
3.0
AVG FAMILY SIZE
2.2
AVG HOUSEHOLD SIZE
$40,931
PER CAPITA INCOME
$85,000
AVG FAMILY INCOME
$66,797
AVG HOUSEHOLD INCOME
50.3%
WAGE / INCOME GAP [ % ]
49.7¢/ $1
WAGE / INCOME GAP [ $ ]
0.50
INEQUALITY / GINI INDEX
1,194
LABOR FORCE [ PEOPLE ]
58.2%
PERCENT IN LABOR FORCE
4.2%
UNEMPLOYMENT RATE
Hettinger County Area Codes
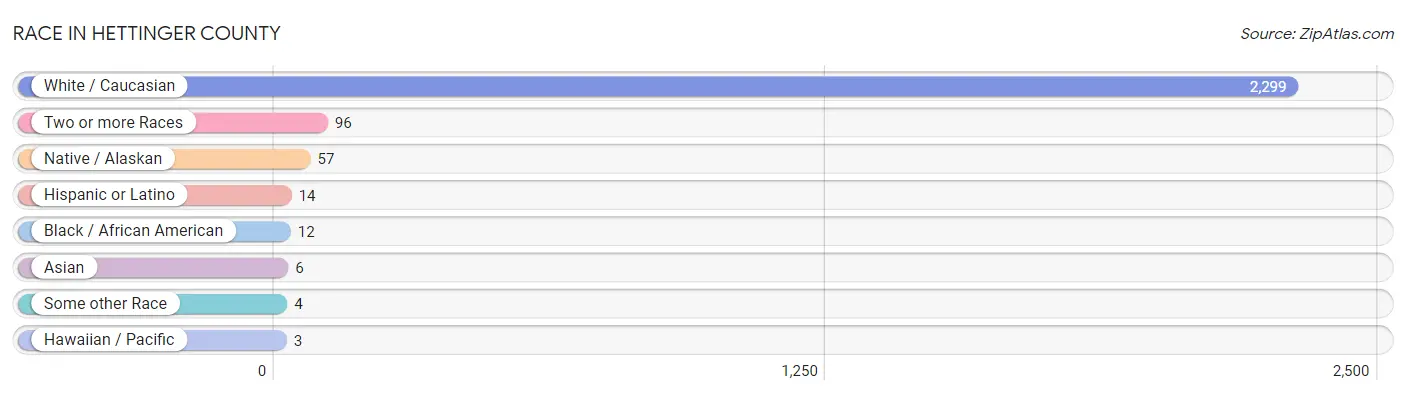
Race in Hettinger County
The most populous races in Hettinger County are White / Caucasian (2,299 | 92.8%), Two or more Races (96 | 3.9%), and Native / Alaskan (57 | 2.3%).
| Race | # Population | % Population |
| Asian | 6 | 0.2% |
| Black / African American | 12 | 0.5% |
| Hawaiian / Pacific | 3 | 0.1% |
| Hispanic or Latino | 14 | 0.6% |
| Native / Alaskan | 57 | 2.3% |
| White / Caucasian | 2,299 | 92.8% |
| Two or more Races | 96 | 3.9% |
| Some other Race | 4 | 0.2% |
| Total | 2,477 | 100.0% |
Ancestry in Hettinger County
The most populous ancestries reported in Hettinger County are German (1,289 | 52.0%), Irish (260 | 10.5%), Norwegian (225 | 9.1%), English (131 | 5.3%), and Russian (103 | 4.2%), together accounting for 81.1% of all Hettinger County residents.

| Ancestry | # Population | % Population |
| American | 27 | 1.1% |
| Chippewa | 5 | 0.2% |
| Choctaw | 38 | 1.5% |
| Croatian | 37 | 1.5% |
| Czech | 59 | 2.4% |
| Danish | 8 | 0.3% |
| Dutch | 15 | 0.6% |
| Eastern European | 5 | 0.2% |
| English | 131 | 5.3% |
| Finnish | 11 | 0.4% |
| French | 45 | 1.8% |
| French Canadian | 15 | 0.6% |
| German | 1,289 | 52.0% |
| German Russian | 4 | 0.2% |
| Hungarian | 64 | 2.6% |
| Irish | 260 | 10.5% |
| Italian | 39 | 1.6% |
| Jamaican | 7 | 0.3% |
| Mexican | 11 | 0.4% |
| Norwegian | 225 | 9.1% |
| Polish | 77 | 3.1% |
| Portuguese | 17 | 0.7% |
| Russian | 103 | 4.2% |
| Scandinavian | 29 | 1.2% |
| Scotch-Irish | 7 | 0.3% |
| Scottish | 18 | 0.7% |
| Sioux | 12 | 0.5% |
| Swedish | 65 | 2.6% |
| Swiss | 78 | 3.2% |
| Thai | 6 | 0.2% |
| Tlingit-Haida | 3 | 0.1% |
| Welsh | 6 | 0.2% |
| Yugoslavian | 2 | 0.1% | View All 33 Rows |
Immigrants in Hettinger County
The most numerous immigrant groups reported in Hettinger County came from Asia (6 | 0.2%), Europe (6 | 0.2%), Germany (6 | 0.2%), India (6 | 0.2%), and South Central Asia (6 | 0.2%), together accounting for 1.2% of all Hettinger County residents.

| Immigration Origin | # Population | % Population |
| Asia | 6 | 0.2% |
| Canada | 2 | 0.1% |
| Europe | 6 | 0.2% |
| Germany | 6 | 0.2% |
| India | 6 | 0.2% |
| South Central Asia | 6 | 0.2% |
| Western Europe | 6 | 0.2% | View All 7 Rows |
Sex and Age in Hettinger County
Sex and Age in Hettinger County
The most populous age groups in Hettinger County are 35 to 39 Years (110 | 9.3%) for men and 35 to 39 Years (123 | 9.5%) for women.

| Age Bracket | Male | Female |
| Under 5 Years | 67 (5.7%) | 90 (7.0%) |
| 5 to 9 Years | 70 (5.9%) | 89 (6.9%) |
| 10 to 14 Years | 35 (3.0%) | 57 (4.4%) |
| 15 to 19 Years | 46 (3.9%) | 32 (2.5%) |
| 20 to 24 Years | 80 (6.8%) | 72 (5.6%) |
| 25 to 29 Years | 64 (5.4%) | 89 (6.9%) |
| 30 to 34 Years | 100 (8.5%) | 93 (7.2%) |
| 35 to 39 Years | 110 (9.3%) | 123 (9.5%) |
| 40 to 44 Years | 13 (1.1%) | 38 (2.9%) |
| 45 to 49 Years | 44 (3.7%) | 47 (3.6%) |
| 50 to 54 Years | 59 (5.0%) | 46 (3.5%) |
| 55 to 59 Years | 103 (8.7%) | 95 (7.3%) |
| 60 to 64 Years | 70 (5.9%) | 104 (8.0%) |
| 65 to 69 Years | 93 (7.9%) | 57 (4.4%) |
| 70 to 74 Years | 87 (7.3%) | 75 (5.8%) |
| 75 to 79 Years | 37 (3.1%) | 35 (2.7%) |
| 80 to 84 Years | 79 (6.7%) | 60 (4.6%) |
| 85 Years and over | 26 (2.2%) | 92 (7.1%) |
| Total | 1,183 (100.0%) | 1,294 (100.0%) |
Families and Households in Hettinger County
Median Family Size in Hettinger County
The median family size in Hettinger County is 2.96 persons per family, with single male/father families (34 | 5.7%) accounting for the largest median family size of 3.62 persons per family. On the other hand, single female/mother families (80 | 13.4%) represent the smallest median family size with 2.30 persons per family.

| Family Type | # Families | Family Size |
| Married-Couple | 484 (80.9%) | 3.03 |
| Single Male/Father | 34 (5.7%) | 3.62 |
| Single Female/Mother | 80 (13.4%) | 2.30 |
| Total Families | 598 (100.0%) | 2.96 |
Median Household Size in Hettinger County
The median household size in Hettinger County is 2.19 persons per household, with single male/father households (34 | 3.2%) accounting for the largest median household size of 4.24 persons per household. non-family households (457 | 43.3%) represent the smallest median household size with 1.07 persons per household.

| Household Type | # Households | Household Size |
| Married-Couple | 484 (45.9%) | 3.05 |
| Single Male/Father | 34 (3.2%) | 4.24 |
| Single Female/Mother | 80 (7.6%) | 2.55 |
| Non-family | 457 (43.3%) | 1.07 |
| Total Households | 1,055 (100.0%) | 2.19 |
Household Size by Marriage Status in Hettinger County
Out of a total of 1,055 households in Hettinger County, 598 (56.7%) are family households, while 457 (43.3%) are nonfamily households. The most numerous type of family households are 2-person households, comprising 344, and the most common type of nonfamily households are 1-person households, comprising 427.

| Household Size | Family Households | Nonfamily Households |
| 1-Person Households | - | 427 (40.5%) |
| 2-Person Households | 344 (32.6%) | 30 (2.8%) |
| 3-Person Households | 107 (10.1%) | 0 (0.0%) |
| 4-Person Households | 66 (6.3%) | 0 (0.0%) |
| 5-Person Households | 36 (3.4%) | 0 (0.0%) |
| 6-Person Households | 13 (1.2%) | 0 (0.0%) |
| 7+ Person Households | 32 (3.0%) | 0 (0.0%) |
| Total | 598 (56.7%) | 457 (43.3%) |
Female Fertility in Hettinger County
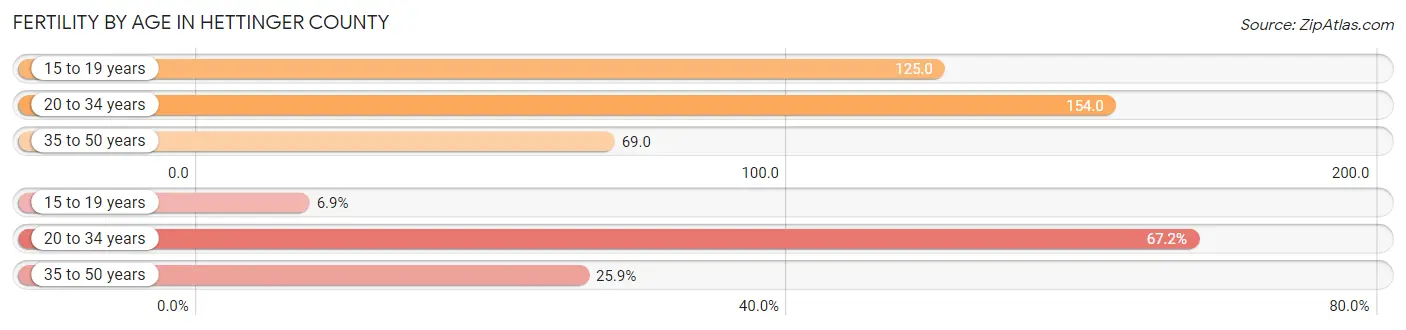
Fertility by Age in Hettinger County
Average fertility rate in Hettinger County is 115.0 births per 1,000 women. Women in the age bracket of 20 to 34 years have the highest fertility rate with 154.0 births per 1,000 women. Women in the age bracket of 20 to 34 years acount for 67.2% of all women with births.
| Age Bracket | Women with Births | Births / 1,000 Women |
| 15 to 19 years | 4 (6.9%) | 125.0 |
| 20 to 34 years | 39 (67.2%) | 154.0 |
| 35 to 50 years | 15 (25.9%) | 69.0 |
| Total | 58 (100.0%) | 115.0 |
Fertility by Age by Marriage Status in Hettinger County
58.6% of women with births (58) in Hettinger County are married. The highest percentage of unmarried women with births falls into 15 to 19 years age bracket with 100.0% of them unmarried at the time of birth, while the lowest percentage of unmarried women with births belong to 35 to 50 years age bracket with 0.0% of them unmarried.

| Age Bracket | Married | Unmarried |
| 15 to 19 years | 0 (0.0%) | 4 (100.0%) |
| 20 to 34 years | 19 (48.7%) | 20 (51.3%) |
| 35 to 50 years | 15 (100.0%) | 0 (0.0%) |
| Total | 34 (58.6%) | 24 (41.4%) |
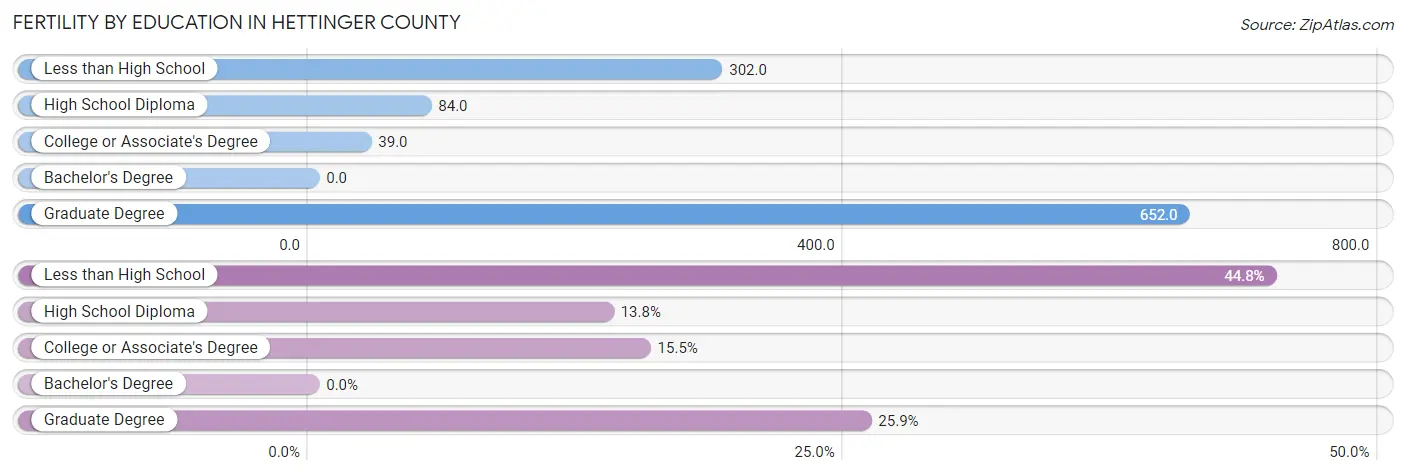
Fertility by Education in Hettinger County
| Educational Attainment | Women with Births | Births / 1,000 Women |
| Less than High School | 26 (44.8%) | 302.0 |
| High School Diploma | 8 (13.8%) | 84.0 |
| College or Associate's Degree | 9 (15.5%) | 39.0 |
| Bachelor's Degree | 0 (0.0%) | 0.0 |
| Graduate Degree | 15 (25.9%) | 652.0 |
| Total | 58 (100.0%) | 115.0 |
Fertility by Education by Marriage Status in Hettinger County
41.4% of women with births in Hettinger County are unmarried. Women with the educational attainment of college or associate's degree are most likely to be married with 100.0% of them married at childbirth, while women with the educational attainment of high school diploma are least likely to be married with 100.0% of them unmarried at childbirth.

| Educational Attainment | Married | Unmarried |
| Less than High School | 10 (38.5%) | 16 (61.5%) |
| High School Diploma | 0 (0.0%) | 8 (100.0%) |
| College or Associate's Degree | 9 (100.0%) | 0 (0.0%) |
| Bachelor's Degree | 0 (0.0%) | 0 (0.0%) |
| Graduate Degree | 15 (100.0%) | 0 (0.0%) |
| Total | 34 (58.6%) | 24 (41.4%) |
Income in Hettinger County
Income Overview in Hettinger County
Per Capita Income in Hettinger County is $40,931, while median incomes of families and households are $85,000 and $66,797 respectively.
| Characteristic | Number | Measure |
| Per Capita Income | 2,477 | $40,931 |
| Median Family Income | 598 | $85,000 |
| Mean Family Income | 598 | $114,246 |
| Median Household Income | 1,055 | $66,797 |
| Mean Household Income | 1,055 | $84,749 |
| Income Deficit | 598 | $0 |
| Wage / Income Gap (%) | 2,477 | 50.30% |
| Wage / Income Gap ($) | 2,477 | 49.70¢ per $1 |
| Gini / Inequality Index | 2,477 | 0.50 |
Earnings by Sex in Hettinger County
Average Earnings in Hettinger County are $43,333, $59,625 for men and $29,635 for women, a difference of 50.3%.

| Sex | Number | Average Earnings |
| Male | 763 (54.0%) | $59,625 |
| Female | 649 (46.0%) | $29,635 |
| Total | 1,412 (100.0%) | $43,333 |
Earnings by Sex by Income Bracket in Hettinger County
The most common earnings brackets in Hettinger County are $100,000+ for men (160 | 21.0%) and $40,000 to $44,999 for women (90 | 13.9%).

| Income | Male | Female |
| $2,499 or less | 27 (3.5%) | 50 (7.7%) |
| $2,500 to $4,999 | 19 (2.5%) | 50 (7.7%) |
| $5,000 to $7,499 | 31 (4.1%) | 32 (4.9%) |
| $7,500 to $9,999 | 12 (1.6%) | 18 (2.8%) |
| $10,000 to $12,499 | 16 (2.1%) | 37 (5.7%) |
| $12,500 to $14,999 | 14 (1.8%) | 23 (3.5%) |
| $15,000 to $17,499 | 6 (0.8%) | 33 (5.1%) |
| $17,500 to $19,999 | 0 (0.0%) | 18 (2.8%) |
| $20,000 to $22,499 | 24 (3.2%) | 8 (1.2%) |
| $22,500 to $24,999 | 0 (0.0%) | 18 (2.8%) |
| $25,000 to $29,999 | 16 (2.1%) | 41 (6.3%) |
| $30,000 to $34,999 | 6 (0.8%) | 44 (6.8%) |
| $35,000 to $39,999 | 42 (5.5%) | 20 (3.1%) |
| $40,000 to $44,999 | 37 (4.9%) | 90 (13.9%) |
| $45,000 to $49,999 | 57 (7.5%) | 19 (2.9%) |
| $50,000 to $54,999 | 43 (5.6%) | 35 (5.4%) |
| $55,000 to $64,999 | 58 (7.6%) | 64 (9.9%) |
| $65,000 to $74,999 | 134 (17.6%) | 24 (3.7%) |
| $75,000 to $99,999 | 61 (8.0%) | 20 (3.1%) |
| $100,000+ | 160 (21.0%) | 5 (0.8%) |
| Total | 763 (100.0%) | 649 (100.0%) |
Earnings by Sex by Educational Attainment in Hettinger County
Average earnings in Hettinger County are $65,192 for men and $30,833 for women, a difference of 52.7%. Men with an educational attainment of graduate degree enjoy the highest average annual earnings of $104,135, while those with high school diploma education earn the least with $49,286. Women with an educational attainment of bachelor's degree earn the most with the average annual earnings of $52,188, while those with high school diploma education have the smallest earnings of $18,611.

| Educational Attainment | Male Income | Female Income |
| Less than High School | $50,521 | $0 |
| High School Diploma | $49,286 | $18,611 |
| College or Associate's Degree | $68,314 | $32,969 |
| Bachelor's Degree | $76,750 | $52,188 |
| Graduate Degree | $104,135 | $0 |
| Total | $65,192 | $30,833 |
Family Income in Hettinger County
Family Income Brackets in Hettinger County
According to the Hettinger County family income data, there are 163 families falling into the $100,000 to $149,999 income range, which is the most common income bracket and makes up 27.3% of all families. Conversely, the $10,000 to $14,999 income bracket is the least frequent group with only 7 families (1.2%) belonging to this category.

| Income Bracket | # Families | % Families |
| Less than $10,000 | 8 | 1.3% |
| $10,000 to $14,999 | 7 | 1.2% |
| $15,000 to $24,999 | 13 | 2.2% |
| $25,000 to $34,999 | 64 | 10.7% |
| $35,000 to $49,999 | 62 | 10.4% |
| $50,000 to $74,999 | 114 | 19.1% |
| $75,000 to $99,999 | 75 | 12.5% |
| $100,000 to $149,999 | 163 | 27.3% |
| $150,000 to $199,999 | 48 | 8.0% |
| $200,000+ | 44 | 7.4% |
Family Income by Famaliy Size in Hettinger County
7+ person families (25 | 4.2%) account for the highest median family income in Hettinger County with $134,135 per family, while 2-person families (367 | 61.4%) have the highest median income of $36,328 per family member.

| Income Bracket | # Families | Median Income |
| 2-Person Families | 367 (61.4%) | $72,656 |
| 3-Person Families | 98 (16.4%) | $105,000 |
| 4-Person Families | 52 (8.7%) | $124,583 |
| 5-Person Families | 36 (6.0%) | $72,368 |
| 6-Person Families | 20 (3.3%) | $70,750 |
| 7+ Person Families | 25 (4.2%) | $134,135 |
| Total | 598 (100.0%) | $85,000 |
Family Income by Number of Earners in Hettinger County
The median family income in Hettinger County is $85,000, with families comprising 3+ earners (59) having the highest median family income of $142,596, while families with no earners (80) have the lowest median family income of $46,250, accounting for 9.9% and 13.4% of families, respectively.

| Number of Earners | # Families | Median Income |
| No Earners | 80 (13.4%) | $46,250 |
| 1 Earner | 190 (31.8%) | $48,409 |
| 2 Earners | 269 (45.0%) | $117,083 |
| 3+ Earners | 59 (9.9%) | $142,596 |
| Total | 598 (100.0%) | $85,000 |
Household Income in Hettinger County
Household Income Brackets in Hettinger County
With 179 households falling in the category, the $50,000 to $74,999 income range is the most frequent in Hettinger County, accounting for 17.0% of all households. In contrast, only 47 households (4.4%) fall into the $150,000 to $199,999 income bracket, making it the least populous group.

| Income Bracket | # Households | % Households |
| Less than $10,000 | 57 | 5.4% |
| $10,000 to $14,999 | 71 | 6.7% |
| $15,000 to $24,999 | 127 | 12.0% |
| $25,000 to $34,999 | 79 | 7.5% |
| $35,000 to $49,999 | 116 | 11.0% |
| $50,000 to $74,999 | 179 | 17.0% |
| $75,000 to $99,999 | 145 | 13.7% |
| $100,000 to $149,999 | 175 | 16.6% |
| $150,000 to $199,999 | 47 | 4.5% |
| $200,000+ | 58 | 5.5% |
Household Income by Householder Age in Hettinger County
The median household income in Hettinger County is $66,797, with the highest median household income of $76,250 found in the 25 to 44 years age bracket for the primary householder. A total of 284 households (26.9%) fall into this category. Meanwhile, the 65+ years age bracket for the primary householder has the lowest median household income of $34,063, with 442 households (41.9%) in this group.

| Income Bracket | # Households | Median Income |
| 15 to 24 Years | 26 (2.5%) | $69,167 |
| 25 to 44 Years | 284 (26.9%) | $76,250 |
| 45 to 64 Years | 303 (28.7%) | $75,893 |
| 65+ Years | 442 (41.9%) | $34,063 |
| Total | 1,055 (100.0%) | $66,797 |
Poverty in Hettinger County
Income Below Poverty by Sex and Age in Hettinger County
With 11.1% poverty level for males and 9.3% for females among the residents of Hettinger County, 15 year old males and 75 year old and over females are the most vulnerable to poverty, with 7 males (53.8%) and 43 females (24.0%) in their respective age groups living below the poverty level.

| Age Bracket | Male | Female |
| Under 5 Years | 10 (14.9%) | 0 (0.0%) |
| 5 Years | 0 (0.0%) | 0 (0.0%) |
| 6 to 11 Years | 8 (11.3%) | 7 (6.7%) |
| 12 to 14 Years | 0 (0.0%) | 4 (12.9%) |
| 15 Years | 7 (53.8%) | 1 (20.0%) |
| 16 and 17 Years | 6 (27.3%) | 0 (0.0%) |
| 18 to 24 Years | 6 (6.6%) | 4 (5.6%) |
| 25 to 34 Years | 7 (4.3%) | 7 (5.7%) |
| 35 to 44 Years | 4 (3.3%) | 4 (3.6%) |
| 45 to 54 Years | 30 (29.1%) | 0 (0.0%) |
| 55 to 64 Years | 24 (13.9%) | 31 (16.3%) |
| 65 to 74 Years | 23 (12.8%) | 6 (4.8%) |
| 75 Years and over | 4 (3.3%) | 43 (24.0%) |
| Total | 129 (11.1%) | 107 (9.3%) |
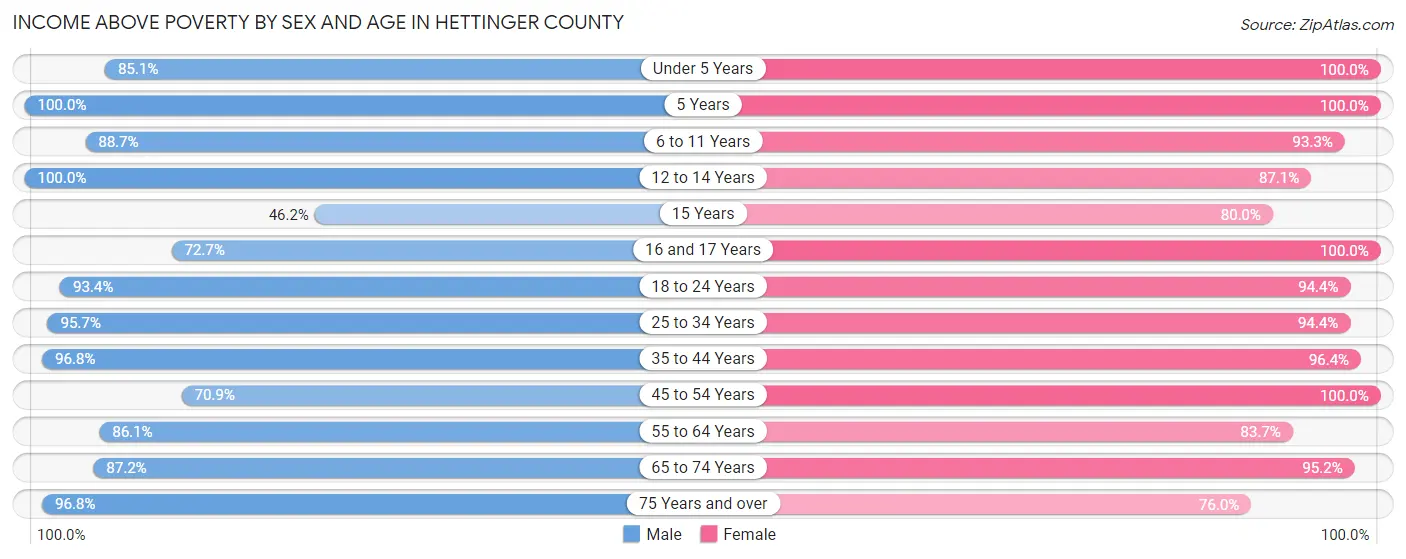
Income Above Poverty by Sex and Age in Hettinger County
According to the poverty statistics in Hettinger County, males aged 5 years and females aged under 5 years are the age groups that are most secure financially, with 100.0% of males and 100.0% of females in these age groups living above the poverty line.
| Age Bracket | Male | Female |
| Under 5 Years | 57 (85.1%) | 90 (100.0%) |
| 5 Years | 12 (100.0%) | 10 (100.0%) |
| 6 to 11 Years | 63 (88.7%) | 98 (93.3%) |
| 12 to 14 Years | 22 (100.0%) | 27 (87.1%) |
| 15 Years | 6 (46.2%) | 4 (80.0%) |
| 16 and 17 Years | 16 (72.7%) | 23 (100.0%) |
| 18 to 24 Years | 85 (93.4%) | 67 (94.4%) |
| 25 to 34 Years | 157 (95.7%) | 117 (94.4%) |
| 35 to 44 Years | 119 (96.8%) | 106 (96.4%) |
| 45 to 54 Years | 73 (70.9%) | 86 (100.0%) |
| 55 to 64 Years | 149 (86.1%) | 159 (83.7%) |
| 65 to 74 Years | 157 (87.2%) | 118 (95.2%) |
| 75 Years and over | 119 (96.8%) | 136 (76.0%) |
| Total | 1,035 (88.9%) | 1,041 (90.7%) |
Income Below Poverty Among Married-Couple Families in Hettinger County
The poverty statistics for married-couple families in Hettinger County show that 2.7% or 13 of the total 484 families live below the poverty line. Families with 1 or 2 children have the highest poverty rate of 3.7%, comprising of 3 families. On the other hand, families with 3 or 4 children have the lowest poverty rate of 0.0%, which includes 0 families.

| Children | Above Poverty | Below Poverty |
| No Children | 328 (97.0%) | 10 (3.0%) |
| 1 or 2 Children | 78 (96.3%) | 3 (3.7%) |
| 3 or 4 Children | 48 (100.0%) | 0 (0.0%) |
| 5 or more Children | 17 (100.0%) | 0 (0.0%) |
| Total | 471 (97.3%) | 13 (2.7%) |
Income Below Poverty Among Single-Parent Households in Hettinger County
According to the poverty data in Hettinger County, 32.4% or 11 single-father households and 3.7% or 3 single-mother households are living below the poverty line. Among single-father households, those with 3 or 4 children have the highest poverty rate, with 11 households (100.0%) experiencing poverty. Likewise, among single-mother households, those with 1 or 2 children have the highest poverty rate, with 3 households (5.4%) falling below the poverty line.

| Children | Single Father | Single Mother |
| No Children | 0 (0.0%) | 0 (0.0%) |
| 1 or 2 Children | 0 (0.0%) | 3 (5.4%) |
| 3 or 4 Children | 11 (100.0%) | 0 (0.0%) |
| 5 or more Children | 0 (0.0%) | 0 (0.0%) |
| Total | 11 (32.4%) | 3 (3.7%) |
Income Below Poverty Among Married-Couple vs Single-Parent Households in Hettinger County
The poverty data for Hettinger County shows that 13 of the married-couple family households (2.7%) and 14 of the single-parent households (12.3%) are living below the poverty level. Within the married-couple family households, those with 1 or 2 children have the highest poverty rate, with 3 households (3.7%) falling below the poverty line. Among the single-parent households, those with 3 or 4 children have the highest poverty rate, with 11 household (100.0%) living below poverty.

| Children | Married-Couple Families | Single-Parent Households |
| No Children | 10 (3.0%) | 0 (0.0%) |
| 1 or 2 Children | 3 (3.7%) | 3 (5.2%) |
| 3 or 4 Children | 0 (0.0%) | 11 (100.0%) |
| 5 or more Children | 0 (0.0%) | 0 (0.0%) |
| Total | 13 (2.7%) | 14 (12.3%) |
Employment Characteristics in Hettinger County
Employment by Class of Employer in Hettinger County
Among the 1,121 employed individuals in Hettinger County, private company employees (482 | 43.0%), self-employed (not incorporated) (276 | 24.6%), and not-for-profit organizations (137 | 12.2%) make up the most common classes of employment.

| Employer Class | # Employees | % Employees |
| Private Company Employees | 482 | 43.0% |
| Self-Employed (Incorporated) | 19 | 1.7% |
| Self-Employed (Not Incorporated) | 276 | 24.6% |
| Not-for-profit Organizations | 137 | 12.2% |
| Local Government Employees | 132 | 11.8% |
| State Government Employees | 57 | 5.1% |
| Federal Government Employees | 12 | 1.1% |
| Unpaid Family Workers | 6 | 0.5% |
| Total | 1,121 | 100.0% |
Employment Status by Age in Hettinger County
According to the labor force statistics for Hettinger County, out of the total population over 16 years of age (2,051), 58.2% or 1,194 individuals are in the labor force, with 4.2% or 50 of them unemployed. The age group with the highest labor force participation rate is 20 to 24 years, with 92.1% or 140 individuals in the labor force. Within the labor force, the 65 to 74 years age range has the highest percentage of unemployed individuals, with 11.0% or 12 of them being unemployed.

| Age Bracket | In Labor Force | Unemployed |
| 16 to 19 Years | 19 (31.7%) | 0 (0.0%) |
| 20 to 24 Years | 140 (92.1%) | 3 (2.1%) |
| 25 to 29 Years | 104 (68.0%) | 7 (6.7%) |
| 30 to 34 Years | 147 (76.2%) | 0 (0.0%) |
| 35 to 44 Years | 227 (79.9%) | 4 (1.8%) |
| 45 to 54 Years | 171 (87.2%) | 13 (7.6%) |
| 55 to 59 Years | 155 (78.3%) | 11 (7.1%) |
| 60 to 64 Years | 106 (60.9%) | 0 (0.0%) |
| 65 to 74 Years | 109 (34.9%) | 12 (11.0%) |
| 75 Years and over | 15 (4.6%) | 0 (0.0%) |
| Total | 1,194 (58.2%) | 50 (4.2%) |
Employment Status by Educational Attainment in Hettinger County
According to labor force statistics for Hettinger County, 76.0% of individuals (910) out of the total population between 25 and 64 years of age (1,198) are in the labor force, with 3.8% or 35 of them being unemployed. The group with the highest labor force participation rate are those with the educational attainment of bachelor's degree or higher, with 91.3% or 200 individuals in the labor force. Within the labor force, individuals with high school diploma education have the highest percentage of unemployment, with 6.4% or 18 of them being unemployed.

| Educational Attainment | In Labor Force | Unemployed |
| Less than High School | 61 (54.5%) | 0 (0.0%) |
| High School Diploma | 283 (79.1%) | 23 (6.4%) |
| College / Associate Degree | 366 (71.9%) | 15 (3.0%) |
| Bachelor's Degree or higher | 200 (91.3%) | 7 (3.0%) |
| Total | 910 (76.0%) | 46 (3.8%) |
Employment Occupations by Sex in Hettinger County
Management, Business, Science and Arts Occupations
The most common Management, Business, Science and Arts occupations in Hettinger County are Management (251 | 22.0%), Community & Social Service (82 | 7.2%), Education Instruction & Library (66 | 5.8%), Business & Financial (41 | 3.6%), and Health Diagnosing & Treating (24 | 2.1%).

Management, Business, Science and Arts Occupations by Sex
Within the Management, Business, Science and Arts occupations in Hettinger County, the most male-oriented occupations are Life, Physical & Social Science (100.0%), Legal Services & Support (100.0%), and Computers, Engineering & Science (84.2%), while the most female-oriented occupations are Architecture & Engineering (100.0%), Education, Arts & Media (100.0%), and Arts, Media & Entertainment (100.0%).

| Occupation | Male | Female |
| Management | 186 (74.1%) | 65 (25.9%) |
| Business & Financial | 9 (22.0%) | 32 (78.0%) |
| Computers, Engineering & Science | 16 (84.2%) | 3 (15.8%) |
| Computers & Mathematics | 0 (0.0%) | 0 (0.0%) |
| Architecture & Engineering | 0 (0.0%) | 3 (100.0%) |
| Life, Physical & Social Science | 16 (100.0%) | 0 (0.0%) |
| Community & Social Service | 22 (26.8%) | 60 (73.2%) |
| Education, Arts & Media | 0 (0.0%) | 5 (100.0%) |
| Legal Services & Support | 5 (100.0%) | 0 (0.0%) |
| Education Instruction & Library | 17 (25.8%) | 49 (74.2%) |
| Arts, Media & Entertainment | 0 (0.0%) | 6 (100.0%) |
| Health Diagnosing & Treating | 0 (0.0%) | 24 (100.0%) |
| Health Technologists | 0 (0.0%) | 15 (100.0%) |
| Total (Category) | 233 (55.9%) | 184 (44.1%) |
| Total (Overall) | 658 (57.6%) | 485 (42.4%) |
Services Occupations
The most common Services occupations in Hettinger County are Healthcare Support (50 | 4.4%), Food Preparation & Serving (41 | 3.6%), Security & Protection (29 | 2.5%), Personal Care & Service (25 | 2.2%), and Firefighting & Prevention (19 | 1.7%).

Services Occupations by Sex
Within the Services occupations in Hettinger County, the most male-oriented occupations are Cleaning & Maintenance (50.0%), Food Preparation & Serving (39.0%), and Law Enforcement (30.0%), while the most female-oriented occupations are Healthcare Support (100.0%), Firefighting & Prevention (100.0%), and Personal Care & Service (100.0%).

| Occupation | Male | Female |
| Healthcare Support | 0 (0.0%) | 50 (100.0%) |
| Security & Protection | 3 (10.3%) | 26 (89.7%) |
| Firefighting & Prevention | 0 (0.0%) | 19 (100.0%) |
| Law Enforcement | 3 (30.0%) | 7 (70.0%) |
| Food Preparation & Serving | 16 (39.0%) | 25 (61.0%) |
| Cleaning & Maintenance | 5 (50.0%) | 5 (50.0%) |
| Personal Care & Service | 0 (0.0%) | 25 (100.0%) |
| Total (Category) | 24 (15.5%) | 131 (84.5%) |
| Total (Overall) | 658 (57.6%) | 485 (42.4%) |
Sales and Office Occupations
The most common Sales and Office occupations in Hettinger County are Office & Administration (114 | 10.0%), and Sales & Related (85 | 7.4%).

Sales and Office Occupations by Sex

| Occupation | Male | Female |
| Sales & Related | 78 (91.8%) | 7 (8.2%) |
| Office & Administration | 25 (21.9%) | 89 (78.1%) |
| Total (Category) | 103 (51.8%) | 96 (48.2%) |
| Total (Overall) | 658 (57.6%) | 485 (42.4%) |
Natural Resources, Construction and Maintenance Occupations
The most common Natural Resources, Construction and Maintenance occupations in Hettinger County are Construction & Extraction (86 | 7.5%), Farming, Fishing & Forestry (42 | 3.7%), and Installation, Maintenance & Repair (37 | 3.2%).

Natural Resources, Construction and Maintenance Occupations by Sex

| Occupation | Male | Female |
| Farming, Fishing & Forestry | 36 (85.7%) | 6 (14.3%) |
| Construction & Extraction | 78 (90.7%) | 8 (9.3%) |
| Installation, Maintenance & Repair | 37 (100.0%) | 0 (0.0%) |
| Total (Category) | 151 (91.5%) | 14 (8.5%) |
| Total (Overall) | 658 (57.6%) | 485 (42.4%) |
Production, Transportation and Moving Occupations
The most common Production, Transportation and Moving occupations in Hettinger County are Production (105 | 9.2%), Material Moving (53 | 4.6%), and Transportation (49 | 4.3%).
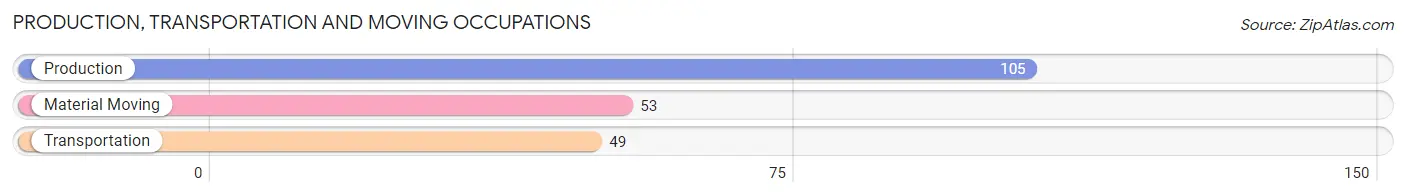
Production, Transportation and Moving Occupations by Sex

| Occupation | Male | Female |
| Production | 65 (61.9%) | 40 (38.1%) |
| Transportation | 46 (93.9%) | 3 (6.1%) |
| Material Moving | 36 (67.9%) | 17 (32.1%) |
| Total (Category) | 147 (71.0%) | 60 (29.0%) |
| Total (Overall) | 658 (57.6%) | 485 (42.4%) |
Employment Industries by Sex in Hettinger County
Employment Industries in Hettinger County
The major employment industries in Hettinger County include Agriculture, Fishing & Hunting (212 | 18.5%), Construction (150 | 13.1%), Health Care & Social Assistance (128 | 11.2%), Retail Trade (115 | 10.1%), and Educational Services (84 | 7.3%).

Employment Industries by Sex in Hettinger County
The Hettinger County industries that see more men than women are Mining, Quarrying, & Extraction (100.0%), Real Estate, Rental & Leasing (100.0%), and Agriculture, Fishing & Hunting (87.3%), whereas the industries that tend to have a higher number of women are Arts, Entertainment & Recreation (100.0%), Health Care & Social Assistance (93.8%), and Educational Services (73.8%).

| Industry | Male | Female |
| Agriculture, Fishing & Hunting | 185 (87.3%) | 27 (12.7%) |
| Mining, Quarrying, & Extraction | 33 (100.0%) | 0 (0.0%) |
| Construction | 105 (70.0%) | 45 (30.0%) |
| Manufacturing | 34 (72.3%) | 13 (27.7%) |
| Wholesale Trade | 43 (84.3%) | 8 (15.7%) |
| Retail Trade | 77 (67.0%) | 38 (33.0%) |
| Transportation & Warehousing | 24 (52.2%) | 22 (47.8%) |
| Utilities | 13 (81.2%) | 3 (18.8%) |
| Information | 3 (33.3%) | 6 (66.7%) |
| Finance & Insurance | 23 (54.8%) | 19 (45.2%) |
| Real Estate, Rental & Leasing | 3 (100.0%) | 0 (0.0%) |
| Professional & Scientific | 23 (74.2%) | 8 (25.8%) |
| Enterprise Management | 0 (0.0%) | 0 (0.0%) |
| Administrative & Support | 8 (61.5%) | 5 (38.5%) |
| Educational Services | 22 (26.2%) | 62 (73.8%) |
| Health Care & Social Assistance | 8 (6.2%) | 120 (93.8%) |
| Arts, Entertainment & Recreation | 0 (0.0%) | 30 (100.0%) |
| Accommodation & Food Services | 10 (45.5%) | 12 (54.5%) |
| Public Administration | 17 (37.8%) | 28 (62.2%) |
| Total | 658 (57.6%) | 485 (42.4%) |
Education in Hettinger County
School Enrollment in Hettinger County
The most common levels of schooling among the 407 students in Hettinger County are elementary school (120 | 29.5%), high school (97 | 23.8%), and middle school (72 | 17.7%).

| School Level | # Students | % Students |
| Nursery / Preschool | 30 | 7.4% |
| Kindergarten | 33 | 8.1% |
| Elementary School | 120 | 29.5% |
| Middle School | 72 | 17.7% |
| High School | 97 | 23.8% |
| College / Undergraduate | 46 | 11.3% |
| Graduate / Professional | 9 | 2.2% |
| Total | 407 | 100.0% |
School Enrollment by Age by Funding Source in Hettinger County
Out of a total of 407 students who are enrolled in schools in Hettinger County, 65 (16.0%) attend a private institution, while the remaining 342 (84.0%) are enrolled in public schools. The age group of 25 to 34 year olds has the highest likelihood of being enrolled in private schools, with 11 (61.1% in the age bracket) enrolled. Conversely, the age group of 3 to 4 year olds has the lowest likelihood of being enrolled in a private school, with 27 (100.0% in the age bracket) attending a public institution.

| Age Bracket | Public School | Private School |
| 3 to 4 Year Olds | 27 (100.0%) | 0 (0.0%) |
| 5 to 9 Year Old | 129 (89.6%) | 15 (10.4%) |
| 10 to 14 Year Olds | 80 (87.0%) | 12 (13.0%) |
| 15 to 17 Year Olds | 45 (75.0%) | 15 (25.0%) |
| 18 to 19 Year Olds | 7 (77.8%) | 2 (22.2%) |
| 20 to 24 Year Olds | 37 (88.1%) | 5 (11.9%) |
| 25 to 34 Year Olds | 7 (38.9%) | 11 (61.1%) |
| 35 Years and over | 10 (66.7%) | 5 (33.3%) |
| Total | 342 (84.0%) | 65 (16.0%) |
Educational Attainment by Field of Study in Hettinger County
Business (61 | 17.8%), bio, nature & agricultural (59 | 17.2%), education (48 | 14.0%), arts & humanities (43 | 12.5%), and liberal arts & history (26 | 7.6%) are the most common fields of study among 343 individuals in Hettinger County who have obtained a bachelor's degree or higher.

| Field of Study | # Graduates | % Graduates |
| Computers & Mathematics | 15 | 4.4% |
| Bio, Nature & Agricultural | 59 | 17.2% |
| Physical & Health Sciences | 0 | 0.0% |
| Psychology | 16 | 4.7% |
| Social Sciences | 12 | 3.5% |
| Engineering | 18 | 5.2% |
| Multidisciplinary Studies | 0 | 0.0% |
| Science & Technology | 11 | 3.2% |
| Business | 61 | 17.8% |
| Education | 48 | 14.0% |
| Literature & Languages | 11 | 3.2% |
| Liberal Arts & History | 26 | 7.6% |
| Visual & Performing Arts | 21 | 6.1% |
| Communications | 2 | 0.6% |
| Arts & Humanities | 43 | 12.5% |
| Total | 343 | 100.0% |
Transportation & Commute in Hettinger County
Vehicle Availability by Sex in Hettinger County
The most prevalent vehicle ownership categories in Hettinger County are males with 3 vehicles (182, accounting for 28.4%) and females with 3 vehicles (119, making up 37.9%).
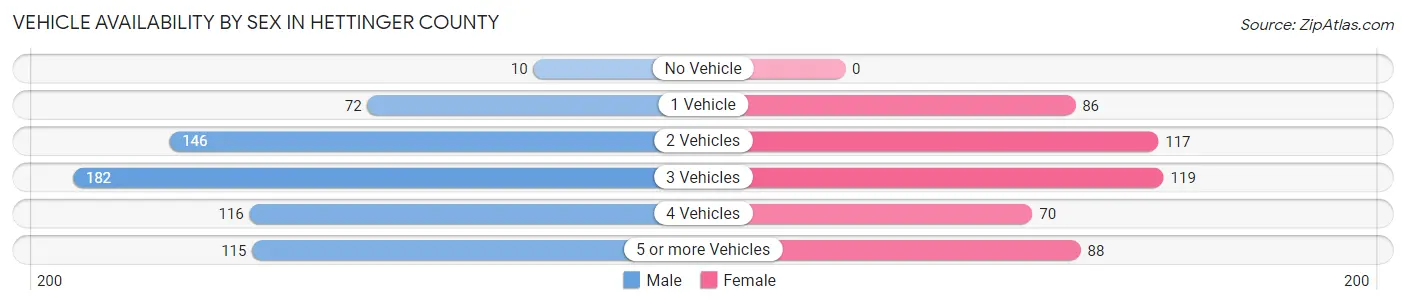
| Vehicles Available | Male | Female |
| No Vehicle | 10 (1.6%) | 0 (0.0%) |
| 1 Vehicle | 72 (11.2%) | 86 (17.9%) |
| 2 Vehicles | 146 (22.8%) | 117 (24.4%) |
| 3 Vehicles | 182 (28.4%) | 119 (24.8%) |
| 4 Vehicles | 116 (18.1%) | 70 (14.6%) |
| 5 or more Vehicles | 115 (17.9%) | 88 (18.3%) |
| Total | 641 (100.0%) | 480 (100.0%) |
Commute Time in Hettinger County
The most frequently occuring commute durations in Hettinger County are less than 5 minutes (239 commuters, 23.9%), 5 to 9 minutes (201 commuters, 20.1%), and 15 to 19 minutes (133 commuters, 13.3%).

| Commute Time | # Commuters | % Commuters |
| Less than 5 Minutes | 239 | 23.9% |
| 5 to 9 Minutes | 201 | 20.1% |
| 10 to 14 Minutes | 91 | 9.1% |
| 15 to 19 Minutes | 133 | 13.3% |
| 20 to 24 Minutes | 71 | 7.1% |
| 25 to 29 Minutes | 39 | 3.9% |
| 30 to 34 Minutes | 106 | 10.6% |
| 35 to 39 Minutes | 34 | 3.4% |
| 40 to 44 Minutes | 7 | 0.7% |
| 45 to 59 Minutes | 34 | 3.4% |
| 60 to 89 Minutes | 39 | 3.9% |
| 90 or more Minutes | 5 | 0.5% |
Commute Time by Sex in Hettinger County
The most common commute times in Hettinger County are 5 to 9 minutes (128 commuters, 22.1%) for males and less than 5 minutes (132 commuters, 31.4%) for females.

| Commute Time | Male | Female |
| Less than 5 Minutes | 107 (18.5%) | 132 (31.4%) |
| 5 to 9 Minutes | 128 (22.1%) | 73 (17.4%) |
| 10 to 14 Minutes | 65 (11.2%) | 26 (6.2%) |
| 15 to 19 Minutes | 76 (13.1%) | 57 (13.6%) |
| 20 to 24 Minutes | 49 (8.5%) | 22 (5.2%) |
| 25 to 29 Minutes | 14 (2.4%) | 25 (5.9%) |
| 30 to 34 Minutes | 70 (12.1%) | 36 (8.6%) |
| 35 to 39 Minutes | 12 (2.1%) | 22 (5.2%) |
| 40 to 44 Minutes | 1 (0.2%) | 6 (1.4%) |
| 45 to 59 Minutes | 22 (3.8%) | 12 (2.9%) |
| 60 to 89 Minutes | 32 (5.5%) | 7 (1.7%) |
| 90 or more Minutes | 3 (0.5%) | 2 (0.5%) |
Time of Departure to Work by Sex in Hettinger County
The most frequent times of departure to work in Hettinger County are 6:00 AM to 6:29 AM (132, 22.8%) for males and 7:30 AM to 7:59 AM (137, 32.6%) for females.

| Time of Departure | Male | Female |
| 12:00 AM to 4:59 AM | 27 (4.7%) | 3 (0.7%) |
| 5:00 AM to 5:29 AM | 49 (8.5%) | 34 (8.1%) |
| 5:30 AM to 5:59 AM | 46 (7.9%) | 0 (0.0%) |
| 6:00 AM to 6:29 AM | 132 (22.8%) | 56 (13.3%) |
| 6:30 AM to 6:59 AM | 52 (9.0%) | 48 (11.4%) |
| 7:00 AM to 7:29 AM | 114 (19.7%) | 62 (14.8%) |
| 7:30 AM to 7:59 AM | 72 (12.4%) | 137 (32.6%) |
| 8:00 AM to 8:29 AM | 43 (7.4%) | 36 (8.6%) |
| 8:30 AM to 8:59 AM | 10 (1.7%) | 8 (1.9%) |
| 9:00 AM to 9:59 AM | 11 (1.9%) | 8 (1.9%) |
| 10:00 AM to 10:59 AM | 0 (0.0%) | 13 (3.1%) |
| 11:00 AM to 11:59 AM | 4 (0.7%) | 0 (0.0%) |
| 12:00 PM to 3:59 PM | 12 (2.1%) | 12 (2.9%) |
| 4:00 PM to 11:59 PM | 7 (1.2%) | 3 (0.7%) |
| Total | 579 (100.0%) | 420 (100.0%) |
Housing Occupancy in Hettinger County
Occupancy by Ownership in Hettinger County
Of the total 1,055 dwellings in Hettinger County, owner-occupied units account for 819 (77.6%), while renter-occupied units make up 236 (22.4%).
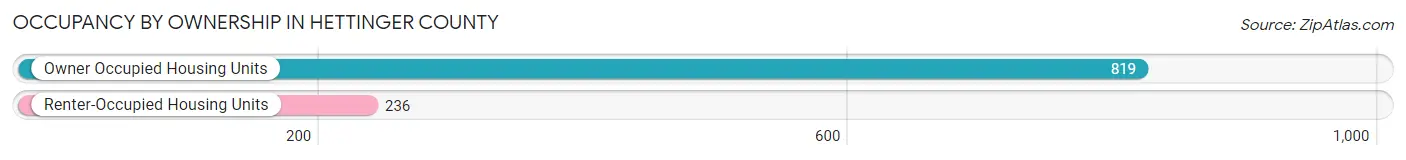
| Occupancy | # Housing Units | % Housing Units |
| Owner Occupied Housing Units | 819 | 77.6% |
| Renter-Occupied Housing Units | 236 | 22.4% |
| Total Occupied Housing Units | 1,055 | 100.0% |
Occupancy by Household Size in Hettinger County
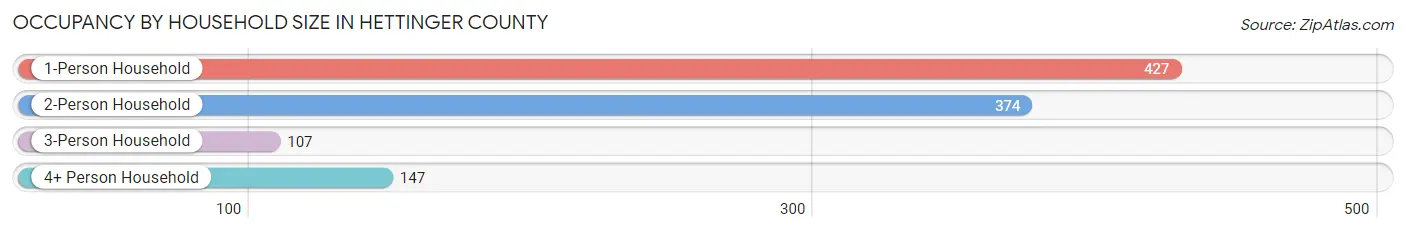
| Household Size | # Housing Units | % Housing Units |
| 1-Person Household | 427 | 40.5% |
| 2-Person Household | 374 | 35.4% |
| 3-Person Household | 107 | 10.1% |
| 4+ Person Household | 147 | 13.9% |
| Total Housing Units | 1,055 | 100.0% |
Occupancy by Ownership by Household Size in Hettinger County

| Household Size | Owner-occupied | Renter-occupied |
| 1-Person Household | 304 (71.2%) | 123 (28.8%) |
| 2-Person Household | 315 (84.2%) | 59 (15.8%) |
| 3-Person Household | 79 (73.8%) | 28 (26.2%) |
| 4+ Person Household | 121 (82.3%) | 26 (17.7%) |
| Total Housing Units | 819 (77.6%) | 236 (22.4%) |
Occupancy by Educational Attainment in Hettinger County

| Household Size | Owner-occupied | Renter-occupied |
| Less than High School | 84 (68.3%) | 39 (31.7%) |
| High School Diploma | 280 (77.3%) | 82 (22.7%) |
| College/Associate Degree | 257 (74.3%) | 89 (25.7%) |
| Bachelor's Degree or higher | 198 (88.4%) | 26 (11.6%) |
Occupancy by Age of Householder in Hettinger County

| Age Bracket | # Households | % Households |
| Under 35 Years | 183 | 17.3% |
| 35 to 44 Years | 127 | 12.0% |
| 45 to 54 Years | 118 | 11.2% |
| 55 to 64 Years | 185 | 17.5% |
| 65 to 74 Years | 226 | 21.4% |
| 75 to 84 Years | 138 | 13.1% |
| 85 Years and Over | 78 | 7.4% |
| Total | 1,055 | 100.0% |
Housing Finances in Hettinger County
Median Income by Occupancy in Hettinger County

| Occupancy Type | # Households | Median Income |
| Owner-Occupied | 819 (77.6%) | $71,078 |
| Renter-Occupied | 236 (22.4%) | $39,352 |
| Average | 1,055 (100.0%) | $66,797 |
Occupancy by Householder Income Bracket in Hettinger County

| Income Bracket | Owner-occupied | Renter-occupied |
| Less than $5,000 | 35 (4.3%) | 2 (0.9%) |
| $5,000 to $9,999 | 10 (1.2%) | 10 (4.2%) |
| $10,000 to $14,999 | 57 (7.0%) | 14 (5.9%) |
| $15,000 to $19,999 | 44 (5.4%) | 20 (8.5%) |
| $20,000 to $24,999 | 37 (4.5%) | 26 (11.0%) |
| $25,000 to $34,999 | 54 (6.6%) | 25 (10.6%) |
| $35,000 to $49,999 | 55 (6.7%) | 61 (25.9%) |
| $50,000 to $74,999 | 146 (17.8%) | 33 (14.0%) |
| $75,000 to $99,999 | 125 (15.3%) | 20 (8.5%) |
| $100,000 to $149,999 | 155 (18.9%) | 20 (8.5%) |
| $150,000 or more | 101 (12.3%) | 5 (2.1%) |
| Total | 819 (100.0%) | 236 (100.0%) |
Monthly Housing Cost Tiers in Hettinger County

| Monthly Cost | Owner-occupied | Renter-occupied |
| Less than $300 | 124 (15.1%) | 14 (5.9%) |
| $300 to $499 | 273 (33.3%) | 12 (5.1%) |
| $500 to $799 | 133 (16.2%) | 56 (23.7%) |
| $800 to $999 | 76 (9.3%) | 33 (14.0%) |
| $1,000 to $1,499 | 113 (13.8%) | 71 (30.1%) |
| $1,500 to $1,999 | 41 (5.0%) | 0 (0.0%) |
| $2,000 to $2,499 | 46 (5.6%) | 0 (0.0%) |
| $2,500 to $2,999 | 3 (0.4%) | 0 (0.0%) |
| $3,000 or more | 10 (1.2%) | 0 (0.0%) |
| Total | 819 (100.0%) | 236 (100.0%) |
Physical Housing Characteristics in Hettinger County
Housing Structures in Hettinger County
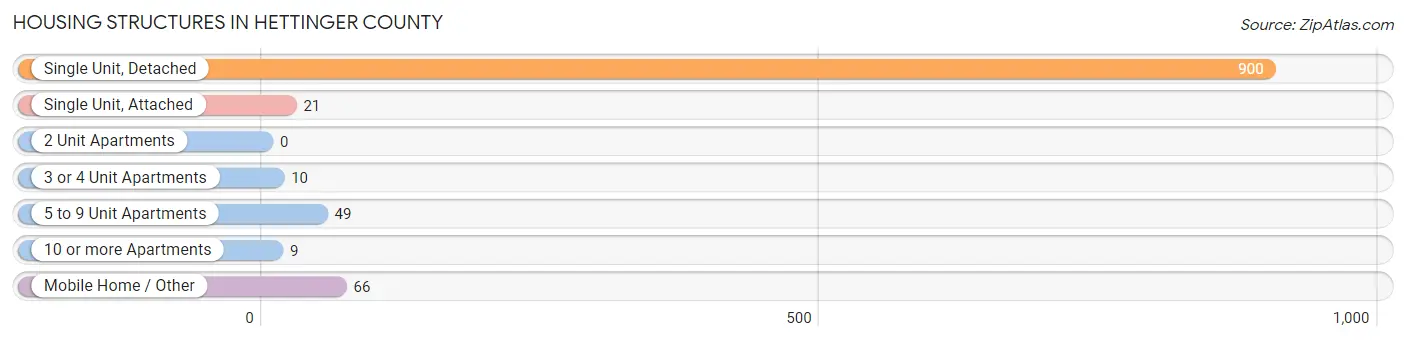
| Structure Type | # Housing Units | % Housing Units |
| Single Unit, Detached | 900 | 85.3% |
| Single Unit, Attached | 21 | 2.0% |
| 2 Unit Apartments | 0 | 0.0% |
| 3 or 4 Unit Apartments | 10 | 0.9% |
| 5 to 9 Unit Apartments | 49 | 4.6% |
| 10 or more Apartments | 9 | 0.9% |
| Mobile Home / Other | 66 | 6.3% |
| Total | 1,055 | 100.0% |
Housing Structures by Occupancy in Hettinger County

| Structure Type | Owner-occupied | Renter-occupied |
| Single Unit, Detached | 746 (82.9%) | 154 (17.1%) |
| Single Unit, Attached | 5 (23.8%) | 16 (76.2%) |
| 2 Unit Apartments | 0 (0.0%) | 0 (0.0%) |
| 3 or 4 Unit Apartments | 0 (0.0%) | 10 (100.0%) |
| 5 to 9 Unit Apartments | 0 (0.0%) | 49 (100.0%) |
| 10 or more Apartments | 3 (33.3%) | 6 (66.7%) |
| Mobile Home / Other | 65 (98.5%) | 1 (1.5%) |
| Total | 819 (77.6%) | 236 (22.4%) |
Housing Structures by Number of Rooms in Hettinger County

| Number of Rooms | Owner-occupied | Renter-occupied |
| 1 Room | 0 (0.0%) | 11 (4.7%) |
| 2 or 3 Rooms | 19 (2.3%) | 35 (14.8%) |
| 4 or 5 Rooms | 185 (22.6%) | 77 (32.6%) |
| 6 or 7 Rooms | 345 (42.1%) | 87 (36.9%) |
| 8 or more Rooms | 270 (33.0%) | 26 (11.0%) |
| Total | 819 (100.0%) | 236 (100.0%) |
Housing Structure by Heating Type in Hettinger County

| Heating Type | Owner-occupied | Renter-occupied |
| Utility Gas | 428 (52.3%) | 109 (46.2%) |
| Bottled, Tank, or LP Gas | 159 (19.4%) | 11 (4.7%) |
| Electricity | 185 (22.6%) | 109 (46.2%) |
| Fuel Oil or Kerosene | 14 (1.7%) | 0 (0.0%) |
| Coal or Coke | 0 (0.0%) | 0 (0.0%) |
| All other Fuels | 30 (3.7%) | 7 (3.0%) |
| No Fuel Used | 3 (0.4%) | 0 (0.0%) |
| Total | 819 (100.0%) | 236 (100.0%) |
Household Vehicle Usage in Hettinger County

| Vehicles per Household | Owner-occupied | Renter-occupied |
| No Vehicle | 4 (0.5%) | 18 (7.6%) |
| 1 Vehicle | 149 (18.2%) | 139 (58.9%) |
| 2 Vehicles | 268 (32.7%) | 23 (9.8%) |
| 3 or more Vehicles | 398 (48.6%) | 56 (23.7%) |
| Total | 819 (100.0%) | 236 (100.0%) |
Real Estate & Mortgages in Hettinger County
Real Estate and Mortgage Overview in Hettinger County
| Characteristic | Without Mortgage | With Mortgage |
| Housing Units | 523 | 296 |
| Median Property Value | $92,700 | $136,400 |
| Median Household Income | $65,156 | $43 |
| Monthly Housing Costs | $395 | $10 |
| Real Estate Taxes | $1,130 | $7 |
Property Value by Mortgage Status in Hettinger County

| Property Value | Without Mortgage | With Mortgage |
| Less than $50,000 | 96 (18.4%) | 38 (12.8%) |
| $50,000 to $99,999 | 194 (37.1%) | 37 (12.5%) |
| $100,000 to $299,999 | 163 (31.2%) | 183 (61.8%) |
| $300,000 to $499,999 | 60 (11.5%) | 38 (12.8%) |
| $500,000 to $749,999 | 6 (1.1%) | 0 (0.0%) |
| $750,000 to $999,999 | 0 (0.0%) | 0 (0.0%) |
| $1,000,000 or more | 4 (0.8%) | 0 (0.0%) |
| Total | 523 (100.0%) | 296 (100.0%) |
Household Income by Mortgage Status in Hettinger County

| Household Income | Without Mortgage | With Mortgage |
| Less than $10,000 | 35 (6.7%) | 3 (1.0%) |
| $10,000 to $24,999 | 128 (24.5%) | 10 (3.4%) |
| $25,000 to $34,999 | 43 (8.2%) | 10 (3.4%) |
| $35,000 to $49,999 | 37 (7.1%) | 11 (3.7%) |
| $50,000 to $74,999 | 85 (16.3%) | 18 (6.1%) |
| $75,000 to $99,999 | 69 (13.2%) | 61 (20.6%) |
| $100,000 to $149,999 | 68 (13.0%) | 56 (18.9%) |
| $150,000 or more | 58 (11.1%) | 87 (29.4%) |
| Total | 523 (100.0%) | 296 (100.0%) |
Property Value to Household Income Ratio in Hettinger County

| Value-to-Income Ratio | Without Mortgage | With Mortgage |
| Less than 2.0x | 283 (54.1%) | 92,857 (31,370.6%) |
| 2.0x to 2.9x | 40 (7.6%) | 196 (66.2%) |
| 3.0x to 3.9x | 44 (8.4%) | 52 (17.6%) |
| 4.0x or more | 153 (29.2%) | 21 (7.1%) |
| Total | 523 (100.0%) | 296 (100.0%) |
Real Estate Taxes by Mortgage Status in Hettinger County

| Property Taxes | Without Mortgage | With Mortgage |
| Less than $800 | 140 (26.8%) | 0 (0.0%) |
| $800 to $1,499 | 188 (35.9%) | 80 (27.0%) |
| $800 to $1,499 | 134 (25.6%) | 86 (29.0%) |
| Total | 523 (100.0%) | 296 (100.0%) |
Health & Disability in Hettinger County
Health Insurance Coverage by Age in Hettinger County

| Age Bracket | With Coverage | Without Coverage |
| Under 6 Years | 144 (80.4%) | 35 (19.6%) |
| 6 to 18 Years | 261 (86.7%) | 40 (13.3%) |
| 19 to 25 Years | 126 (74.1%) | 44 (25.9%) |
| 26 to 34 Years | 234 (86.4%) | 37 (13.7%) |
| 35 to 44 Years | 215 (92.3%) | 18 (7.7%) |
| 45 to 54 Years | 183 (96.8%) | 6 (3.2%) |
| 55 to 64 Years | 337 (92.8%) | 26 (7.2%) |
| 65 to 74 Years | 304 (100.0%) | 0 (0.0%) |
| 75 Years and older | 302 (100.0%) | 0 (0.0%) |
| Total | 2,106 (91.1%) | 206 (8.9%) |
Health Insurance Coverage by Citizenship Status in Hettinger County

| Citizenship Status | With Coverage | Without Coverage |
| Native Born | 144 (80.4%) | 35 (19.6%) |
| Foreign Born, Citizen | 261 (86.7%) | 40 (13.3%) |
| Foreign Born, not a Citizen | 126 (74.1%) | 44 (25.9%) |
Health Insurance Coverage by Household Income in Hettinger County

| Household Income | With Coverage | Without Coverage |
| Under $25,000 | 296 (95.2%) | 15 (4.8%) |
| $25,000 to $49,999 | 325 (97.9%) | 7 (2.1%) |
| $50,000 to $74,999 | 340 (78.3%) | 94 (21.7%) |
| $75,000 to $99,999 | 314 (97.8%) | 7 (2.2%) |
| $100,000 and over | 831 (90.9%) | 83 (9.1%) |
Public vs Private Health Insurance Coverage by Age in Hettinger County

| Age Bracket | Public Insurance | Private Insurance |
| Under 6 | 38 (21.2%) | 128 (71.5%) |
| 6 to 18 Years | 37 (12.3%) | 224 (74.4%) |
| 19 to 25 Years | 15 (8.8%) | 111 (65.3%) |
| 25 to 34 Years | 32 (11.8%) | 210 (77.5%) |
| 35 to 44 Years | 14 (6.0%) | 207 (88.8%) |
| 45 to 54 Years | 47 (24.9%) | 143 (75.7%) |
| 55 to 64 Years | 91 (25.1%) | 282 (77.7%) |
| 65 to 74 Years | 290 (95.4%) | 202 (66.4%) |
| 75 Years and over | 299 (99.0%) | 243 (80.5%) |
| Total | 863 (37.3%) | 1,750 (75.7%) |
Disability Status by Sex by Age in Hettinger County

| Age Bracket | Male | Female |
| Under 5 Years | 0 (0.0%) | 0 (0.0%) |
| 5 to 17 Years | 0 (0.0%) | 6 (3.5%) |
| 18 to 34 Years | 46 (18.0%) | 17 (8.7%) |
| 35 to 64 Years | 56 (14.0%) | 77 (20.0%) |
| 65 to 74 Years | 45 (25.0%) | 28 (22.6%) |
| 75 Years and over | 49 (39.8%) | 106 (59.2%) |
Disability Class by Sex by Age in Hettinger County
Disability Class: Hearing Difficulty

| Age Bracket | Male | Female |
| Under 5 Years | 0 (0.0%) | 0 (0.0%) |
| 5 to 17 Years | 0 (0.0%) | 3 (1.7%) |
| 18 to 34 Years | 0 (0.0%) | 0 (0.0%) |
| 35 to 64 Years | 17 (4.3%) | 12 (3.1%) |
| 65 to 74 Years | 17 (9.4%) | 8 (6.5%) |
| 75 Years and over | 33 (26.8%) | 47 (26.3%) |
Disability Class: Vision Difficulty

| Age Bracket | Male | Female |
| Under 5 Years | 0 (0.0%) | 0 (0.0%) |
| 5 to 17 Years | 0 (0.0%) | 3 (1.7%) |
| 18 to 34 Years | 0 (0.0%) | 0 (0.0%) |
| 35 to 64 Years | 0 (0.0%) | 6 (1.5%) |
| 65 to 74 Years | 0 (0.0%) | 5 (4.0%) |
| 75 Years and over | 9 (7.3%) | 28 (15.6%) |
Disability Class: Cognitive Difficulty
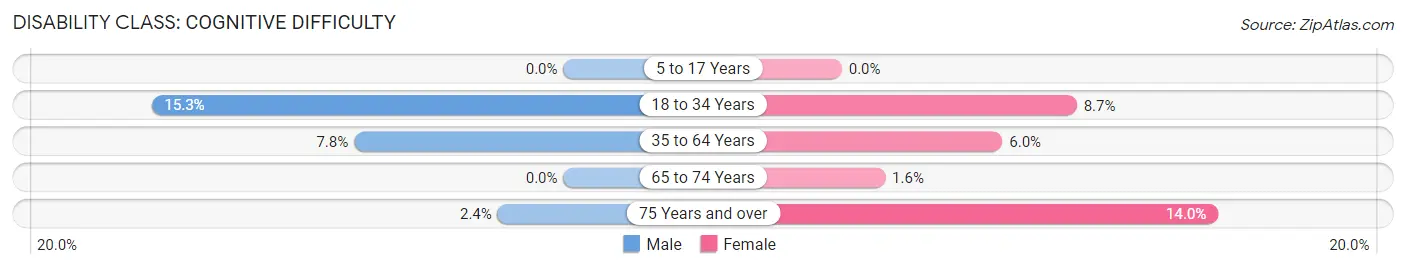
| Age Bracket | Male | Female |
| 5 to 17 Years | 0 (0.0%) | 0 (0.0%) |
| 18 to 34 Years | 39 (15.3%) | 17 (8.7%) |
| 35 to 64 Years | 31 (7.8%) | 23 (6.0%) |
| 65 to 74 Years | 0 (0.0%) | 2 (1.6%) |
| 75 Years and over | 3 (2.4%) | 25 (14.0%) |
Disability Class: Ambulatory Difficulty

| Age Bracket | Male | Female |
| 5 to 17 Years | 0 (0.0%) | 0 (0.0%) |
| 18 to 34 Years | 12 (4.7%) | 0 (0.0%) |
| 35 to 64 Years | 30 (7.5%) | 57 (14.8%) |
| 65 to 74 Years | 39 (21.7%) | 19 (15.3%) |
| 75 Years and over | 21 (17.1%) | 55 (30.7%) |
Disability Class: Self-Care Difficulty

| Age Bracket | Male | Female |
| 5 to 17 Years | 0 (0.0%) | 0 (0.0%) |
| 18 to 34 Years | 5 (2.0%) | 0 (0.0%) |
| 35 to 64 Years | 7 (1.8%) | 21 (5.4%) |
| 65 to 74 Years | 6 (3.3%) | 4 (3.2%) |
| 75 Years and over | 4 (3.3%) | 16 (8.9%) |
Technology Access in Hettinger County
Computing Device Access in Hettinger County

| Device Type | # Households | % Households |
| Desktop or Laptop | 736 | 69.8% |
| Smartphone | 786 | 74.5% |
| Tablet | 569 | 53.9% |
| No Computing Device | 150 | 14.2% |
| Total | 1,055 | 100.0% |
Internet Access in Hettinger County

| Internet Type | # Households | % Households |
| Dial-Up Internet | 1 | 0.1% |
| Broadband Home | 790 | 74.9% |
| Cellular Data Only | 47 | 4.4% |
| Satellite Internet | 61 | 5.8% |
| No Internet | 208 | 19.7% |
| Total | 1,055 | 100.0% |
Hettinger County Summary
Hettinger County is located in the southwestern corner of North Dakota, and is bordered by South Dakota to the south and Montana to the west. It is part of the Badlands region of the state, and is home to the Theodore Roosevelt National Park. The county was established in 1883 and named after the town of Hettinger, which was named after a German immigrant, John Hettinger. The county has a total area of 1,845 square miles, and a population of 2,845 as of the 2020 census.
Geography
Hettinger County is located in the Badlands region of North Dakota, and is characterized by rolling hills, grasslands, and rugged terrain. The county is home to the Theodore Roosevelt National Park, which is a popular tourist destination. The park is home to a variety of wildlife, including bison, elk, and prairie dogs. The county is also home to the Little Missouri National Grassland, which is a popular destination for camping, hiking, and fishing.
The county is located in the Missouri River Basin, and is drained by the Little Missouri River and its tributaries. The county is also home to several lakes, including Lake Tschida, Lake Sakakawea, and Lake Oahe.
Economy
Hettinger County is largely rural, and the economy is largely based on agriculture. The county is home to several large farms, and the main crops grown in the county are wheat, corn, and soybeans. The county is also home to several oil and gas wells, and the county is a major producer of oil and gas.
The county is also home to several small businesses, including restaurants, retail stores, and service providers. The county is home to several small manufacturing companies, and the county is home to several small-scale renewable energy projects.
Demographics
As of the 2020 census, Hettinger County had a population of 2,845. The population is largely white, with a small Native American population. The median household income in the county is $45,000, and the median home value is $150,000. The county has a poverty rate of 11.3%, and the unemployment rate is 3.2%.
Conclusion
Hettinger County is a rural county located in the Badlands region of North Dakota. The county is home to the Theodore Roosevelt National Park, and is a popular destination for tourists. The economy of the county is largely based on agriculture, and the county is also home to several small businesses and manufacturing companies. The population of the county is largely white, with a small Native American population. The median household income in the county is $45,000, and the median home value is $150,000. The county has a poverty rate of 11.3%, and the unemployment rate is 3.2%.
Common Questions
What is the Total Population of Hettinger County?
Total Population of Hettinger County is 2,477.
What is the Total Male Population of Hettinger County?
Total Male Population of Hettinger County is 1,183.
What is the Total Female Population of Hettinger County?
Total Female Population of Hettinger County is 1,294.
What is the Ratio of Males per 100 Females in Hettinger County?
There are 91.42 Males per 100 Females in Hettinger County.
What is the Ratio of Females per 100 Males in Hettinger County?
There are 109.38 Females per 100 Males in Hettinger County.
What is the Median Population Age in Hettinger County?
Median Population Age in Hettinger County is 41.3 Years.
What is the Average Family Size in Hettinger County
Average Family Size in Hettinger County is 3.0 People.
What is the Average Household Size in Hettinger County
Average Household Size in Hettinger County is 2.2 People.
What is Per Capita Income in Hettinger County?
Per Capita income in Hettinger County is $40,931.
What is the Median Family Income in Hettinger County?
Median Family Income in Hettinger County is $85,000.
What is the Median Household income in Hettinger County?
Median Household Income in Hettinger County is $66,797.
What is Income or Wage Gap in Hettinger County?
Income or Wage Gap in Hettinger County is 50.3%.
Women in Hettinger County earn 49.7 cents for every dollar earned by a man.
What is Inequality or Gini Index in Hettinger County?
Inequality or Gini Index in Hettinger County is 0.50.
How Large is the Labor Force in Hettinger County?
There are 1,194 People in the Labor Forcein in Hettinger County.
What is the Percentage of People in the Labor Force in Hettinger County?
58.2% of People are in the Labor Force in Hettinger County.
What is the Unemployment Rate in Hettinger County?
Unemployment Rate in Hettinger County is 4.2%.