Grand Forks County, ND
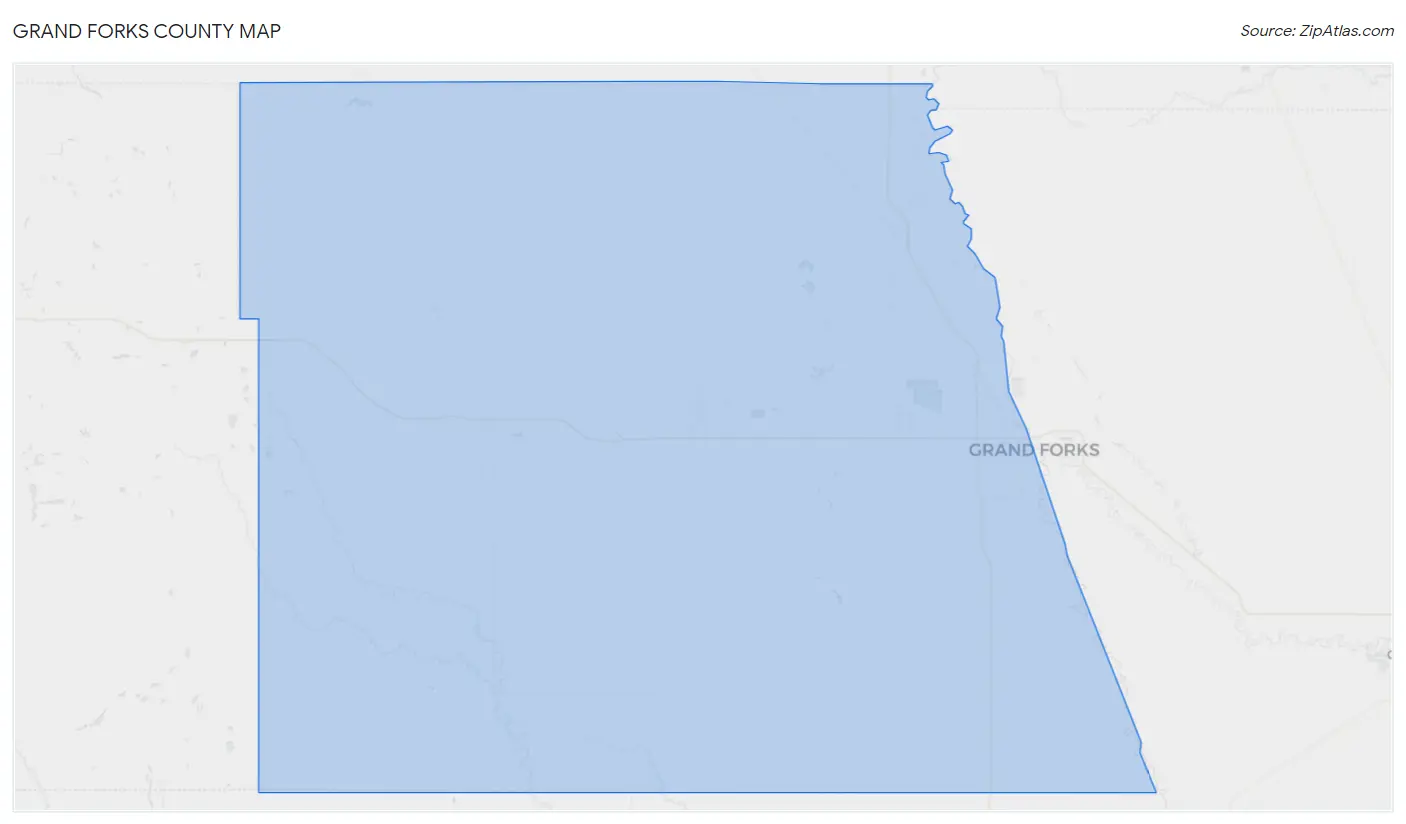
Grand Forks County Map
Grand Forks County Overview
72,927
TOTAL POPULATION
37,845
MALE POPULATION
35,082
FEMALE POPULATION
107.88
MALES / 100 FEMALES
92.70
FEMALES / 100 MALES
30.3
MEDIAN AGE
3.0
AVG FAMILY SIZE
2.2
AVG HOUSEHOLD SIZE
$37,159
PER CAPITA INCOME
$94,149
AVG FAMILY INCOME
$64,698
AVG HOUSEHOLD INCOME
28.0%
WAGE / INCOME GAP [ % ]
72.0¢/ $1
WAGE / INCOME GAP [ $ ]
$10,108
FAMILY INCOME DEFICIT
0.46
INEQUALITY / GINI INDEX
42,255
LABOR FORCE [ PEOPLE ]
71.3%
PERCENT IN LABOR FORCE
3.4%
UNEMPLOYMENT RATE
Grand Forks County Area Codes
Race in Grand Forks County
The most populous races in Grand Forks County are White / Caucasian (61,283 | 84.0%), Two or more Races (3,825 | 5.2%), and Hispanic or Latino (3,482 | 4.8%).
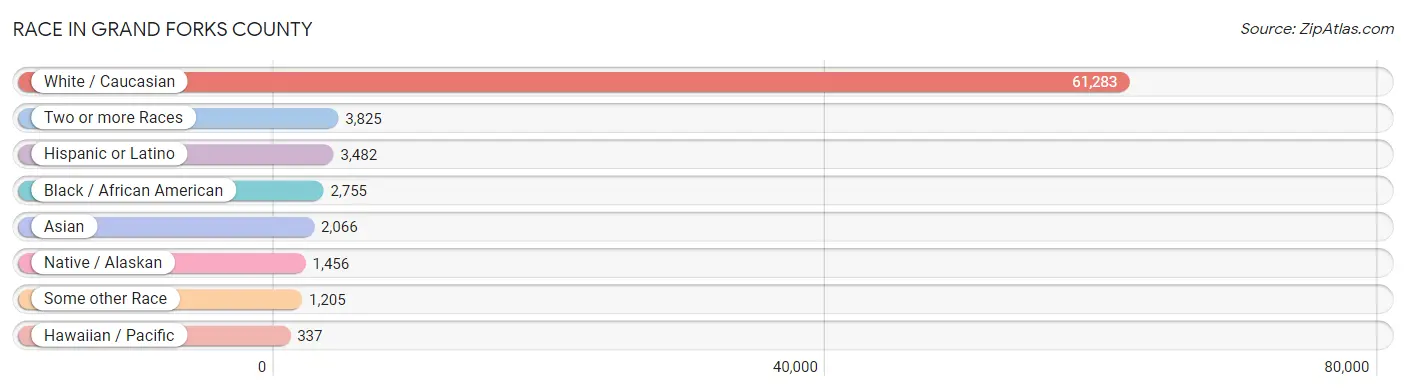
| Race | # Population | % Population |
| Asian | 2,066 | 2.8% |
| Black / African American | 2,755 | 3.8% |
| Hawaiian / Pacific | 337 | 0.5% |
| Hispanic or Latino | 3,482 | 4.8% |
| Native / Alaskan | 1,456 | 2.0% |
| White / Caucasian | 61,283 | 84.0% |
| Two or more Races | 3,825 | 5.2% |
| Some other Race | 1,205 | 1.7% |
| Total | 72,927 | 100.0% |
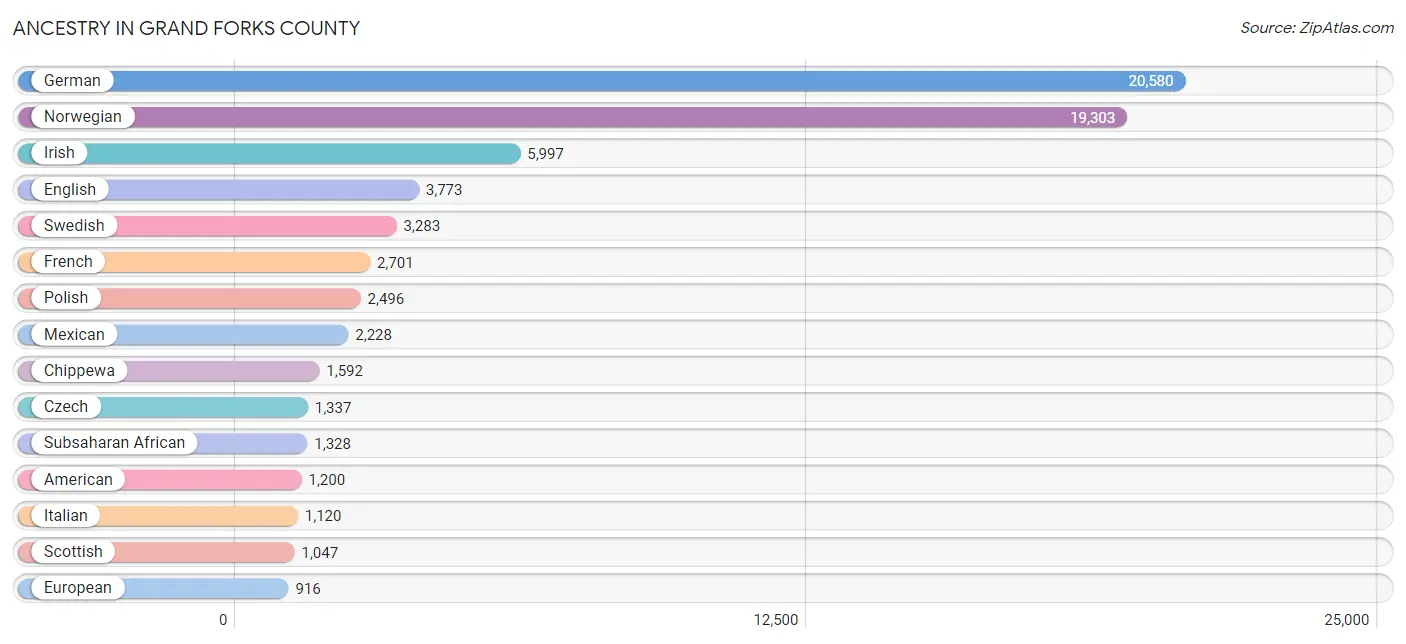
Ancestry in Grand Forks County
The most populous ancestries reported in Grand Forks County are German (20,580 | 28.2%), Norwegian (19,303 | 26.5%), Irish (5,997 | 8.2%), English (3,773 | 5.2%), and Swedish (3,283 | 4.5%), together accounting for 72.6% of all Grand Forks County residents.
| Ancestry | # Population | % Population |
| African | 472 | 0.6% |
| Albanian | 57 | 0.1% |
| American | 1,200 | 1.7% |
| Apache | 65 | 0.1% |
| Arab | 509 | 0.7% |
| Armenian | 7 | 0.0% |
| Australian | 5 | 0.0% |
| Austrian | 57 | 0.1% |
| Bangladeshi | 19 | 0.0% |
| Belgian | 40 | 0.1% |
| Bhutanese | 342 | 0.5% |
| Brazilian | 15 | 0.0% |
| British | 234 | 0.3% |
| British West Indian | 66 | 0.1% |
| Burmese | 353 | 0.5% |
| Cambodian | 18 | 0.0% |
| Canadian | 134 | 0.2% |
| Celtic | 42 | 0.1% |
| Central American | 75 | 0.1% |
| Central American Indian | 29 | 0.0% |
| Cherokee | 23 | 0.0% |
| Chilean | 103 | 0.1% |
| Chippewa | 1,592 | 2.2% |
| Choctaw | 4 | 0.0% |
| Colombian | 297 | 0.4% |
| Creek | 4 | 0.0% |
| Croatian | 33 | 0.1% |
| Cuban | 82 | 0.1% |
| Czech | 1,337 | 1.8% |
| Czechoslovakian | 189 | 0.3% |
| Danish | 772 | 1.1% |
| Dominican | 21 | 0.0% |
| Dutch | 588 | 0.8% |
| Eastern European | 129 | 0.2% |
| Ecuadorian | 35 | 0.1% |
| Egyptian | 84 | 0.1% |
| English | 3,773 | 5.2% |
| Estonian | 11 | 0.0% |
| Ethiopian | 44 | 0.1% |
| European | 916 | 1.3% |
| Fijian | 8 | 0.0% |
| Finnish | 311 | 0.4% |
| French | 2,701 | 3.7% |
| French American Indian | 11 | 0.0% |
| French Canadian | 832 | 1.1% |
| German | 20,580 | 28.2% |
| German Russian | 36 | 0.1% |
| Ghanaian | 26 | 0.0% |
| Greek | 93 | 0.1% |
| Honduran | 15 | 0.0% |
| Hungarian | 33 | 0.1% |
| Icelander | 633 | 0.9% |
| Indian (Asian) | 523 | 0.7% |
| Inupiat | 11 | 0.0% |
| Iranian | 135 | 0.2% |
| Irish | 5,997 | 8.2% |
| Iroquois | 54 | 0.1% |
| Italian | 1,120 | 1.5% |
| Jamaican | 152 | 0.2% |
| Jordanian | 5 | 0.0% |
| Kenyan | 16 | 0.0% |
| Korean | 615 | 0.8% |
| Lebanese | 105 | 0.1% |
| Liberian | 8 | 0.0% |
| Lithuanian | 64 | 0.1% |
| Luxembourger | 18 | 0.0% |
| Mexican | 2,228 | 3.1% |
| Mexican American Indian | 59 | 0.1% |
| Mongolian | 33 | 0.1% |
| Native Hawaiian | 364 | 0.5% |
| Navajo | 109 | 0.2% |
| Nicaraguan | 10 | 0.0% |
| Nigerian | 257 | 0.4% |
| Northern European | 105 | 0.1% |
| Norwegian | 19,303 | 26.5% |
| Pakistani | 7 | 0.0% |
| Palestinian | 20 | 0.0% |
| Panamanian | 28 | 0.0% |
| Peruvian | 15 | 0.0% |
| Polish | 2,496 | 3.4% |
| Portuguese | 69 | 0.1% |
| Pueblo | 16 | 0.0% |
| Puerto Rican | 397 | 0.5% |
| Romanian | 25 | 0.0% |
| Russian | 579 | 0.8% |
| Salvadoran | 22 | 0.0% |
| Samoan | 18 | 0.0% |
| Scandinavian | 900 | 1.2% |
| Scotch-Irish | 384 | 0.5% |
| Scottish | 1,047 | 1.4% |
| Seminole | 12 | 0.0% |
| Serbian | 38 | 0.1% |
| Shoshone | 31 | 0.0% |
| Sioux | 585 | 0.8% |
| Slavic | 26 | 0.0% |
| Slovak | 140 | 0.2% |
| Somali | 383 | 0.5% |
| South African | 19 | 0.0% |
| South American | 456 | 0.6% |
| South American Indian | 91 | 0.1% |
| Spaniard | 79 | 0.1% |
| Spanish | 94 | 0.1% |
| Sri Lankan | 133 | 0.2% |
| Subsaharan African | 1,328 | 1.8% |
| Sudanese | 42 | 0.1% |
| Swedish | 3,283 | 4.5% |
| Swiss | 63 | 0.1% |
| Syrian | 5 | 0.0% |
| Thai | 286 | 0.4% |
| Trinidadian and Tobagonian | 6 | 0.0% |
| Turkish | 41 | 0.1% |
| Ukrainian | 233 | 0.3% |
| Venezuelan | 6 | 0.0% |
| Vietnamese | 178 | 0.2% |
| Welsh | 392 | 0.5% |
| Yugoslavian | 165 | 0.2% | View All 116 Rows |
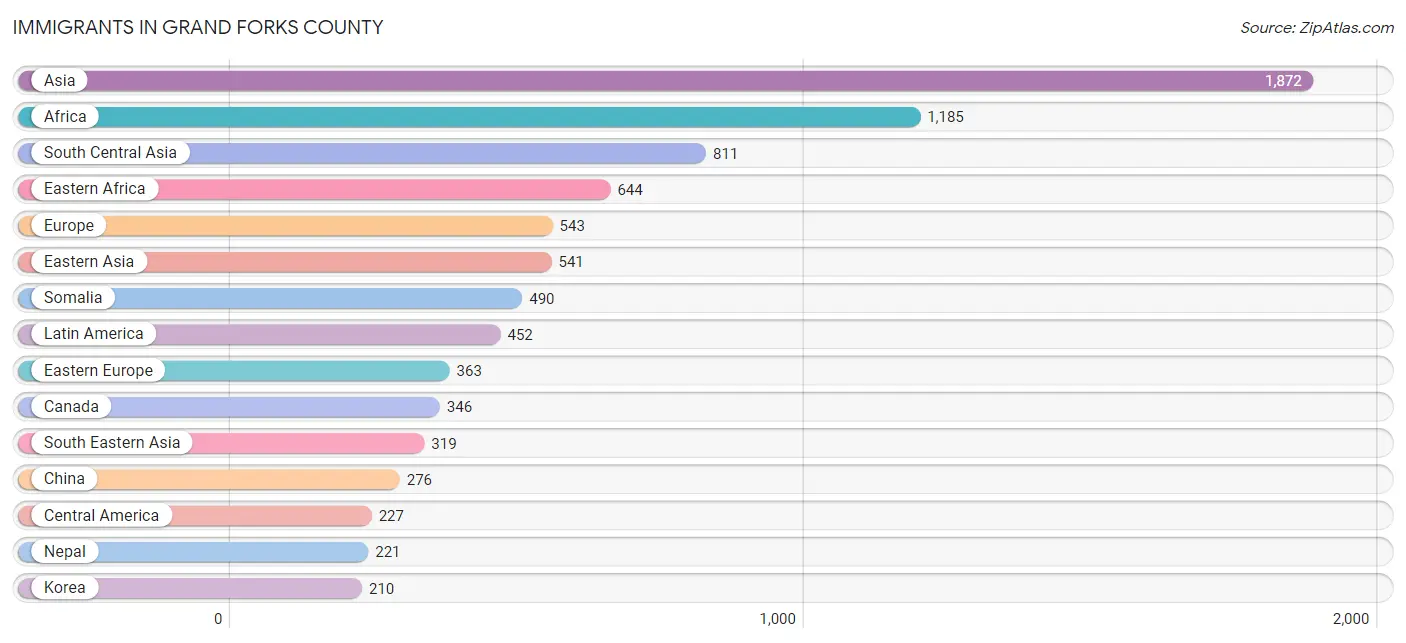
Immigrants in Grand Forks County
The most numerous immigrant groups reported in Grand Forks County came from Asia (1,872 | 2.6%), Africa (1,185 | 1.6%), South Central Asia (811 | 1.1%), Eastern Africa (644 | 0.9%), and Europe (543 | 0.7%), together accounting for 6.9% of all Grand Forks County residents.
| Immigration Origin | # Population | % Population |
| Africa | 1,185 | 1.6% |
| Asia | 1,872 | 2.6% |
| Australia | 8 | 0.0% |
| Bangladesh | 112 | 0.2% |
| Bosnia and Herzegovina | 82 | 0.1% |
| Brazil | 14 | 0.0% |
| Bulgaria | 131 | 0.2% |
| Cameroon | 56 | 0.1% |
| Canada | 346 | 0.5% |
| Caribbean | 169 | 0.2% |
| Central America | 227 | 0.3% |
| Chile | 9 | 0.0% |
| China | 276 | 0.4% |
| Colombia | 22 | 0.0% |
| Costa Rica | 8 | 0.0% |
| Denmark | 11 | 0.0% |
| Dominican Republic | 5 | 0.0% |
| Eastern Africa | 644 | 0.9% |
| Eastern Asia | 541 | 0.7% |
| Eastern Europe | 363 | 0.5% |
| Egypt | 110 | 0.2% |
| El Salvador | 5 | 0.0% |
| England | 35 | 0.1% |
| Ethiopia | 67 | 0.1% |
| Europe | 543 | 0.7% |
| France | 4 | 0.0% |
| Germany | 62 | 0.1% |
| Ghana | 7 | 0.0% |
| Grenada | 12 | 0.0% |
| Guatemala | 6 | 0.0% |
| Honduras | 10 | 0.0% |
| India | 60 | 0.1% |
| Iran | 169 | 0.2% |
| Iraq | 15 | 0.0% |
| Italy | 12 | 0.0% |
| Jamaica | 152 | 0.2% |
| Japan | 55 | 0.1% |
| Jordan | 26 | 0.0% |
| Kenya | 80 | 0.1% |
| Korea | 210 | 0.3% |
| Laos | 5 | 0.0% |
| Latin America | 452 | 0.6% |
| Lebanon | 35 | 0.1% |
| Liberia | 8 | 0.0% |
| Malaysia | 33 | 0.1% |
| Mexico | 198 | 0.3% |
| Middle Africa | 56 | 0.1% |
| Nepal | 221 | 0.3% |
| Netherlands | 13 | 0.0% |
| Nigeria | 156 | 0.2% |
| Northern Africa | 161 | 0.2% |
| Northern Europe | 63 | 0.1% |
| Oceania | 23 | 0.0% |
| Pakistan | 25 | 0.0% |
| Peru | 11 | 0.0% |
| Philippines | 200 | 0.3% |
| Poland | 21 | 0.0% |
| Romania | 8 | 0.0% |
| Russia | 121 | 0.2% |
| Saudi Arabia | 63 | 0.1% |
| Scotland | 3 | 0.0% |
| Senegal | 25 | 0.0% |
| Somalia | 490 | 0.7% |
| South Africa | 73 | 0.1% |
| South America | 56 | 0.1% |
| South Central Asia | 811 | 1.1% |
| South Eastern Asia | 319 | 0.4% |
| Southern Europe | 38 | 0.1% |
| Spain | 26 | 0.0% |
| Sri Lanka | 2 | 0.0% |
| Sudan | 22 | 0.0% |
| Sweden | 4 | 0.0% |
| Taiwan | 2 | 0.0% |
| Turkey | 27 | 0.0% |
| Vietnam | 81 | 0.1% |
| Western Africa | 196 | 0.3% |
| Western Asia | 201 | 0.3% |
| Western Europe | 79 | 0.1% | View All 78 Rows |
Sex and Age in Grand Forks County
Sex and Age in Grand Forks County
The most populous age groups in Grand Forks County are 20 to 24 Years (5,709 | 15.1%) for men and 20 to 24 Years (5,047 | 14.4%) for women.
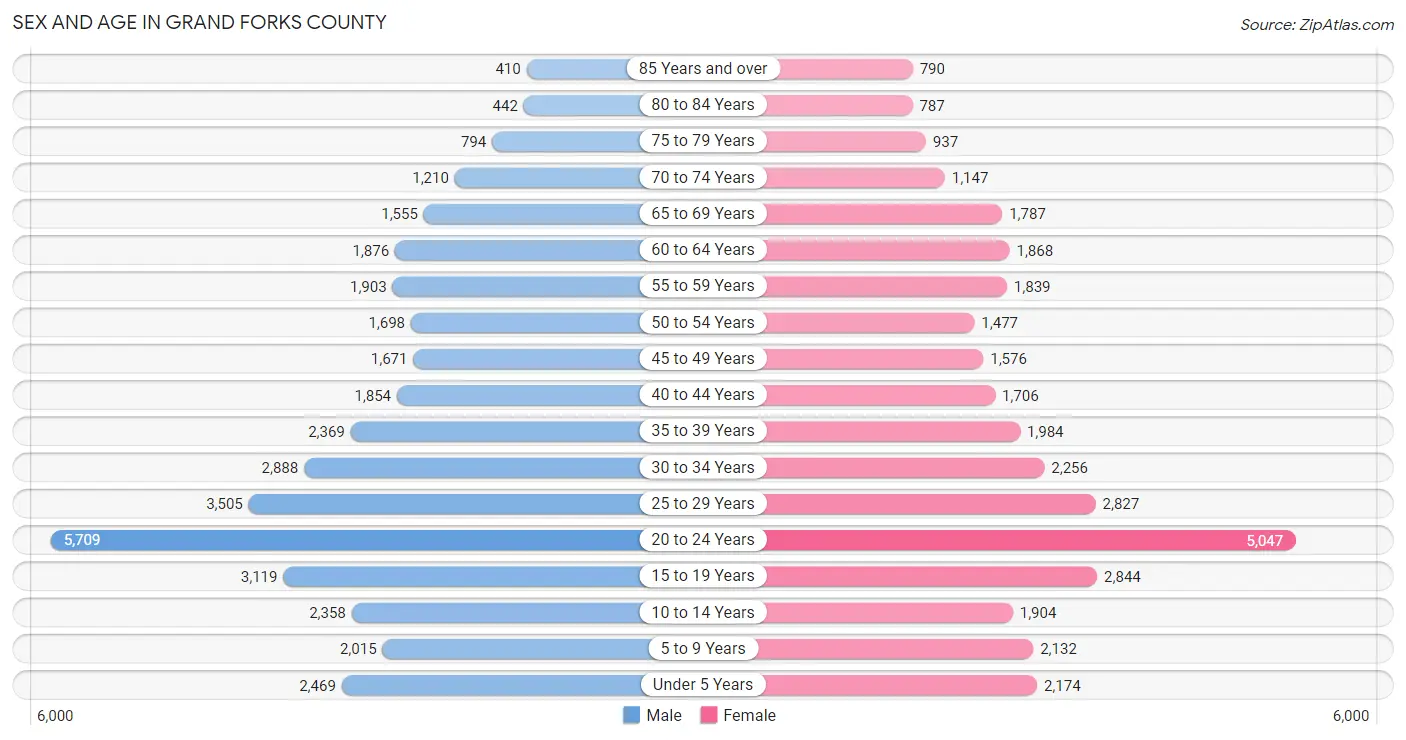
| Age Bracket | Male | Female |
| Under 5 Years | 2,469 (6.5%) | 2,174 (6.2%) |
| 5 to 9 Years | 2,015 (5.3%) | 2,132 (6.1%) |
| 10 to 14 Years | 2,358 (6.2%) | 1,904 (5.4%) |
| 15 to 19 Years | 3,119 (8.2%) | 2,844 (8.1%) |
| 20 to 24 Years | 5,709 (15.1%) | 5,047 (14.4%) |
| 25 to 29 Years | 3,505 (9.3%) | 2,827 (8.1%) |
| 30 to 34 Years | 2,888 (7.6%) | 2,256 (6.4%) |
| 35 to 39 Years | 2,369 (6.3%) | 1,984 (5.7%) |
| 40 to 44 Years | 1,854 (4.9%) | 1,706 (4.9%) |
| 45 to 49 Years | 1,671 (4.4%) | 1,576 (4.5%) |
| 50 to 54 Years | 1,698 (4.5%) | 1,477 (4.2%) |
| 55 to 59 Years | 1,903 (5.0%) | 1,839 (5.2%) |
| 60 to 64 Years | 1,876 (5.0%) | 1,868 (5.3%) |
| 65 to 69 Years | 1,555 (4.1%) | 1,787 (5.1%) |
| 70 to 74 Years | 1,210 (3.2%) | 1,147 (3.3%) |
| 75 to 79 Years | 794 (2.1%) | 937 (2.7%) |
| 80 to 84 Years | 442 (1.2%) | 787 (2.2%) |
| 85 Years and over | 410 (1.1%) | 790 (2.2%) |
| Total | 37,845 (100.0%) | 35,082 (100.0%) |
Families and Households in Grand Forks County
Median Family Size in Grand Forks County
The median family size in Grand Forks County is 2.97 persons per family, with married-couple families (11,931 | 76.3%) accounting for the largest median family size of 3.08 persons per family. On the other hand, single female/mother families (2,737 | 17.5%) represent the smallest median family size with 2.60 persons per family.
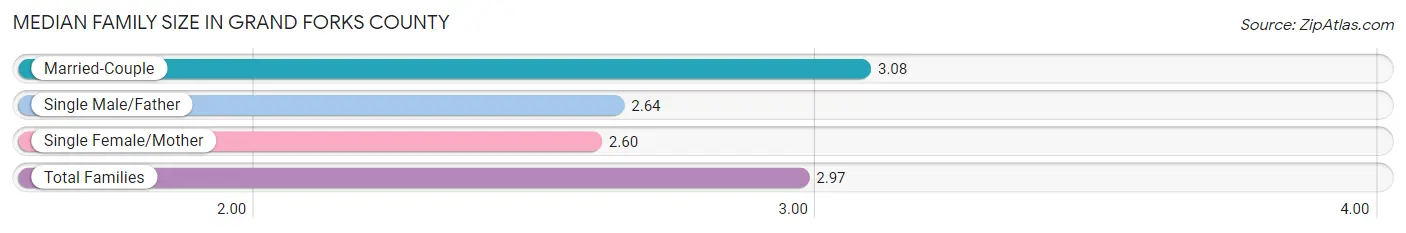
| Family Type | # Families | Family Size |
| Married-Couple | 11,931 (76.3%) | 3.08 |
| Single Male/Father | 960 (6.1%) | 2.64 |
| Single Female/Mother | 2,737 (17.5%) | 2.60 |
| Total Families | 15,628 (100.0%) | 2.97 |
Median Household Size in Grand Forks County
The median household size in Grand Forks County is 2.23 persons per household, with married-couple households (11,931 | 38.8%) accounting for the largest median household size of 3.11 persons per household. non-family households (15,107 | 49.1%) represent the smallest median household size with 1.37 persons per household.
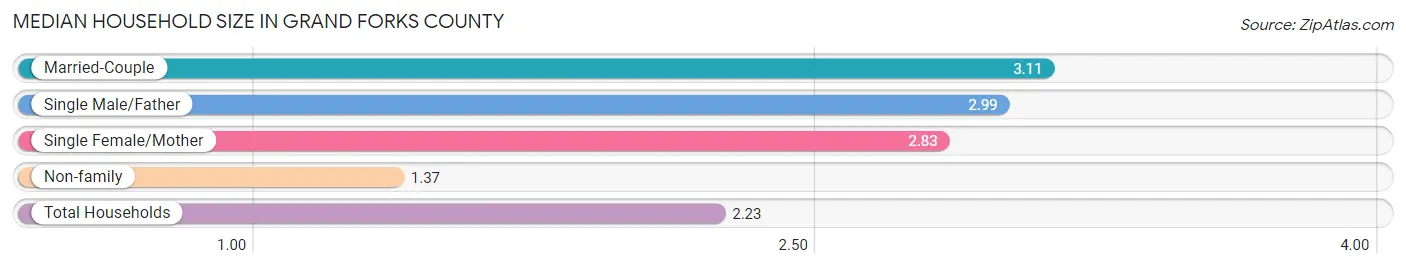
| Household Type | # Households | Household Size |
| Married-Couple | 11,931 (38.8%) | 3.11 |
| Single Male/Father | 960 (3.1%) | 2.99 |
| Single Female/Mother | 2,737 (8.9%) | 2.83 |
| Non-family | 15,107 (49.1%) | 1.37 |
| Total Households | 30,735 (100.0%) | 2.23 |
Household Size by Marriage Status in Grand Forks County
Out of a total of 30,735 households in Grand Forks County, 15,628 (50.8%) are family households, while 15,107 (49.1%) are nonfamily households. The most numerous type of family households are 2-person households, comprising 7,390, and the most common type of nonfamily households are 1-person households, comprising 11,225.
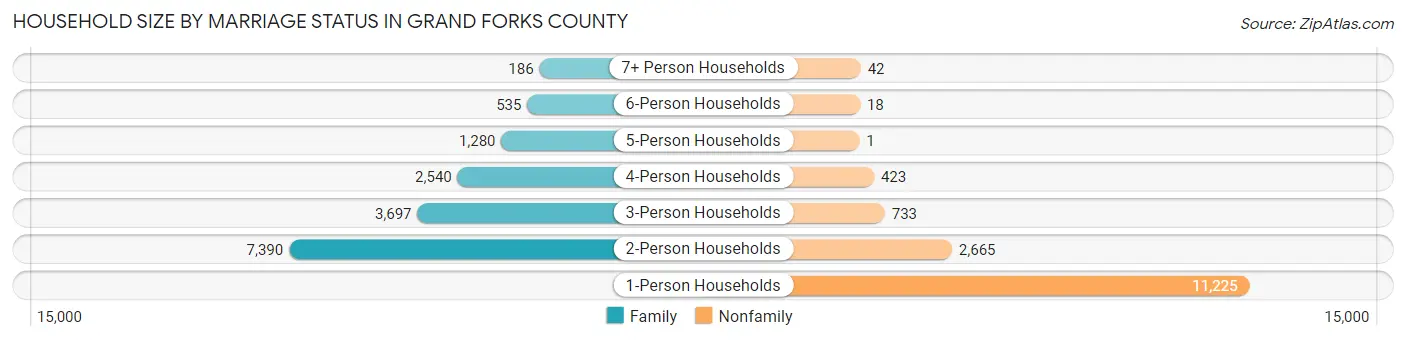
| Household Size | Family Households | Nonfamily Households |
| 1-Person Households | - | 11,225 (36.5%) |
| 2-Person Households | 7,390 (24.0%) | 2,665 (8.7%) |
| 3-Person Households | 3,697 (12.0%) | 733 (2.4%) |
| 4-Person Households | 2,540 (8.3%) | 423 (1.4%) |
| 5-Person Households | 1,280 (4.2%) | 1 (0.0%) |
| 6-Person Households | 535 (1.7%) | 18 (0.1%) |
| 7+ Person Households | 186 (0.6%) | 42 (0.1%) |
| Total | 15,628 (50.8%) | 15,107 (49.1%) |
Female Fertility in Grand Forks County
Fertility by Age in Grand Forks County
Average fertility rate in Grand Forks County is 60.0 births per 1,000 women. Women in the age bracket of 20 to 34 years have the highest fertility rate with 93.0 births per 1,000 women. Women in the age bracket of 20 to 34 years acount for 86.2% of all women with births.
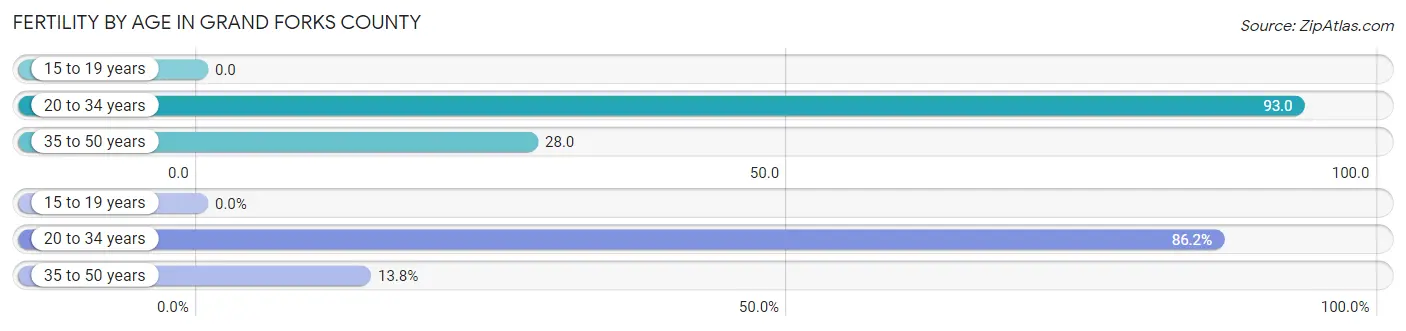
| Age Bracket | Women with Births | Births / 1,000 Women |
| 15 to 19 years | 0 (0.0%) | 0.0 |
| 20 to 34 years | 947 (86.2%) | 93.0 |
| 35 to 50 years | 152 (13.8%) | 28.0 |
| Total | 1,099 (100.0%) | 60.0 |
Fertility by Age by Marriage Status in Grand Forks County
78.3% of women with births (1,099) in Grand Forks County are married. The highest percentage of unmarried women with births falls into 20 to 34 years age bracket with 24.6% of them unmarried at the time of birth, while the lowest percentage of unmarried women with births belong to 35 to 50 years age bracket with 3.3% of them unmarried.
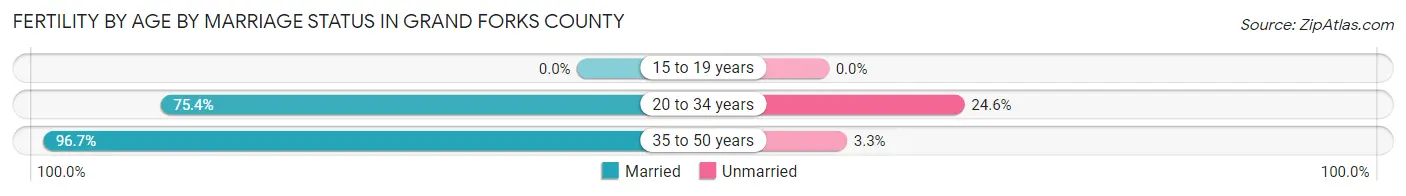
| Age Bracket | Married | Unmarried |
| 15 to 19 years | 0 (0.0%) | 0 (0.0%) |
| 20 to 34 years | 714 (75.4%) | 233 (24.6%) |
| 35 to 50 years | 147 (96.7%) | 5 (3.3%) |
| Total | 861 (78.3%) | 238 (21.7%) |
Fertility by Education in Grand Forks County
Average fertility rate in Grand Forks County is 60.0 births per 1,000 women. Women with the education attainment of less than high school have the highest fertility rate of 96.0 births per 1,000 women, while women with the education attainment of high school diploma have the lowest fertility at 50.0 births per 1,000 women. Women with the education attainment of college or associate's degree represent 37.2% of all women with births.
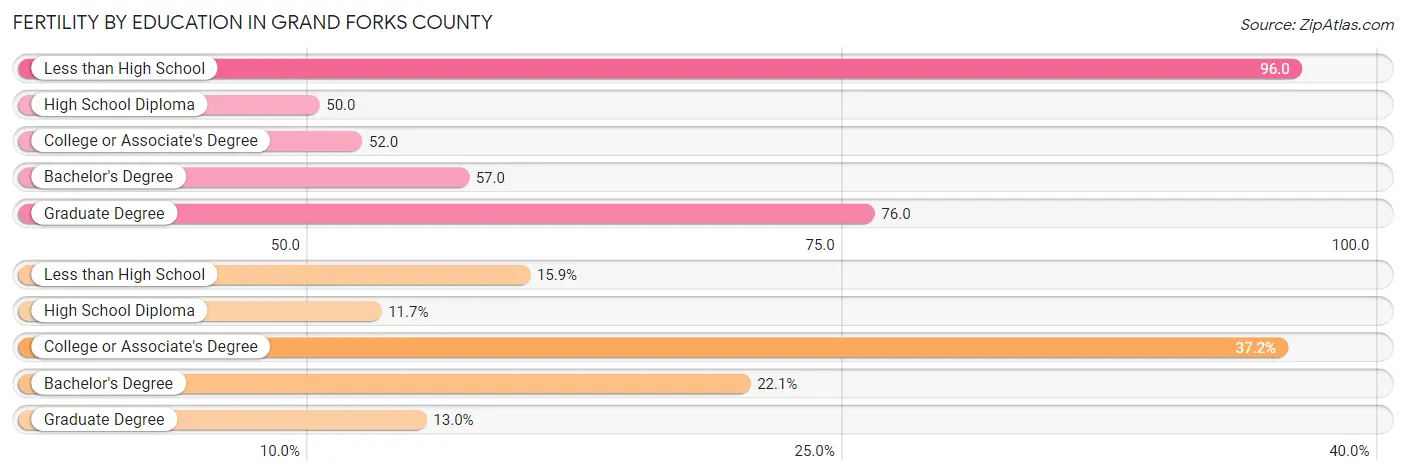
| Educational Attainment | Women with Births | Births / 1,000 Women |
| Less than High School | 175 (15.9%) | 96.0 |
| High School Diploma | 129 (11.7%) | 50.0 |
| College or Associate's Degree | 409 (37.2%) | 52.0 |
| Bachelor's Degree | 243 (22.1%) | 57.0 |
| Graduate Degree | 143 (13.0%) | 76.0 |
| Total | 1,099 (100.0%) | 60.0 |
Fertility by Education by Marriage Status in Grand Forks County
21.7% of women with births in Grand Forks County are unmarried. Women with the educational attainment of graduate degree are most likely to be married with 96.5% of them married at childbirth, while women with the educational attainment of less than high school are least likely to be married with 47.4% of them unmarried at childbirth.
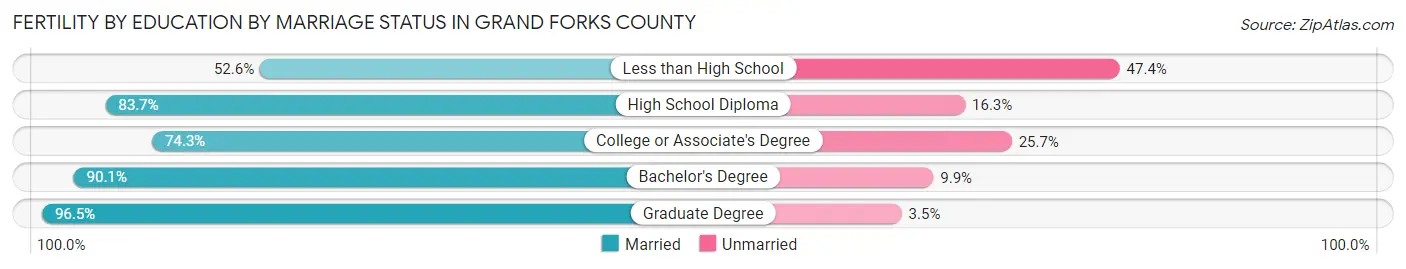
| Educational Attainment | Married | Unmarried |
| Less than High School | 92 (52.6%) | 83 (47.4%) |
| High School Diploma | 108 (83.7%) | 21 (16.3%) |
| College or Associate's Degree | 304 (74.3%) | 105 (25.7%) |
| Bachelor's Degree | 219 (90.1%) | 24 (9.9%) |
| Graduate Degree | 138 (96.5%) | 5 (3.5%) |
| Total | 861 (78.3%) | 238 (21.7%) |
Income in Grand Forks County
Income Overview in Grand Forks County
Per Capita Income in Grand Forks County is $37,159, while median incomes of families and households are $94,149 and $64,698 respectively.
| Characteristic | Number | Measure |
| Per Capita Income | 72,927 | $37,159 |
| Median Family Income | 15,628 | $94,149 |
| Mean Family Income | 15,628 | $113,662 |
| Median Household Income | 30,735 | $64,698 |
| Mean Household Income | 30,735 | $86,429 |
| Income Deficit | 15,628 | $10,108 |
| Wage / Income Gap (%) | 72,927 | 28.02% |
| Wage / Income Gap ($) | 72,927 | 71.98¢ per $1 |
| Gini / Inequality Index | 72,927 | 0.46 |
Earnings by Sex in Grand Forks County
Average Earnings in Grand Forks County are $36,492, $43,365 for men and $31,214 for women, a difference of 28.0%.
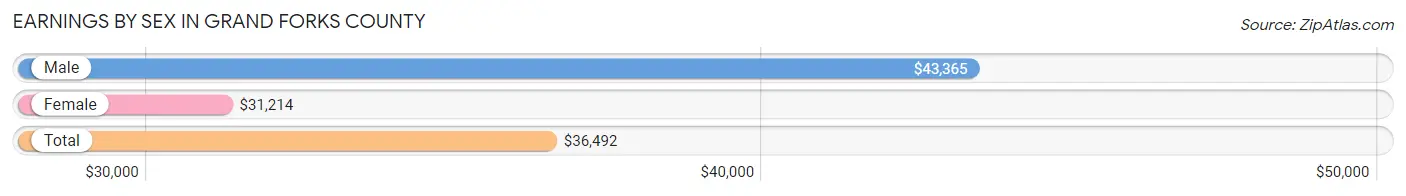
| Sex | Number | Average Earnings |
| Male | 24,868 (54.2%) | $43,365 |
| Female | 20,980 (45.8%) | $31,214 |
| Total | 45,848 (100.0%) | $36,492 |
Earnings by Sex by Income Bracket in Grand Forks County
The most common earnings brackets in Grand Forks County are $100,000+ for men (2,980 | 12.0%) and $25,000 to $29,999 for women (1,805 | 8.6%).
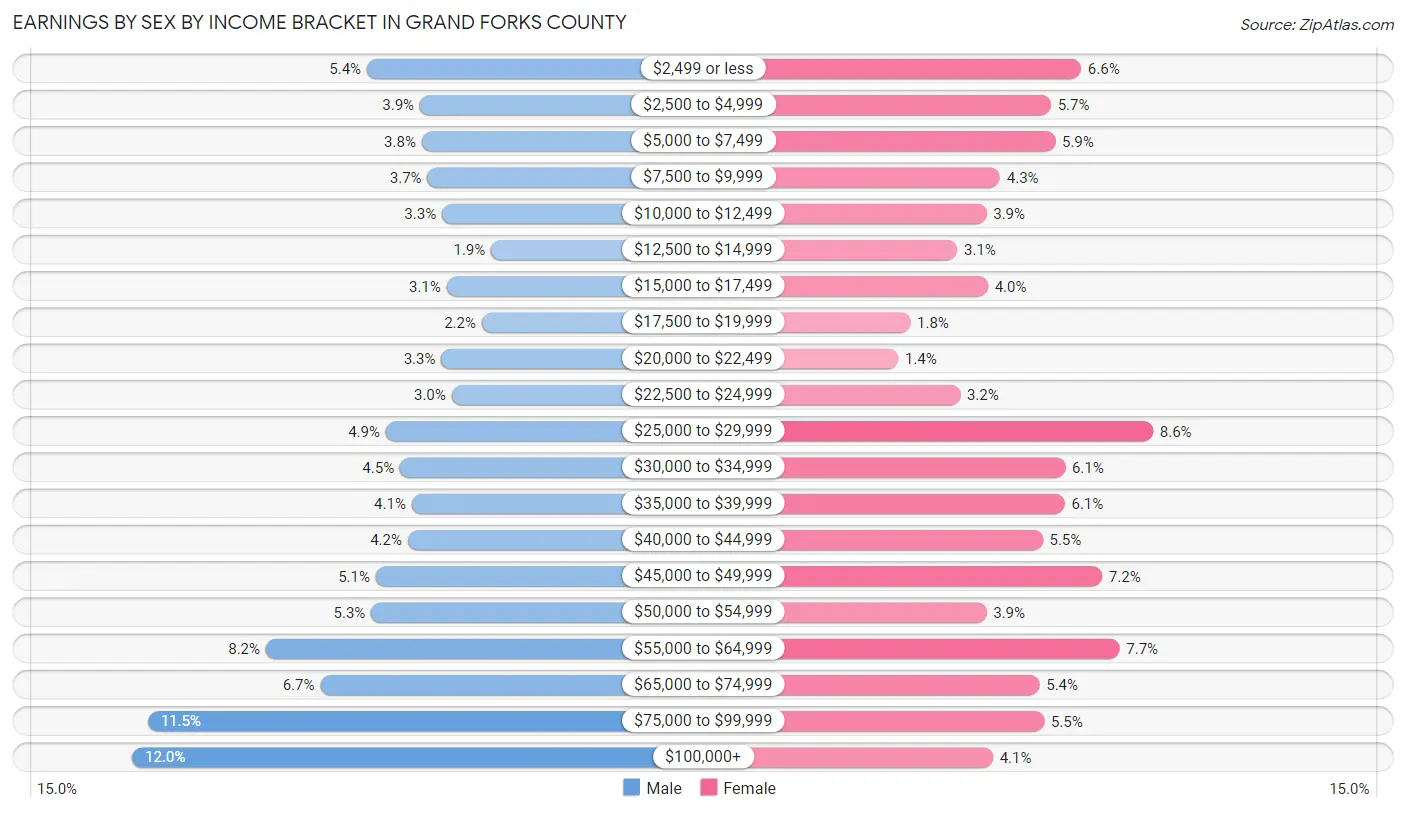
| Income | Male | Female |
| $2,499 or less | 1,337 (5.4%) | 1,381 (6.6%) |
| $2,500 to $4,999 | 968 (3.9%) | 1,202 (5.7%) |
| $5,000 to $7,499 | 956 (3.8%) | 1,227 (5.9%) |
| $7,500 to $9,999 | 914 (3.7%) | 902 (4.3%) |
| $10,000 to $12,499 | 813 (3.3%) | 823 (3.9%) |
| $12,500 to $14,999 | 471 (1.9%) | 651 (3.1%) |
| $15,000 to $17,499 | 782 (3.1%) | 831 (4.0%) |
| $17,500 to $19,999 | 534 (2.1%) | 373 (1.8%) |
| $20,000 to $22,499 | 817 (3.3%) | 303 (1.4%) |
| $22,500 to $24,999 | 747 (3.0%) | 668 (3.2%) |
| $25,000 to $29,999 | 1,206 (4.9%) | 1,805 (8.6%) |
| $30,000 to $34,999 | 1,107 (4.4%) | 1,286 (6.1%) |
| $35,000 to $39,999 | 1,024 (4.1%) | 1,283 (6.1%) |
| $40,000 to $44,999 | 1,051 (4.2%) | 1,153 (5.5%) |
| $45,000 to $49,999 | 1,276 (5.1%) | 1,505 (7.2%) |
| $50,000 to $54,999 | 1,308 (5.3%) | 823 (3.9%) |
| $55,000 to $64,999 | 2,043 (8.2%) | 1,607 (7.7%) |
| $65,000 to $74,999 | 1,664 (6.7%) | 1,134 (5.4%) |
| $75,000 to $99,999 | 2,870 (11.5%) | 1,163 (5.5%) |
| $100,000+ | 2,980 (12.0%) | 860 (4.1%) |
| Total | 24,868 (100.0%) | 20,980 (100.0%) |
Earnings by Sex by Educational Attainment in Grand Forks County
Average earnings in Grand Forks County are $55,480 for men and $42,150 for women, a difference of 24.0%. Men with an educational attainment of graduate degree enjoy the highest average annual earnings of $75,281, while those with high school diploma education earn the least with $44,542. Women with an educational attainment of graduate degree earn the most with the average annual earnings of $66,505, while those with less than high school education have the smallest earnings of $14,629.
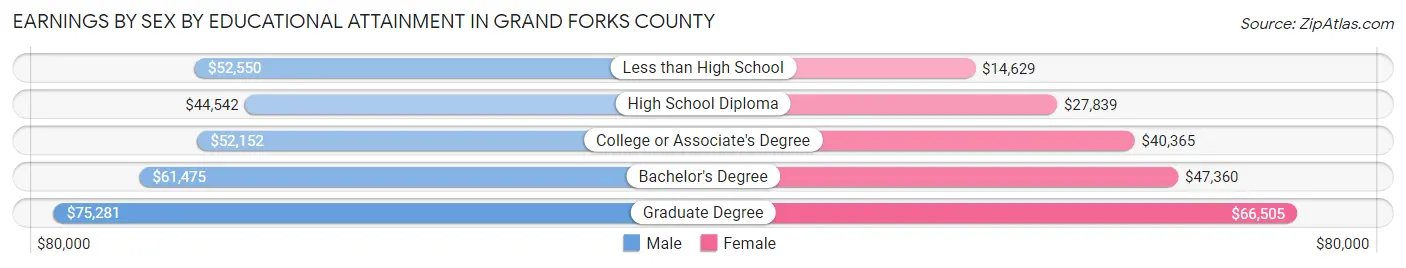
| Educational Attainment | Male Income | Female Income |
| Less than High School | $52,550 | $14,629 |
| High School Diploma | $44,542 | $27,839 |
| College or Associate's Degree | $52,152 | $40,365 |
| Bachelor's Degree | $61,475 | $47,360 |
| Graduate Degree | $75,281 | $66,505 |
| Total | $55,480 | $42,150 |
Family Income in Grand Forks County
Family Income Brackets in Grand Forks County
According to the Grand Forks County family income data, there are 4,032 families falling into the $100,000 to $149,999 income range, which is the most common income bracket and makes up 25.8% of all families. Conversely, the $10,000 to $14,999 income bracket is the least frequent group with only 172 families (1.1%) belonging to this category.
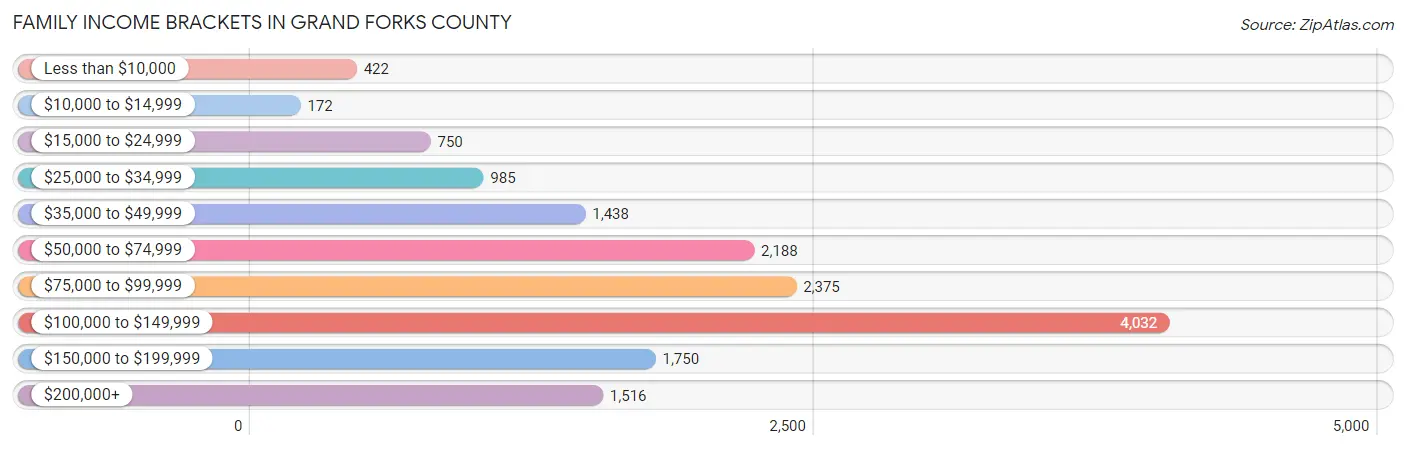
| Income Bracket | # Families | % Families |
| Less than $10,000 | 422 | 2.7% |
| $10,000 to $14,999 | 172 | 1.1% |
| $15,000 to $24,999 | 750 | 4.8% |
| $25,000 to $34,999 | 985 | 6.3% |
| $35,000 to $49,999 | 1,438 | 9.2% |
| $50,000 to $74,999 | 2,188 | 14.0% |
| $75,000 to $99,999 | 2,375 | 15.2% |
| $100,000 to $149,999 | 4,032 | 25.8% |
| $150,000 to $199,999 | 1,750 | 11.2% |
| $200,000+ | 1,516 | 9.7% |
Family Income by Famaliy Size in Grand Forks County
6-person families (358 | 2.3%) account for the highest median family income in Grand Forks County with $159,896 per family, while 2-person families (7,958 | 50.9%) have the highest median income of $40,892 per family member.
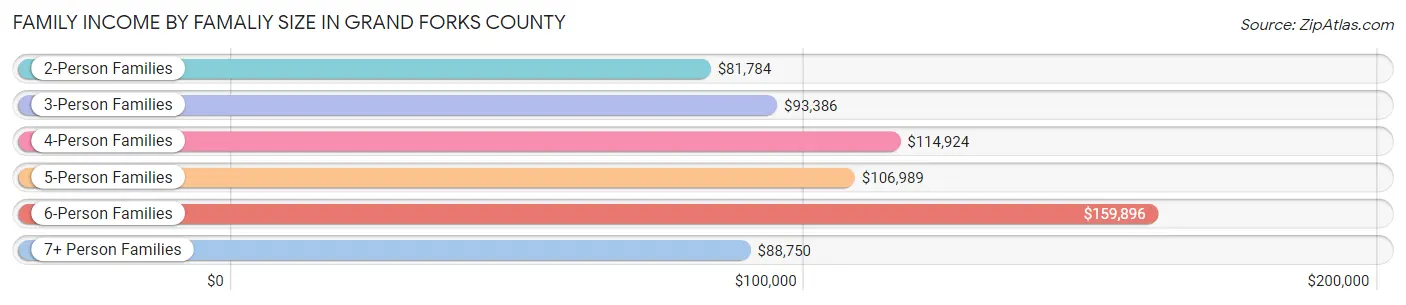
| Income Bracket | # Families | Median Income |
| 2-Person Families | 7,958 (50.9%) | $81,784 |
| 3-Person Families | 3,376 (21.6%) | $93,386 |
| 4-Person Families | 2,456 (15.7%) | $114,924 |
| 5-Person Families | 1,336 (8.6%) | $106,989 |
| 6-Person Families | 358 (2.3%) | $159,896 |
| 7+ Person Families | 144 (0.9%) | $88,750 |
| Total | 15,628 (100.0%) | $94,149 |
Family Income by Number of Earners in Grand Forks County
The median family income in Grand Forks County is $94,149, with families comprising 3+ earners (1,526) having the highest median family income of $127,028, while families with no earners (1,899) have the lowest median family income of $38,350, accounting for 9.8% and 12.1% of families, respectively.
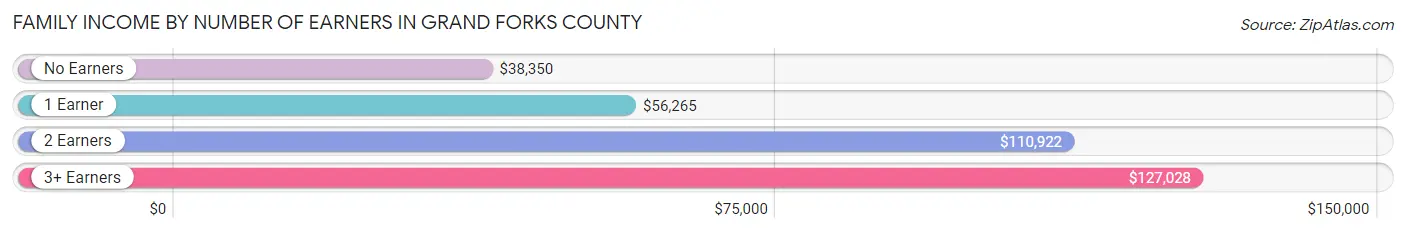
| Number of Earners | # Families | Median Income |
| No Earners | 1,899 (12.1%) | $38,350 |
| 1 Earner | 4,238 (27.1%) | $56,265 |
| 2 Earners | 7,965 (51.0%) | $110,922 |
| 3+ Earners | 1,526 (9.8%) | $127,028 |
| Total | 15,628 (100.0%) | $94,149 |
Household Income in Grand Forks County
Household Income Brackets in Grand Forks County
With 5,471 households falling in the category, the $100,000 to $149,999 income range is the most frequent in Grand Forks County, accounting for 17.8% of all households. In contrast, only 984 households (3.2%) fall into the $10,000 to $14,999 income bracket, making it the least populous group.
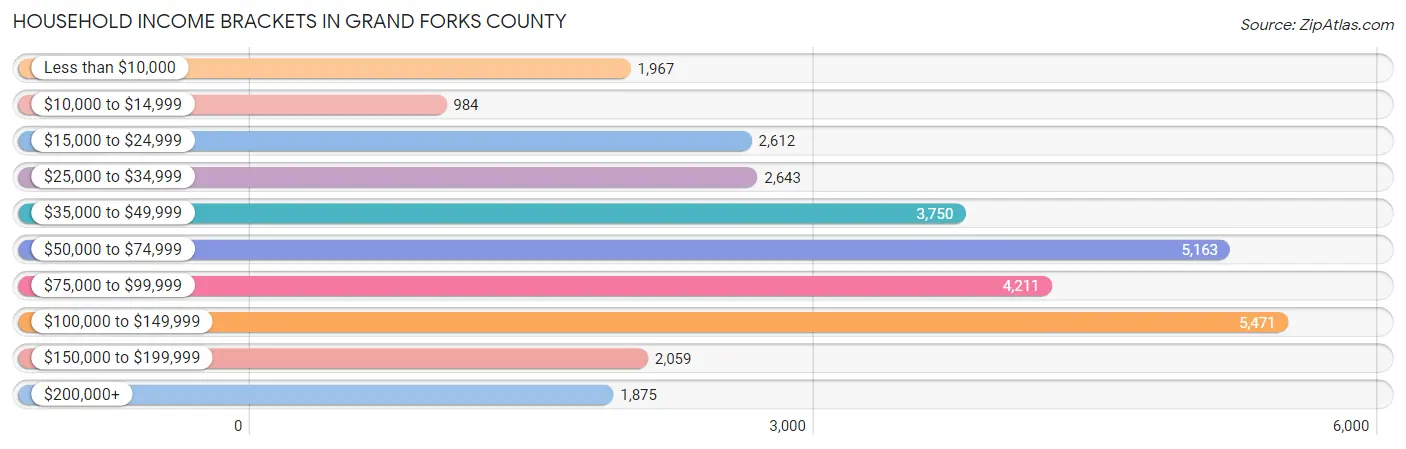
| Income Bracket | # Households | % Households |
| Less than $10,000 | 1,967 | 6.4% |
| $10,000 to $14,999 | 984 | 3.2% |
| $15,000 to $24,999 | 2,612 | 8.5% |
| $25,000 to $34,999 | 2,643 | 8.6% |
| $35,000 to $49,999 | 3,750 | 12.2% |
| $50,000 to $74,999 | 5,163 | 16.8% |
| $75,000 to $99,999 | 4,211 | 13.7% |
| $100,000 to $149,999 | 5,471 | 17.8% |
| $150,000 to $199,999 | 2,059 | 6.7% |
| $200,000+ | 1,875 | 6.1% |
Household Income by Householder Age in Grand Forks County
The median household income in Grand Forks County is $64,698, with the highest median household income of $89,079 found in the 45 to 64 years age bracket for the primary householder. A total of 8,528 households (27.8%) fall into this category. Meanwhile, the 15 to 24 years age bracket for the primary householder has the lowest median household income of $33,670, with 4,480 households (14.6%) in this group.
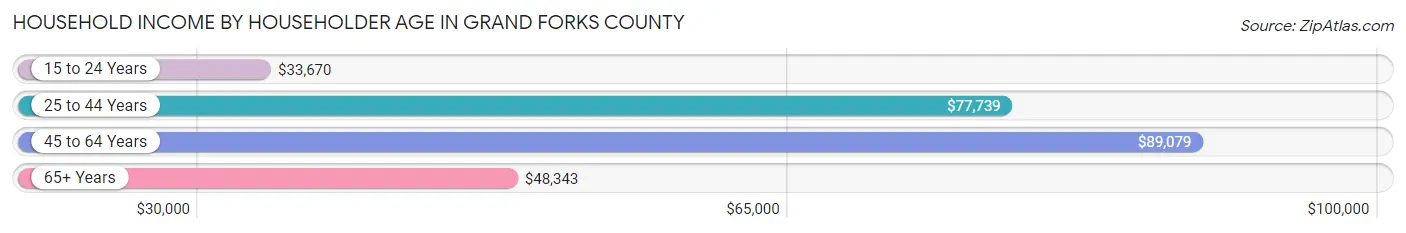
| Income Bracket | # Households | Median Income |
| 15 to 24 Years | 4,480 (14.6%) | $33,670 |
| 25 to 44 Years | 11,261 (36.6%) | $77,739 |
| 45 to 64 Years | 8,528 (27.8%) | $89,079 |
| 65+ Years | 6,466 (21.0%) | $48,343 |
| Total | 30,735 (100.0%) | $64,698 |
Poverty in Grand Forks County
Income Below Poverty by Sex and Age in Grand Forks County
With 13.5% poverty level for males and 14.9% for females among the residents of Grand Forks County, 18 to 24 year old males and 18 to 24 year old females are the most vulnerable to poverty, with 2,239 males (37.8%) and 1,989 females (37.7%) in their respective age groups living below the poverty level.
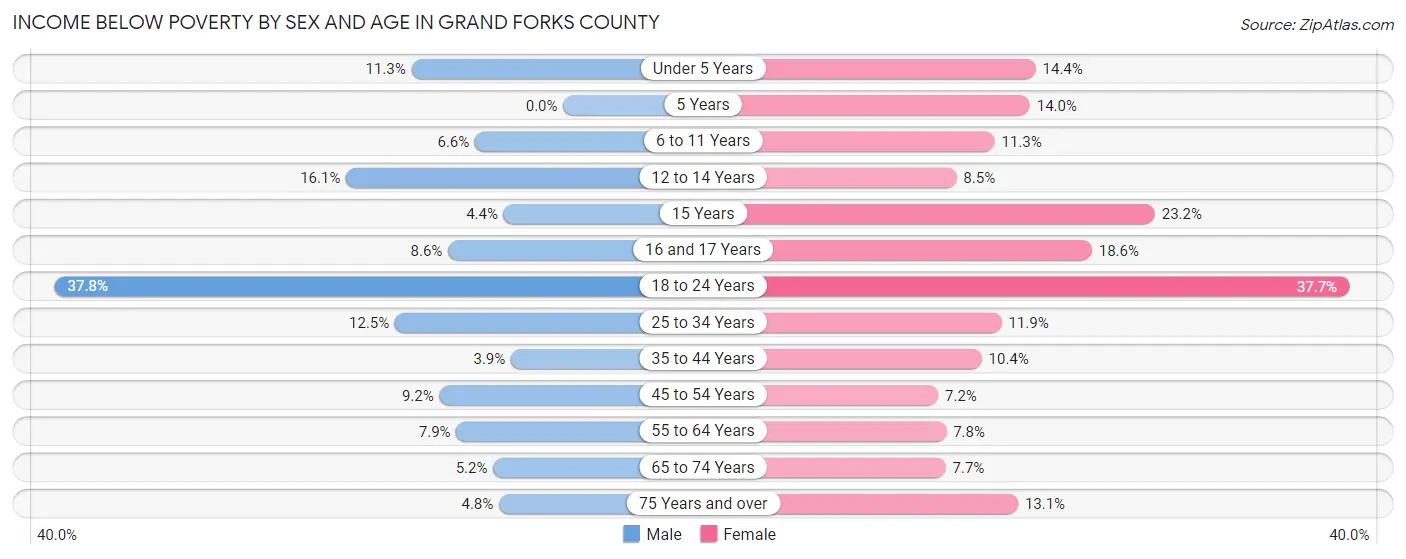
| Age Bracket | Male | Female |
| Under 5 Years | 273 (11.3%) | 310 (14.4%) |
| 5 Years | 0 (0.0%) | 43 (14.0%) |
| 6 to 11 Years | 152 (6.6%) | 271 (11.3%) |
| 12 to 14 Years | 258 (16.1%) | 108 (8.5%) |
| 15 Years | 10 (4.4%) | 89 (23.2%) |
| 16 and 17 Years | 65 (8.6%) | 134 (18.6%) |
| 18 to 24 Years | 2,239 (37.8%) | 1,989 (37.7%) |
| 25 to 34 Years | 790 (12.5%) | 598 (11.9%) |
| 35 to 44 Years | 162 (3.9%) | 382 (10.4%) |
| 45 to 54 Years | 308 (9.2%) | 218 (7.1%) |
| 55 to 64 Years | 296 (7.9%) | 287 (7.7%) |
| 65 to 74 Years | 140 (5.2%) | 219 (7.7%) |
| 75 Years and over | 71 (4.8%) | 296 (13.1%) |
| Total | 4,764 (13.5%) | 4,944 (14.9%) |
Income Above Poverty by Sex and Age in Grand Forks County
According to the poverty statistics in Grand Forks County, males aged 5 years and females aged 45 to 54 years are the age groups that are most secure financially, with 100.0% of males and 92.8% of females in these age groups living above the poverty line.
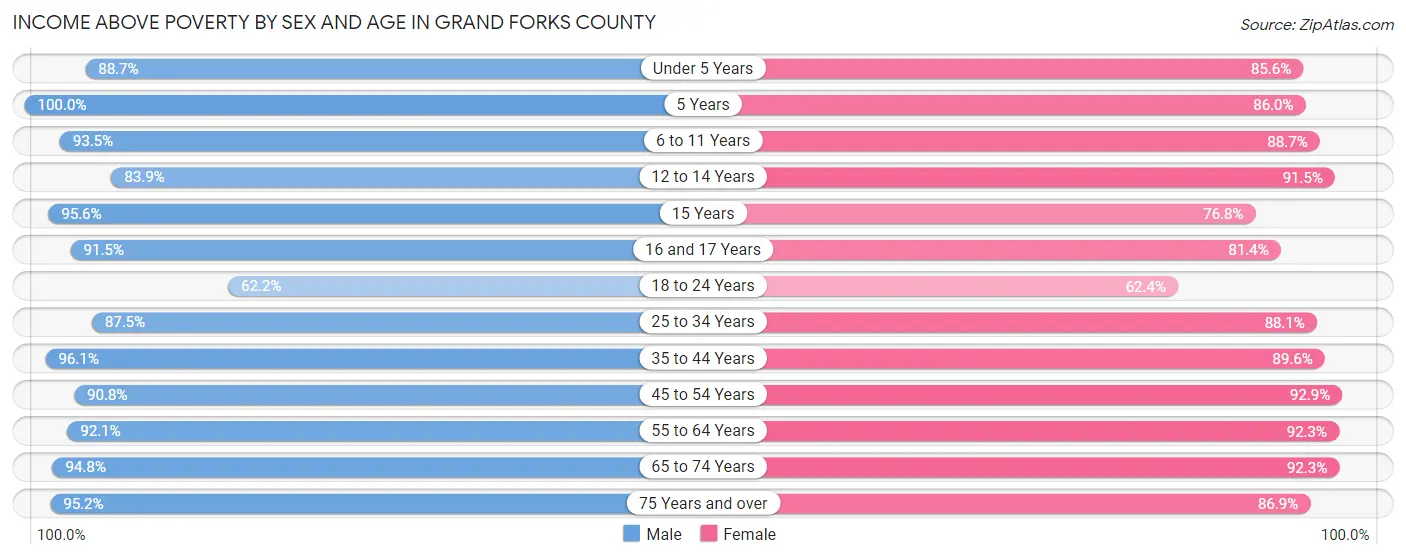
| Age Bracket | Male | Female |
| Under 5 Years | 2,149 (88.7%) | 1,844 (85.6%) |
| 5 Years | 408 (100.0%) | 265 (86.0%) |
| 6 to 11 Years | 2,169 (93.4%) | 2,119 (88.7%) |
| 12 to 14 Years | 1,342 (83.9%) | 1,161 (91.5%) |
| 15 Years | 216 (95.6%) | 294 (76.8%) |
| 16 and 17 Years | 695 (91.4%) | 588 (81.4%) |
| 18 to 24 Years | 3,689 (62.2%) | 3,294 (62.4%) |
| 25 to 34 Years | 5,535 (87.5%) | 4,445 (88.1%) |
| 35 to 44 Years | 4,017 (96.1%) | 3,297 (89.6%) |
| 45 to 54 Years | 3,044 (90.8%) | 2,833 (92.8%) |
| 55 to 64 Years | 3,430 (92.1%) | 3,417 (92.2%) |
| 65 to 74 Years | 2,554 (94.8%) | 2,620 (92.3%) |
| 75 Years and over | 1,419 (95.2%) | 1,967 (86.9%) |
| Total | 30,667 (86.6%) | 28,144 (85.1%) |
Income Below Poverty Among Married-Couple Families in Grand Forks County
The poverty statistics for married-couple families in Grand Forks County show that 3.4% or 410 of the total 11,931 families live below the poverty line. Families with 5 or more children have the highest poverty rate of 41.2%, comprising of 28 families. On the other hand, families with no children have the lowest poverty rate of 1.8%, which includes 120 families.
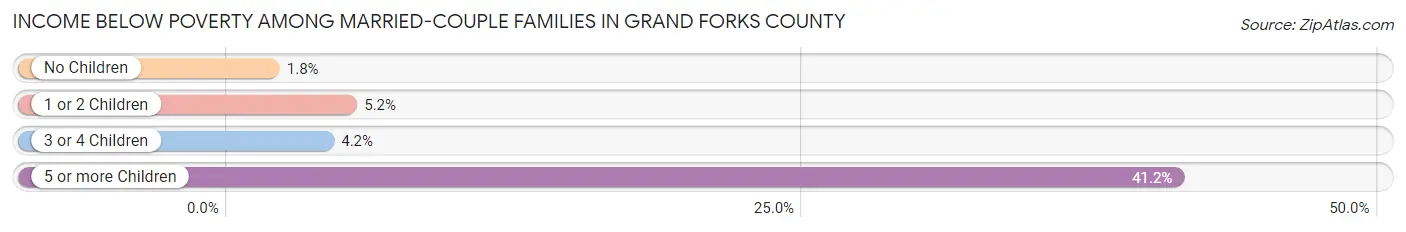
| Children | Above Poverty | Below Poverty |
| No Children | 6,475 (98.2%) | 120 (1.8%) |
| 1 or 2 Children | 3,908 (94.8%) | 214 (5.2%) |
| 3 or 4 Children | 1,098 (95.8%) | 48 (4.2%) |
| 5 or more Children | 40 (58.8%) | 28 (41.2%) |
| Total | 11,521 (96.6%) | 410 (3.4%) |
Income Below Poverty Among Single-Parent Households in Grand Forks County
According to the poverty data in Grand Forks County, 10.2% or 98 single-father households and 22.9% or 626 single-mother households are living below the poverty line. Among single-father households, those with no children have the highest poverty rate, with 38 households (11.4%) experiencing poverty. Likewise, among single-mother households, those with 1 or 2 children have the highest poverty rate, with 476 households (29.2%) falling below the poverty line.
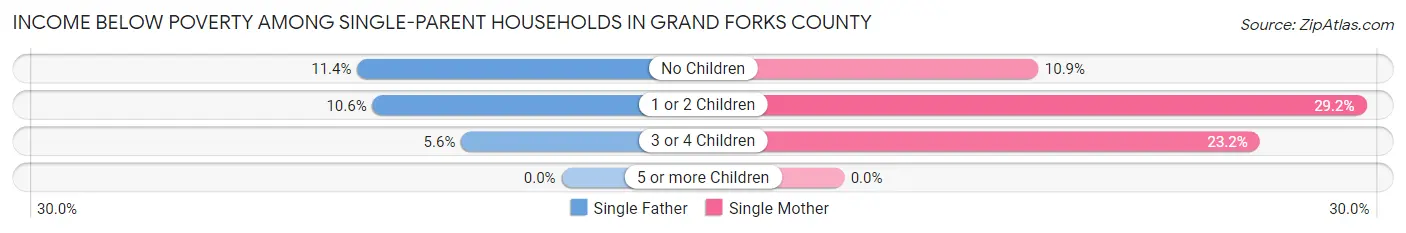
| Children | Single Father | Single Mother |
| No Children | 38 (11.4%) | 94 (10.8%) |
| 1 or 2 Children | 53 (10.6%) | 476 (29.2%) |
| 3 or 4 Children | 7 (5.6%) | 56 (23.2%) |
| 5 or more Children | 0 (0.0%) | 0 (0.0%) |
| Total | 98 (10.2%) | 626 (22.9%) |
Income Below Poverty Among Married-Couple vs Single-Parent Households in Grand Forks County
The poverty data for Grand Forks County shows that 410 of the married-couple family households (3.4%) and 724 of the single-parent households (19.6%) are living below the poverty level. Within the married-couple family households, those with 5 or more children have the highest poverty rate, with 28 households (41.2%) falling below the poverty line. Among the single-parent households, those with 1 or 2 children have the highest poverty rate, with 529 household (24.8%) living below poverty.
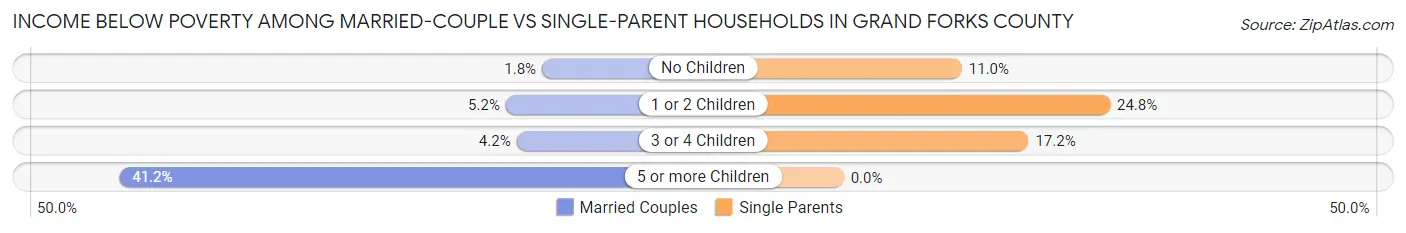
| Children | Married-Couple Families | Single-Parent Households |
| No Children | 120 (1.8%) | 132 (11.0%) |
| 1 or 2 Children | 214 (5.2%) | 529 (24.8%) |
| 3 or 4 Children | 48 (4.2%) | 63 (17.2%) |
| 5 or more Children | 28 (41.2%) | 0 (0.0%) |
| Total | 410 (3.4%) | 724 (19.6%) |
Employment Characteristics in Grand Forks County
Employment by Class of Employer in Grand Forks County
Among the 39,811 employed individuals in Grand Forks County, private company employees (22,168 | 55.7%), not-for-profit organizations (4,772 | 12.0%), and state government employees (4,641 | 11.7%) make up the most common classes of employment.
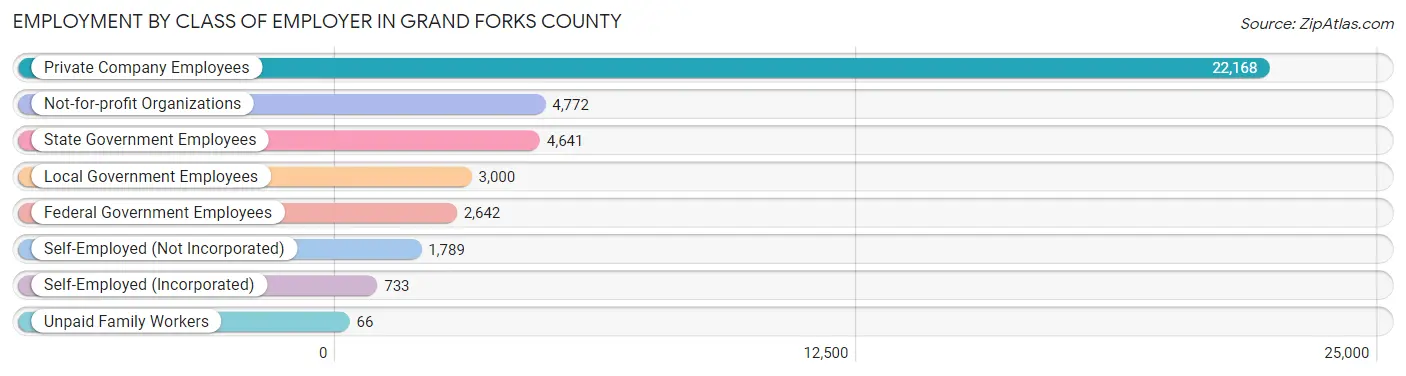
| Employer Class | # Employees | % Employees |
| Private Company Employees | 22,168 | 55.7% |
| Self-Employed (Incorporated) | 733 | 1.8% |
| Self-Employed (Not Incorporated) | 1,789 | 4.5% |
| Not-for-profit Organizations | 4,772 | 12.0% |
| Local Government Employees | 3,000 | 7.5% |
| State Government Employees | 4,641 | 11.7% |
| Federal Government Employees | 2,642 | 6.6% |
| Unpaid Family Workers | 66 | 0.2% |
| Total | 39,811 | 100.0% |
Employment Status by Age in Grand Forks County
According to the labor force statistics for Grand Forks County, out of the total population over 16 years of age (59,264), 71.3% or 42,255 individuals are in the labor force, with 3.4% or 1,437 of them unemployed. The age group with the highest labor force participation rate is 30 to 34 years, with 89.2% or 4,588 individuals in the labor force. Within the labor force, the 16 to 19 years age range has the highest percentage of unemployed individuals, with 15.0% or 472 of them being unemployed.
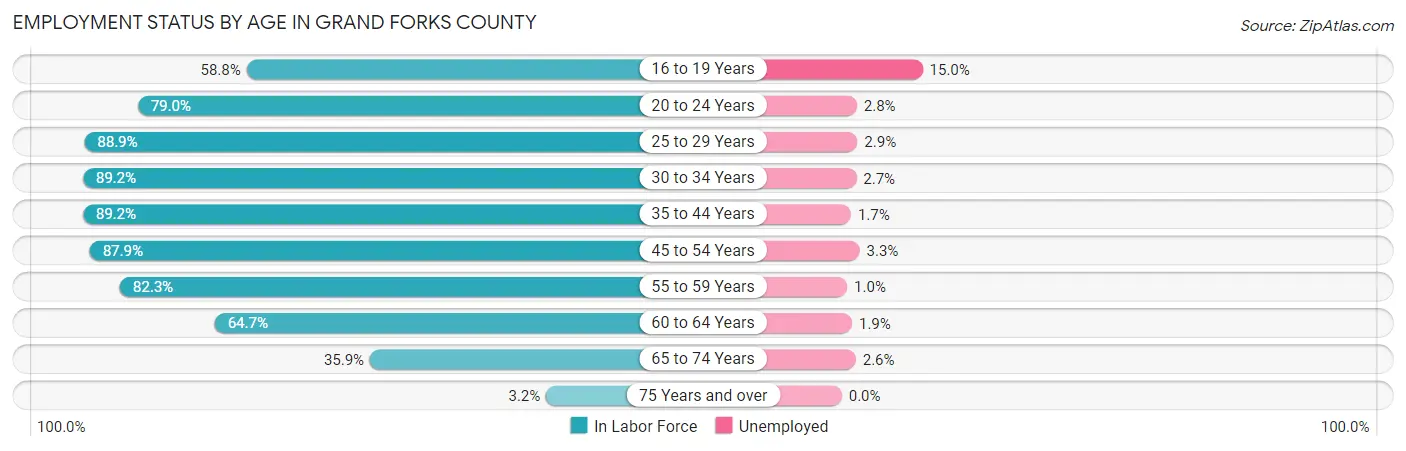
| Age Bracket | In Labor Force | Unemployed |
| 16 to 19 Years | 3,147 (58.8%) | 472 (15.0%) |
| 20 to 24 Years | 8,497 (79.0%) | 238 (2.8%) |
| 25 to 29 Years | 5,629 (88.9%) | 163 (2.9%) |
| 30 to 34 Years | 4,588 (89.2%) | 124 (2.7%) |
| 35 to 44 Years | 7,058 (89.2%) | 120 (1.7%) |
| 45 to 54 Years | 5,645 (87.9%) | 186 (3.3%) |
| 55 to 59 Years | 3,080 (82.3%) | 31 (1.0%) |
| 60 to 64 Years | 2,422 (64.7%) | 46 (1.9%) |
| 65 to 74 Years | 2,046 (35.9%) | 53 (2.6%) |
| 75 Years and over | 133 (3.2%) | 0 (0.0%) |
| Total | 42,255 (71.3%) | 1,437 (3.4%) |
Employment Status by Educational Attainment in Grand Forks County
According to labor force statistics for Grand Forks County, 85.4% of individuals (28,436) out of the total population between 25 and 64 years of age (33,297) are in the labor force, with 2.4% or 682 of them being unemployed. The group with the highest labor force participation rate are those with the educational attainment of bachelor's degree or higher, with 89.5% or 11,738 individuals in the labor force. Within the labor force, individuals with high school diploma education have the highest percentage of unemployment, with 4.3% or 217 of them being unemployed.
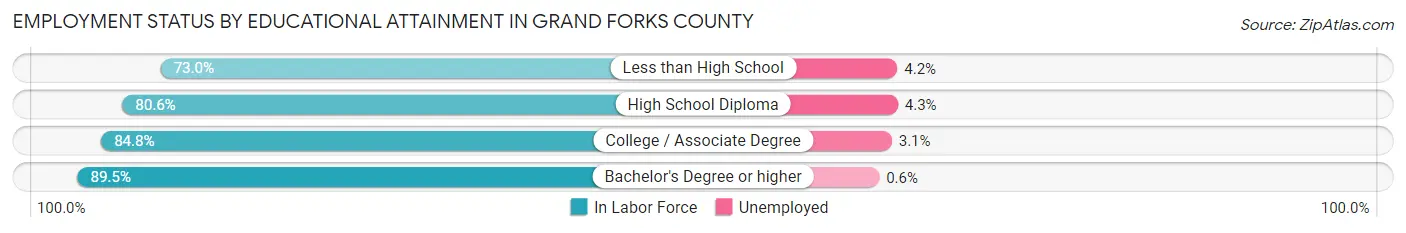
| Educational Attainment | In Labor Force | Unemployed |
| Less than High School | 1,048 (73.0%) | 60 (4.2%) |
| High School Diploma | 5,037 (80.6%) | 269 (4.3%) |
| College / Associate Degree | 10,598 (84.8%) | 387 (3.1%) |
| Bachelor's Degree or higher | 11,738 (89.5%) | 79 (0.6%) |
| Total | 28,436 (85.4%) | 799 (2.4%) |
Employment Occupations by Sex in Grand Forks County
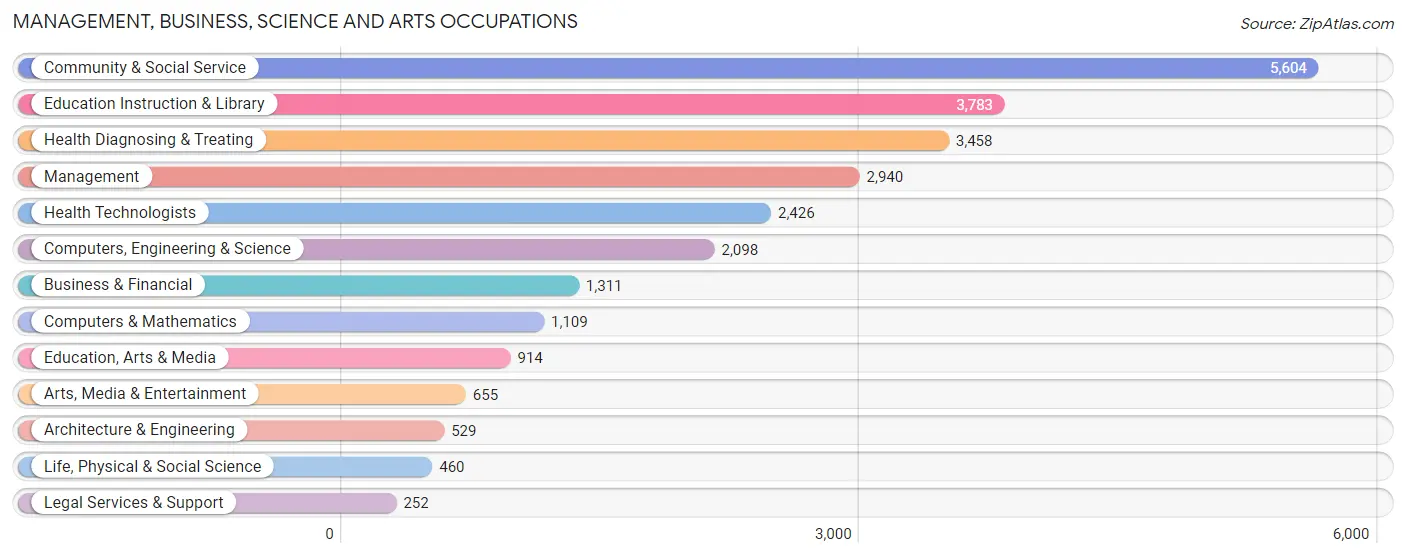
Management, Business, Science and Arts Occupations
The most common Management, Business, Science and Arts occupations in Grand Forks County are Community & Social Service (5,604 | 14.1%), Education Instruction & Library (3,783 | 9.6%), Health Diagnosing & Treating (3,458 | 8.7%), Management (2,940 | 7.4%), and Health Technologists (2,426 | 6.1%).
Management, Business, Science and Arts Occupations by Sex
Within the Management, Business, Science and Arts occupations in Grand Forks County, the most male-oriented occupations are Computers & Mathematics (86.5%), Architecture & Engineering (80.1%), and Computers, Engineering & Science (77.7%), while the most female-oriented occupations are Arts, Media & Entertainment (81.4%), Health Diagnosing & Treating (71.8%), and Health Technologists (71.2%).
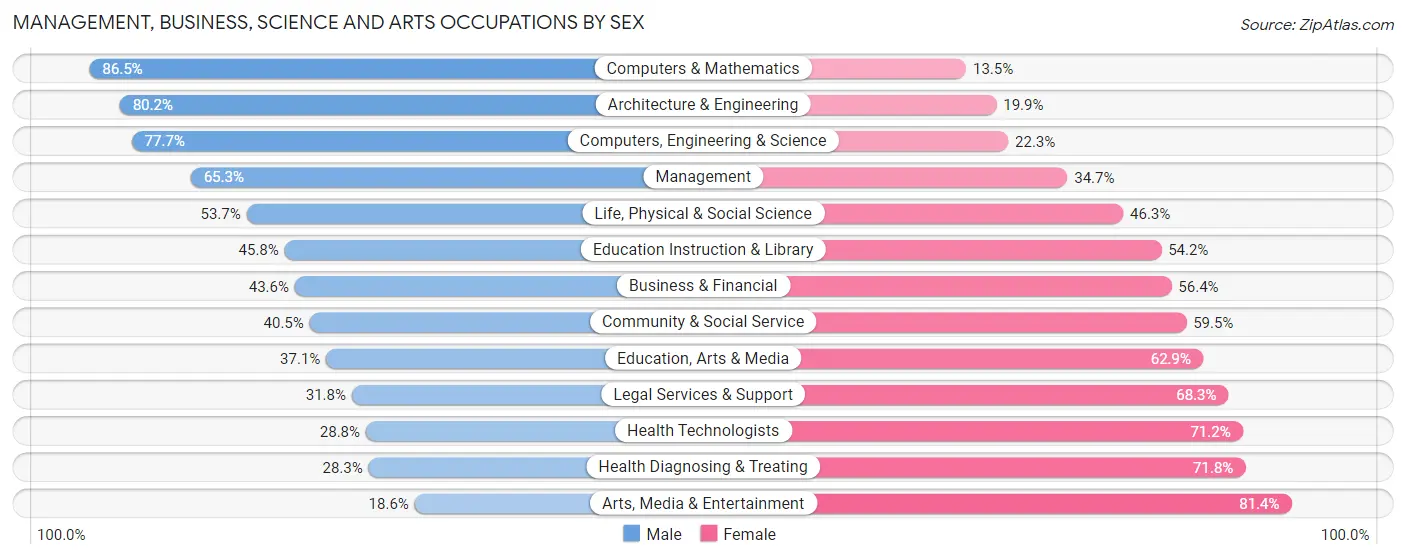
| Occupation | Male | Female |
| Management | 1,921 (65.3%) | 1,019 (34.7%) |
| Business & Financial | 572 (43.6%) | 739 (56.4%) |
| Computers, Engineering & Science | 1,630 (77.7%) | 468 (22.3%) |
| Computers & Mathematics | 959 (86.5%) | 150 (13.5%) |
| Architecture & Engineering | 424 (80.1%) | 105 (19.9%) |
| Life, Physical & Social Science | 247 (53.7%) | 213 (46.3%) |
| Community & Social Service | 2,272 (40.5%) | 3,332 (59.5%) |
| Education, Arts & Media | 339 (37.1%) | 575 (62.9%) |
| Legal Services & Support | 80 (31.8%) | 172 (68.2%) |
| Education Instruction & Library | 1,731 (45.8%) | 2,052 (54.2%) |
| Arts, Media & Entertainment | 122 (18.6%) | 533 (81.4%) |
| Health Diagnosing & Treating | 977 (28.2%) | 2,481 (71.8%) |
| Health Technologists | 699 (28.8%) | 1,727 (71.2%) |
| Total (Category) | 7,372 (47.8%) | 8,039 (52.2%) |
| Total (Overall) | 21,317 (53.8%) | 18,298 (46.2%) |
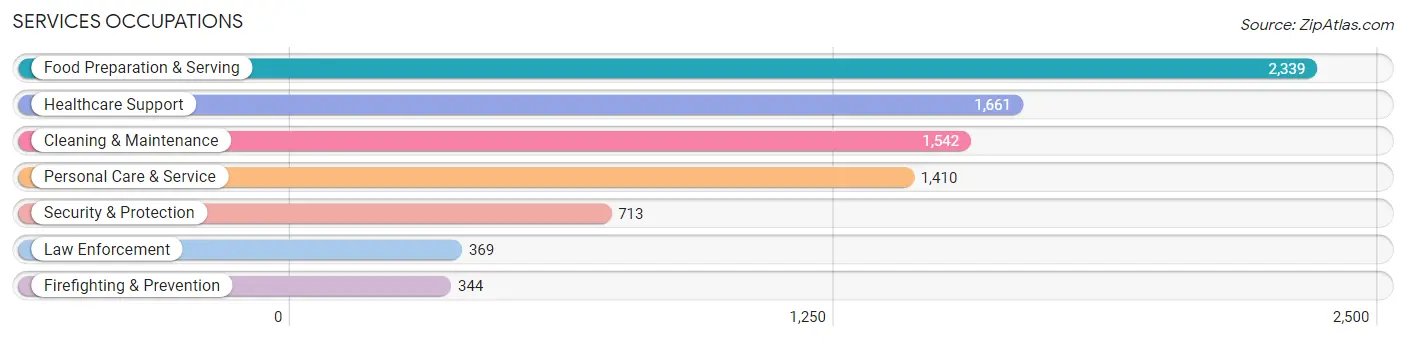
Services Occupations
The most common Services occupations in Grand Forks County are Food Preparation & Serving (2,339 | 5.9%), Healthcare Support (1,661 | 4.2%), Cleaning & Maintenance (1,542 | 3.9%), Personal Care & Service (1,410 | 3.6%), and Security & Protection (713 | 1.8%).
Services Occupations by Sex
Within the Services occupations in Grand Forks County, the most male-oriented occupations are Law Enforcement (87.0%), Security & Protection (85.8%), and Firefighting & Prevention (84.6%), while the most female-oriented occupations are Healthcare Support (77.0%), Personal Care & Service (70.6%), and Cleaning & Maintenance (50.6%).
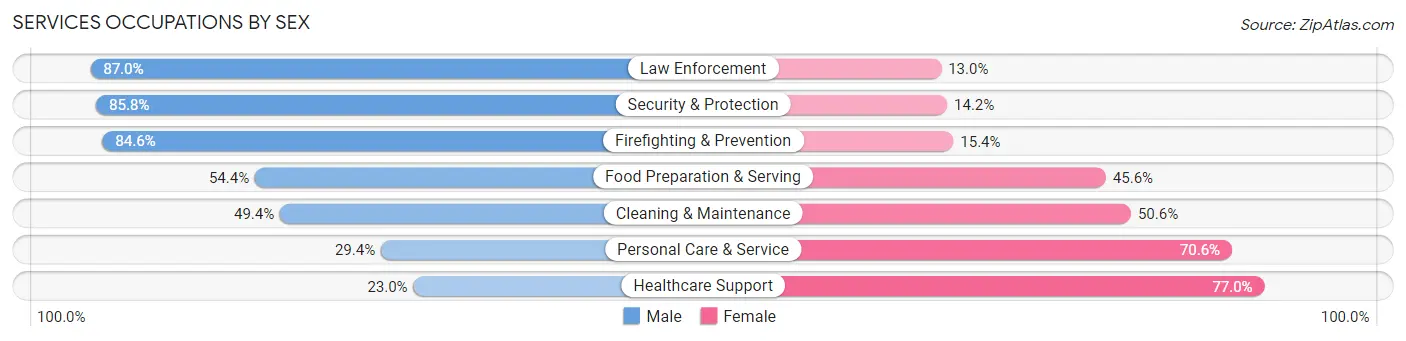
| Occupation | Male | Female |
| Healthcare Support | 382 (23.0%) | 1,279 (77.0%) |
| Security & Protection | 612 (85.8%) | 101 (14.2%) |
| Firefighting & Prevention | 291 (84.6%) | 53 (15.4%) |
| Law Enforcement | 321 (87.0%) | 48 (13.0%) |
| Food Preparation & Serving | 1,272 (54.4%) | 1,067 (45.6%) |
| Cleaning & Maintenance | 762 (49.4%) | 780 (50.6%) |
| Personal Care & Service | 415 (29.4%) | 995 (70.6%) |
| Total (Category) | 3,443 (44.9%) | 4,222 (55.1%) |
| Total (Overall) | 21,317 (53.8%) | 18,298 (46.2%) |
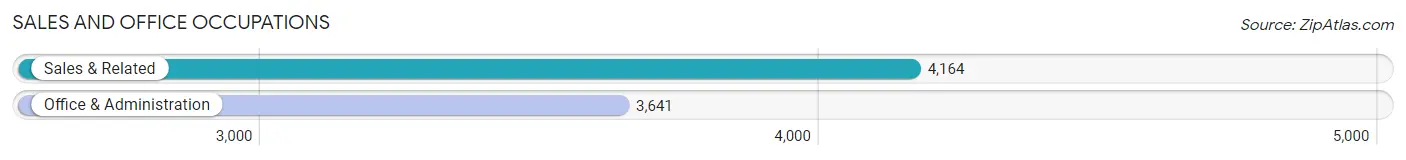
Sales and Office Occupations
The most common Sales and Office occupations in Grand Forks County are Sales & Related (4,164 | 10.5%), and Office & Administration (3,641 | 9.2%).
Sales and Office Occupations by Sex
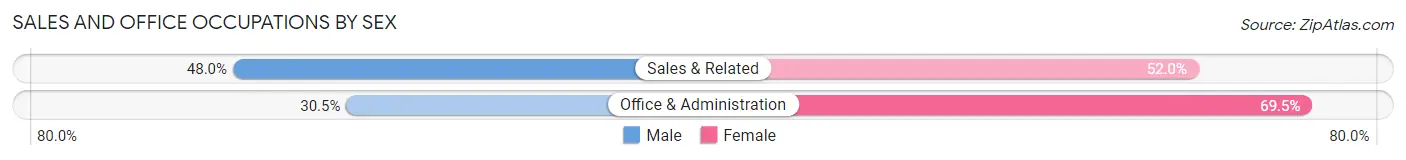
| Occupation | Male | Female |
| Sales & Related | 1,997 (48.0%) | 2,167 (52.0%) |
| Office & Administration | 1,111 (30.5%) | 2,530 (69.5%) |
| Total (Category) | 3,108 (39.8%) | 4,697 (60.2%) |
| Total (Overall) | 21,317 (53.8%) | 18,298 (46.2%) |
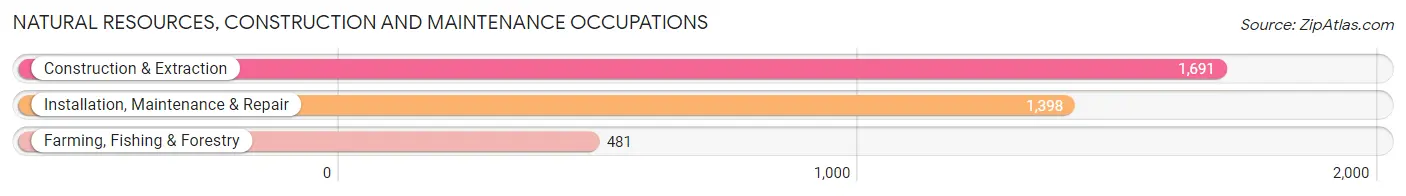
Natural Resources, Construction and Maintenance Occupations
The most common Natural Resources, Construction and Maintenance occupations in Grand Forks County are Construction & Extraction (1,691 | 4.3%), Installation, Maintenance & Repair (1,398 | 3.5%), and Farming, Fishing & Forestry (481 | 1.2%).
Natural Resources, Construction and Maintenance Occupations by Sex
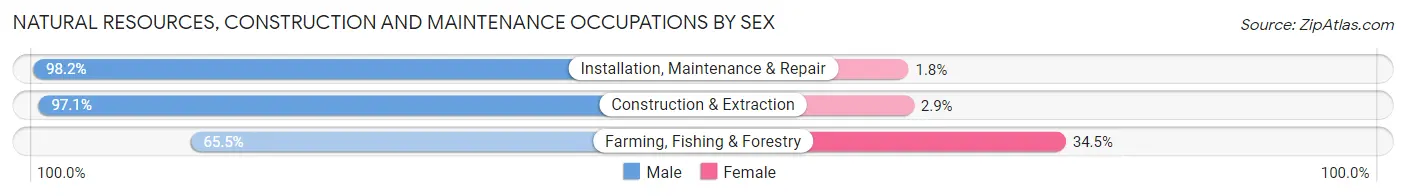
| Occupation | Male | Female |
| Farming, Fishing & Forestry | 315 (65.5%) | 166 (34.5%) |
| Construction & Extraction | 1,642 (97.1%) | 49 (2.9%) |
| Installation, Maintenance & Repair | 1,373 (98.2%) | 25 (1.8%) |
| Total (Category) | 3,330 (93.3%) | 240 (6.7%) |
| Total (Overall) | 21,317 (53.8%) | 18,298 (46.2%) |
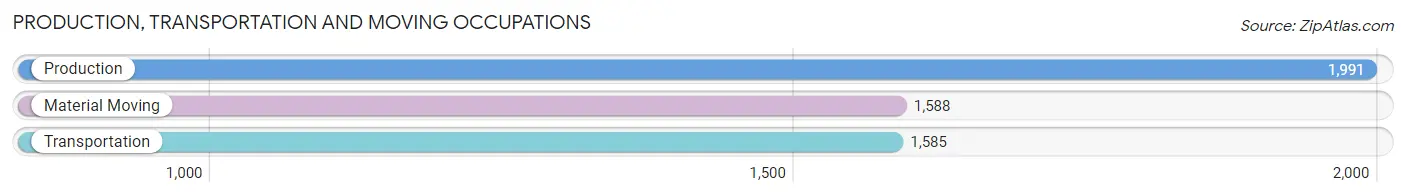
Production, Transportation and Moving Occupations
The most common Production, Transportation and Moving occupations in Grand Forks County are Production (1,991 | 5.0%), Material Moving (1,588 | 4.0%), and Transportation (1,585 | 4.0%).
Production, Transportation and Moving Occupations by Sex
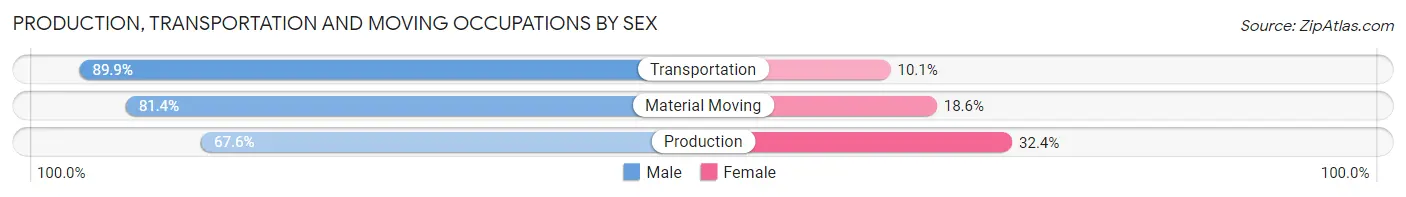
| Occupation | Male | Female |
| Production | 1,346 (67.6%) | 645 (32.4%) |
| Transportation | 1,425 (89.9%) | 160 (10.1%) |
| Material Moving | 1,293 (81.4%) | 295 (18.6%) |
| Total (Category) | 4,064 (78.7%) | 1,100 (21.3%) |
| Total (Overall) | 21,317 (53.8%) | 18,298 (46.2%) |
Employment Industries by Sex in Grand Forks County
Employment Industries in Grand Forks County
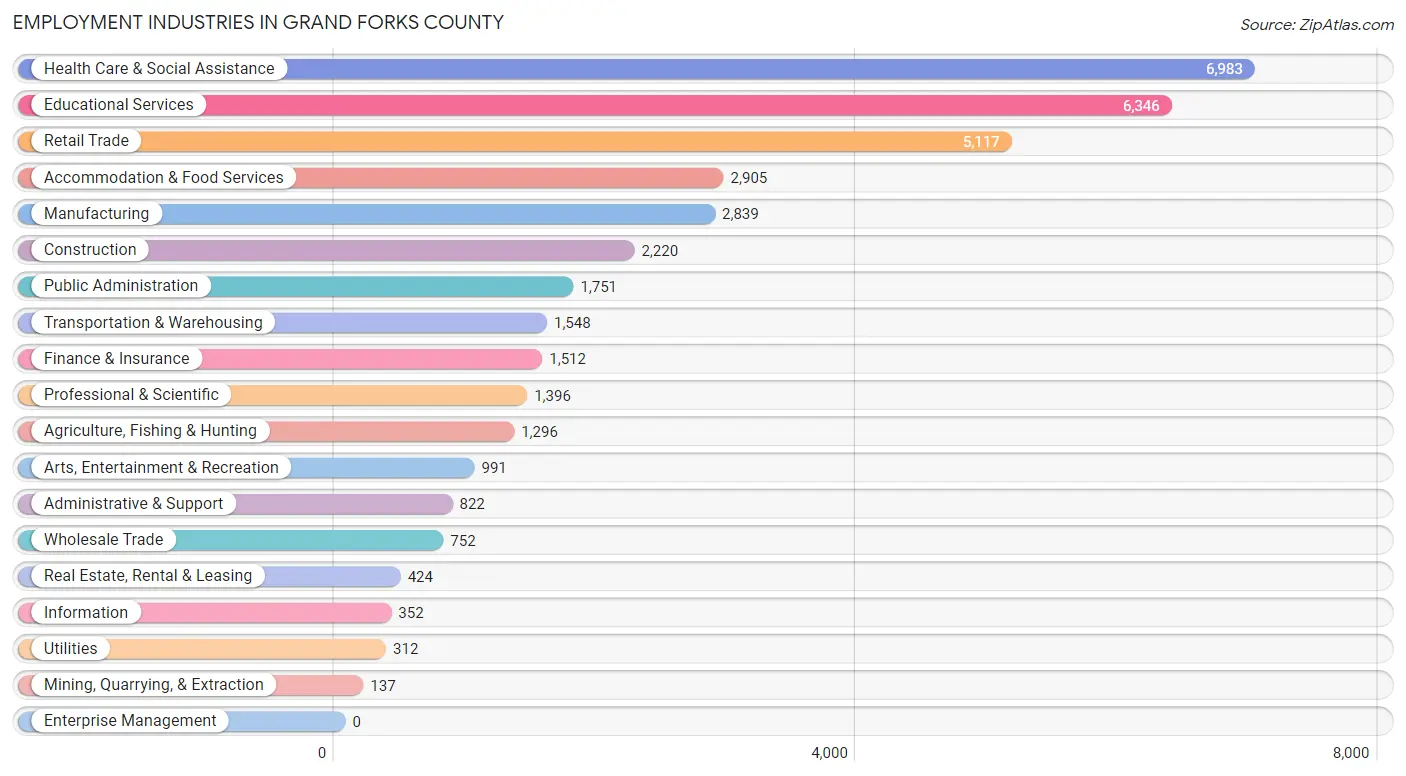
The major employment industries in Grand Forks County include Health Care & Social Assistance (6,983 | 17.6%), Educational Services (6,346 | 16.0%), Retail Trade (5,117 | 12.9%), Accommodation & Food Services (2,905 | 7.3%), and Manufacturing (2,839 | 7.2%).
Employment Industries by Sex in Grand Forks County
The Grand Forks County industries that see more men than women are Mining, Quarrying, & Extraction (99.3%), Construction (92.4%), and Transportation & Warehousing (88.5%), whereas the industries that tend to have a higher number of women are Health Care & Social Assistance (75.4%), Educational Services (54.3%), and Administrative & Support (52.8%).
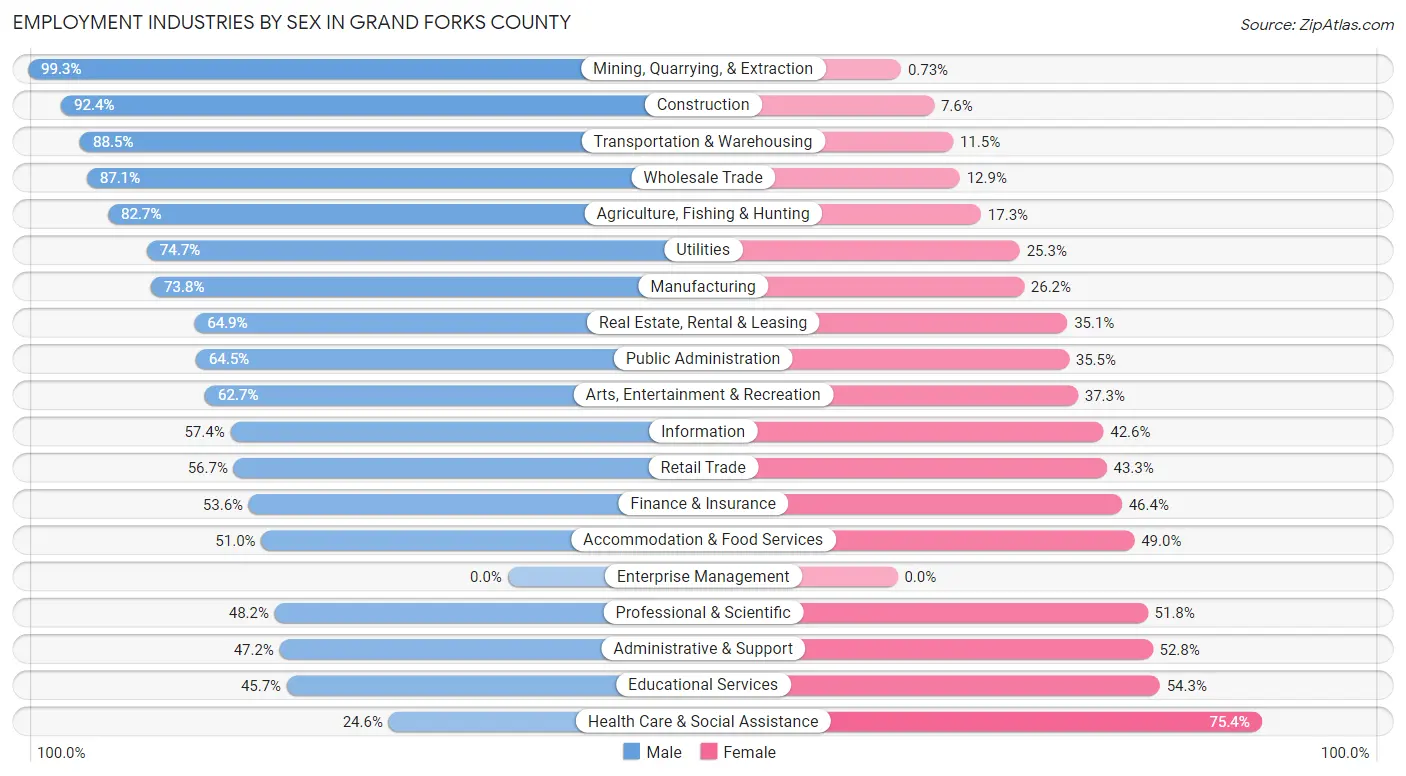
| Industry | Male | Female |
| Agriculture, Fishing & Hunting | 1,072 (82.7%) | 224 (17.3%) |
| Mining, Quarrying, & Extraction | 136 (99.3%) | 1 (0.7%) |
| Construction | 2,052 (92.4%) | 168 (7.6%) |
| Manufacturing | 2,096 (73.8%) | 743 (26.2%) |
| Wholesale Trade | 655 (87.1%) | 97 (12.9%) |
| Retail Trade | 2,902 (56.7%) | 2,215 (43.3%) |
| Transportation & Warehousing | 1,370 (88.5%) | 178 (11.5%) |
| Utilities | 233 (74.7%) | 79 (25.3%) |
| Information | 202 (57.4%) | 150 (42.6%) |
| Finance & Insurance | 810 (53.6%) | 702 (46.4%) |
| Real Estate, Rental & Leasing | 275 (64.9%) | 149 (35.1%) |
| Professional & Scientific | 673 (48.2%) | 723 (51.8%) |
| Enterprise Management | 0 (0.0%) | 0 (0.0%) |
| Administrative & Support | 388 (47.2%) | 434 (52.8%) |
| Educational Services | 2,900 (45.7%) | 3,446 (54.3%) |
| Health Care & Social Assistance | 1,720 (24.6%) | 5,263 (75.4%) |
| Arts, Entertainment & Recreation | 621 (62.7%) | 370 (37.3%) |
| Accommodation & Food Services | 1,481 (51.0%) | 1,424 (49.0%) |
| Public Administration | 1,130 (64.5%) | 621 (35.5%) |
| Total | 21,317 (53.8%) | 18,298 (46.2%) |
Education in Grand Forks County
School Enrollment in Grand Forks County
The most common levels of schooling among the 23,604 students in Grand Forks County are college / undergraduate (10,841 | 45.9%), middle school (3,499 | 14.8%), and elementary school (3,012 | 12.8%).
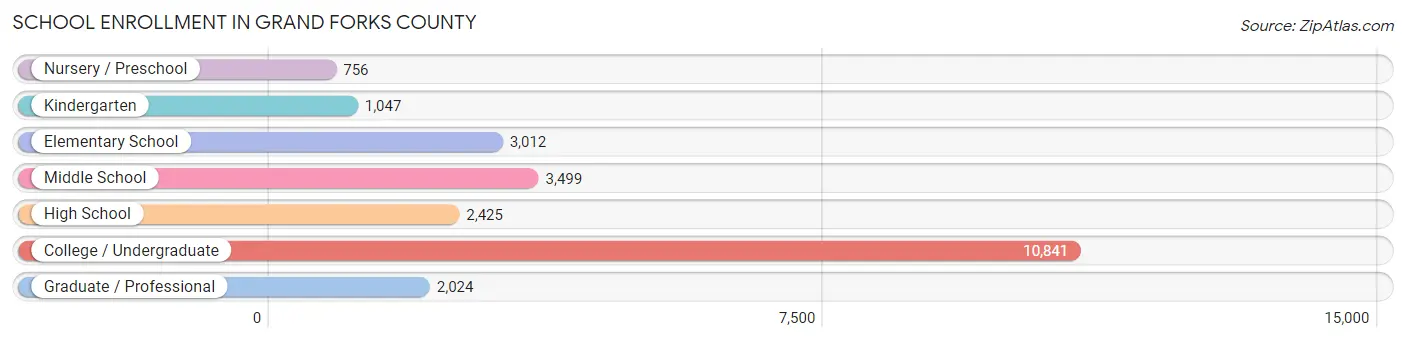
| School Level | # Students | % Students |
| Nursery / Preschool | 756 | 3.2% |
| Kindergarten | 1,047 | 4.4% |
| Elementary School | 3,012 | 12.8% |
| Middle School | 3,499 | 14.8% |
| High School | 2,425 | 10.3% |
| College / Undergraduate | 10,841 | 45.9% |
| Graduate / Professional | 2,024 | 8.6% |
| Total | 23,604 | 100.0% |
School Enrollment by Age by Funding Source in Grand Forks County
Out of a total of 23,604 students who are enrolled in schools in Grand Forks County, 1,770 (7.5%) attend a private institution, while the remaining 21,834 (92.5%) are enrolled in public schools. The age group of 3 to 4 year olds has the highest likelihood of being enrolled in private schools, with 140 (27.1% in the age bracket) enrolled. Conversely, the age group of 18 to 19 year olds has the lowest likelihood of being enrolled in a private school, with 3,395 (99.6% in the age bracket) attending a public institution.
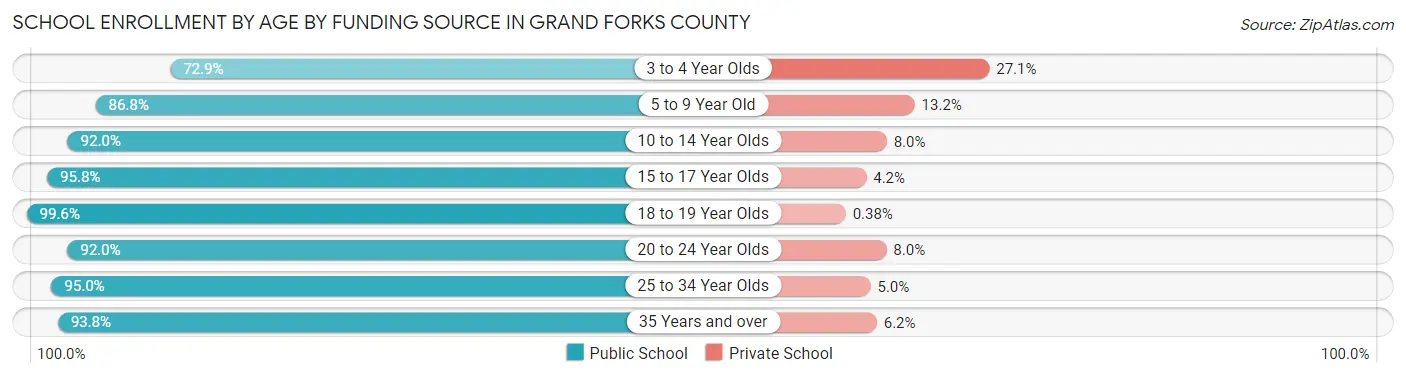
| Age Bracket | Public School | Private School |
| 3 to 4 Year Olds | 376 (72.9%) | 140 (27.1%) |
| 5 to 9 Year Old | 3,367 (86.8%) | 513 (13.2%) |
| 10 to 14 Year Olds | 3,890 (92.0%) | 339 (8.0%) |
| 15 to 17 Year Olds | 1,958 (95.8%) | 86 (4.2%) |
| 18 to 19 Year Olds | 3,395 (99.6%) | 13 (0.4%) |
| 20 to 24 Year Olds | 6,058 (92.0%) | 524 (8.0%) |
| 25 to 34 Year Olds | 1,843 (95.0%) | 97 (5.0%) |
| 35 Years and over | 943 (93.8%) | 62 (6.2%) |
| Total | 21,834 (92.5%) | 1,770 (7.5%) |
Educational Attainment by Field of Study in Grand Forks County
Business (3,124 | 17.9%), science & technology (2,572 | 14.7%), education (2,156 | 12.3%), arts & humanities (2,085 | 11.9%), and bio, nature & agricultural (1,247 | 7.1%) are the most common fields of study among 17,453 individuals in Grand Forks County who have obtained a bachelor's degree or higher.
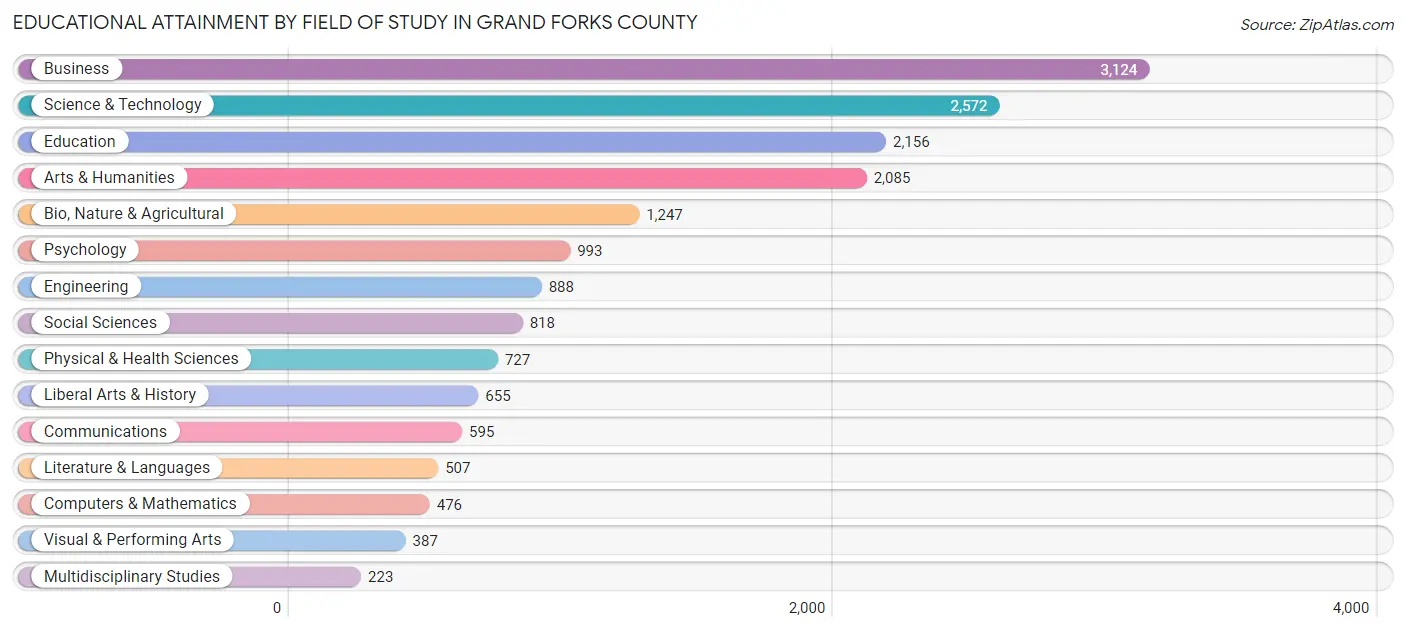
| Field of Study | # Graduates | % Graduates |
| Computers & Mathematics | 476 | 2.7% |
| Bio, Nature & Agricultural | 1,247 | 7.1% |
| Physical & Health Sciences | 727 | 4.2% |
| Psychology | 993 | 5.7% |
| Social Sciences | 818 | 4.7% |
| Engineering | 888 | 5.1% |
| Multidisciplinary Studies | 223 | 1.3% |
| Science & Technology | 2,572 | 14.7% |
| Business | 3,124 | 17.9% |
| Education | 2,156 | 12.3% |
| Literature & Languages | 507 | 2.9% |
| Liberal Arts & History | 655 | 3.7% |
| Visual & Performing Arts | 387 | 2.2% |
| Communications | 595 | 3.4% |
| Arts & Humanities | 2,085 | 11.9% |
| Total | 17,453 | 100.0% |
Transportation & Commute in Grand Forks County
Vehicle Availability by Sex in Grand Forks County
The most prevalent vehicle ownership categories in Grand Forks County are males with 2 vehicles (8,587, accounting for 41.0%) and females with 2 vehicles (7,141, making up 49.6%).
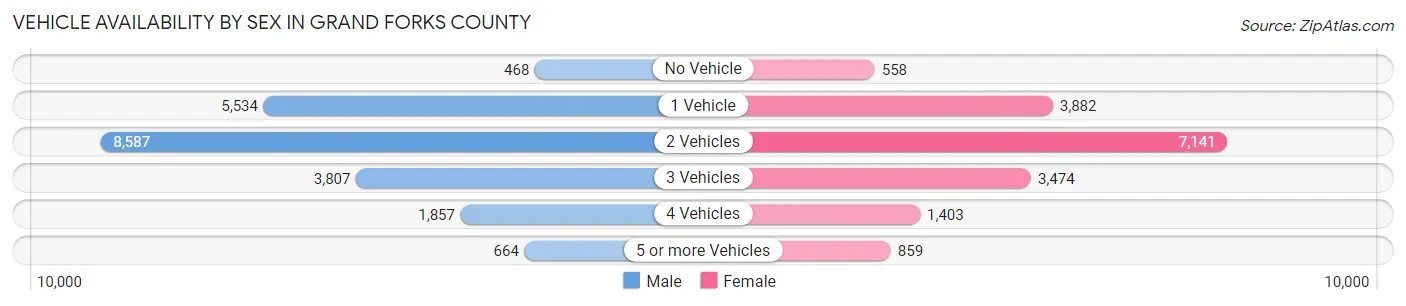
| Vehicles Available | Male | Female |
| No Vehicle | 468 (2.2%) | 558 (3.2%) |
| 1 Vehicle | 5,534 (26.5%) | 3,882 (22.4%) |
| 2 Vehicles | 8,587 (41.0%) | 7,141 (41.2%) |
| 3 Vehicles | 3,807 (18.2%) | 3,474 (20.1%) |
| 4 Vehicles | 1,857 (8.9%) | 1,403 (8.1%) |
| 5 or more Vehicles | 664 (3.2%) | 859 (5.0%) |
| Total | 20,917 (100.0%) | 17,317 (100.0%) |
Commute Time in Grand Forks County
The most frequently occuring commute durations in Grand Forks County are 10 to 14 minutes (11,813 commuters, 31.2%), 5 to 9 minutes (8,757 commuters, 23.1%), and 15 to 19 minutes (6,395 commuters, 16.9%).
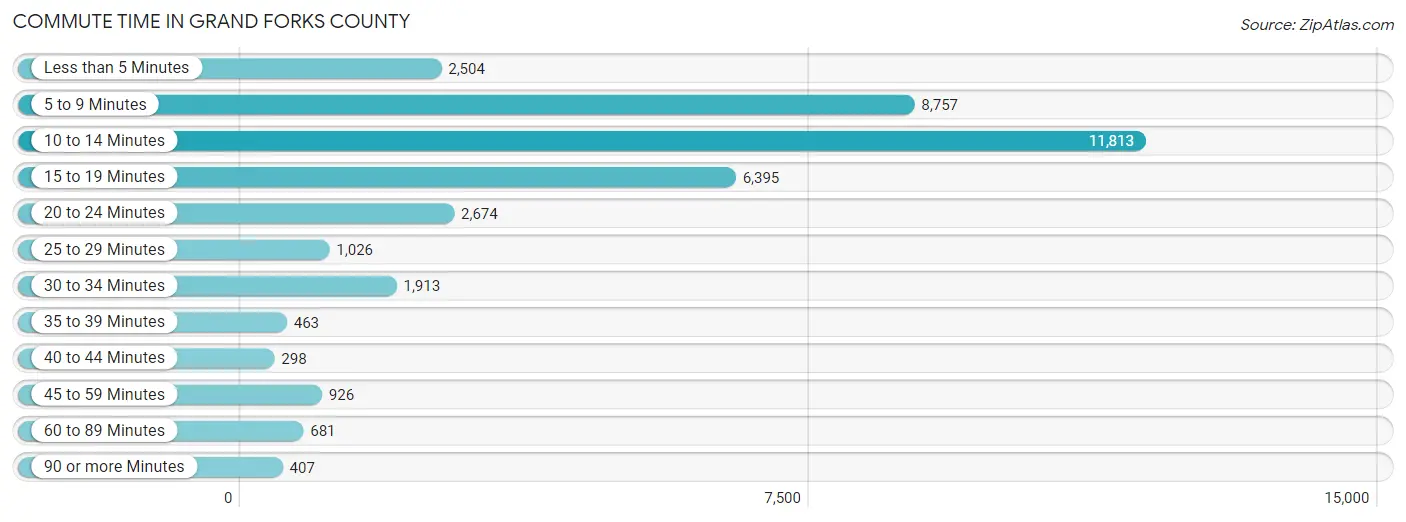
| Commute Time | # Commuters | % Commuters |
| Less than 5 Minutes | 2,504 | 6.6% |
| 5 to 9 Minutes | 8,757 | 23.1% |
| 10 to 14 Minutes | 11,813 | 31.2% |
| 15 to 19 Minutes | 6,395 | 16.9% |
| 20 to 24 Minutes | 2,674 | 7.1% |
| 25 to 29 Minutes | 1,026 | 2.7% |
| 30 to 34 Minutes | 1,913 | 5.1% |
| 35 to 39 Minutes | 463 | 1.2% |
| 40 to 44 Minutes | 298 | 0.8% |
| 45 to 59 Minutes | 926 | 2.5% |
| 60 to 89 Minutes | 681 | 1.8% |
| 90 or more Minutes | 407 | 1.1% |
Commute Time by Sex in Grand Forks County
The most common commute times in Grand Forks County are 10 to 14 minutes (6,571 commuters, 31.3%) for males and 10 to 14 minutes (5,242 commuters, 31.1%) for females.
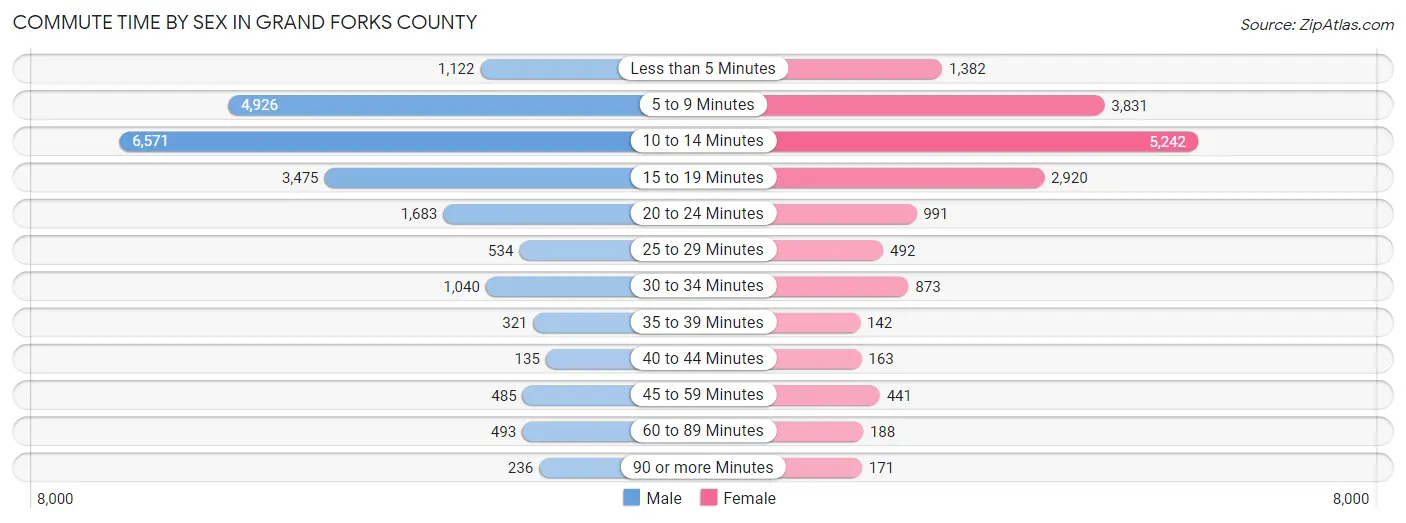
| Commute Time | Male | Female |
| Less than 5 Minutes | 1,122 (5.3%) | 1,382 (8.2%) |
| 5 to 9 Minutes | 4,926 (23.4%) | 3,831 (22.8%) |
| 10 to 14 Minutes | 6,571 (31.3%) | 5,242 (31.1%) |
| 15 to 19 Minutes | 3,475 (16.5%) | 2,920 (17.3%) |
| 20 to 24 Minutes | 1,683 (8.0%) | 991 (5.9%) |
| 25 to 29 Minutes | 534 (2.5%) | 492 (2.9%) |
| 30 to 34 Minutes | 1,040 (5.0%) | 873 (5.2%) |
| 35 to 39 Minutes | 321 (1.5%) | 142 (0.8%) |
| 40 to 44 Minutes | 135 (0.6%) | 163 (1.0%) |
| 45 to 59 Minutes | 485 (2.3%) | 441 (2.6%) |
| 60 to 89 Minutes | 493 (2.4%) | 188 (1.1%) |
| 90 or more Minutes | 236 (1.1%) | 171 (1.0%) |
Time of Departure to Work by Sex in Grand Forks County
The most frequent times of departure to work in Grand Forks County are 7:30 AM to 7:59 AM (3,732, 17.7%) for males and 7:30 AM to 7:59 AM (3,570, 21.2%) for females.
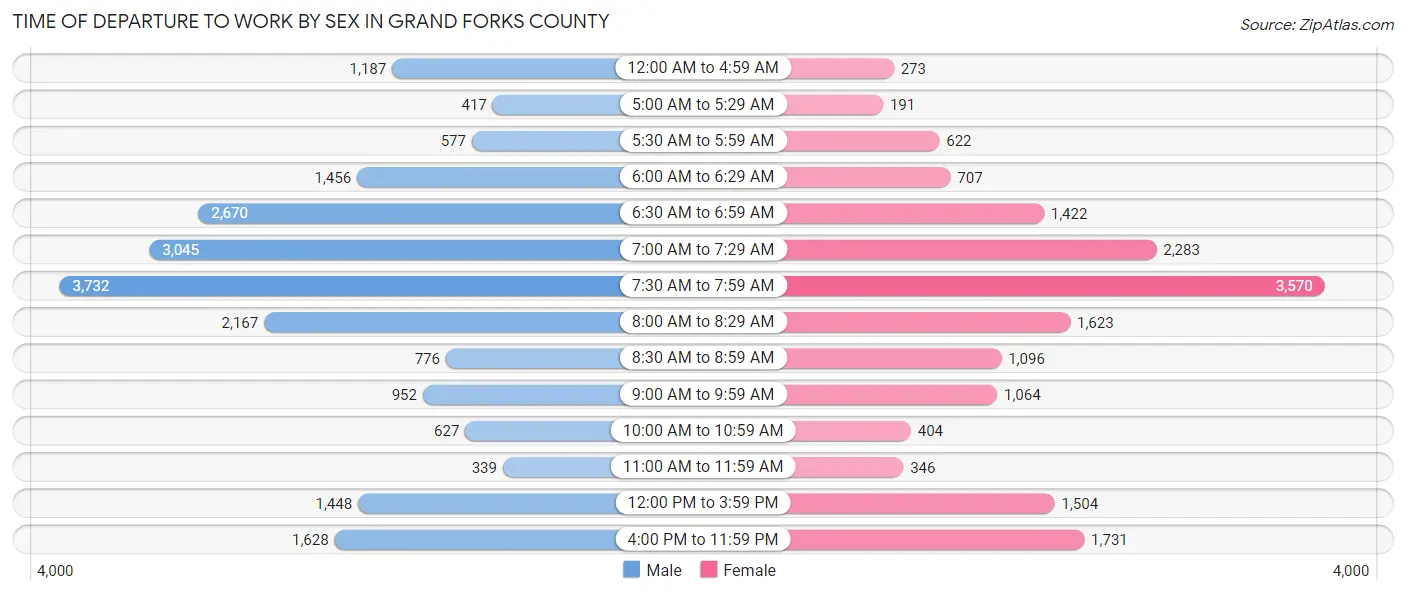
| Time of Departure | Male | Female |
| 12:00 AM to 4:59 AM | 1,187 (5.7%) | 273 (1.6%) |
| 5:00 AM to 5:29 AM | 417 (2.0%) | 191 (1.1%) |
| 5:30 AM to 5:59 AM | 577 (2.7%) | 622 (3.7%) |
| 6:00 AM to 6:29 AM | 1,456 (6.9%) | 707 (4.2%) |
| 6:30 AM to 6:59 AM | 2,670 (12.7%) | 1,422 (8.5%) |
| 7:00 AM to 7:29 AM | 3,045 (14.5%) | 2,283 (13.6%) |
| 7:30 AM to 7:59 AM | 3,732 (17.7%) | 3,570 (21.2%) |
| 8:00 AM to 8:29 AM | 2,167 (10.3%) | 1,623 (9.6%) |
| 8:30 AM to 8:59 AM | 776 (3.7%) | 1,096 (6.5%) |
| 9:00 AM to 9:59 AM | 952 (4.5%) | 1,064 (6.3%) |
| 10:00 AM to 10:59 AM | 627 (3.0%) | 404 (2.4%) |
| 11:00 AM to 11:59 AM | 339 (1.6%) | 346 (2.1%) |
| 12:00 PM to 3:59 PM | 1,448 (6.9%) | 1,504 (8.9%) |
| 4:00 PM to 11:59 PM | 1,628 (7.7%) | 1,731 (10.3%) |
| Total | 21,021 (100.0%) | 16,836 (100.0%) |
Housing Occupancy in Grand Forks County
Occupancy by Ownership in Grand Forks County
Of the total 30,735 dwellings in Grand Forks County, owner-occupied units account for 15,720 (51.1%), while renter-occupied units make up 15,015 (48.8%).
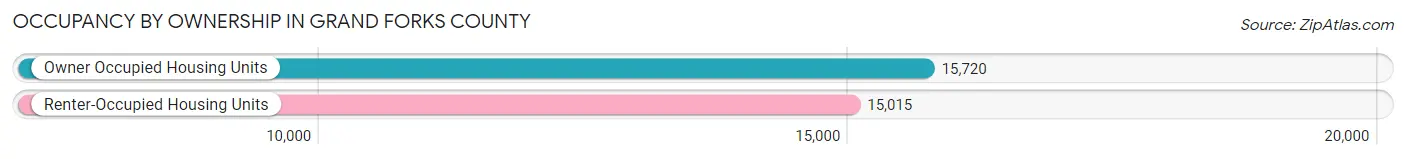
| Occupancy | # Housing Units | % Housing Units |
| Owner Occupied Housing Units | 15,720 | 51.1% |
| Renter-Occupied Housing Units | 15,015 | 48.8% |
| Total Occupied Housing Units | 30,735 | 100.0% |
Occupancy by Household Size in Grand Forks County
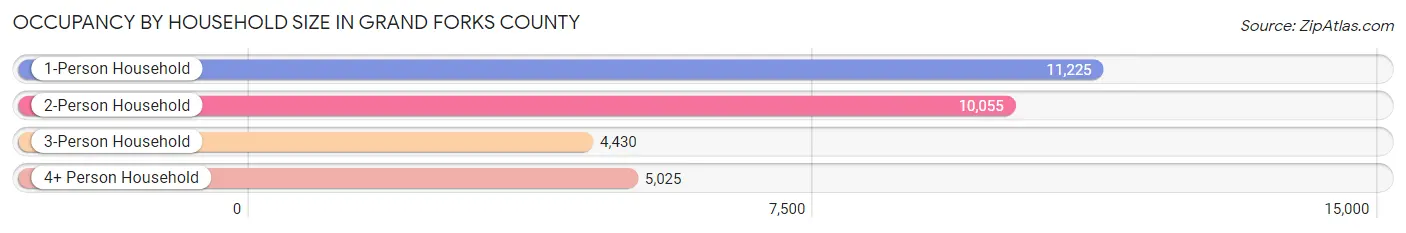
| Household Size | # Housing Units | % Housing Units |
| 1-Person Household | 11,225 | 36.5% |
| 2-Person Household | 10,055 | 32.7% |
| 3-Person Household | 4,430 | 14.4% |
| 4+ Person Household | 5,025 | 16.4% |
| Total Housing Units | 30,735 | 100.0% |
Occupancy by Ownership by Household Size in Grand Forks County
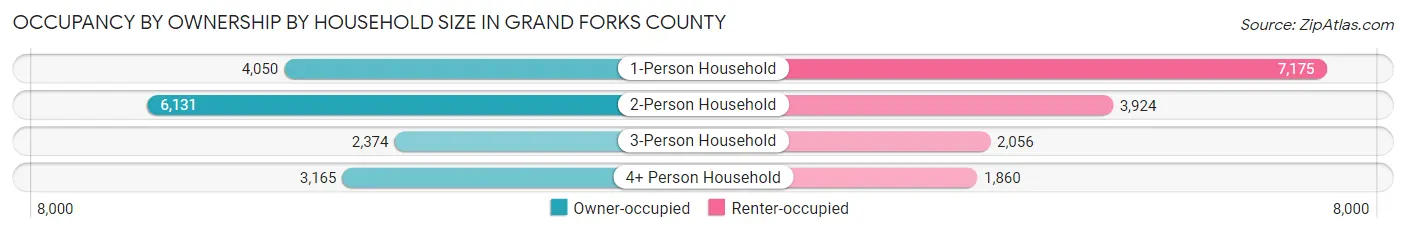
| Household Size | Owner-occupied | Renter-occupied |
| 1-Person Household | 4,050 (36.1%) | 7,175 (63.9%) |
| 2-Person Household | 6,131 (61.0%) | 3,924 (39.0%) |
| 3-Person Household | 2,374 (53.6%) | 2,056 (46.4%) |
| 4+ Person Household | 3,165 (63.0%) | 1,860 (37.0%) |
| Total Housing Units | 15,720 (51.1%) | 15,015 (48.8%) |
Occupancy by Educational Attainment in Grand Forks County
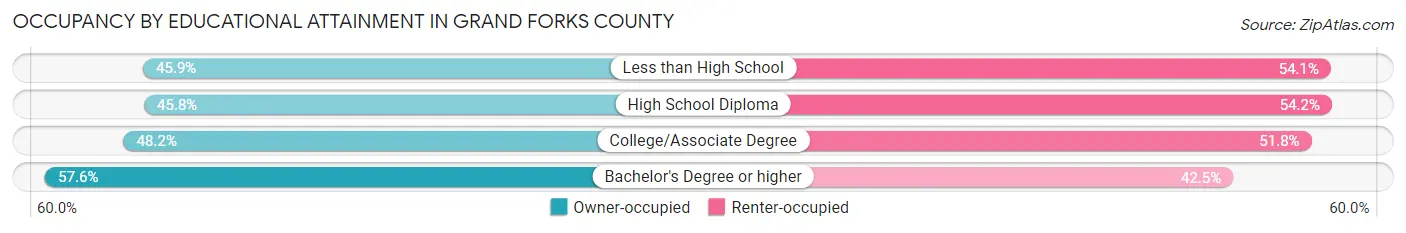
| Household Size | Owner-occupied | Renter-occupied |
| Less than High School | 428 (45.9%) | 504 (54.1%) |
| High School Diploma | 2,804 (45.8%) | 3,318 (54.2%) |
| College/Associate Degree | 5,900 (48.2%) | 6,333 (51.8%) |
| Bachelor's Degree or higher | 6,588 (57.6%) | 4,860 (42.4%) |
Occupancy by Age of Householder in Grand Forks County
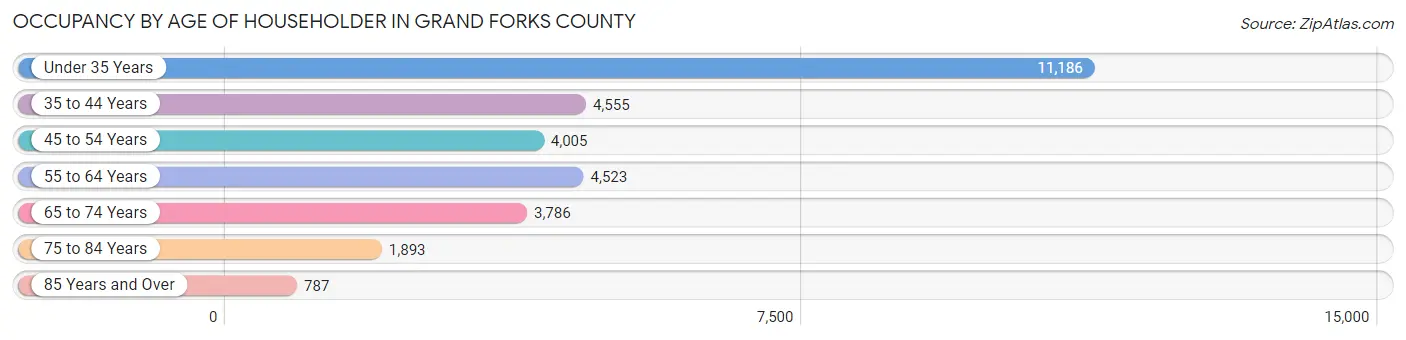
| Age Bracket | # Households | % Households |
| Under 35 Years | 11,186 | 36.4% |
| 35 to 44 Years | 4,555 | 14.8% |
| 45 to 54 Years | 4,005 | 13.0% |
| 55 to 64 Years | 4,523 | 14.7% |
| 65 to 74 Years | 3,786 | 12.3% |
| 75 to 84 Years | 1,893 | 6.2% |
| 85 Years and Over | 787 | 2.6% |
| Total | 30,735 | 100.0% |
Housing Finances in Grand Forks County
Median Income by Occupancy in Grand Forks County
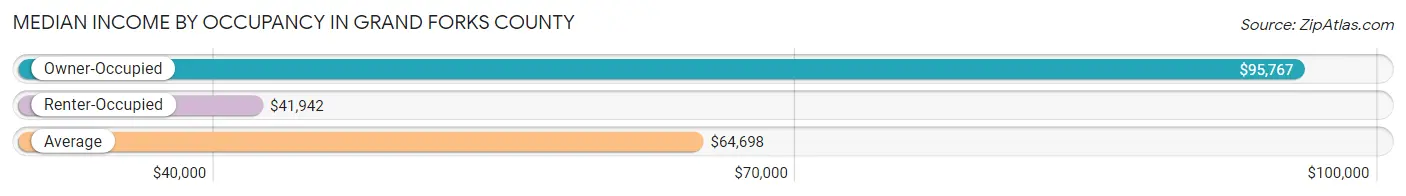
| Occupancy Type | # Households | Median Income |
| Owner-Occupied | 15,720 (51.1%) | $95,767 |
| Renter-Occupied | 15,015 (48.8%) | $41,942 |
| Average | 30,735 (100.0%) | $64,698 |
Occupancy by Householder Income Bracket in Grand Forks County
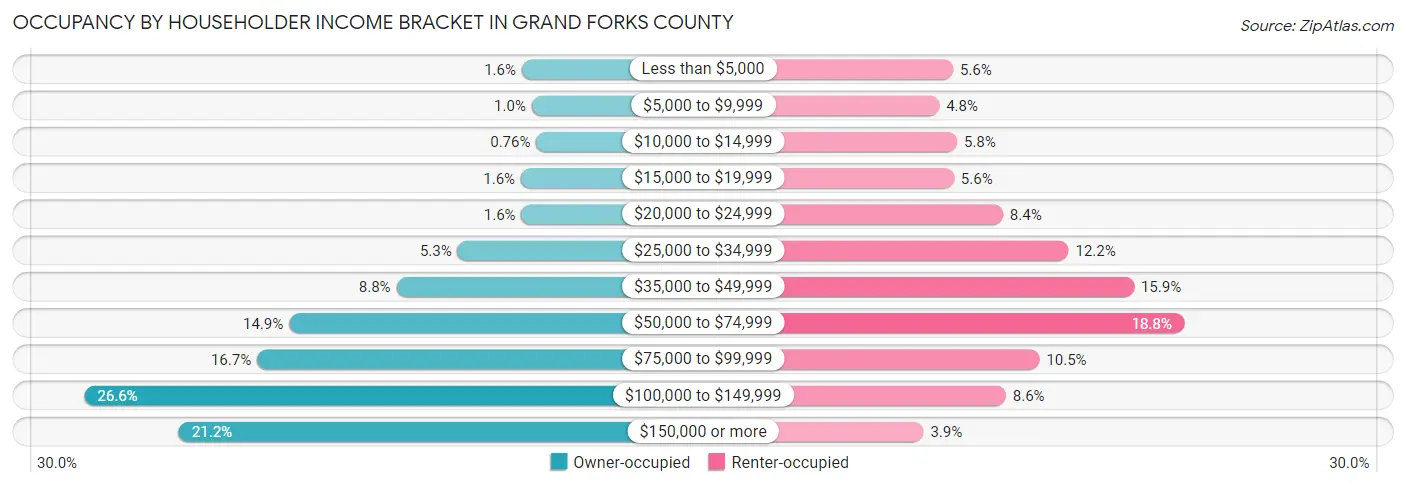
| Income Bracket | Owner-occupied | Renter-occupied |
| Less than $5,000 | 250 (1.6%) | 836 (5.6%) |
| $5,000 to $9,999 | 160 (1.0%) | 718 (4.8%) |
| $10,000 to $14,999 | 120 (0.8%) | 871 (5.8%) |
| $15,000 to $19,999 | 258 (1.6%) | 844 (5.6%) |
| $20,000 to $24,999 | 253 (1.6%) | 1,264 (8.4%) |
| $25,000 to $34,999 | 827 (5.3%) | 1,827 (12.2%) |
| $35,000 to $49,999 | 1,376 (8.7%) | 2,389 (15.9%) |
| $50,000 to $74,999 | 2,341 (14.9%) | 2,816 (18.8%) |
| $75,000 to $99,999 | 2,628 (16.7%) | 1,578 (10.5%) |
| $100,000 to $149,999 | 4,178 (26.6%) | 1,290 (8.6%) |
| $150,000 or more | 3,329 (21.2%) | 582 (3.9%) |
| Total | 15,720 (100.0%) | 15,015 (100.0%) |
Monthly Housing Cost Tiers in Grand Forks County
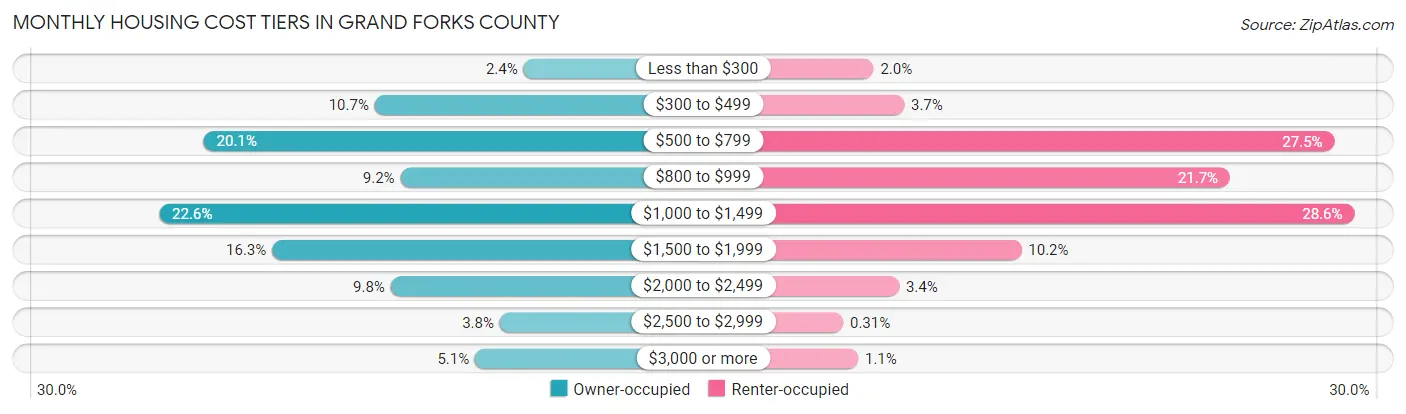
| Monthly Cost | Owner-occupied | Renter-occupied |
| Less than $300 | 383 (2.4%) | 299 (2.0%) |
| $300 to $499 | 1,675 (10.7%) | 553 (3.7%) |
| $500 to $799 | 3,161 (20.1%) | 4,121 (27.5%) |
| $800 to $999 | 1,453 (9.2%) | 3,255 (21.7%) |
| $1,000 to $1,499 | 3,548 (22.6%) | 4,287 (28.5%) |
| $1,500 to $1,999 | 2,567 (16.3%) | 1,526 (10.2%) |
| $2,000 to $2,499 | 1,538 (9.8%) | 510 (3.4%) |
| $2,500 to $2,999 | 590 (3.7%) | 46 (0.3%) |
| $3,000 or more | 805 (5.1%) | 171 (1.1%) |
| Total | 15,720 (100.0%) | 15,015 (100.0%) |
Physical Housing Characteristics in Grand Forks County
Housing Structures in Grand Forks County
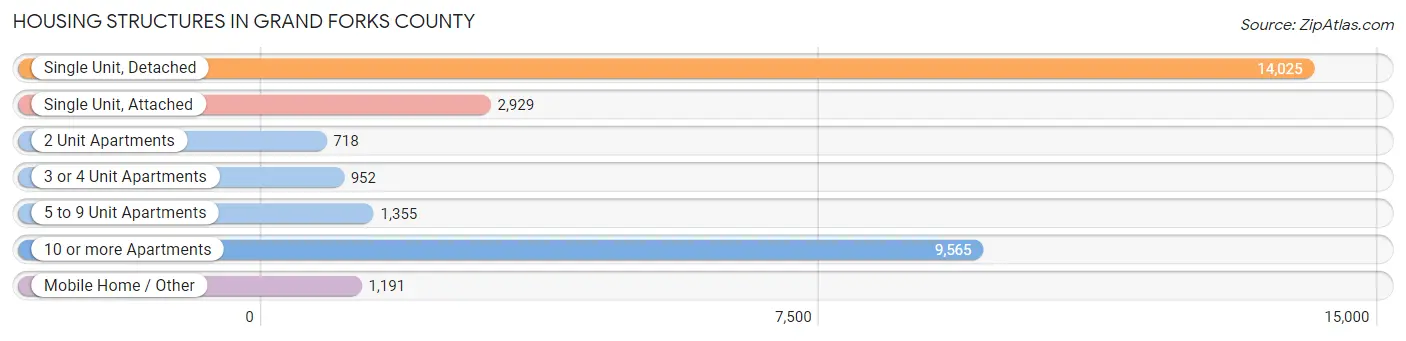
| Structure Type | # Housing Units | % Housing Units |
| Single Unit, Detached | 14,025 | 45.6% |
| Single Unit, Attached | 2,929 | 9.5% |
| 2 Unit Apartments | 718 | 2.3% |
| 3 or 4 Unit Apartments | 952 | 3.1% |
| 5 to 9 Unit Apartments | 1,355 | 4.4% |
| 10 or more Apartments | 9,565 | 31.1% |
| Mobile Home / Other | 1,191 | 3.9% |
| Total | 30,735 | 100.0% |
Housing Structures by Occupancy in Grand Forks County
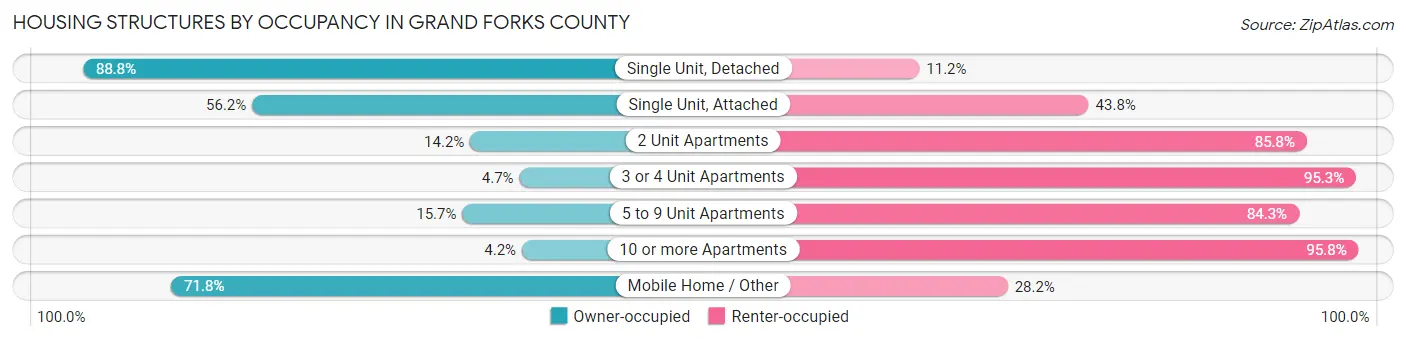
| Structure Type | Owner-occupied | Renter-occupied |
| Single Unit, Detached | 12,453 (88.8%) | 1,572 (11.2%) |
| Single Unit, Attached | 1,646 (56.2%) | 1,283 (43.8%) |
| 2 Unit Apartments | 102 (14.2%) | 616 (85.8%) |
| 3 or 4 Unit Apartments | 45 (4.7%) | 907 (95.3%) |
| 5 to 9 Unit Apartments | 213 (15.7%) | 1,142 (84.3%) |
| 10 or more Apartments | 406 (4.2%) | 9,159 (95.8%) |
| Mobile Home / Other | 855 (71.8%) | 336 (28.2%) |
| Total | 15,720 (51.1%) | 15,015 (48.8%) |
Housing Structures by Number of Rooms in Grand Forks County
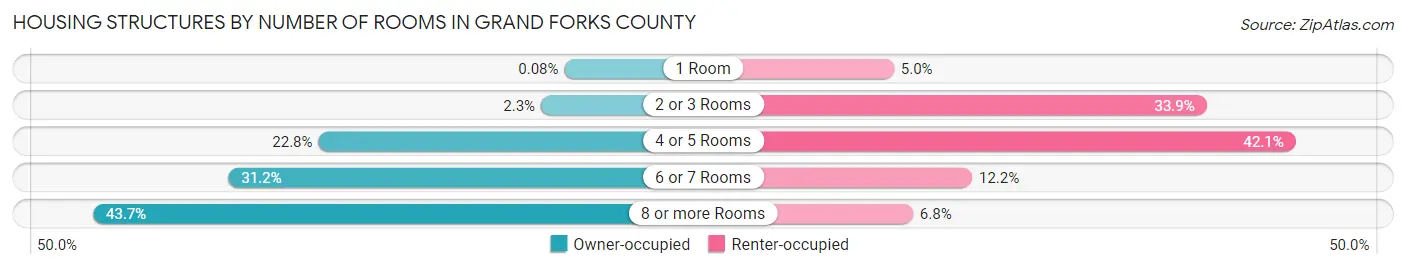
| Number of Rooms | Owner-occupied | Renter-occupied |
| 1 Room | 13 (0.1%) | 749 (5.0%) |
| 2 or 3 Rooms | 353 (2.2%) | 5,090 (33.9%) |
| 4 or 5 Rooms | 3,589 (22.8%) | 6,327 (42.1%) |
| 6 or 7 Rooms | 4,898 (31.2%) | 1,835 (12.2%) |
| 8 or more Rooms | 6,867 (43.7%) | 1,014 (6.8%) |
| Total | 15,720 (100.0%) | 15,015 (100.0%) |
Housing Structure by Heating Type in Grand Forks County
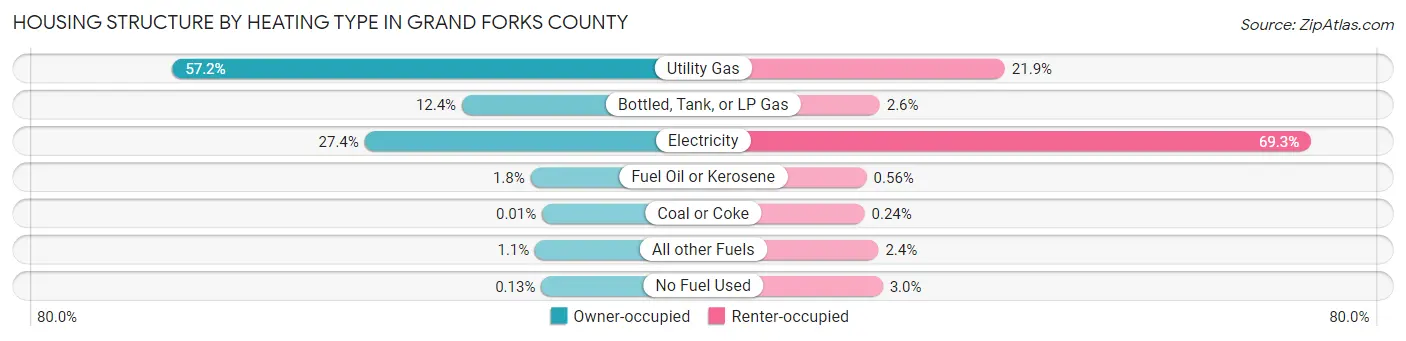
| Heating Type | Owner-occupied | Renter-occupied |
| Utility Gas | 8,984 (57.2%) | 3,293 (21.9%) |
| Bottled, Tank, or LP Gas | 1,947 (12.4%) | 389 (2.6%) |
| Electricity | 4,314 (27.4%) | 10,398 (69.3%) |
| Fuel Oil or Kerosene | 282 (1.8%) | 84 (0.6%) |
| Coal or Coke | 2 (0.0%) | 36 (0.2%) |
| All other Fuels | 170 (1.1%) | 359 (2.4%) |
| No Fuel Used | 21 (0.1%) | 456 (3.0%) |
| Total | 15,720 (100.0%) | 15,015 (100.0%) |
Household Vehicle Usage in Grand Forks County
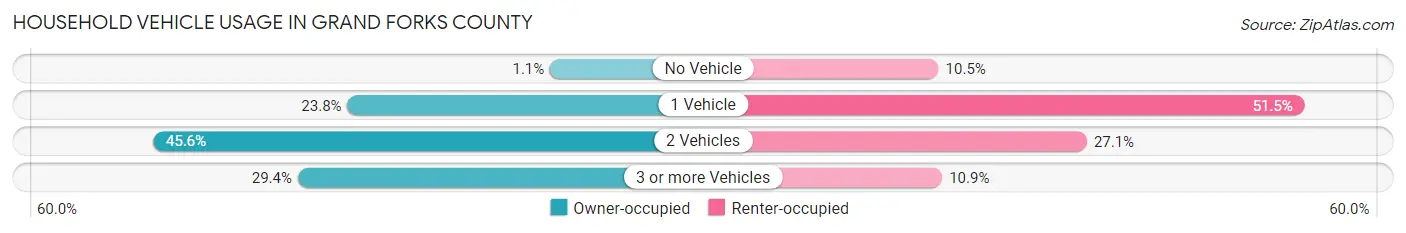
| Vehicles per Household | Owner-occupied | Renter-occupied |
| No Vehicle | 177 (1.1%) | 1,576 (10.5%) |
| 1 Vehicle | 3,748 (23.8%) | 7,733 (51.5%) |
| 2 Vehicles | 7,173 (45.6%) | 4,070 (27.1%) |
| 3 or more Vehicles | 4,622 (29.4%) | 1,636 (10.9%) |
| Total | 15,720 (100.0%) | 15,015 (100.0%) |
Real Estate & Mortgages in Grand Forks County
Real Estate and Mortgage Overview in Grand Forks County
| Characteristic | Without Mortgage | With Mortgage |
| Housing Units | 6,189 | 9,531 |
| Median Property Value | $217,800 | $245,700 |
| Median Household Income | $78,055 | $2,334 |
| Monthly Housing Costs | $599 | $799 |
| Real Estate Taxes | $2,315 | $202 |
Property Value by Mortgage Status in Grand Forks County
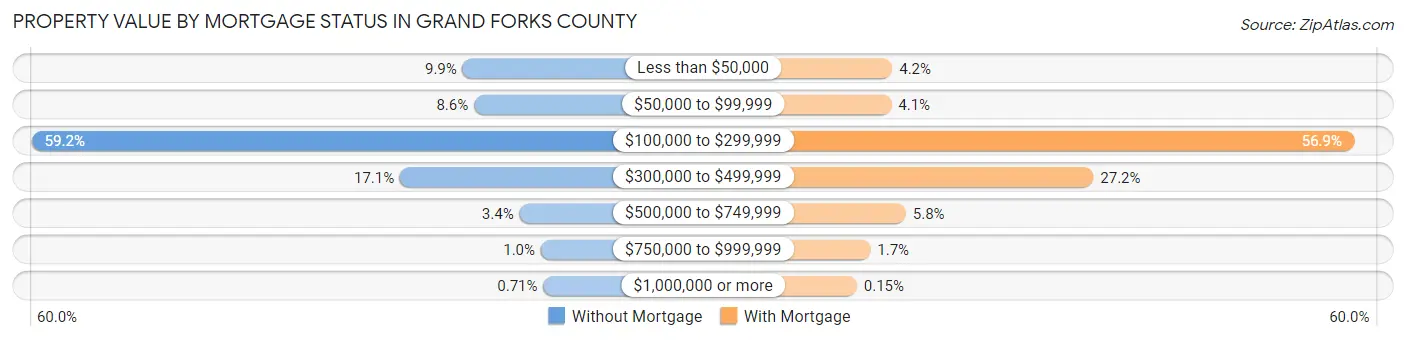
| Property Value | Without Mortgage | With Mortgage |
| Less than $50,000 | 615 (9.9%) | 400 (4.2%) |
| $50,000 to $99,999 | 534 (8.6%) | 390 (4.1%) |
| $100,000 to $299,999 | 3,663 (59.2%) | 5,427 (56.9%) |
| $300,000 to $499,999 | 1,058 (17.1%) | 2,591 (27.2%) |
| $500,000 to $749,999 | 213 (3.4%) | 548 (5.8%) |
| $750,000 to $999,999 | 62 (1.0%) | 161 (1.7%) |
| $1,000,000 or more | 44 (0.7%) | 14 (0.2%) |
| Total | 6,189 (100.0%) | 9,531 (100.0%) |
Household Income by Mortgage Status in Grand Forks County
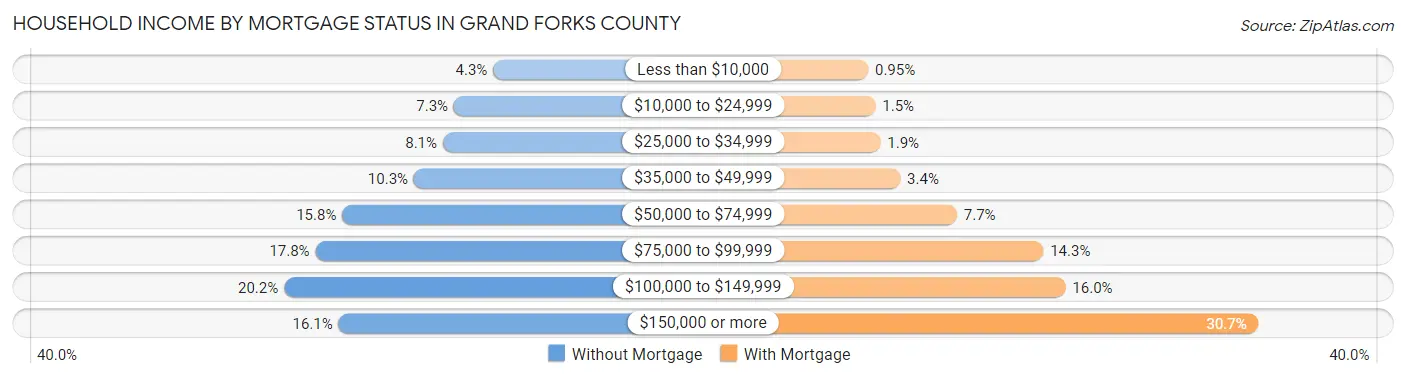
| Household Income | Without Mortgage | With Mortgage |
| Less than $10,000 | 266 (4.3%) | 91 (0.9%) |
| $10,000 to $24,999 | 451 (7.3%) | 144 (1.5%) |
| $25,000 to $34,999 | 503 (8.1%) | 180 (1.9%) |
| $35,000 to $49,999 | 640 (10.3%) | 324 (3.4%) |
| $50,000 to $74,999 | 978 (15.8%) | 736 (7.7%) |
| $75,000 to $99,999 | 1,104 (17.8%) | 1,363 (14.3%) |
| $100,000 to $149,999 | 1,252 (20.2%) | 1,524 (16.0%) |
| $150,000 or more | 995 (16.1%) | 2,926 (30.7%) |
| Total | 6,189 (100.0%) | 9,531 (100.0%) |
Property Value to Household Income Ratio in Grand Forks County
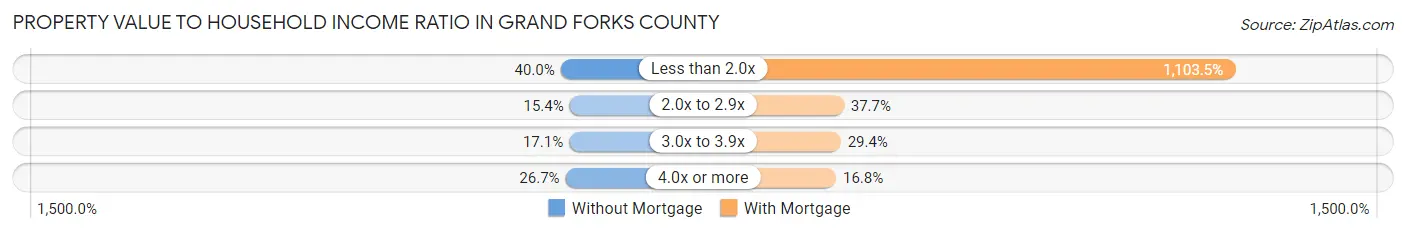
| Value-to-Income Ratio | Without Mortgage | With Mortgage |
| Less than 2.0x | 2,475 (40.0%) | 105,178 (1,103.5%) |
| 2.0x to 2.9x | 953 (15.4%) | 3,595 (37.7%) |
| 3.0x to 3.9x | 1,055 (17.1%) | 2,803 (29.4%) |
| 4.0x or more | 1,655 (26.7%) | 1,597 (16.8%) |
| Total | 6,189 (100.0%) | 9,531 (100.0%) |
Real Estate Taxes by Mortgage Status in Grand Forks County
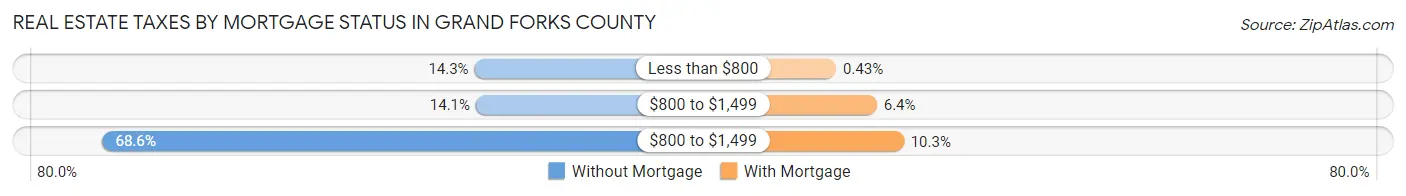
| Property Taxes | Without Mortgage | With Mortgage |
| Less than $800 | 883 (14.3%) | 41 (0.4%) |
| $800 to $1,499 | 870 (14.1%) | 609 (6.4%) |
| $800 to $1,499 | 4,246 (68.6%) | 985 (10.3%) |
| Total | 6,189 (100.0%) | 9,531 (100.0%) |
Health & Disability in Grand Forks County
Health Insurance Coverage by Age in Grand Forks County
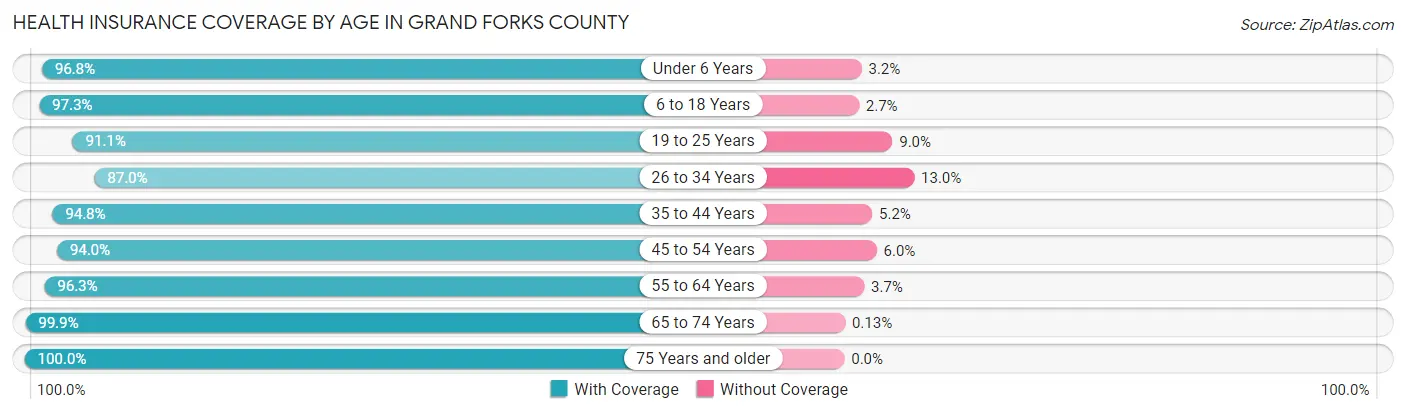
| Age Bracket | With Coverage | Without Coverage |
| Under 6 Years | 5,194 (96.8%) | 172 (3.2%) |
| 6 to 18 Years | 11,022 (97.3%) | 308 (2.7%) |
| 19 to 25 Years | 12,736 (91.0%) | 1,252 (8.9%) |
| 26 to 34 Years | 8,214 (87.0%) | 1,230 (13.0%) |
| 35 to 44 Years | 7,262 (94.8%) | 397 (5.2%) |
| 45 to 54 Years | 5,977 (94.0%) | 383 (6.0%) |
| 55 to 64 Years | 7,154 (96.3%) | 274 (3.7%) |
| 65 to 74 Years | 5,526 (99.9%) | 7 (0.1%) |
| 75 Years and older | 3,753 (100.0%) | 0 (0.0%) |
| Total | 66,838 (94.3%) | 4,023 (5.7%) |
Health Insurance Coverage by Citizenship Status in Grand Forks County
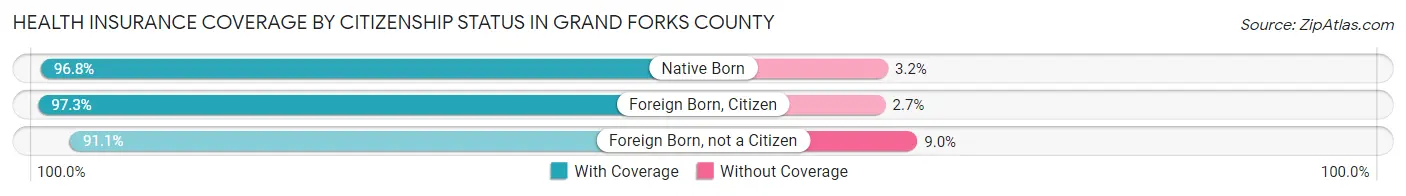
| Citizenship Status | With Coverage | Without Coverage |
| Native Born | 5,194 (96.8%) | 172 (3.2%) |
| Foreign Born, Citizen | 11,022 (97.3%) | 308 (2.7%) |
| Foreign Born, not a Citizen | 12,736 (91.0%) | 1,252 (8.9%) |
Health Insurance Coverage by Household Income in Grand Forks County
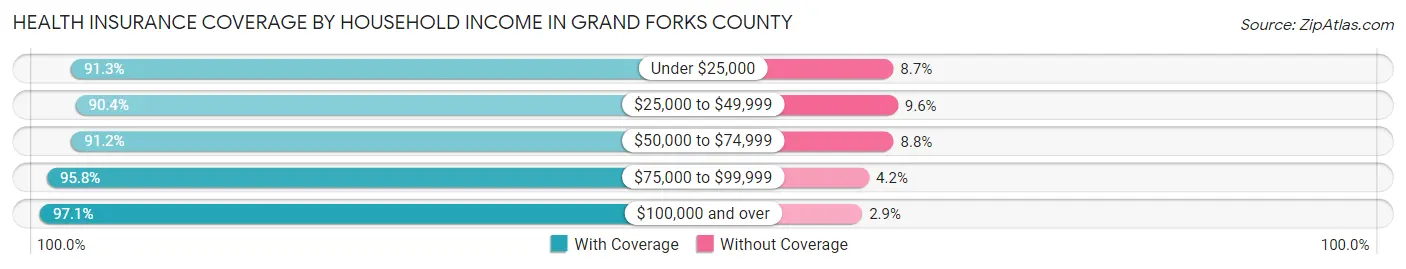
| Household Income | With Coverage | Without Coverage |
| Under $25,000 | 8,151 (91.3%) | 780 (8.7%) |
| $25,000 to $49,999 | 9,781 (90.4%) | 1,034 (9.6%) |
| $50,000 to $74,999 | 9,490 (91.2%) | 912 (8.8%) |
| $75,000 to $99,999 | 9,160 (95.8%) | 401 (4.2%) |
| $100,000 and over | 26,932 (97.1%) | 801 (2.9%) |
Public vs Private Health Insurance Coverage by Age in Grand Forks County
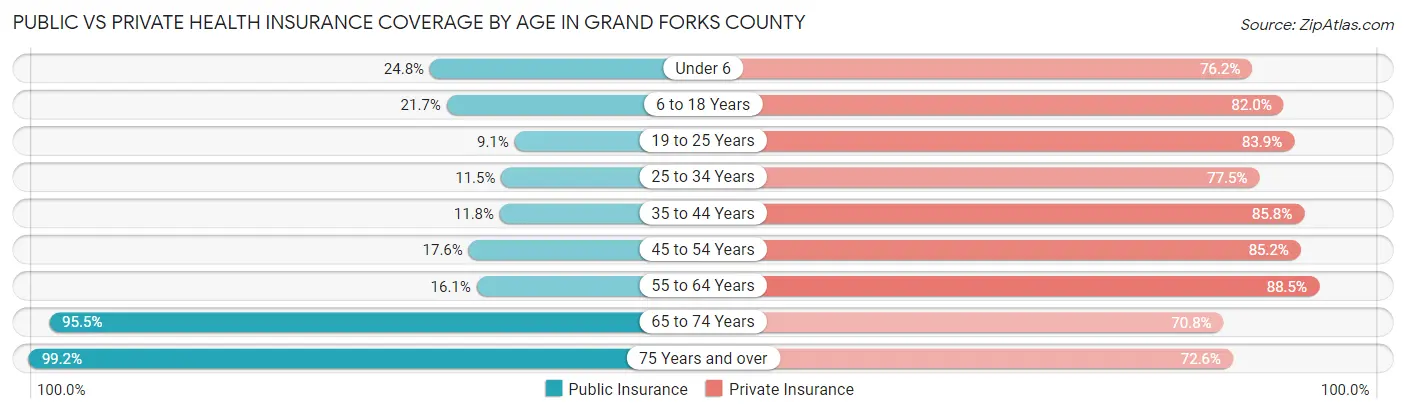
| Age Bracket | Public Insurance | Private Insurance |
| Under 6 | 1,329 (24.8%) | 4,088 (76.2%) |
| 6 to 18 Years | 2,454 (21.7%) | 9,292 (82.0%) |
| 19 to 25 Years | 1,266 (9.0%) | 11,741 (83.9%) |
| 25 to 34 Years | 1,088 (11.5%) | 7,319 (77.5%) |
| 35 to 44 Years | 902 (11.8%) | 6,571 (85.8%) |
| 45 to 54 Years | 1,118 (17.6%) | 5,417 (85.2%) |
| 55 to 64 Years | 1,196 (16.1%) | 6,576 (88.5%) |
| 65 to 74 Years | 5,281 (95.5%) | 3,919 (70.8%) |
| 75 Years and over | 3,724 (99.2%) | 2,724 (72.6%) |
| Total | 18,358 (25.9%) | 57,647 (81.4%) |
Disability Status by Sex by Age in Grand Forks County
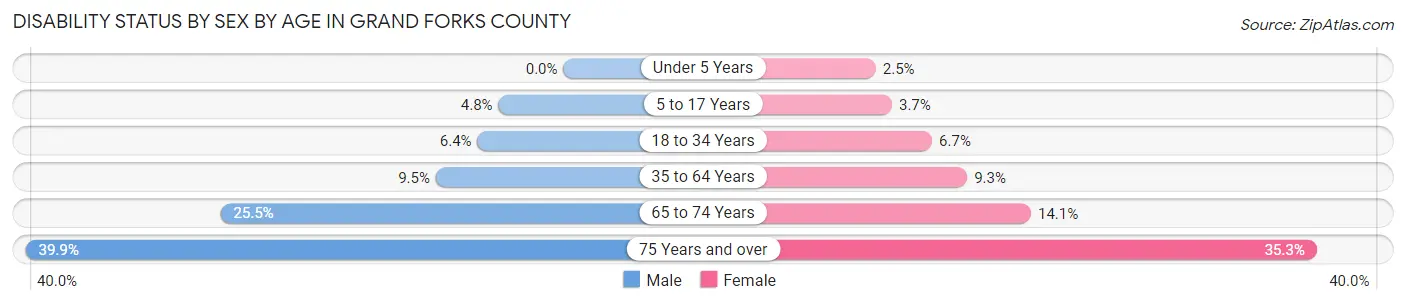
| Age Bracket | Male | Female |
| Under 5 Years | 0 (0.0%) | 55 (2.5%) |
| 5 to 17 Years | 260 (4.8%) | 192 (3.7%) |
| 18 to 34 Years | 853 (6.4%) | 776 (6.7%) |
| 35 to 64 Years | 1,045 (9.5%) | 969 (9.3%) |
| 65 to 74 Years | 686 (25.5%) | 399 (14.1%) |
| 75 Years and over | 595 (39.9%) | 798 (35.3%) |
Disability Class by Sex by Age in Grand Forks County
Disability Class: Hearing Difficulty
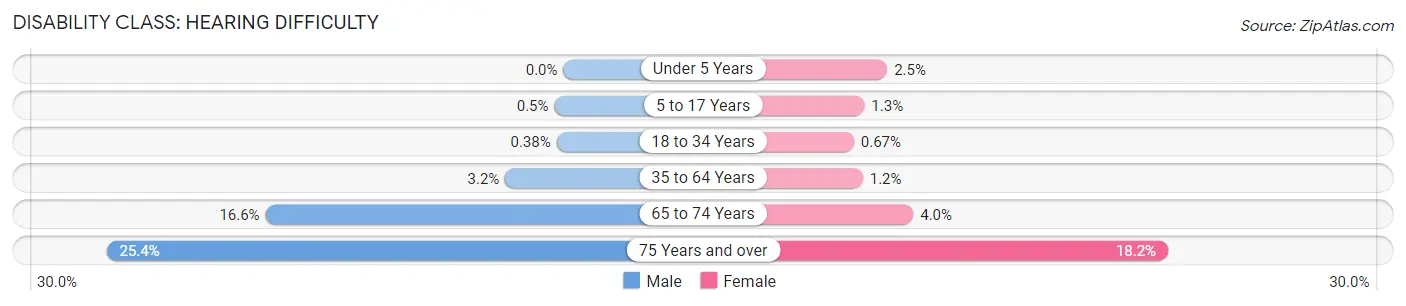
| Age Bracket | Male | Female |
| Under 5 Years | 0 (0.0%) | 55 (2.5%) |
| 5 to 17 Years | 27 (0.5%) | 65 (1.3%) |
| 18 to 34 Years | 51 (0.4%) | 77 (0.7%) |
| 35 to 64 Years | 358 (3.2%) | 122 (1.2%) |
| 65 to 74 Years | 447 (16.6%) | 113 (4.0%) |
| 75 Years and over | 379 (25.4%) | 411 (18.2%) |
Disability Class: Vision Difficulty
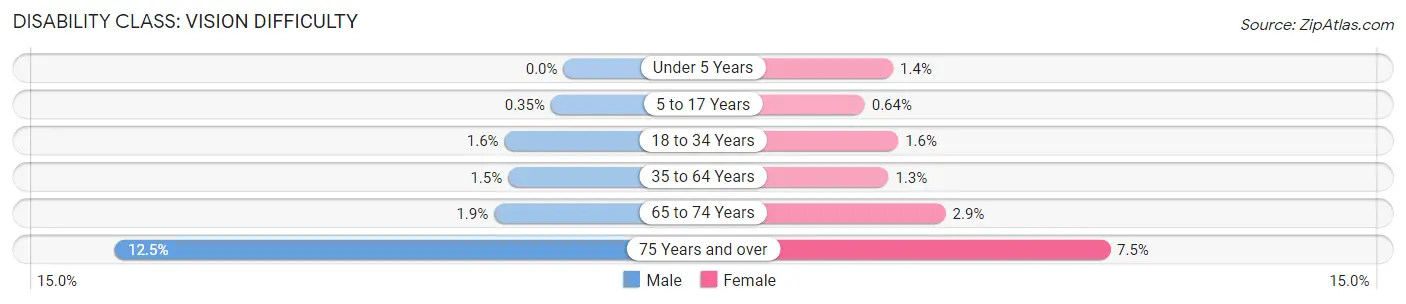
| Age Bracket | Male | Female |
| Under 5 Years | 0 (0.0%) | 31 (1.4%) |
| 5 to 17 Years | 19 (0.4%) | 33 (0.6%) |
| 18 to 34 Years | 219 (1.6%) | 182 (1.6%) |
| 35 to 64 Years | 170 (1.5%) | 135 (1.3%) |
| 65 to 74 Years | 52 (1.9%) | 82 (2.9%) |
| 75 Years and over | 186 (12.5%) | 169 (7.5%) |
Disability Class: Cognitive Difficulty
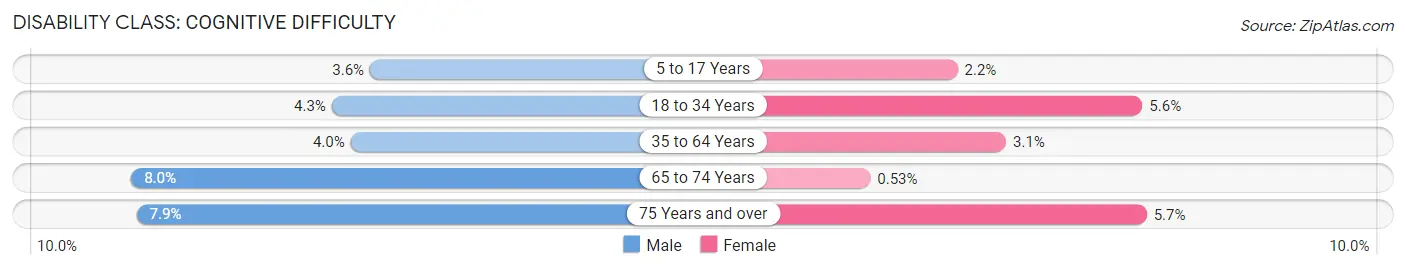
| Age Bracket | Male | Female |
| 5 to 17 Years | 194 (3.6%) | 111 (2.1%) |
| 18 to 34 Years | 575 (4.3%) | 645 (5.6%) |
| 35 to 64 Years | 436 (4.0%) | 317 (3.0%) |
| 65 to 74 Years | 216 (8.0%) | 15 (0.5%) |
| 75 Years and over | 118 (7.9%) | 128 (5.7%) |
Disability Class: Ambulatory Difficulty
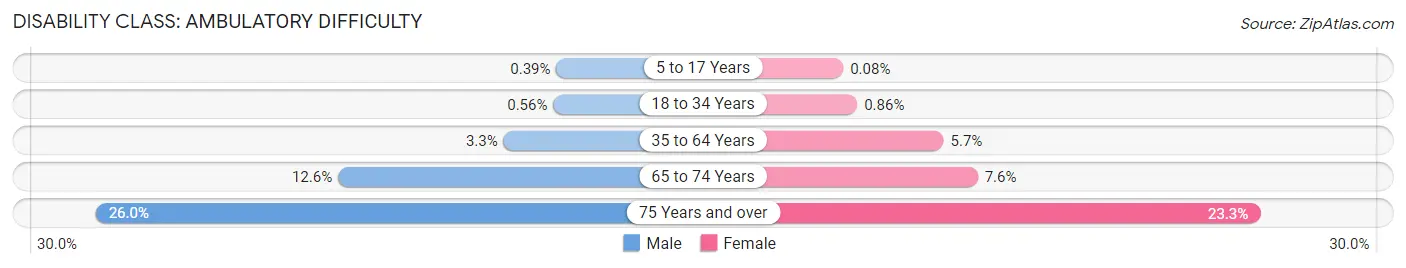
| Age Bracket | Male | Female |
| 5 to 17 Years | 21 (0.4%) | 4 (0.1%) |
| 18 to 34 Years | 75 (0.6%) | 99 (0.9%) |
| 35 to 64 Years | 368 (3.3%) | 590 (5.7%) |
| 65 to 74 Years | 338 (12.6%) | 215 (7.6%) |
| 75 Years and over | 388 (26.0%) | 527 (23.3%) |
Disability Class: Self-Care Difficulty
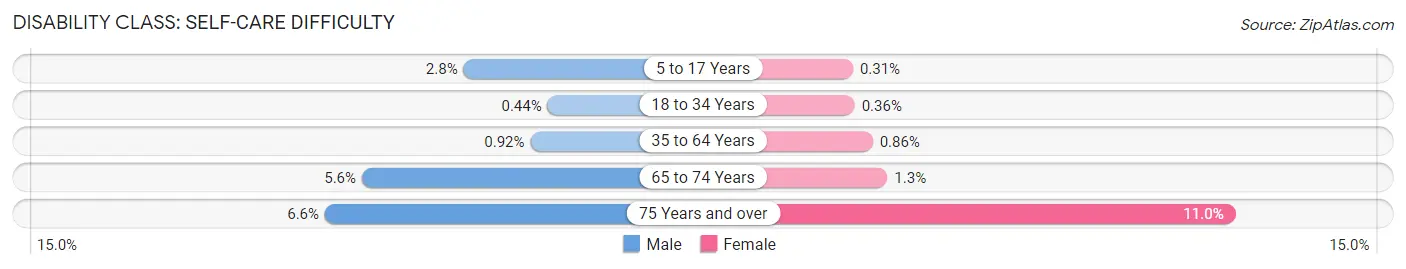
| Age Bracket | Male | Female |
| 5 to 17 Years | 150 (2.8%) | 16 (0.3%) |
| 18 to 34 Years | 59 (0.4%) | 42 (0.4%) |
| 35 to 64 Years | 101 (0.9%) | 90 (0.9%) |
| 65 to 74 Years | 151 (5.6%) | 36 (1.3%) |
| 75 Years and over | 99 (6.6%) | 248 (11.0%) |
Technology Access in Grand Forks County
Computing Device Access in Grand Forks County
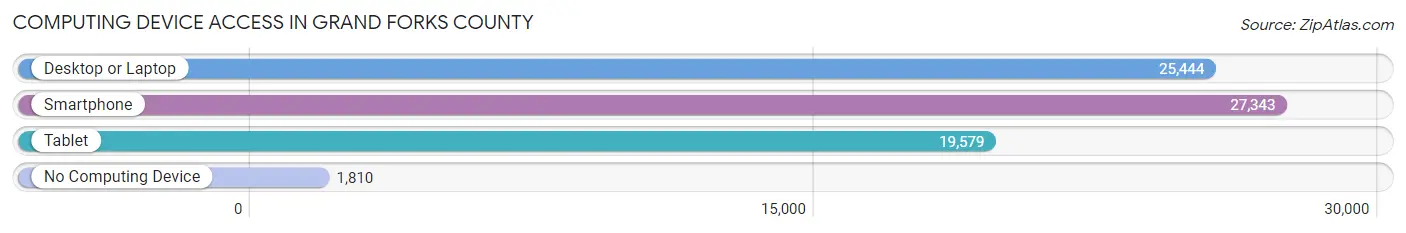
| Device Type | # Households | % Households |
| Desktop or Laptop | 25,444 | 82.8% |
| Smartphone | 27,343 | 89.0% |
| Tablet | 19,579 | 63.7% |
| No Computing Device | 1,810 | 5.9% |
| Total | 30,735 | 100.0% |
Internet Access in Grand Forks County
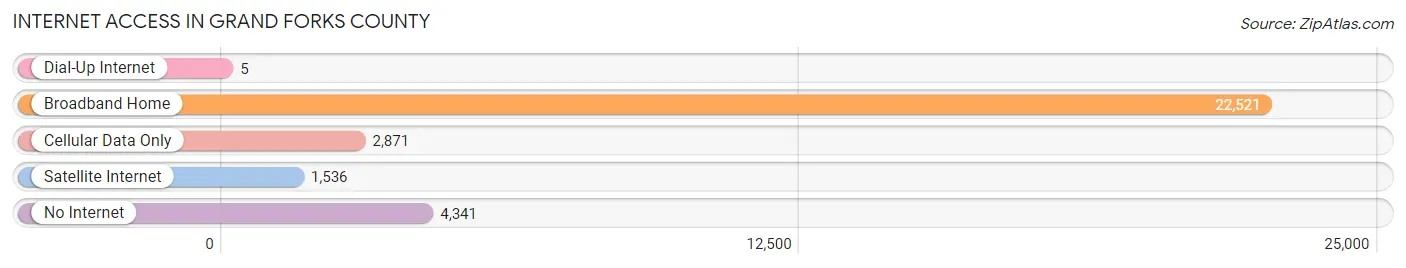
| Internet Type | # Households | % Households |
| Dial-Up Internet | 5 | 0.0% |
| Broadband Home | 22,521 | 73.3% |
| Cellular Data Only | 2,871 | 9.3% |
| Satellite Internet | 1,536 | 5.0% |
| No Internet | 4,341 | 14.1% |
| Total | 30,735 | 100.0% |
Grand Forks County Summary
Grand Forks County is located in the northeastern corner of North Dakota, and is bordered by the Red River of the North to the east, and the Canadian provinces of Manitoba and Saskatchewan to the north. The county seat is Grand Forks, and the county is part of the Grand Forks, ND-MN Metropolitan Statistical Area. As of the 2010 census, the population of Grand Forks County was 66,861.
History
Grand Forks County was established in 1873, and was named for the city of Grand Forks, which was founded in 1870. The city was named for its location at the forks of the Red River of the North and the Red Lake River. The area was originally inhabited by the Sioux and Ojibwe Native American tribes, and was part of the Dakota Territory until 1889, when North Dakota became a state.
The area was first explored by French-Canadian fur traders in the late 1700s, and the first permanent settlement was established in 1812. The area was largely agricultural, and the population grew steadily throughout the 19th century. The city of Grand Forks was incorporated in 1881, and the county was established in 1873.
Geography
Grand Forks County is located in the northeastern corner of North Dakota, and is bordered by the Red River of the North to the east, and the Canadian provinces of Manitoba and Saskatchewan to the north. The county covers an area of 1,845 square miles, and is the second largest county in the state. The terrain is mostly flat, with some rolling hills in the western part of the county. The Red River of the North forms the eastern border of the county, and the Red Lake River forms the northern border.
The county is part of the Red River Valley, which is a flat, fertile plain that is prone to flooding. The county is also home to several lakes, including Lake Agassiz, Lake Traverse, and Lake Bronson.
Economy
The economy of Grand Forks County is largely based on agriculture, manufacturing, and services. The county is home to several large agricultural operations, including sugar beet, wheat, and soybean farms. The county is also home to several large manufacturing companies, including John Deere, General Mills, and 3M.
The county is also home to several large service industries, including healthcare, education, and retail. The University of North Dakota is located in Grand Forks, and is the largest employer in the county. The county is also home to several large retail stores, including Walmart, Target, and Best Buy.
Demographics
As of the 2010 census, the population of Grand Forks County was 66,861. The population is largely white (90.2%), with small percentages of African American (2.2%), Native American (1.2%), Asian (1.1%), and Hispanic or Latino (2.3%) residents. The median household income is $50,945, and the median home value is $164,400. The county has a poverty rate of 11.2%.
Common Questions
What is the Total Population of Grand Forks County?
Total Population of Grand Forks County is 72,927.
What is the Total Male Population of Grand Forks County?
Total Male Population of Grand Forks County is 37,845.
What is the Total Female Population of Grand Forks County?
Total Female Population of Grand Forks County is 35,082.
What is the Ratio of Males per 100 Females in Grand Forks County?
There are 107.88 Males per 100 Females in Grand Forks County.
What is the Ratio of Females per 100 Males in Grand Forks County?
There are 92.70 Females per 100 Males in Grand Forks County.
What is the Median Population Age in Grand Forks County?
Median Population Age in Grand Forks County is 30.3 Years.
What is the Average Family Size in Grand Forks County
Average Family Size in Grand Forks County is 3.0 People.
What is the Average Household Size in Grand Forks County
Average Household Size in Grand Forks County is 2.2 People.
What is Per Capita Income in Grand Forks County?
Per Capita income in Grand Forks County is $37,159.
What is the Median Family Income in Grand Forks County?
Median Family Income in Grand Forks County is $94,149.
What is the Median Household income in Grand Forks County?
Median Household Income in Grand Forks County is $64,698.
What is Income or Wage Gap in Grand Forks County?
Income or Wage Gap in Grand Forks County is 28.0%.
Women in Grand Forks County earn 72.0 cents for every dollar earned by a man.
What is Family Income Deficit in Grand Forks County?
Family Income Deficit in Grand Forks County is $10,108.
Families that are below poverty line in Grand Forks County earn $10,108 less on average than the poverty threshold level.
What is Inequality or Gini Index in Grand Forks County?
Inequality or Gini Index in Grand Forks County is 0.46.
How Large is the Labor Force in Grand Forks County?
There are 42,255 People in the Labor Forcein in Grand Forks County.
What is the Percentage of People in the Labor Force in Grand Forks County?
71.3% of People are in the Labor Force in Grand Forks County.
What is the Unemployment Rate in Grand Forks County?
Unemployment Rate in Grand Forks County is 3.4%.