Dunn County, ND
Dunn County Map
Dunn County Overview
4,049
TOTAL POPULATION
2,228
MALE POPULATION
1,821
FEMALE POPULATION
122.35
MALES / 100 FEMALES
81.73
FEMALES / 100 MALES
42.7
MEDIAN AGE
3.5
AVG FAMILY SIZE
2.6
AVG HOUSEHOLD SIZE
$50,132
PER CAPITA INCOME
$124,688
AVG FAMILY INCOME
$91,758
AVG HOUSEHOLD INCOME
38.5%
WAGE / INCOME GAP [ % ]
61.5¢/ $1
WAGE / INCOME GAP [ $ ]
0.45
INEQUALITY / GINI INDEX
1,960
LABOR FORCE [ PEOPLE ]
62.0%
PERCENT IN LABOR FORCE
2.4%
UNEMPLOYMENT RATE
Dunn County Area Codes
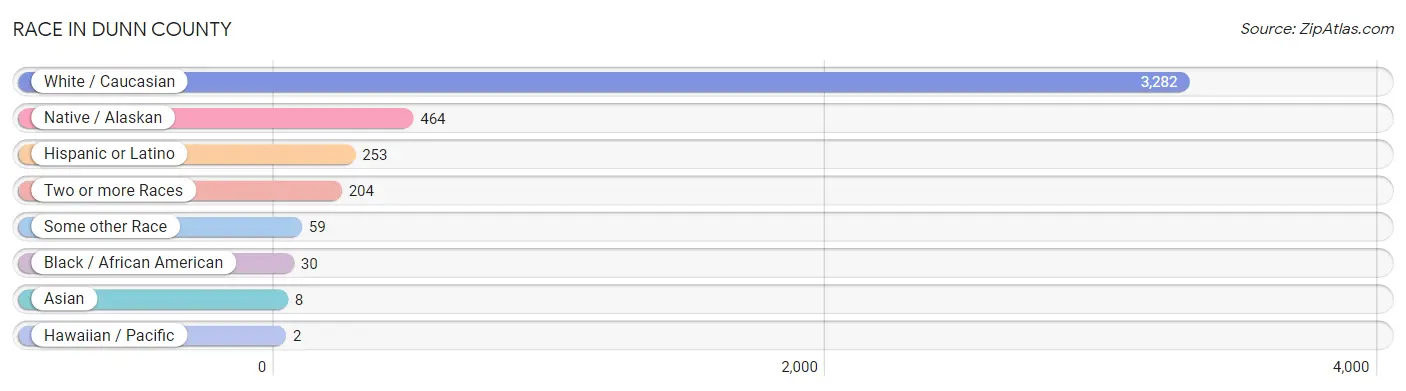
Race in Dunn County
The most populous races in Dunn County are White / Caucasian (3,282 | 81.1%), Native / Alaskan (464 | 11.5%), and Hispanic or Latino (253 | 6.2%).
| Race | # Population | % Population |
| Asian | 8 | 0.2% |
| Black / African American | 30 | 0.7% |
| Hawaiian / Pacific | 2 | 0.1% |
| Hispanic or Latino | 253 | 6.2% |
| Native / Alaskan | 464 | 11.5% |
| White / Caucasian | 3,282 | 81.1% |
| Two or more Races | 204 | 5.0% |
| Some other Race | 59 | 1.5% |
| Total | 4,049 | 100.0% |
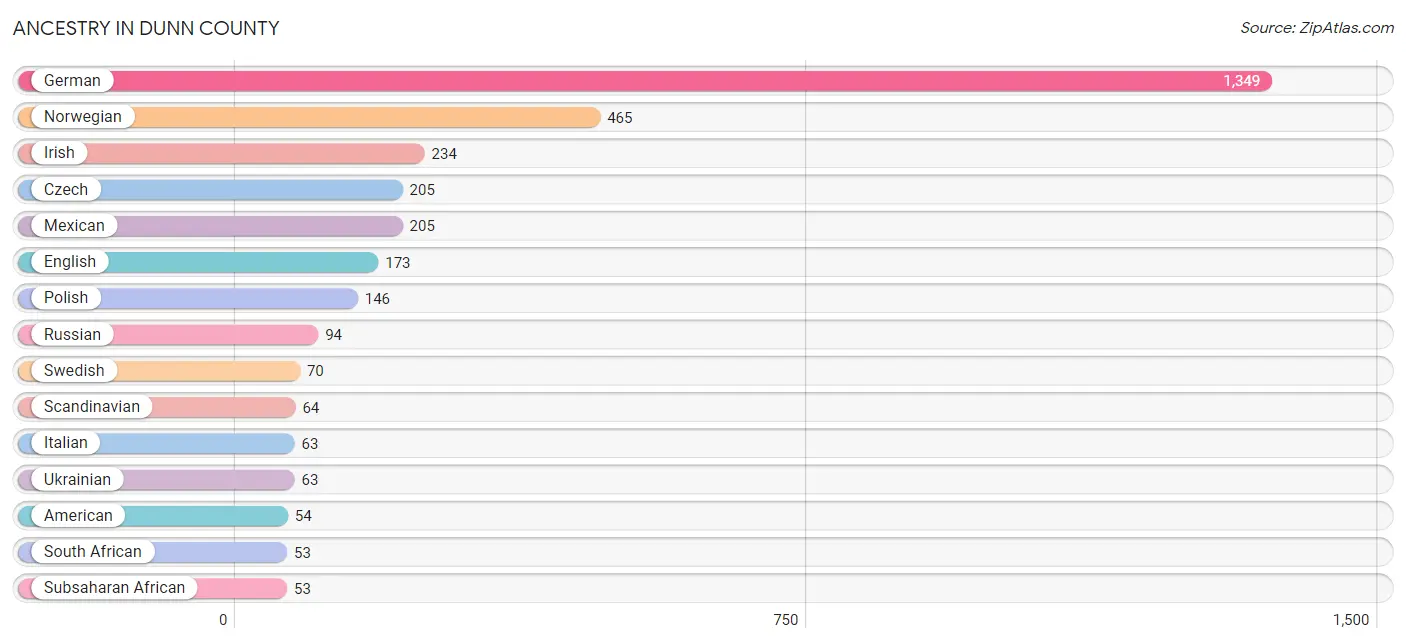
Ancestry in Dunn County
The most populous ancestries reported in Dunn County are German (1,349 | 33.3%), Norwegian (465 | 11.5%), Irish (234 | 5.8%), Czech (205 | 5.1%), and Mexican (205 | 5.1%), together accounting for 60.7% of all Dunn County residents.
| Ancestry | # Population | % Population |
| American | 54 | 1.3% |
| Austrian | 5 | 0.1% |
| Bhutanese | 5 | 0.1% |
| Brazilian | 2 | 0.1% |
| Burmese | 4 | 0.1% |
| Canadian | 18 | 0.4% |
| Chippewa | 13 | 0.3% |
| Choctaw | 3 | 0.1% |
| Creek | 4 | 0.1% |
| Crow | 12 | 0.3% |
| Cuban | 3 | 0.1% |
| Czech | 205 | 5.1% |
| Danish | 6 | 0.2% |
| Dutch | 33 | 0.8% |
| English | 173 | 4.3% |
| European | 22 | 0.5% |
| Finnish | 43 | 1.1% |
| French | 19 | 0.5% |
| French Canadian | 19 | 0.5% |
| German | 1,349 | 33.3% |
| German Russian | 7 | 0.2% |
| Hungarian | 22 | 0.5% |
| Inupiat | 9 | 0.2% |
| Irish | 234 | 5.8% |
| Italian | 63 | 1.6% |
| Jamaican | 11 | 0.3% |
| Korean | 6 | 0.2% |
| Mexican | 205 | 5.1% |
| Mexican American Indian | 25 | 0.6% |
| Native Hawaiian | 24 | 0.6% |
| Navajo | 30 | 0.7% |
| Norwegian | 465 | 11.5% |
| Paiute | 1 | 0.0% |
| Polish | 146 | 3.6% |
| Puerto Rican | 37 | 0.9% |
| Russian | 94 | 2.3% |
| Samoan | 3 | 0.1% |
| Scandinavian | 64 | 1.6% |
| Scotch-Irish | 23 | 0.6% |
| Scottish | 35 | 0.9% |
| Sioux | 31 | 0.8% |
| South African | 53 | 1.3% |
| Spaniard | 8 | 0.2% |
| Sri Lankan | 2 | 0.1% |
| Subsaharan African | 53 | 1.3% |
| Swedish | 70 | 1.7% |
| Swiss | 4 | 0.1% |
| Ukrainian | 63 | 1.6% |
| Welsh | 6 | 0.2% | View All 49 Rows |
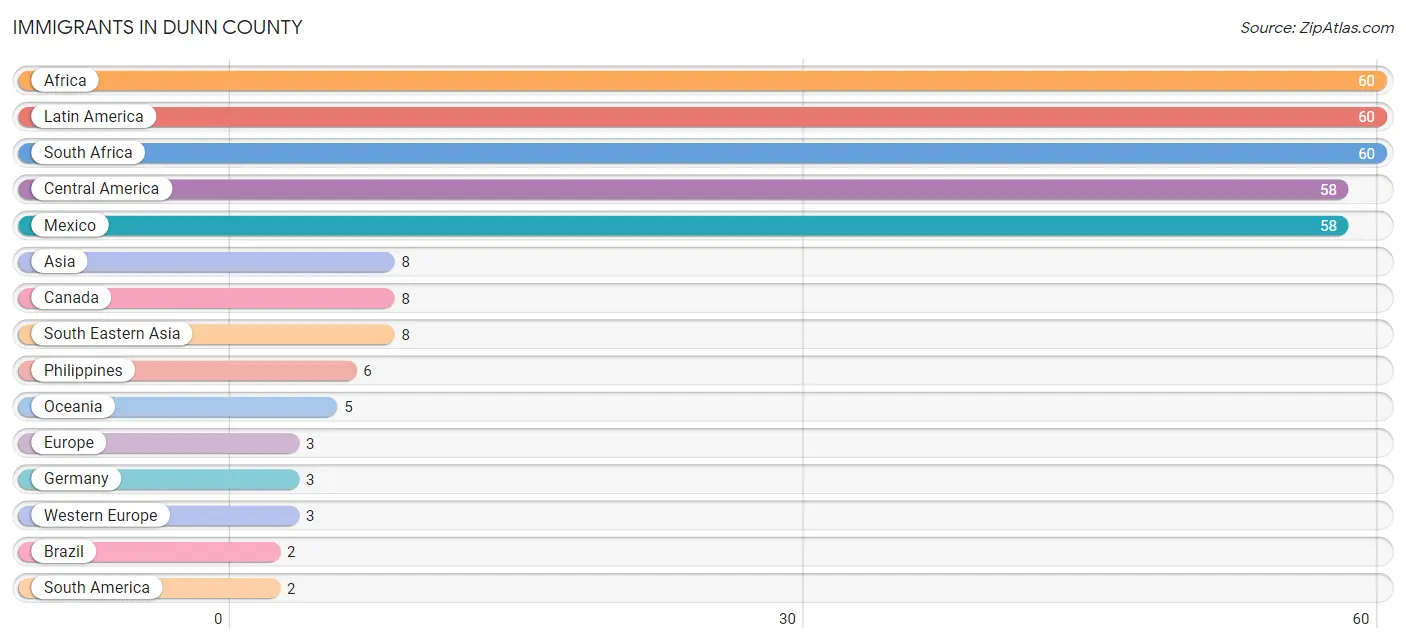
Immigrants in Dunn County
The most numerous immigrant groups reported in Dunn County came from Africa (60 | 1.5%), Latin America (60 | 1.5%), South Africa (60 | 1.5%), Central America (58 | 1.4%), and Mexico (58 | 1.4%), together accounting for 7.3% of all Dunn County residents.
| Immigration Origin | # Population | % Population |
| Africa | 60 | 1.5% |
| Asia | 8 | 0.2% |
| Brazil | 2 | 0.1% |
| Canada | 8 | 0.2% |
| Central America | 58 | 1.4% |
| Europe | 3 | 0.1% |
| Germany | 3 | 0.1% |
| Latin America | 60 | 1.5% |
| Mexico | 58 | 1.4% |
| Oceania | 5 | 0.1% |
| Philippines | 6 | 0.2% |
| South Africa | 60 | 1.5% |
| South America | 2 | 0.1% |
| South Eastern Asia | 8 | 0.2% |
| Vietnam | 2 | 0.1% |
| Western Europe | 3 | 0.1% | View All 16 Rows |
Sex and Age in Dunn County
Sex and Age in Dunn County
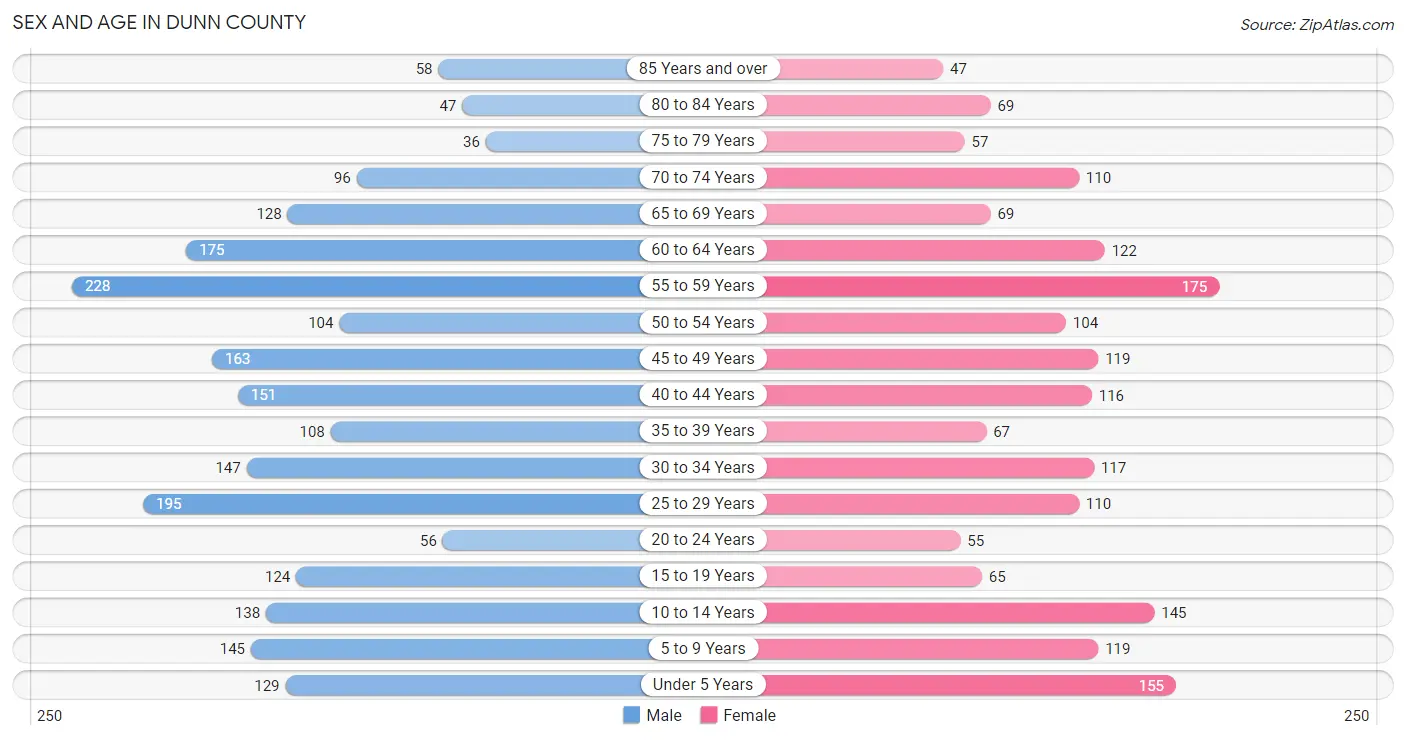
The most populous age groups in Dunn County are 55 to 59 Years (228 | 10.2%) for men and 55 to 59 Years (175 | 9.6%) for women.
| Age Bracket | Male | Female |
| Under 5 Years | 129 (5.8%) | 155 (8.5%) |
| 5 to 9 Years | 145 (6.5%) | 119 (6.5%) |
| 10 to 14 Years | 138 (6.2%) | 145 (8.0%) |
| 15 to 19 Years | 124 (5.6%) | 65 (3.6%) |
| 20 to 24 Years | 56 (2.5%) | 55 (3.0%) |
| 25 to 29 Years | 195 (8.7%) | 110 (6.0%) |
| 30 to 34 Years | 147 (6.6%) | 117 (6.4%) |
| 35 to 39 Years | 108 (4.9%) | 67 (3.7%) |
| 40 to 44 Years | 151 (6.8%) | 116 (6.4%) |
| 45 to 49 Years | 163 (7.3%) | 119 (6.5%) |
| 50 to 54 Years | 104 (4.7%) | 104 (5.7%) |
| 55 to 59 Years | 228 (10.2%) | 175 (9.6%) |
| 60 to 64 Years | 175 (7.9%) | 122 (6.7%) |
| 65 to 69 Years | 128 (5.8%) | 69 (3.8%) |
| 70 to 74 Years | 96 (4.3%) | 110 (6.0%) |
| 75 to 79 Years | 36 (1.6%) | 57 (3.1%) |
| 80 to 84 Years | 47 (2.1%) | 69 (3.8%) |
| 85 Years and over | 58 (2.6%) | 47 (2.6%) |
| Total | 2,228 (100.0%) | 1,821 (100.0%) |
Families and Households in Dunn County
Median Family Size in Dunn County
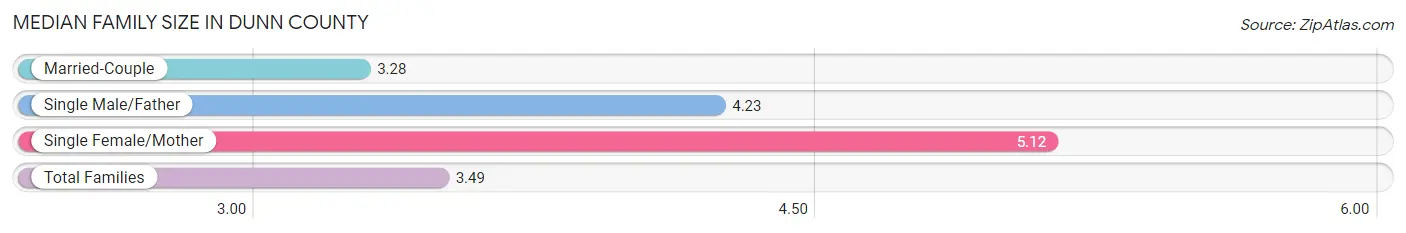
The median family size in Dunn County is 3.49 persons per family, with single female/mother families (57 | 6.3%) accounting for the largest median family size of 5.12 persons per family. On the other hand, married-couple families (752 | 83.7%) represent the smallest median family size with 3.28 persons per family.
| Family Type | # Families | Family Size |
| Married-Couple | 752 (83.7%) | 3.28 |
| Single Male/Father | 90 (10.0%) | 4.23 |
| Single Female/Mother | 57 (6.3%) | 5.12 |
| Total Families | 899 (100.0%) | 3.49 |
Median Household Size in Dunn County
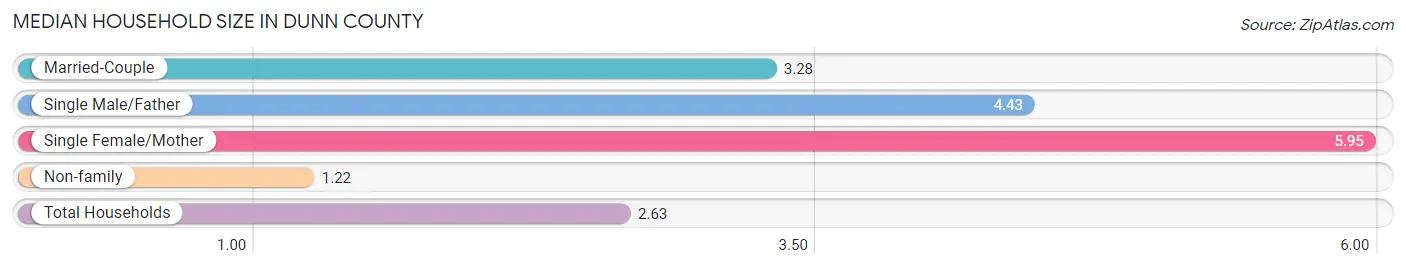
The median household size in Dunn County is 2.63 persons per household, with single female/mother households (57 | 3.8%) accounting for the largest median household size of 5.95 persons per household. non-family households (594 | 39.8%) represent the smallest median household size with 1.22 persons per household.
| Household Type | # Households | Household Size |
| Married-Couple | 752 (50.4%) | 3.28 |
| Single Male/Father | 90 (6.0%) | 4.43 |
| Single Female/Mother | 57 (3.8%) | 5.95 |
| Non-family | 594 (39.8%) | 1.22 |
| Total Households | 1,493 (100.0%) | 2.63 |
Household Size by Marriage Status in Dunn County
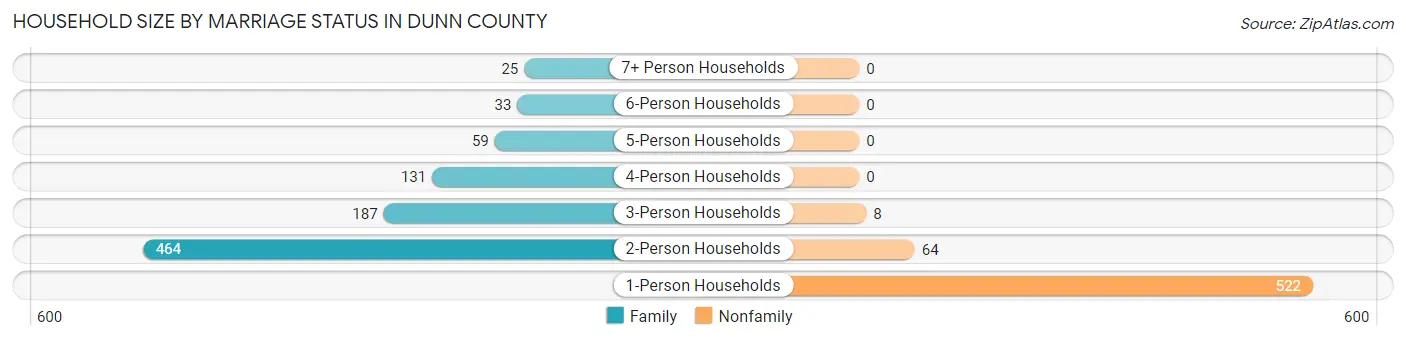
Out of a total of 1,493 households in Dunn County, 899 (60.2%) are family households, while 594 (39.8%) are nonfamily households. The most numerous type of family households are 2-person households, comprising 464, and the most common type of nonfamily households are 1-person households, comprising 522.
| Household Size | Family Households | Nonfamily Households |
| 1-Person Households | - | 522 (35.0%) |
| 2-Person Households | 464 (31.1%) | 64 (4.3%) |
| 3-Person Households | 187 (12.5%) | 8 (0.5%) |
| 4-Person Households | 131 (8.8%) | 0 (0.0%) |
| 5-Person Households | 59 (4.0%) | 0 (0.0%) |
| 6-Person Households | 33 (2.2%) | 0 (0.0%) |
| 7+ Person Households | 25 (1.7%) | 0 (0.0%) |
| Total | 899 (60.2%) | 594 (39.8%) |
Female Fertility in Dunn County
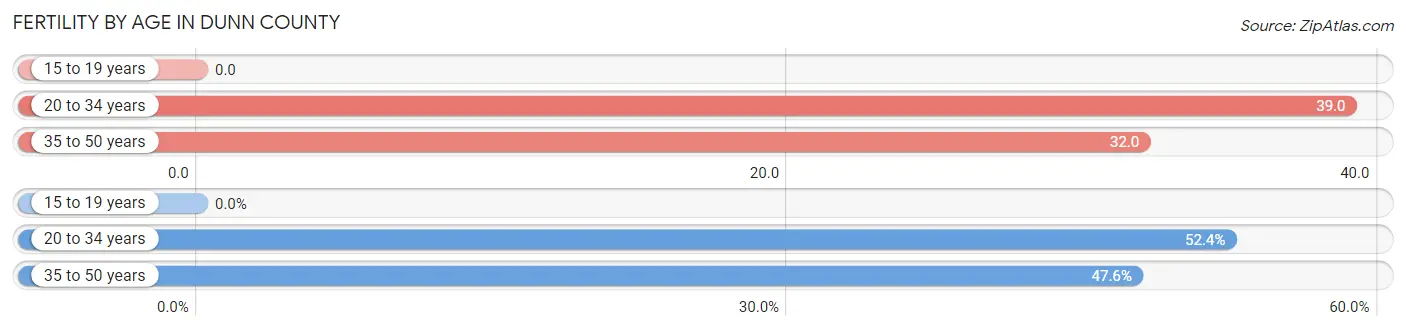
Fertility by Age in Dunn County
Average fertility rate in Dunn County is 32.0 births per 1,000 women. Women in the age bracket of 20 to 34 years have the highest fertility rate with 39.0 births per 1,000 women. Women in the age bracket of 20 to 34 years acount for 52.4% of all women with births.
| Age Bracket | Women with Births | Births / 1,000 Women |
| 15 to 19 years | 0 (0.0%) | 0.0 |
| 20 to 34 years | 11 (52.4%) | 39.0 |
| 35 to 50 years | 10 (47.6%) | 32.0 |
| Total | 21 (100.0%) | 32.0 |
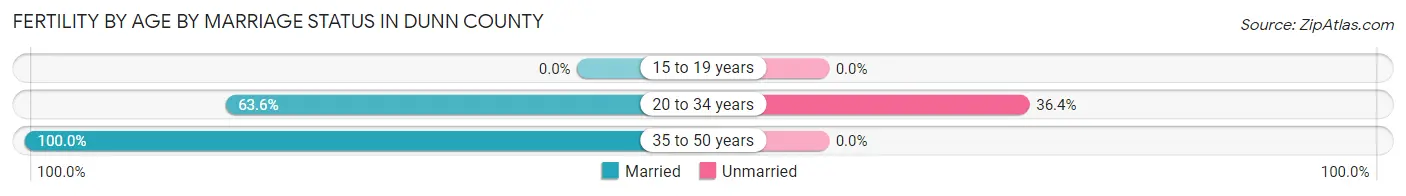
Fertility by Age by Marriage Status in Dunn County
81.0% of women with births (21) in Dunn County are married. The highest percentage of unmarried women with births falls into 20 to 34 years age bracket with 36.4% of them unmarried at the time of birth, while the lowest percentage of unmarried women with births belong to 35 to 50 years age bracket with 0.0% of them unmarried.
| Age Bracket | Married | Unmarried |
| 15 to 19 years | 0 (0.0%) | 0 (0.0%) |
| 20 to 34 years | 7 (63.6%) | 4 (36.4%) |
| 35 to 50 years | 10 (100.0%) | 0 (0.0%) |
| Total | 17 (80.9%) | 4 (19.1%) |
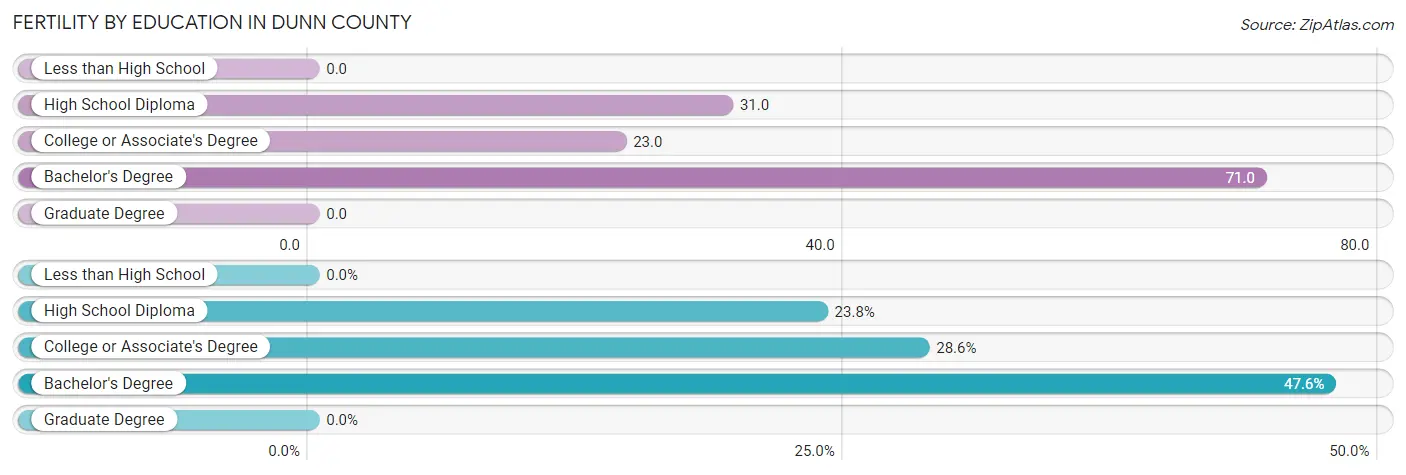
Fertility by Education in Dunn County
| Educational Attainment | Women with Births | Births / 1,000 Women |
| Less than High School | 0 (0.0%) | 0.0 |
| High School Diploma | 5 (23.8%) | 31.0 |
| College or Associate's Degree | 6 (28.6%) | 23.0 |
| Bachelor's Degree | 10 (47.6%) | 71.0 |
| Graduate Degree | 0 (0.0%) | 0.0 |
| Total | 21 (100.0%) | 32.0 |
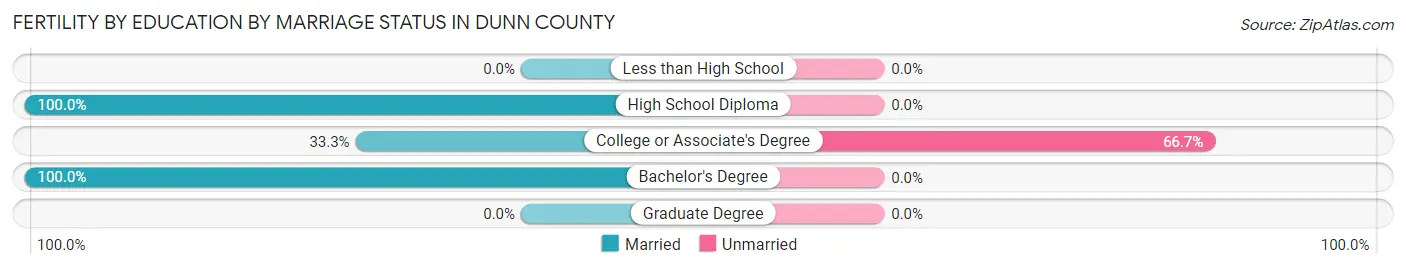
Fertility by Education by Marriage Status in Dunn County
19.1% of women with births in Dunn County are unmarried. Women with the educational attainment of high school diploma are most likely to be married with 100.0% of them married at childbirth, while women with the educational attainment of college or associate's degree are least likely to be married with 66.7% of them unmarried at childbirth.
| Educational Attainment | Married | Unmarried |
| Less than High School | 0 (0.0%) | 0 (0.0%) |
| High School Diploma | 5 (100.0%) | 0 (0.0%) |
| College or Associate's Degree | 2 (33.3%) | 4 (66.7%) |
| Bachelor's Degree | 10 (100.0%) | 0 (0.0%) |
| Graduate Degree | 0 (0.0%) | 0 (0.0%) |
| Total | 17 (80.9%) | 4 (19.1%) |
Income in Dunn County
Income Overview in Dunn County
Per Capita Income in Dunn County is $50,132, while median incomes of families and households are $124,688 and $91,758 respectively.
| Characteristic | Number | Measure |
| Per Capita Income | 4,049 | $50,132 |
| Median Family Income | 899 | $124,688 |
| Mean Family Income | 899 | $153,566 |
| Median Household Income | 1,493 | $91,758 |
| Mean Household Income | 1,493 | $123,039 |
| Income Deficit | 899 | $0 |
| Wage / Income Gap (%) | 4,049 | 38.51% |
| Wage / Income Gap ($) | 4,049 | 61.49¢ per $1 |
| Gini / Inequality Index | 4,049 | 0.45 |
Earnings by Sex in Dunn County
Average Earnings in Dunn County are $44,471, $62,596 for men and $38,488 for women, a difference of 38.5%.
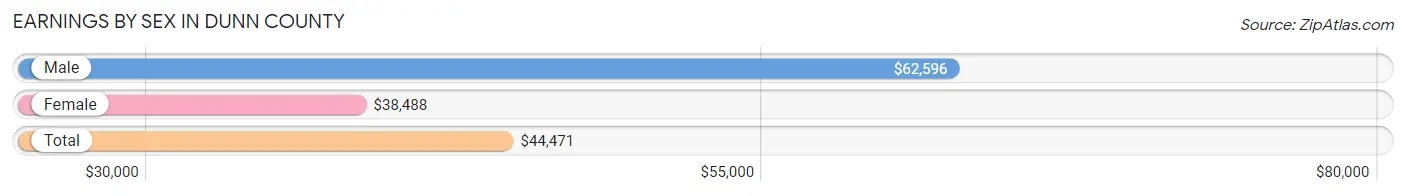
| Sex | Number | Average Earnings |
| Male | 1,303 (61.6%) | $62,596 |
| Female | 814 (38.5%) | $38,488 |
| Total | 2,117 (100.0%) | $44,471 |
Earnings by Sex by Income Bracket in Dunn County
The most common earnings brackets in Dunn County are $100,000+ for men (352 | 27.0%) and $40,000 to $44,999 for women (100 | 12.3%).
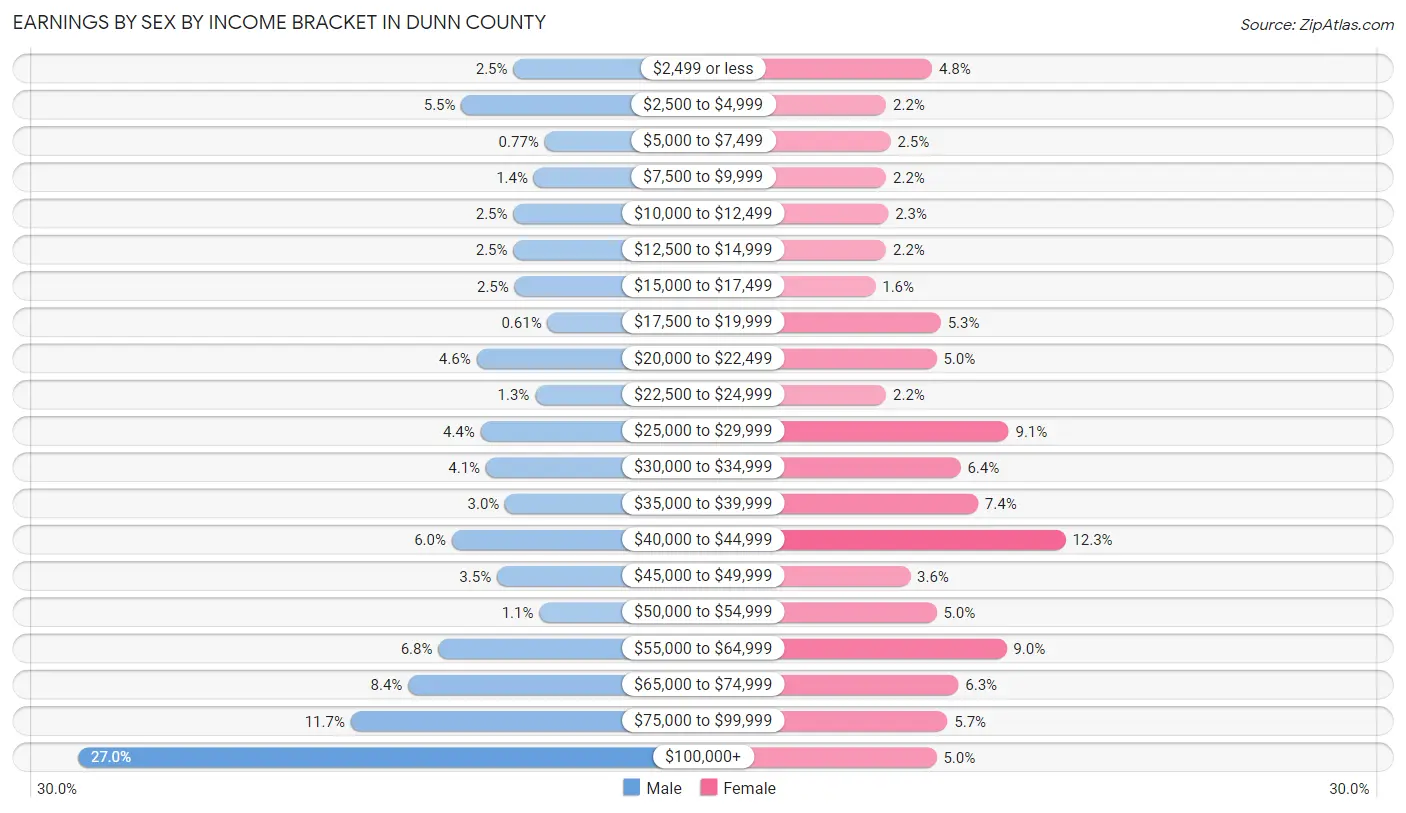
| Income | Male | Female |
| $2,499 or less | 33 (2.5%) | 39 (4.8%) |
| $2,500 to $4,999 | 71 (5.4%) | 18 (2.2%) |
| $5,000 to $7,499 | 10 (0.8%) | 20 (2.5%) |
| $7,500 to $9,999 | 18 (1.4%) | 18 (2.2%) |
| $10,000 to $12,499 | 33 (2.5%) | 19 (2.3%) |
| $12,500 to $14,999 | 33 (2.5%) | 18 (2.2%) |
| $15,000 to $17,499 | 32 (2.5%) | 13 (1.6%) |
| $17,500 to $19,999 | 8 (0.6%) | 43 (5.3%) |
| $20,000 to $22,499 | 60 (4.6%) | 41 (5.0%) |
| $22,500 to $24,999 | 17 (1.3%) | 18 (2.2%) |
| $25,000 to $29,999 | 57 (4.4%) | 74 (9.1%) |
| $30,000 to $34,999 | 53 (4.1%) | 52 (6.4%) |
| $35,000 to $39,999 | 39 (3.0%) | 60 (7.4%) |
| $40,000 to $44,999 | 78 (6.0%) | 100 (12.3%) |
| $45,000 to $49,999 | 45 (3.5%) | 29 (3.6%) |
| $50,000 to $54,999 | 14 (1.1%) | 41 (5.0%) |
| $55,000 to $64,999 | 88 (6.8%) | 73 (9.0%) |
| $65,000 to $74,999 | 110 (8.4%) | 51 (6.3%) |
| $75,000 to $99,999 | 152 (11.7%) | 46 (5.7%) |
| $100,000+ | 352 (27.0%) | 41 (5.0%) |
| Total | 1,303 (100.0%) | 814 (100.0%) |
Earnings by Sex by Educational Attainment in Dunn County
Average earnings in Dunn County are $67,850 for men and $39,099 for women, a difference of 42.4%. Men with an educational attainment of college or associate's degree enjoy the highest average annual earnings of $77,188, while those with high school diploma education earn the least with $53,750. Women with an educational attainment of graduate degree earn the most with the average annual earnings of $102,644, while those with less than high school education have the smallest earnings of $18,558.
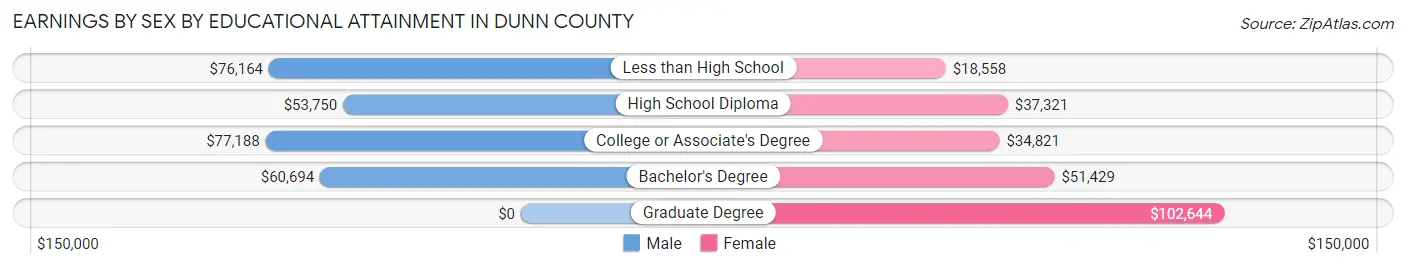
| Educational Attainment | Male Income | Female Income |
| Less than High School | $76,164 | $18,558 |
| High School Diploma | $53,750 | $37,321 |
| College or Associate's Degree | $77,188 | $34,821 |
| Bachelor's Degree | $60,694 | $51,429 |
| Graduate Degree | - | - |
| Total | $67,850 | $39,099 |
Family Income in Dunn County
Family Income Brackets in Dunn County
According to the Dunn County family income data, there are 217 families falling into the $100,000 to $149,999 income range, which is the most common income bracket and makes up 24.1% of all families. Conversely, the $10,000 to $14,999 income bracket is the least frequent group with only 1 families (0.1%) belonging to this category.
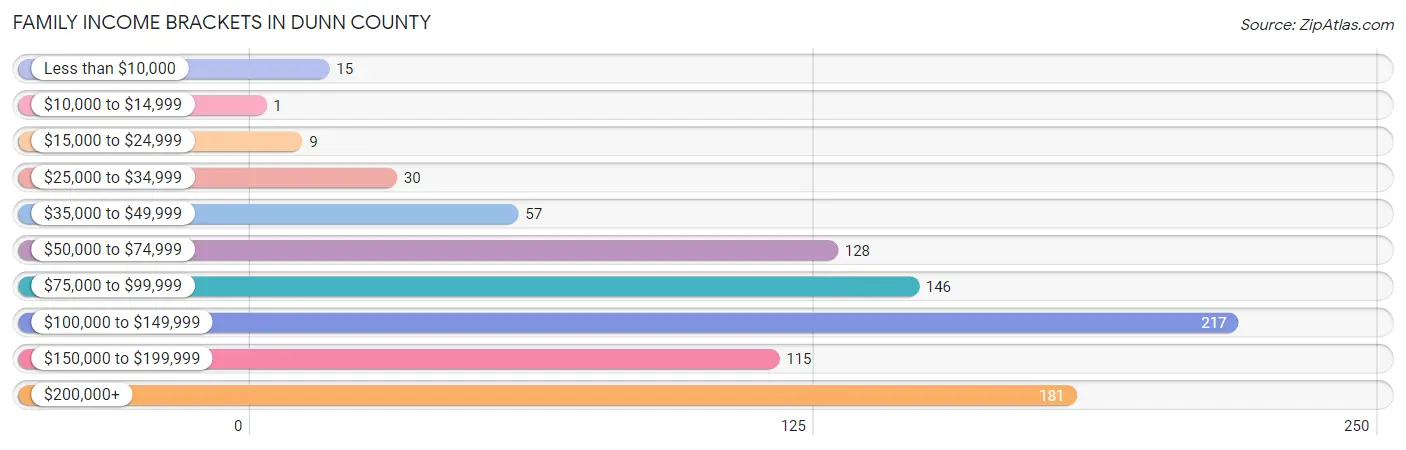
| Income Bracket | # Families | % Families |
| Less than $10,000 | 15 | 1.7% |
| $10,000 to $14,999 | 1 | 0.1% |
| $15,000 to $24,999 | 9 | 1.0% |
| $25,000 to $34,999 | 30 | 3.3% |
| $35,000 to $49,999 | 57 | 6.3% |
| $50,000 to $74,999 | 128 | 14.2% |
| $75,000 to $99,999 | 146 | 16.2% |
| $100,000 to $149,999 | 217 | 24.1% |
| $150,000 to $199,999 | 115 | 12.8% |
| $200,000+ | 181 | 20.1% |
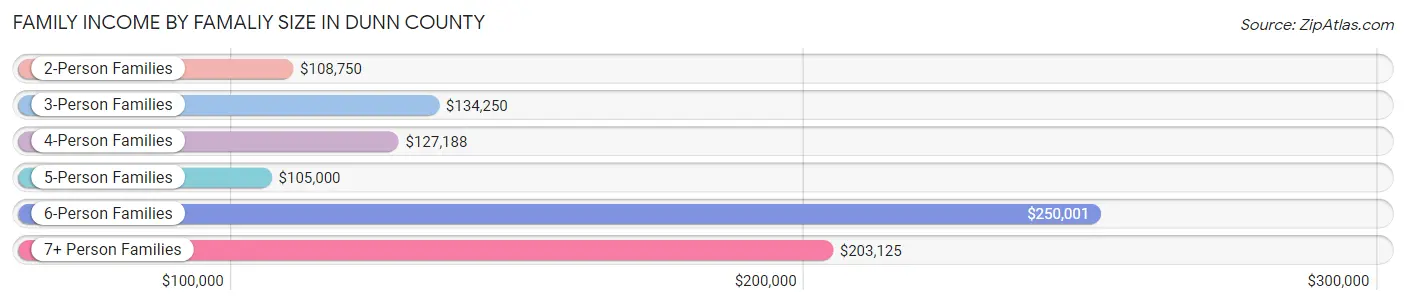
Family Income by Famaliy Size in Dunn County
6-person families (28 | 3.1%) account for the highest median family income in Dunn County with $250,001 per family, while 2-person families (469 | 52.2%) have the highest median income of $54,375 per family member.
| Income Bracket | # Families | Median Income |
| 2-Person Families | 469 (52.2%) | $108,750 |
| 3-Person Families | 193 (21.5%) | $134,250 |
| 4-Person Families | 130 (14.5%) | $127,188 |
| 5-Person Families | 54 (6.0%) | $105,000 |
| 6-Person Families | 28 (3.1%) | $250,001 |
| 7+ Person Families | 25 (2.8%) | $203,125 |
| Total | 899 (100.0%) | $124,688 |
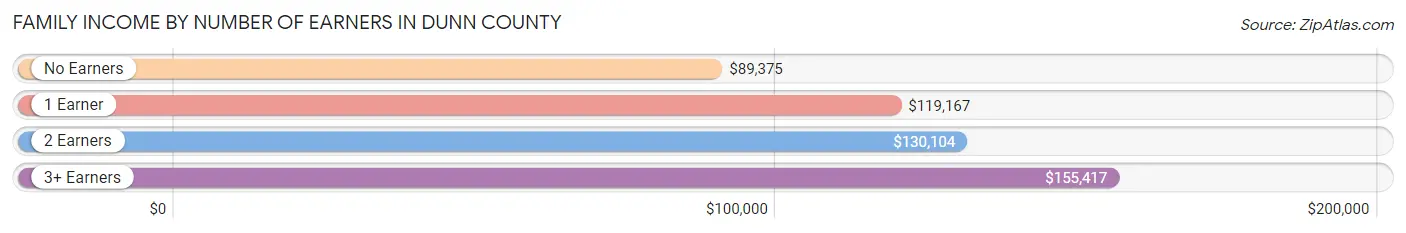
Family Income by Number of Earners in Dunn County
The median family income in Dunn County is $124,688, with families comprising 3+ earners (55) having the highest median family income of $155,417, while families with no earners (129) have the lowest median family income of $89,375, accounting for 6.1% and 14.3% of families, respectively.
| Number of Earners | # Families | Median Income |
| No Earners | 129 (14.3%) | $89,375 |
| 1 Earner | 254 (28.2%) | $119,167 |
| 2 Earners | 461 (51.3%) | $130,104 |
| 3+ Earners | 55 (6.1%) | $155,417 |
| Total | 899 (100.0%) | $124,688 |
Household Income in Dunn County
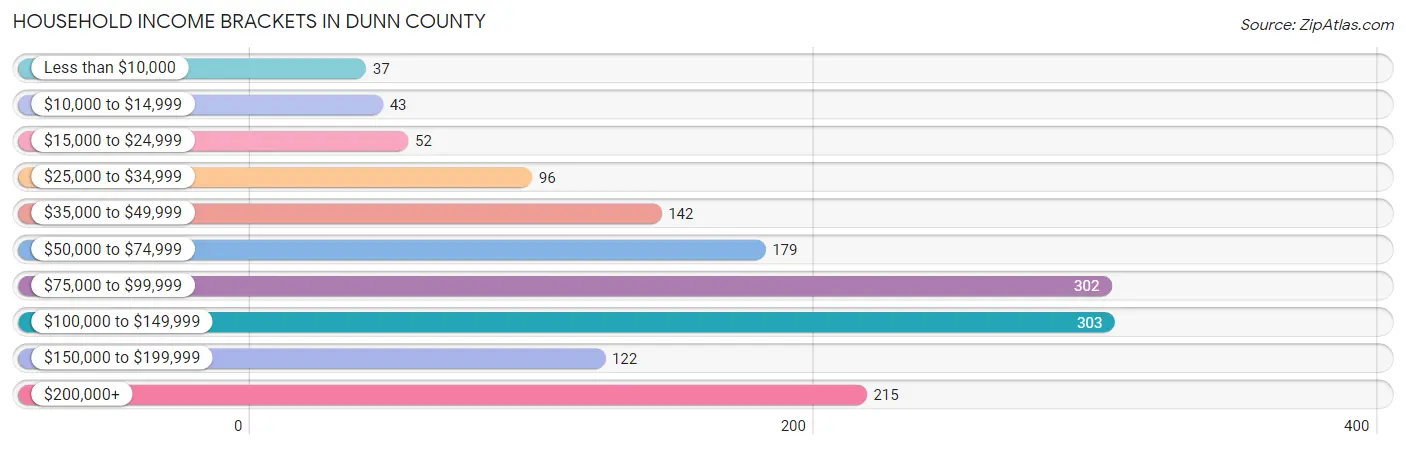
Household Income Brackets in Dunn County
With 303 households falling in the category, the $100,000 to $149,999 income range is the most frequent in Dunn County, accounting for 20.3% of all households. In contrast, only 37 households (2.5%) fall into the less than $10,000 income bracket, making it the least populous group.
| Income Bracket | # Households | % Households |
| Less than $10,000 | 37 | 2.5% |
| $10,000 to $14,999 | 43 | 2.9% |
| $15,000 to $24,999 | 52 | 3.5% |
| $25,000 to $34,999 | 96 | 6.4% |
| $35,000 to $49,999 | 142 | 9.5% |
| $50,000 to $74,999 | 179 | 12.0% |
| $75,000 to $99,999 | 302 | 20.2% |
| $100,000 to $149,999 | 303 | 20.3% |
| $150,000 to $199,999 | 122 | 8.2% |
| $200,000+ | 215 | 14.4% |
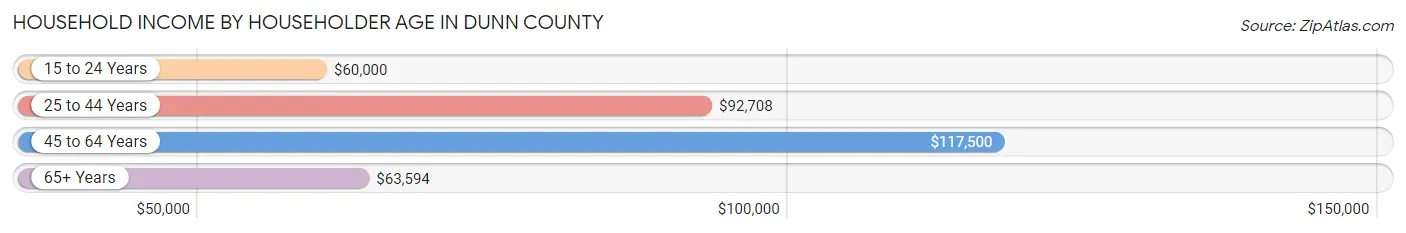
Household Income by Householder Age in Dunn County
The median household income in Dunn County is $91,758, with the highest median household income of $117,500 found in the 45 to 64 years age bracket for the primary householder. A total of 584 households (39.1%) fall into this category. Meanwhile, the 15 to 24 years age bracket for the primary householder has the lowest median household income of $60,000, with 16 households (1.1%) in this group.
| Income Bracket | # Households | Median Income |
| 15 to 24 Years | 16 (1.1%) | $60,000 |
| 25 to 44 Years | 451 (30.2%) | $92,708 |
| 45 to 64 Years | 584 (39.1%) | $117,500 |
| 65+ Years | 442 (29.6%) | $63,594 |
| Total | 1,493 (100.0%) | $91,758 |
Poverty in Dunn County
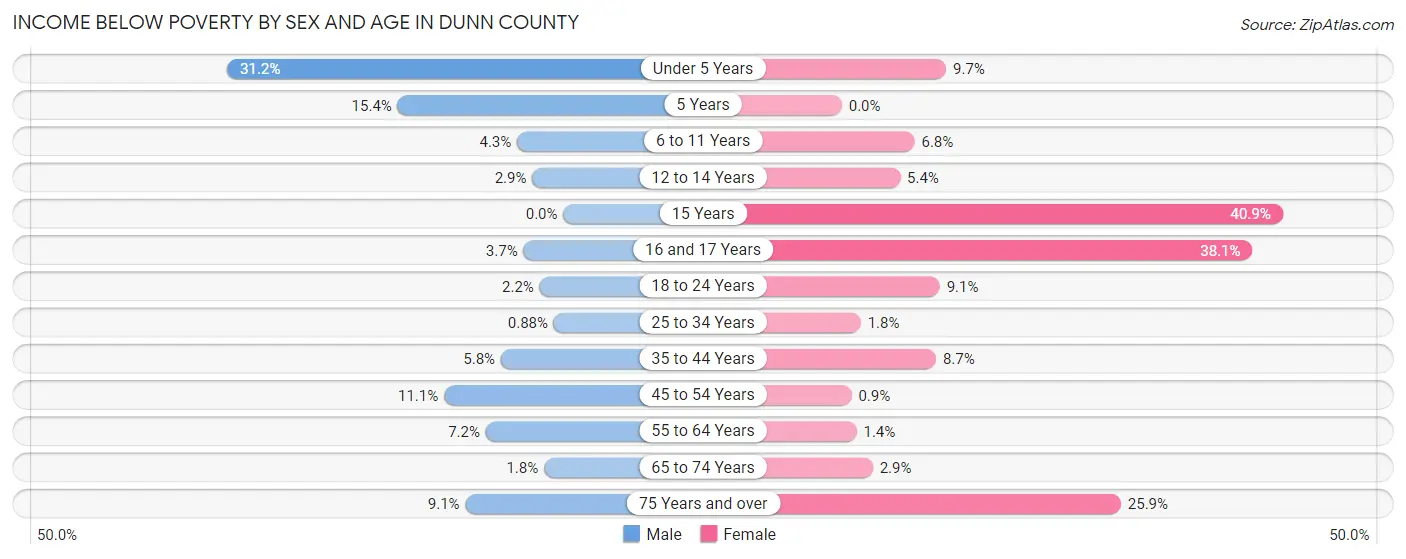
Income Below Poverty by Sex and Age in Dunn County
With 6.8% poverty level for males and 6.8% for females among the residents of Dunn County, under 5 year old males and 15 year old females are the most vulnerable to poverty, with 39 males (31.2%) and 9 females (40.9%) in their respective age groups living below the poverty level.
| Age Bracket | Male | Female |
| Under 5 Years | 39 (31.2%) | 15 (9.7%) |
| 5 Years | 6 (15.4%) | 0 (0.0%) |
| 6 to 11 Years | 6 (4.3%) | 11 (6.8%) |
| 12 to 14 Years | 3 (2.9%) | 4 (5.4%) |
| 15 Years | 0 (0.0%) | 9 (40.9%) |
| 16 and 17 Years | 2 (3.7%) | 8 (38.1%) |
| 18 to 24 Years | 2 (2.2%) | 7 (9.1%) |
| 25 to 34 Years | 3 (0.9%) | 4 (1.8%) |
| 35 to 44 Years | 15 (5.8%) | 16 (8.7%) |
| 45 to 54 Years | 29 (11.1%) | 2 (0.9%) |
| 55 to 64 Years | 29 (7.2%) | 4 (1.4%) |
| 65 to 74 Years | 4 (1.8%) | 5 (2.9%) |
| 75 Years and over | 11 (9.1%) | 36 (25.9%) |
| Total | 149 (6.8%) | 121 (6.8%) |
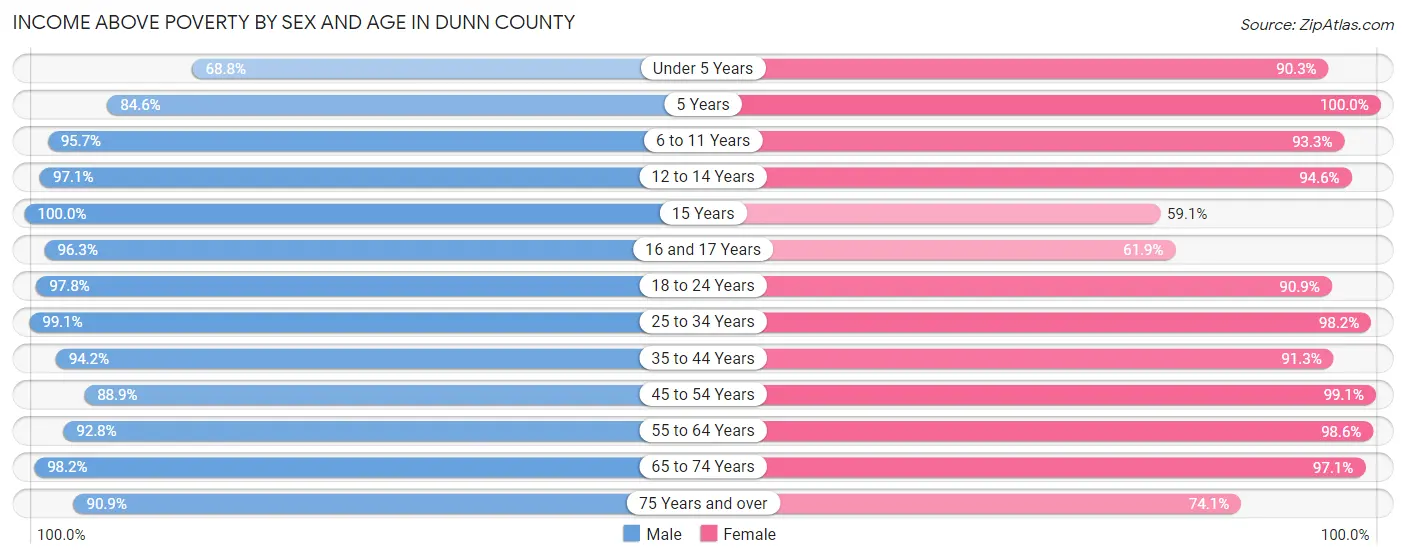
Income Above Poverty by Sex and Age in Dunn County
According to the poverty statistics in Dunn County, males aged 15 years and females aged 5 years are the age groups that are most secure financially, with 100.0% of males and 100.0% of females in these age groups living above the poverty line.
| Age Bracket | Male | Female |
| Under 5 Years | 86 (68.8%) | 140 (90.3%) |
| 5 Years | 33 (84.6%) | 27 (100.0%) |
| 6 to 11 Years | 134 (95.7%) | 152 (93.2%) |
| 12 to 14 Years | 101 (97.1%) | 70 (94.6%) |
| 15 Years | 35 (100.0%) | 13 (59.1%) |
| 16 and 17 Years | 52 (96.3%) | 13 (61.9%) |
| 18 to 24 Years | 89 (97.8%) | 70 (90.9%) |
| 25 to 34 Years | 339 (99.1%) | 223 (98.2%) |
| 35 to 44 Years | 244 (94.2%) | 167 (91.3%) |
| 45 to 54 Years | 233 (88.9%) | 221 (99.1%) |
| 55 to 64 Years | 374 (92.8%) | 289 (98.6%) |
| 65 to 74 Years | 220 (98.2%) | 169 (97.1%) |
| 75 Years and over | 110 (90.9%) | 103 (74.1%) |
| Total | 2,050 (93.2%) | 1,657 (93.2%) |
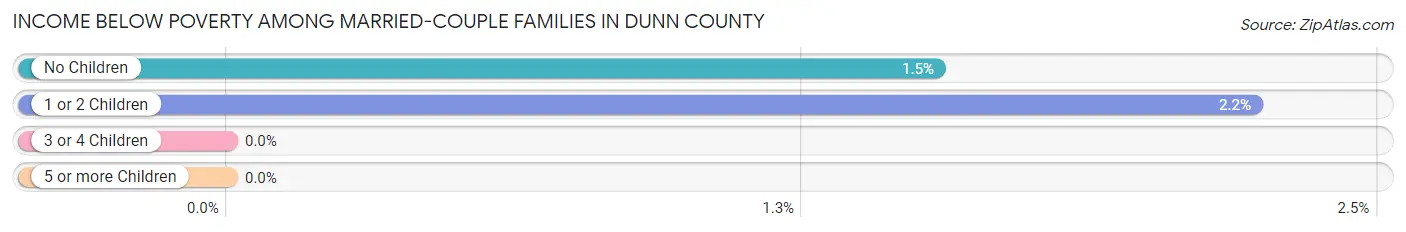
Income Below Poverty Among Married-Couple Families in Dunn County
The poverty statistics for married-couple families in Dunn County show that 1.6% or 12 of the total 752 families live below the poverty line. Families with 1 or 2 children have the highest poverty rate of 2.2%, comprising of 5 families. On the other hand, families with 3 or 4 children have the lowest poverty rate of 0.0%, which includes 0 families.
| Children | Above Poverty | Below Poverty |
| No Children | 449 (98.5%) | 7 (1.5%) |
| 1 or 2 Children | 219 (97.8%) | 5 (2.2%) |
| 3 or 4 Children | 62 (100.0%) | 0 (0.0%) |
| 5 or more Children | 10 (100.0%) | 0 (0.0%) |
| Total | 740 (98.4%) | 12 (1.6%) |
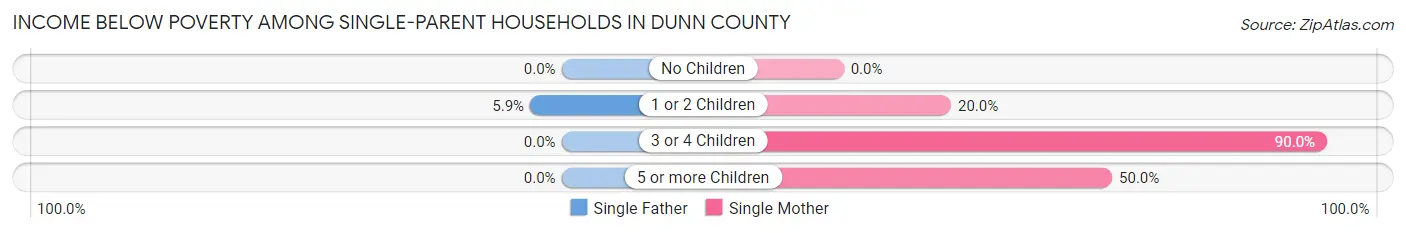
Income Below Poverty Among Single-Parent Households in Dunn County
According to the poverty data in Dunn County, 1.1% or 1 single-father households and 29.8% or 17 single-mother households are living below the poverty line. Among single-father households, those with 1 or 2 children have the highest poverty rate, with 1 households (5.9%) experiencing poverty. Likewise, among single-mother households, those with 3 or 4 children have the highest poverty rate, with 9 households (90.0%) falling below the poverty line.
| Children | Single Father | Single Mother |
| No Children | 0 (0.0%) | 0 (0.0%) |
| 1 or 2 Children | 1 (5.9%) | 7 (20.0%) |
| 3 or 4 Children | 0 (0.0%) | 9 (90.0%) |
| 5 or more Children | 0 (0.0%) | 1 (50.0%) |
| Total | 1 (1.1%) | 17 (29.8%) |
Income Below Poverty Among Married-Couple vs Single-Parent Households in Dunn County
The poverty data for Dunn County shows that 12 of the married-couple family households (1.6%) and 18 of the single-parent households (12.2%) are living below the poverty level. Within the married-couple family households, those with 1 or 2 children have the highest poverty rate, with 5 households (2.2%) falling below the poverty line. Among the single-parent households, those with 5 or more children have the highest poverty rate, with 1 household (50.0%) living below poverty.
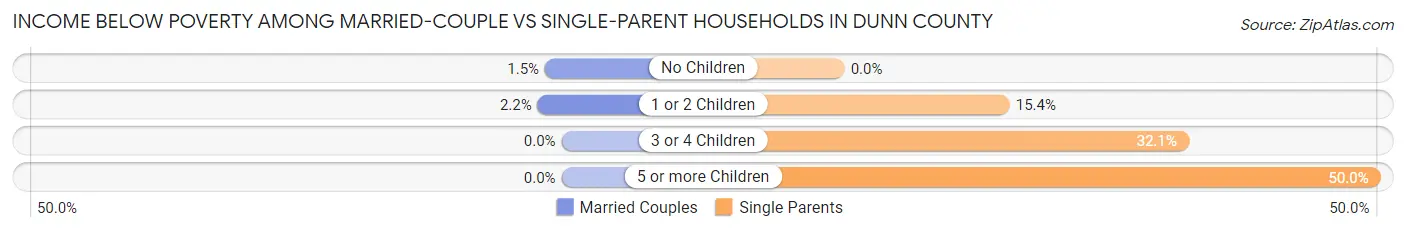
| Children | Married-Couple Families | Single-Parent Households |
| No Children | 7 (1.5%) | 0 (0.0%) |
| 1 or 2 Children | 5 (2.2%) | 8 (15.4%) |
| 3 or 4 Children | 0 (0.0%) | 9 (32.1%) |
| 5 or more Children | 0 (0.0%) | 1 (50.0%) |
| Total | 12 (1.6%) | 18 (12.2%) |
Employment Characteristics in Dunn County
Employment by Class of Employer in Dunn County
Among the 1,881 employed individuals in Dunn County, private company employees (1,198 | 63.7%), local government employees (232 | 12.3%), and self-employed (not incorporated) (198 | 10.5%) make up the most common classes of employment.
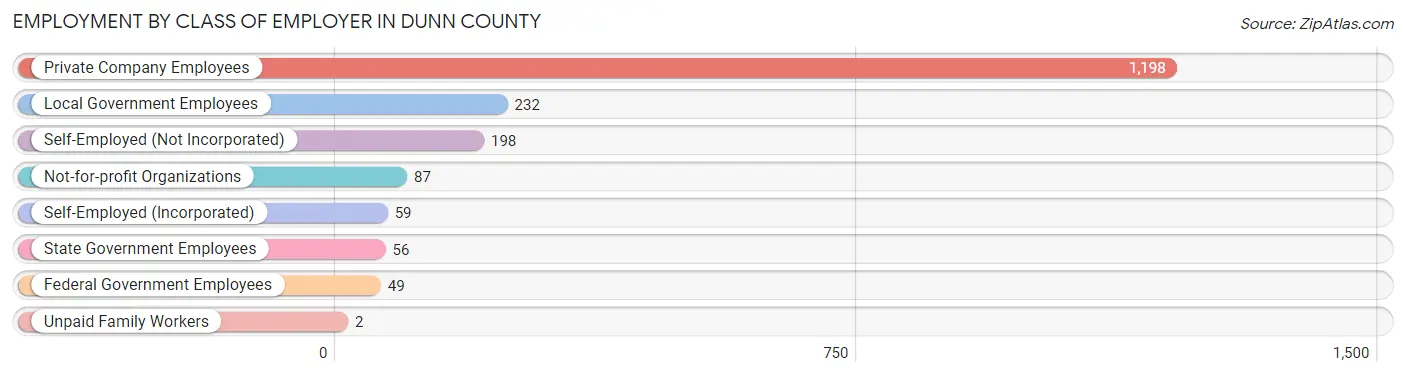
| Employer Class | # Employees | % Employees |
| Private Company Employees | 1,198 | 63.7% |
| Self-Employed (Incorporated) | 59 | 3.1% |
| Self-Employed (Not Incorporated) | 198 | 10.5% |
| Not-for-profit Organizations | 87 | 4.6% |
| Local Government Employees | 232 | 12.3% |
| State Government Employees | 56 | 3.0% |
| Federal Government Employees | 49 | 2.6% |
| Unpaid Family Workers | 2 | 0.1% |
| Total | 1,881 | 100.0% |
Employment Status by Age in Dunn County
According to the labor force statistics for Dunn County, out of the total population over 16 years of age (3,161), 62.0% or 1,960 individuals are in the labor force, with 2.4% or 47 of them unemployed. The age group with the highest labor force participation rate is 30 to 34 years, with 90.5% or 239 individuals in the labor force. Within the labor force, the 20 to 24 years age range has the highest percentage of unemployed individuals, with 6.2% or 6 of them being unemployed.
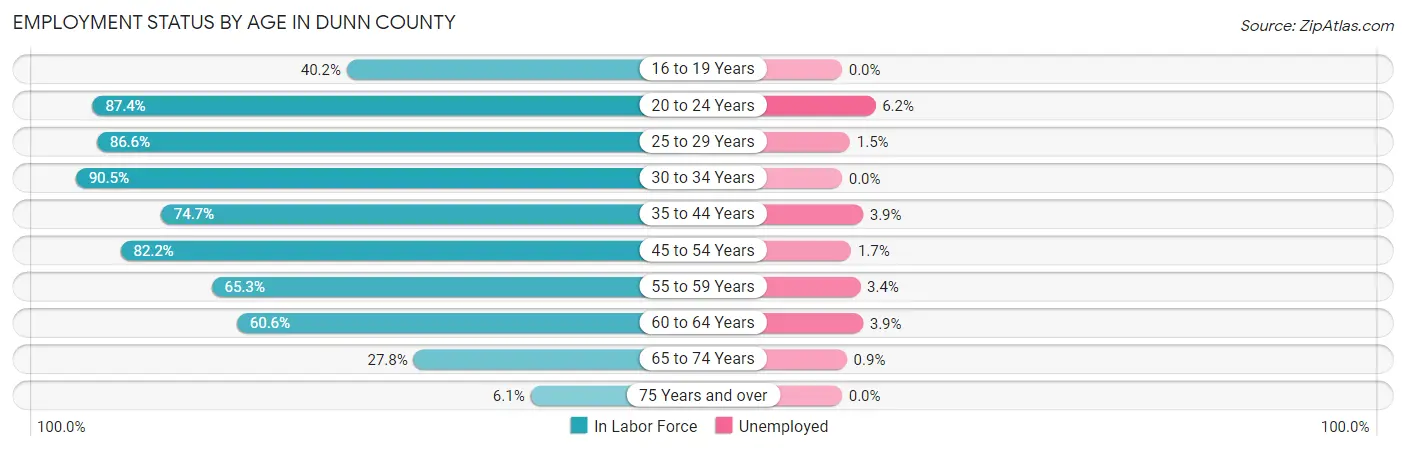
| Age Bracket | In Labor Force | Unemployed |
| 16 to 19 Years | 53 (40.2%) | 0 (0.0%) |
| 20 to 24 Years | 97 (87.4%) | 6 (6.2%) |
| 25 to 29 Years | 264 (86.6%) | 4 (1.5%) |
| 30 to 34 Years | 239 (90.5%) | 0 (0.0%) |
| 35 to 44 Years | 330 (74.7%) | 13 (3.9%) |
| 45 to 54 Years | 403 (82.2%) | 7 (1.7%) |
| 55 to 59 Years | 263 (65.3%) | 9 (3.4%) |
| 60 to 64 Years | 180 (60.6%) | 7 (3.9%) |
| 65 to 74 Years | 112 (27.8%) | 1 (0.9%) |
| 75 Years and over | 19 (6.1%) | 0 (0.0%) |
| Total | 1,960 (62.0%) | 47 (2.4%) |
Employment Status by Educational Attainment in Dunn County
According to labor force statistics for Dunn County, 76.3% of individuals (1,679) out of the total population between 25 and 64 years of age (2,201) are in the labor force, with 2.4% or 40 of them being unemployed. The group with the highest labor force participation rate are those with the educational attainment of less than high school, with 89.6% or 172 individuals in the labor force. Within the labor force, individuals with less than high school education have the highest percentage of unemployment, with 4.7% or 8 of them being unemployed.
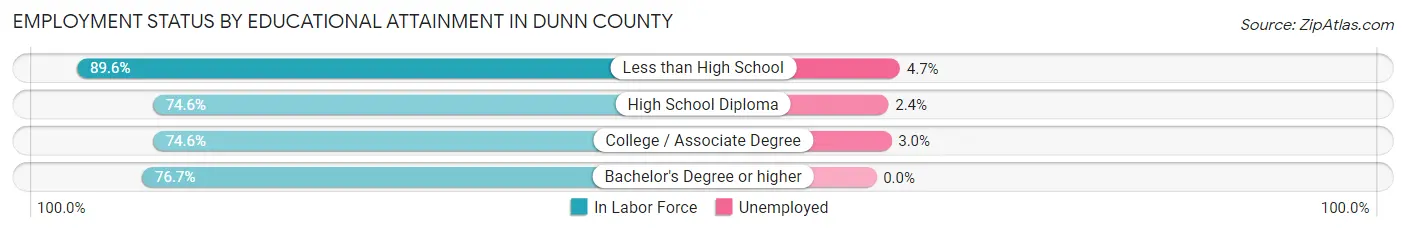
| Educational Attainment | In Labor Force | Unemployed |
| Less than High School | 172 (89.6%) | 9 (4.7%) |
| High School Diploma | 586 (74.6%) | 19 (2.4%) |
| College / Associate Degree | 601 (74.6%) | 24 (3.0%) |
| Bachelor's Degree or higher | 320 (76.7%) | 0 (0.0%) |
| Total | 1,679 (76.3%) | 53 (2.4%) |
Employment Occupations by Sex in Dunn County
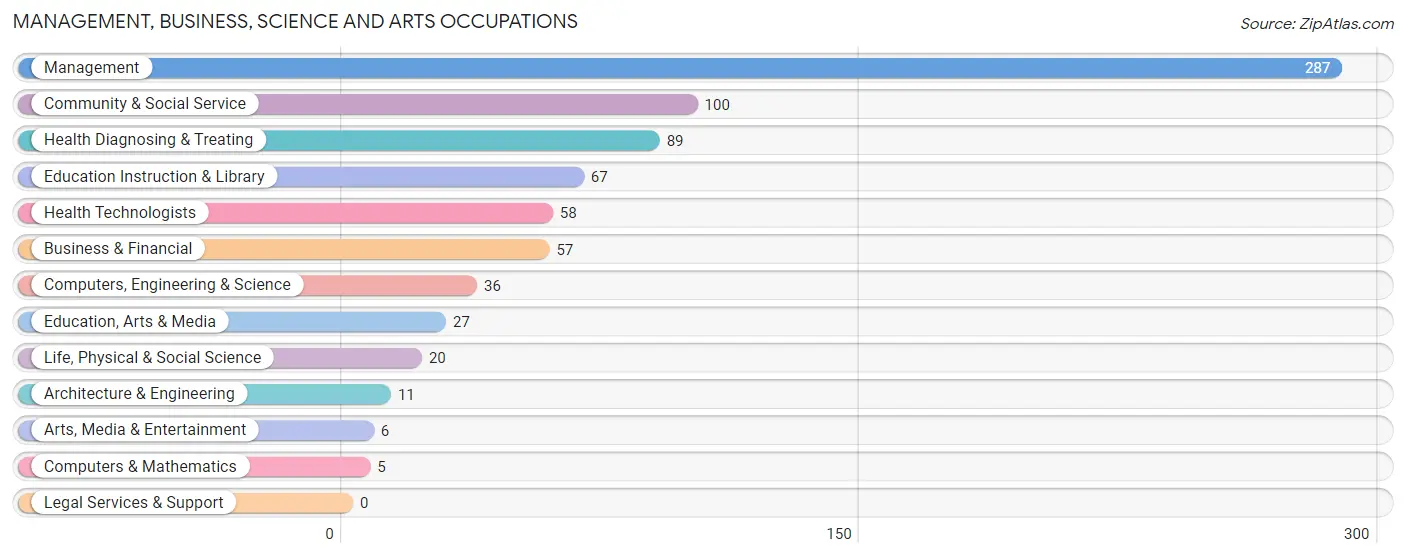
Management, Business, Science and Arts Occupations
The most common Management, Business, Science and Arts occupations in Dunn County are Management (287 | 15.0%), Community & Social Service (100 | 5.2%), Health Diagnosing & Treating (89 | 4.6%), Education Instruction & Library (67 | 3.5%), and Health Technologists (58 | 3.0%).
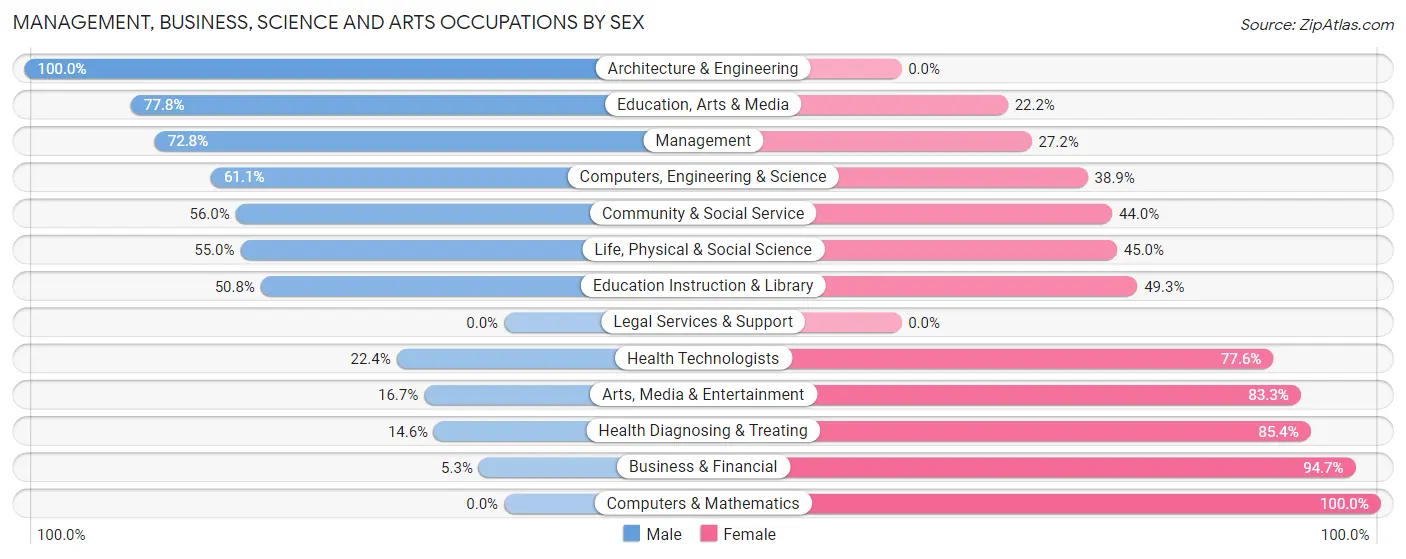
Management, Business, Science and Arts Occupations by Sex
Within the Management, Business, Science and Arts occupations in Dunn County, the most male-oriented occupations are Architecture & Engineering (100.0%), Education, Arts & Media (77.8%), and Management (72.8%), while the most female-oriented occupations are Computers & Mathematics (100.0%), Business & Financial (94.7%), and Health Diagnosing & Treating (85.4%).
| Occupation | Male | Female |
| Management | 209 (72.8%) | 78 (27.2%) |
| Business & Financial | 3 (5.3%) | 54 (94.7%) |
| Computers, Engineering & Science | 22 (61.1%) | 14 (38.9%) |
| Computers & Mathematics | 0 (0.0%) | 5 (100.0%) |
| Architecture & Engineering | 11 (100.0%) | 0 (0.0%) |
| Life, Physical & Social Science | 11 (55.0%) | 9 (45.0%) |
| Community & Social Service | 56 (56.0%) | 44 (44.0%) |
| Education, Arts & Media | 21 (77.8%) | 6 (22.2%) |
| Legal Services & Support | 0 (0.0%) | 0 (0.0%) |
| Education Instruction & Library | 34 (50.7%) | 33 (49.2%) |
| Arts, Media & Entertainment | 1 (16.7%) | 5 (83.3%) |
| Health Diagnosing & Treating | 13 (14.6%) | 76 (85.4%) |
| Health Technologists | 13 (22.4%) | 45 (77.6%) |
| Total (Category) | 303 (53.2%) | 266 (46.8%) |
| Total (Overall) | 1,171 (61.2%) | 742 (38.8%) |
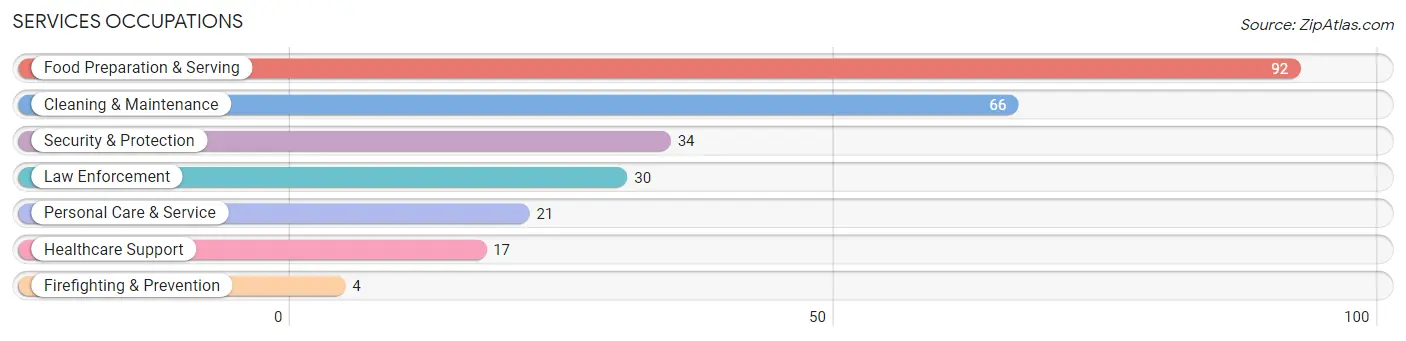
Services Occupations
The most common Services occupations in Dunn County are Food Preparation & Serving (92 | 4.8%), Cleaning & Maintenance (66 | 3.5%), Security & Protection (34 | 1.8%), Law Enforcement (30 | 1.6%), and Personal Care & Service (21 | 1.1%).
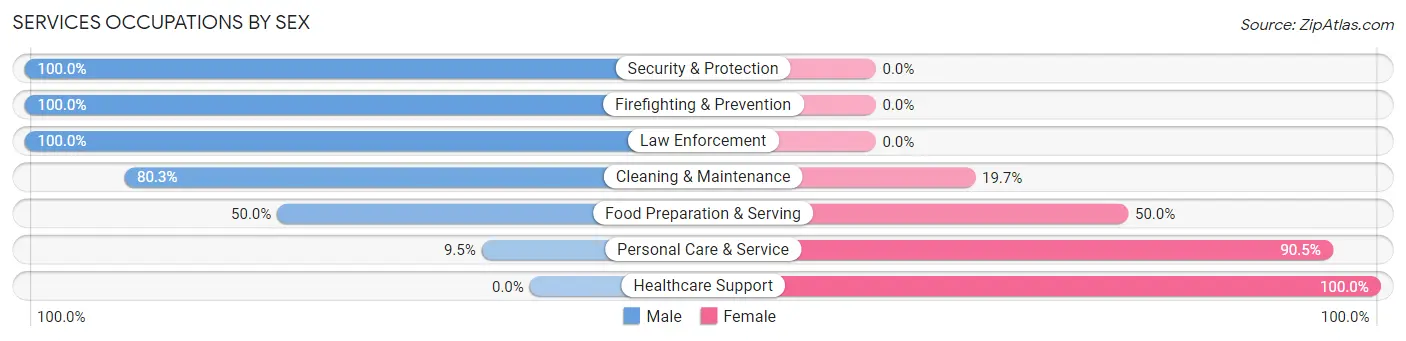
Services Occupations by Sex
Within the Services occupations in Dunn County, the most male-oriented occupations are Security & Protection (100.0%), Firefighting & Prevention (100.0%), and Law Enforcement (100.0%), while the most female-oriented occupations are Healthcare Support (100.0%), Personal Care & Service (90.5%), and Food Preparation & Serving (50.0%).
| Occupation | Male | Female |
| Healthcare Support | 0 (0.0%) | 17 (100.0%) |
| Security & Protection | 34 (100.0%) | 0 (0.0%) |
| Firefighting & Prevention | 4 (100.0%) | 0 (0.0%) |
| Law Enforcement | 30 (100.0%) | 0 (0.0%) |
| Food Preparation & Serving | 46 (50.0%) | 46 (50.0%) |
| Cleaning & Maintenance | 53 (80.3%) | 13 (19.7%) |
| Personal Care & Service | 2 (9.5%) | 19 (90.5%) |
| Total (Category) | 135 (58.7%) | 95 (41.3%) |
| Total (Overall) | 1,171 (61.2%) | 742 (38.8%) |
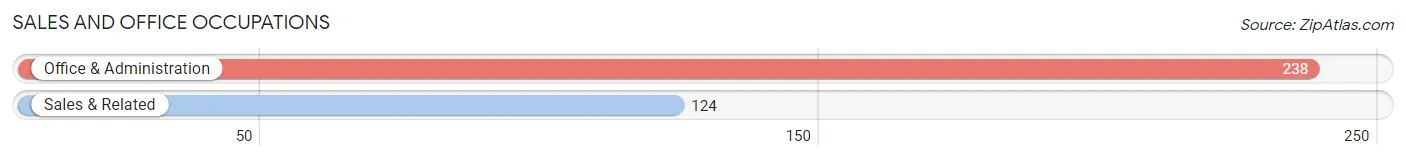
Sales and Office Occupations
The most common Sales and Office occupations in Dunn County are Office & Administration (238 | 12.4%), and Sales & Related (124 | 6.5%).
Sales and Office Occupations by Sex
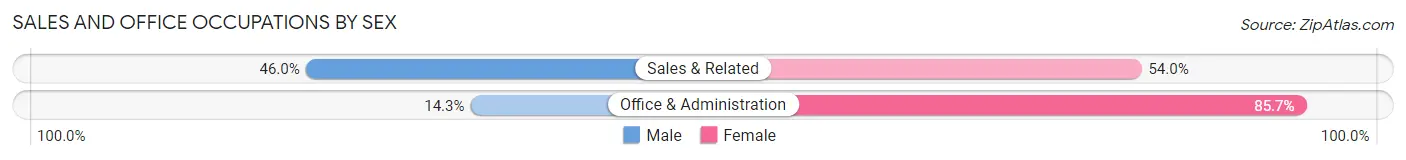
| Occupation | Male | Female |
| Sales & Related | 57 (46.0%) | 67 (54.0%) |
| Office & Administration | 34 (14.3%) | 204 (85.7%) |
| Total (Category) | 91 (25.1%) | 271 (74.9%) |
| Total (Overall) | 1,171 (61.2%) | 742 (38.8%) |
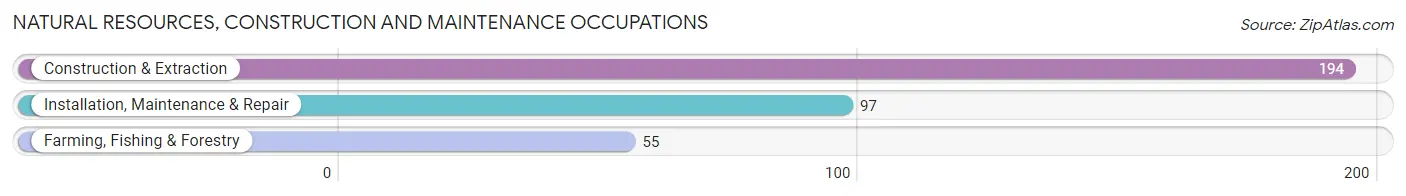
Natural Resources, Construction and Maintenance Occupations
The most common Natural Resources, Construction and Maintenance occupations in Dunn County are Construction & Extraction (194 | 10.1%), Installation, Maintenance & Repair (97 | 5.1%), and Farming, Fishing & Forestry (55 | 2.9%).
Natural Resources, Construction and Maintenance Occupations by Sex
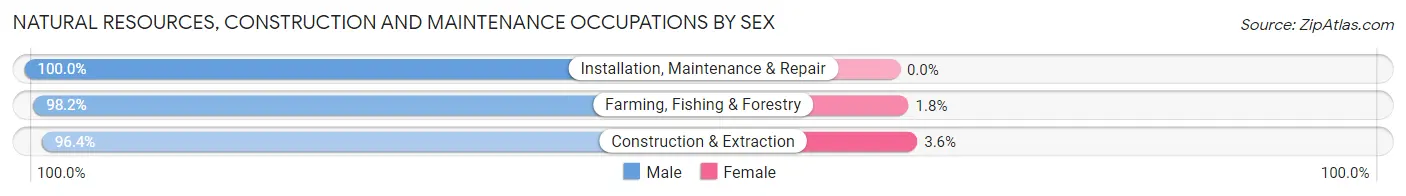
| Occupation | Male | Female |
| Farming, Fishing & Forestry | 54 (98.2%) | 1 (1.8%) |
| Construction & Extraction | 187 (96.4%) | 7 (3.6%) |
| Installation, Maintenance & Repair | 97 (100.0%) | 0 (0.0%) |
| Total (Category) | 338 (97.7%) | 8 (2.3%) |
| Total (Overall) | 1,171 (61.2%) | 742 (38.8%) |
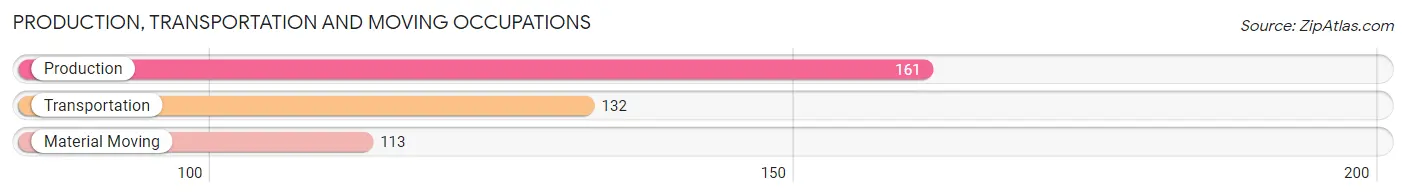
Production, Transportation and Moving Occupations
The most common Production, Transportation and Moving occupations in Dunn County are Production (161 | 8.4%), Transportation (132 | 6.9%), and Material Moving (113 | 5.9%).
Production, Transportation and Moving Occupations by Sex
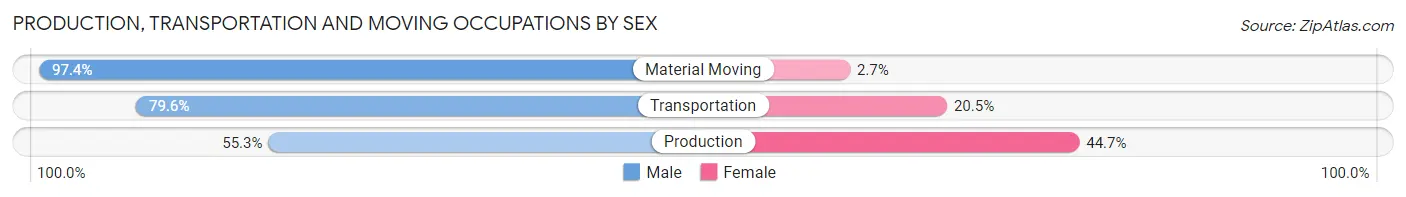
| Occupation | Male | Female |
| Production | 89 (55.3%) | 72 (44.7%) |
| Transportation | 105 (79.5%) | 27 (20.4%) |
| Material Moving | 110 (97.4%) | 3 (2.6%) |
| Total (Category) | 304 (74.9%) | 102 (25.1%) |
| Total (Overall) | 1,171 (61.2%) | 742 (38.8%) |
Employment Industries by Sex in Dunn County
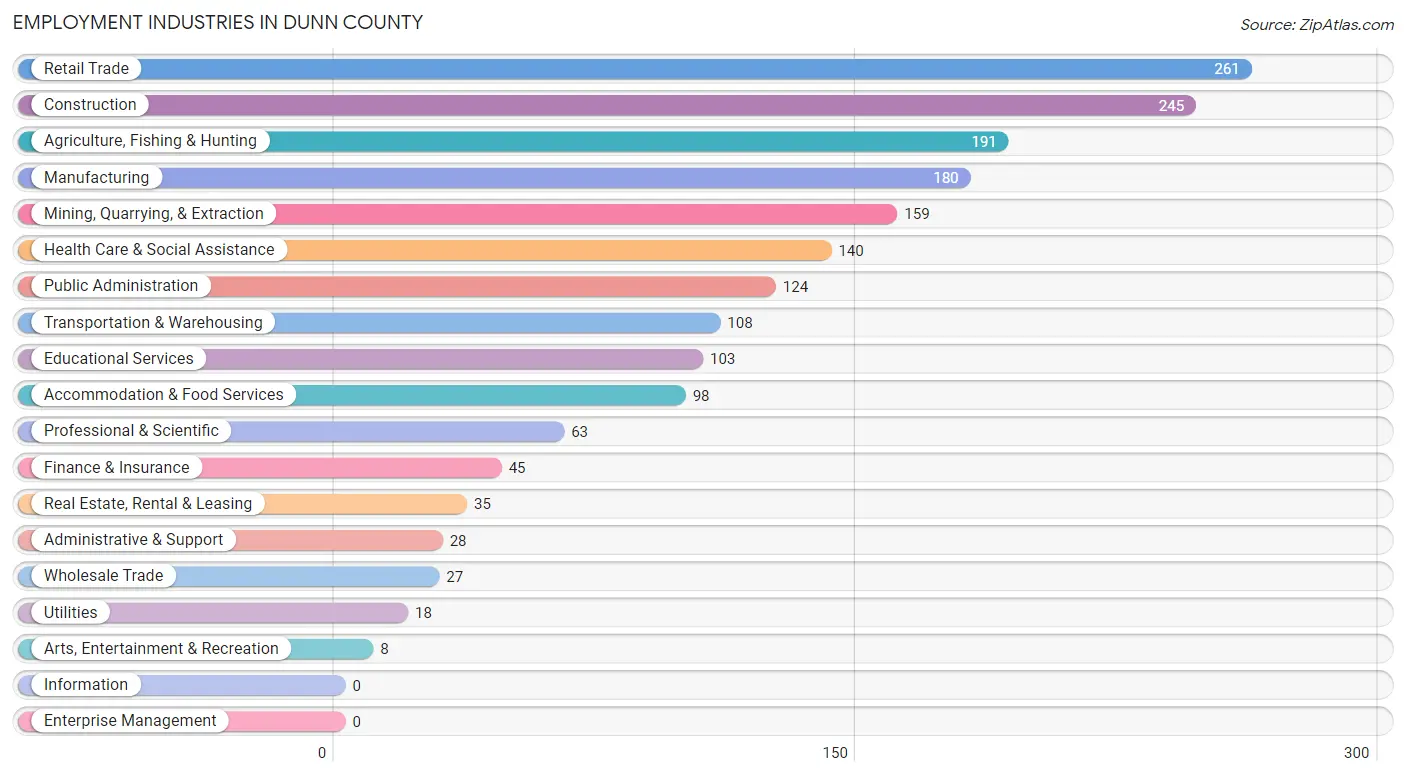
Employment Industries in Dunn County
The major employment industries in Dunn County include Retail Trade (261 | 13.6%), Construction (245 | 12.8%), Agriculture, Fishing & Hunting (191 | 10.0%), Manufacturing (180 | 9.4%), and Mining, Quarrying, & Extraction (159 | 8.3%).
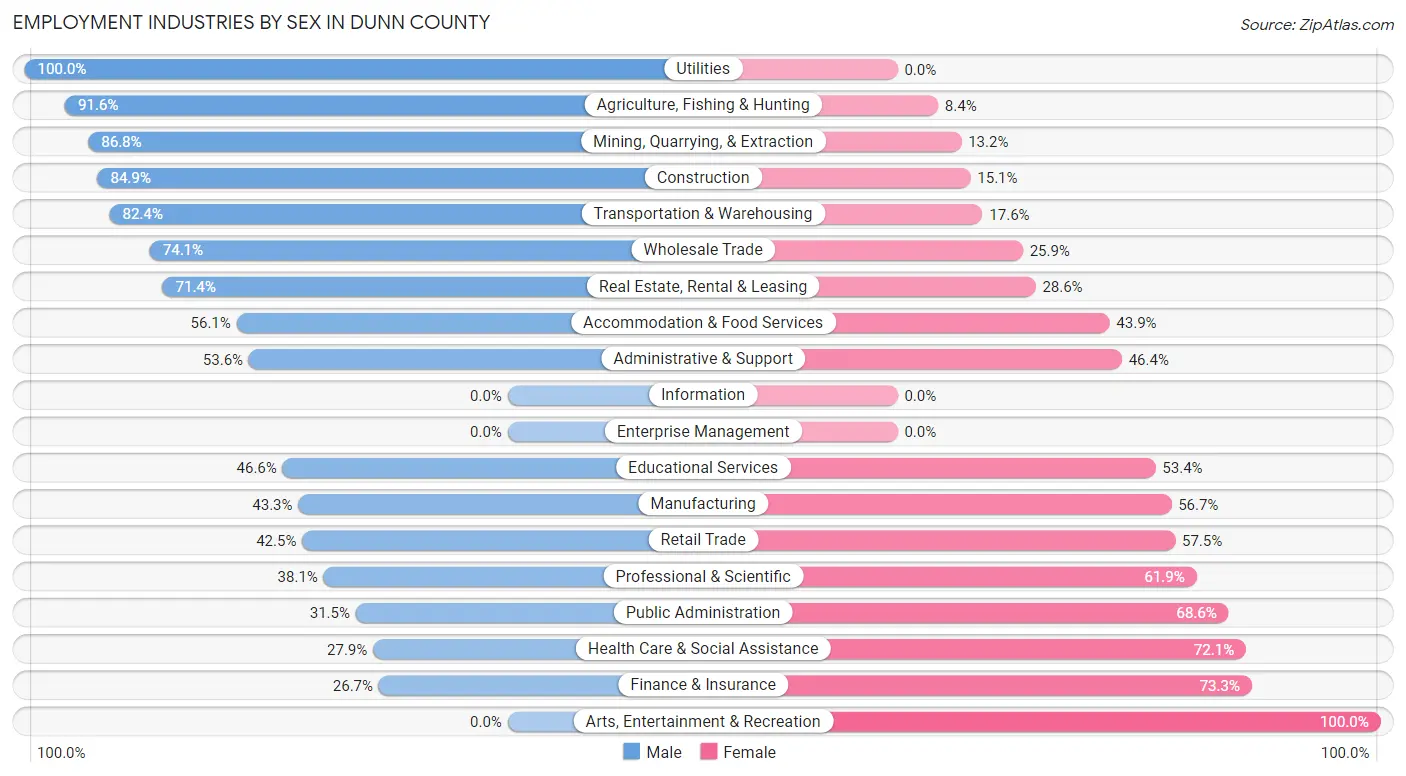
Employment Industries by Sex in Dunn County
The Dunn County industries that see more men than women are Utilities (100.0%), Agriculture, Fishing & Hunting (91.6%), and Mining, Quarrying, & Extraction (86.8%), whereas the industries that tend to have a higher number of women are Arts, Entertainment & Recreation (100.0%), Finance & Insurance (73.3%), and Health Care & Social Assistance (72.1%).
| Industry | Male | Female |
| Agriculture, Fishing & Hunting | 175 (91.6%) | 16 (8.4%) |
| Mining, Quarrying, & Extraction | 138 (86.8%) | 21 (13.2%) |
| Construction | 208 (84.9%) | 37 (15.1%) |
| Manufacturing | 78 (43.3%) | 102 (56.7%) |
| Wholesale Trade | 20 (74.1%) | 7 (25.9%) |
| Retail Trade | 111 (42.5%) | 150 (57.5%) |
| Transportation & Warehousing | 89 (82.4%) | 19 (17.6%) |
| Utilities | 18 (100.0%) | 0 (0.0%) |
| Information | 0 (0.0%) | 0 (0.0%) |
| Finance & Insurance | 12 (26.7%) | 33 (73.3%) |
| Real Estate, Rental & Leasing | 25 (71.4%) | 10 (28.6%) |
| Professional & Scientific | 24 (38.1%) | 39 (61.9%) |
| Enterprise Management | 0 (0.0%) | 0 (0.0%) |
| Administrative & Support | 15 (53.6%) | 13 (46.4%) |
| Educational Services | 48 (46.6%) | 55 (53.4%) |
| Health Care & Social Assistance | 39 (27.9%) | 101 (72.1%) |
| Arts, Entertainment & Recreation | 0 (0.0%) | 8 (100.0%) |
| Accommodation & Food Services | 55 (56.1%) | 43 (43.9%) |
| Public Administration | 39 (31.5%) | 85 (68.5%) |
| Total | 1,171 (61.2%) | 742 (38.8%) |
Education in Dunn County
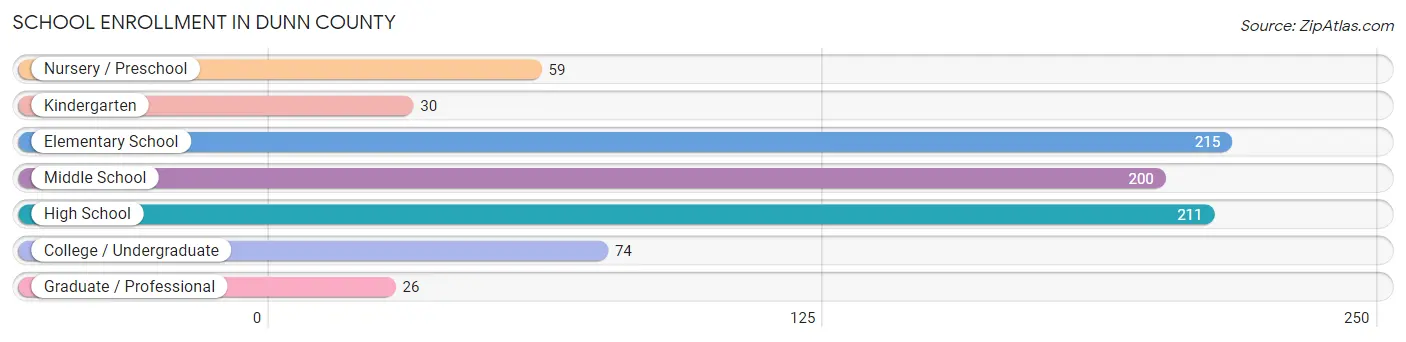
School Enrollment in Dunn County
The most common levels of schooling among the 815 students in Dunn County are elementary school (215 | 26.4%), high school (211 | 25.9%), and middle school (200 | 24.5%).
| School Level | # Students | % Students |
| Nursery / Preschool | 59 | 7.2% |
| Kindergarten | 30 | 3.7% |
| Elementary School | 215 | 26.4% |
| Middle School | 200 | 24.5% |
| High School | 211 | 25.9% |
| College / Undergraduate | 74 | 9.1% |
| Graduate / Professional | 26 | 3.2% |
| Total | 815 | 100.0% |
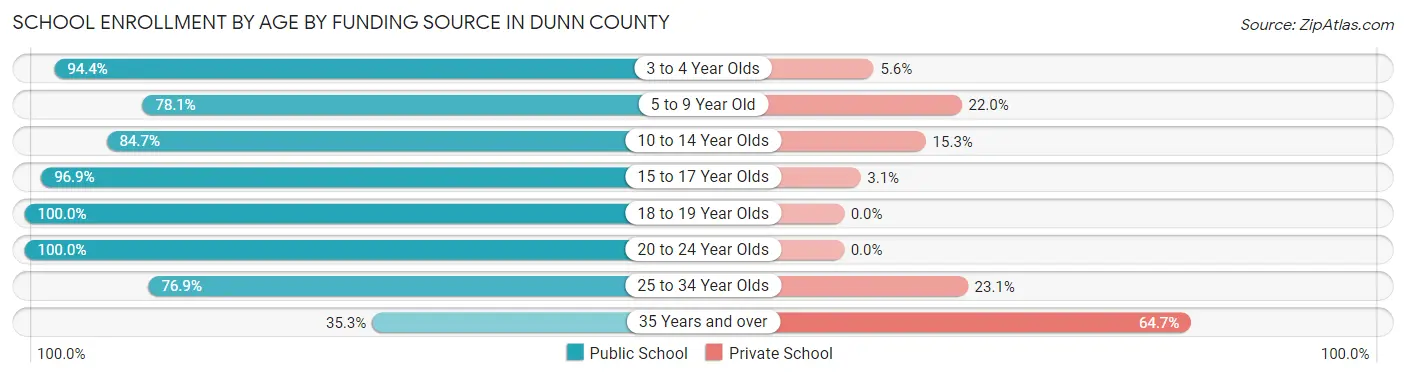
School Enrollment by Age by Funding Source in Dunn County
Out of a total of 815 students who are enrolled in schools in Dunn County, 141 (17.3%) attend a private institution, while the remaining 674 (82.7%) are enrolled in public schools. The age group of 35 years and over has the highest likelihood of being enrolled in private schools, with 33 (64.7% in the age bracket) enrolled. Conversely, the age group of 18 to 19 year olds has the lowest likelihood of being enrolled in a private school, with 29 (100.0% in the age bracket) attending a public institution.
| Age Bracket | Public School | Private School |
| 3 to 4 Year Olds | 34 (94.4%) | 2 (5.6%) |
| 5 to 9 Year Old | 192 (78.0%) | 54 (22.0%) |
| 10 to 14 Year Olds | 233 (84.7%) | 42 (15.3%) |
| 15 to 17 Year Olds | 125 (96.9%) | 4 (3.1%) |
| 18 to 19 Year Olds | 29 (100.0%) | 0 (0.0%) |
| 20 to 24 Year Olds | 23 (100.0%) | 0 (0.0%) |
| 25 to 34 Year Olds | 20 (76.9%) | 6 (23.1%) |
| 35 Years and over | 18 (35.3%) | 33 (64.7%) |
| Total | 674 (82.7%) | 141 (17.3%) |
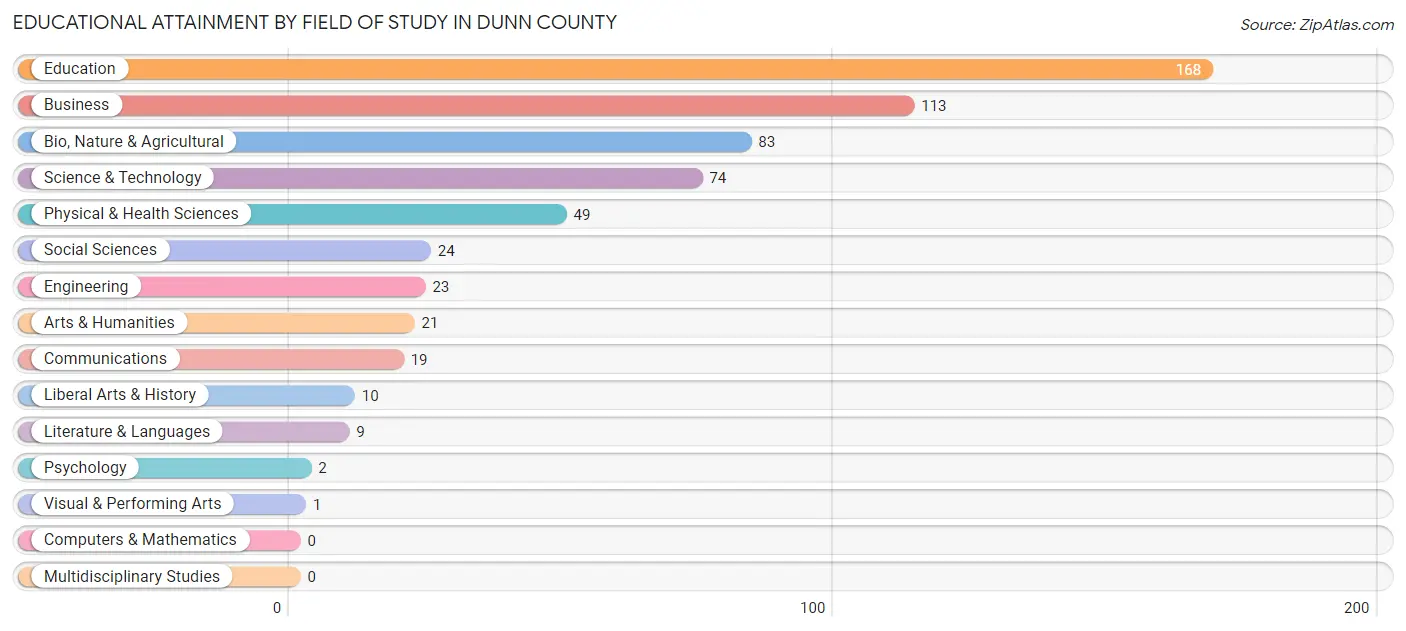
Educational Attainment by Field of Study in Dunn County
Education (168 | 28.2%), business (113 | 19.0%), bio, nature & agricultural (83 | 13.9%), science & technology (74 | 12.4%), and physical & health sciences (49 | 8.2%) are the most common fields of study among 596 individuals in Dunn County who have obtained a bachelor's degree or higher.
| Field of Study | # Graduates | % Graduates |
| Computers & Mathematics | 0 | 0.0% |
| Bio, Nature & Agricultural | 83 | 13.9% |
| Physical & Health Sciences | 49 | 8.2% |
| Psychology | 2 | 0.3% |
| Social Sciences | 24 | 4.0% |
| Engineering | 23 | 3.9% |
| Multidisciplinary Studies | 0 | 0.0% |
| Science & Technology | 74 | 12.4% |
| Business | 113 | 19.0% |
| Education | 168 | 28.2% |
| Literature & Languages | 9 | 1.5% |
| Liberal Arts & History | 10 | 1.7% |
| Visual & Performing Arts | 1 | 0.2% |
| Communications | 19 | 3.2% |
| Arts & Humanities | 21 | 3.5% |
| Total | 596 | 100.0% |
Transportation & Commute in Dunn County
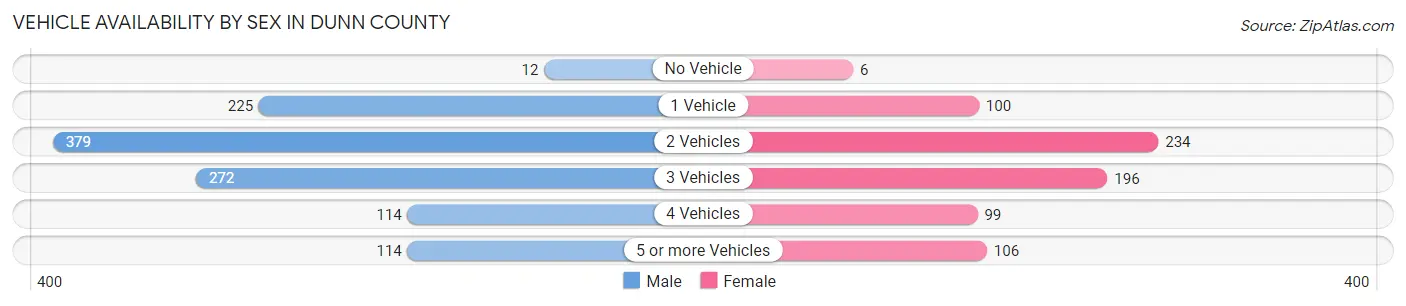
Vehicle Availability by Sex in Dunn County
The most prevalent vehicle ownership categories in Dunn County are males with 2 vehicles (379, accounting for 34.0%) and females with 2 vehicles (234, making up 51.1%).
| Vehicles Available | Male | Female |
| No Vehicle | 12 (1.1%) | 6 (0.8%) |
| 1 Vehicle | 225 (20.2%) | 100 (13.5%) |
| 2 Vehicles | 379 (34.0%) | 234 (31.6%) |
| 3 Vehicles | 272 (24.4%) | 196 (26.5%) |
| 4 Vehicles | 114 (10.2%) | 99 (13.4%) |
| 5 or more Vehicles | 114 (10.2%) | 106 (14.3%) |
| Total | 1,116 (100.0%) | 741 (100.0%) |
Commute Time in Dunn County
The most frequently occuring commute durations in Dunn County are 20 to 24 minutes (241 commuters, 14.8%), 15 to 19 minutes (235 commuters, 14.4%), and less than 5 minutes (233 commuters, 14.3%).
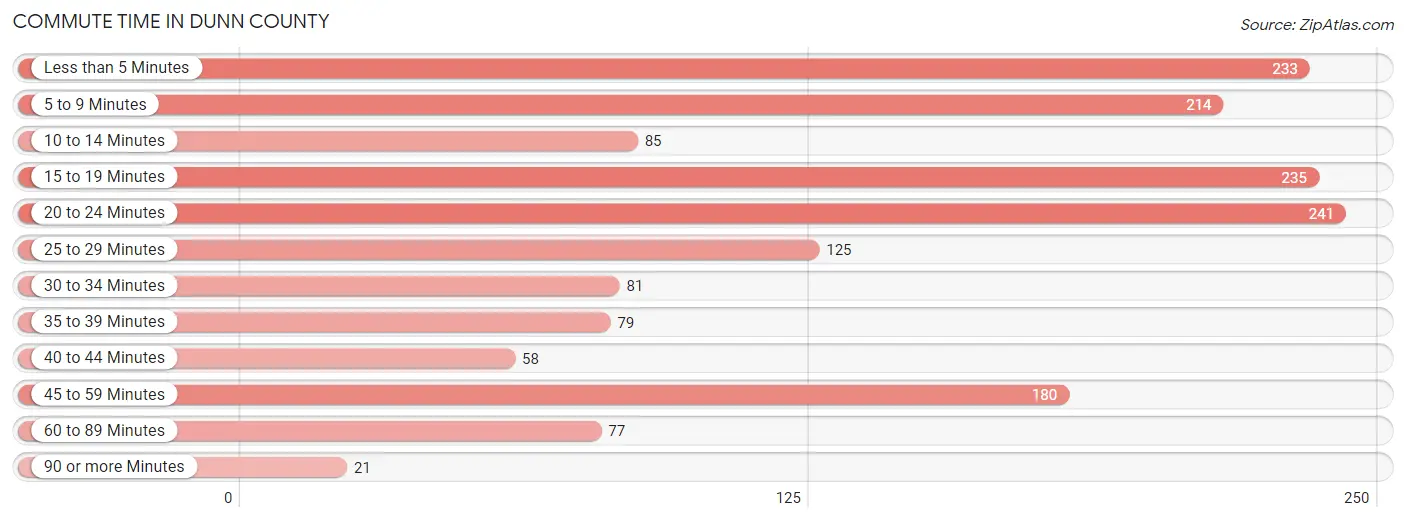
| Commute Time | # Commuters | % Commuters |
| Less than 5 Minutes | 233 | 14.3% |
| 5 to 9 Minutes | 214 | 13.1% |
| 10 to 14 Minutes | 85 | 5.2% |
| 15 to 19 Minutes | 235 | 14.4% |
| 20 to 24 Minutes | 241 | 14.8% |
| 25 to 29 Minutes | 125 | 7.7% |
| 30 to 34 Minutes | 81 | 5.0% |
| 35 to 39 Minutes | 79 | 4.9% |
| 40 to 44 Minutes | 58 | 3.6% |
| 45 to 59 Minutes | 180 | 11.1% |
| 60 to 89 Minutes | 77 | 4.7% |
| 90 or more Minutes | 21 | 1.3% |
Commute Time by Sex in Dunn County
The most common commute times in Dunn County are 20 to 24 minutes (153 commuters, 15.6%) for males and less than 5 minutes (110 commuters, 16.9%) for females.
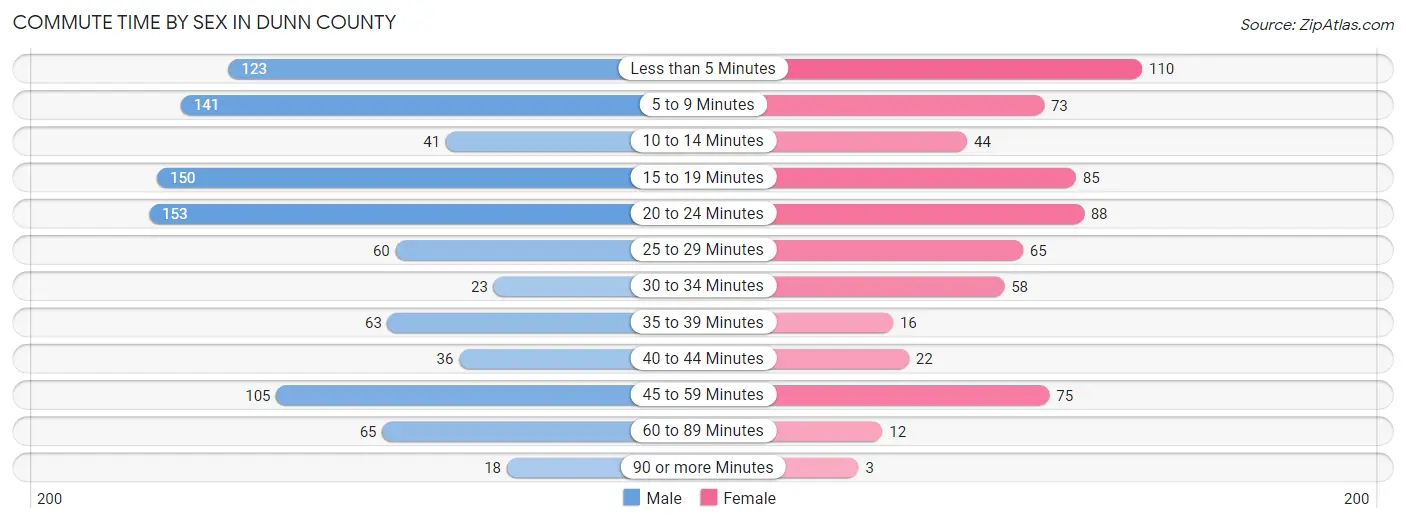
| Commute Time | Male | Female |
| Less than 5 Minutes | 123 (12.6%) | 110 (16.9%) |
| 5 to 9 Minutes | 141 (14.4%) | 73 (11.2%) |
| 10 to 14 Minutes | 41 (4.2%) | 44 (6.8%) |
| 15 to 19 Minutes | 150 (15.3%) | 85 (13.1%) |
| 20 to 24 Minutes | 153 (15.6%) | 88 (13.5%) |
| 25 to 29 Minutes | 60 (6.1%) | 65 (10.0%) |
| 30 to 34 Minutes | 23 (2.4%) | 58 (8.9%) |
| 35 to 39 Minutes | 63 (6.4%) | 16 (2.5%) |
| 40 to 44 Minutes | 36 (3.7%) | 22 (3.4%) |
| 45 to 59 Minutes | 105 (10.7%) | 75 (11.5%) |
| 60 to 89 Minutes | 65 (6.7%) | 12 (1.8%) |
| 90 or more Minutes | 18 (1.8%) | 3 (0.5%) |
Time of Departure to Work by Sex in Dunn County
The most frequent times of departure to work in Dunn County are 5:30 AM to 5:59 AM (186, 19.0%) for males and 7:30 AM to 7:59 AM (155, 23.8%) for females.
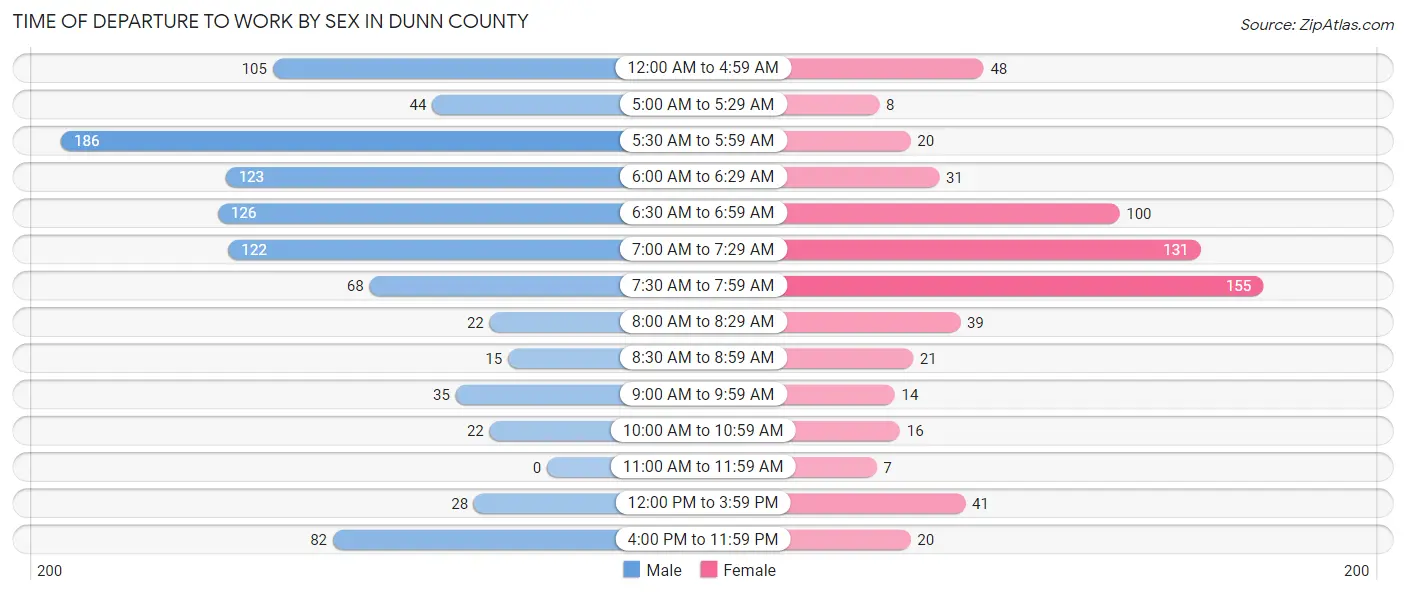
| Time of Departure | Male | Female |
| 12:00 AM to 4:59 AM | 105 (10.7%) | 48 (7.4%) |
| 5:00 AM to 5:29 AM | 44 (4.5%) | 8 (1.2%) |
| 5:30 AM to 5:59 AM | 186 (19.0%) | 20 (3.1%) |
| 6:00 AM to 6:29 AM | 123 (12.6%) | 31 (4.8%) |
| 6:30 AM to 6:59 AM | 126 (12.9%) | 100 (15.4%) |
| 7:00 AM to 7:29 AM | 122 (12.5%) | 131 (20.1%) |
| 7:30 AM to 7:59 AM | 68 (7.0%) | 155 (23.8%) |
| 8:00 AM to 8:29 AM | 22 (2.2%) | 39 (6.0%) |
| 8:30 AM to 8:59 AM | 15 (1.5%) | 21 (3.2%) |
| 9:00 AM to 9:59 AM | 35 (3.6%) | 14 (2.1%) |
| 10:00 AM to 10:59 AM | 22 (2.2%) | 16 (2.5%) |
| 11:00 AM to 11:59 AM | 0 (0.0%) | 7 (1.1%) |
| 12:00 PM to 3:59 PM | 28 (2.9%) | 41 (6.3%) |
| 4:00 PM to 11:59 PM | 82 (8.4%) | 20 (3.1%) |
| Total | 978 (100.0%) | 651 (100.0%) |
Housing Occupancy in Dunn County
Occupancy by Ownership in Dunn County
Of the total 1,493 dwellings in Dunn County, owner-occupied units account for 1,063 (71.2%), while renter-occupied units make up 430 (28.8%).
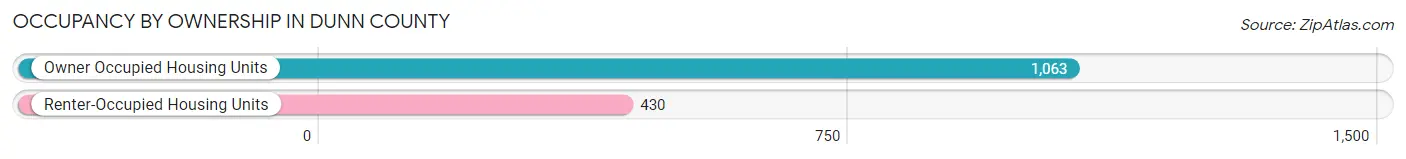
| Occupancy | # Housing Units | % Housing Units |
| Owner Occupied Housing Units | 1,063 | 71.2% |
| Renter-Occupied Housing Units | 430 | 28.8% |
| Total Occupied Housing Units | 1,493 | 100.0% |
Occupancy by Household Size in Dunn County
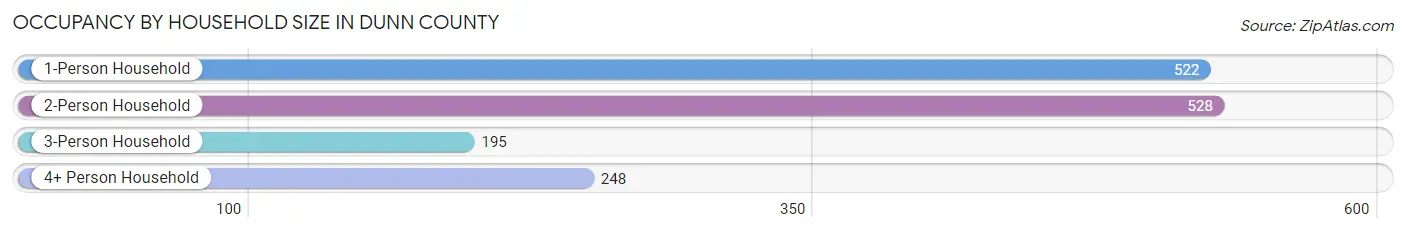
| Household Size | # Housing Units | % Housing Units |
| 1-Person Household | 522 | 35.0% |
| 2-Person Household | 528 | 35.4% |
| 3-Person Household | 195 | 13.1% |
| 4+ Person Household | 248 | 16.6% |
| Total Housing Units | 1,493 | 100.0% |
Occupancy by Ownership by Household Size in Dunn County
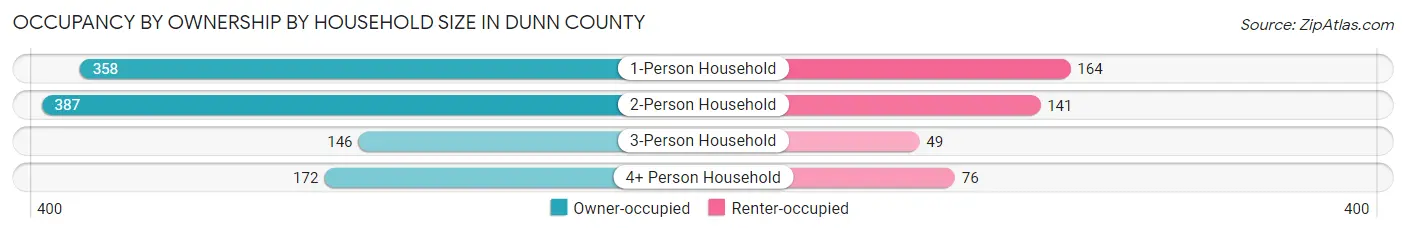
| Household Size | Owner-occupied | Renter-occupied |
| 1-Person Household | 358 (68.6%) | 164 (31.4%) |
| 2-Person Household | 387 (73.3%) | 141 (26.7%) |
| 3-Person Household | 146 (74.9%) | 49 (25.1%) |
| 4+ Person Household | 172 (69.4%) | 76 (30.6%) |
| Total Housing Units | 1,063 (71.2%) | 430 (28.8%) |
Occupancy by Educational Attainment in Dunn County
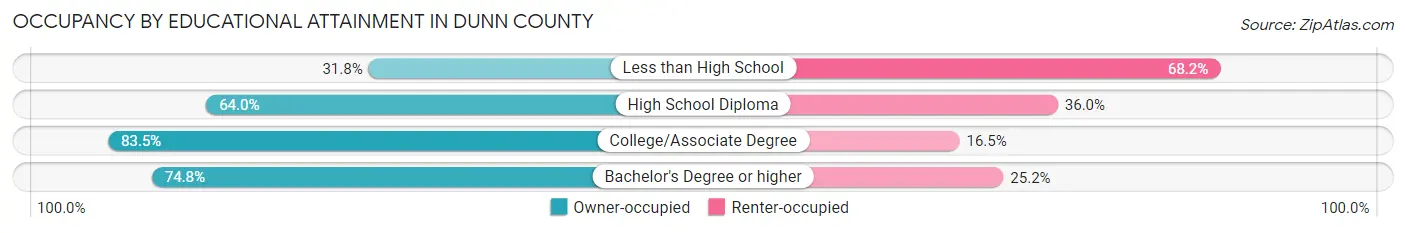
| Household Size | Owner-occupied | Renter-occupied |
| Less than High School | 42 (31.8%) | 90 (68.2%) |
| High School Diploma | 286 (64.0%) | 161 (36.0%) |
| College/Associate Degree | 495 (83.5%) | 98 (16.5%) |
| Bachelor's Degree or higher | 240 (74.8%) | 81 (25.2%) |
Occupancy by Age of Householder in Dunn County
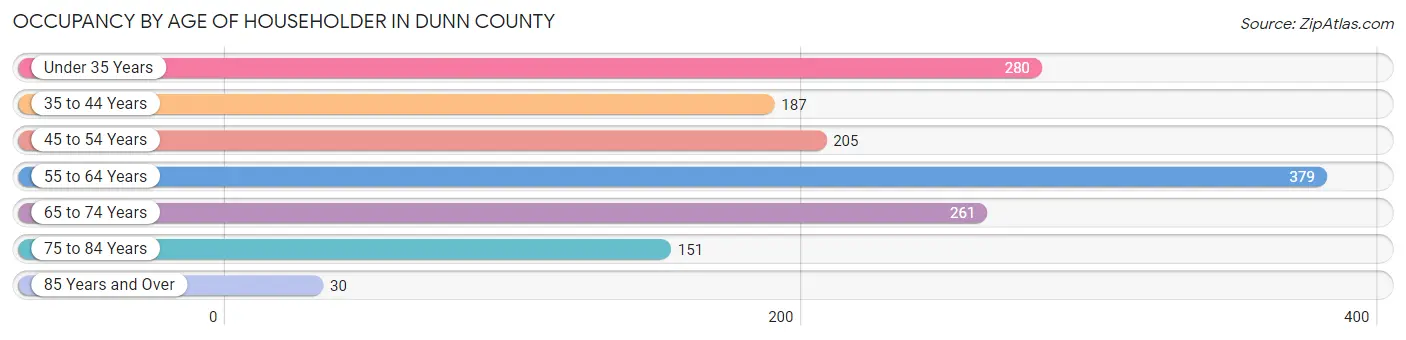
| Age Bracket | # Households | % Households |
| Under 35 Years | 280 | 18.8% |
| 35 to 44 Years | 187 | 12.5% |
| 45 to 54 Years | 205 | 13.7% |
| 55 to 64 Years | 379 | 25.4% |
| 65 to 74 Years | 261 | 17.5% |
| 75 to 84 Years | 151 | 10.1% |
| 85 Years and Over | 30 | 2.0% |
| Total | 1,493 | 100.0% |
Housing Finances in Dunn County
Median Income by Occupancy in Dunn County
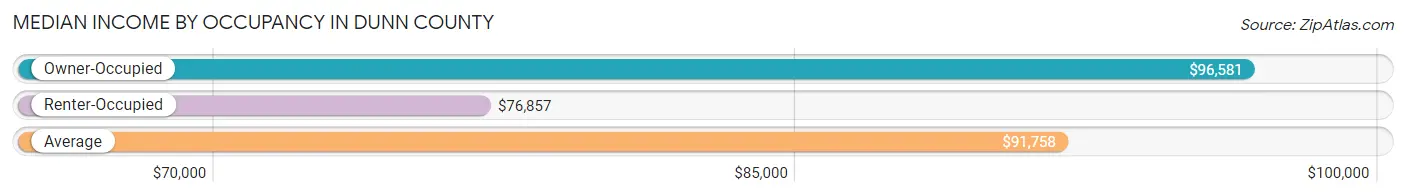
| Occupancy Type | # Households | Median Income |
| Owner-Occupied | 1,063 (71.2%) | $96,581 |
| Renter-Occupied | 430 (28.8%) | $76,857 |
| Average | 1,493 (100.0%) | $91,758 |
Occupancy by Householder Income Bracket in Dunn County
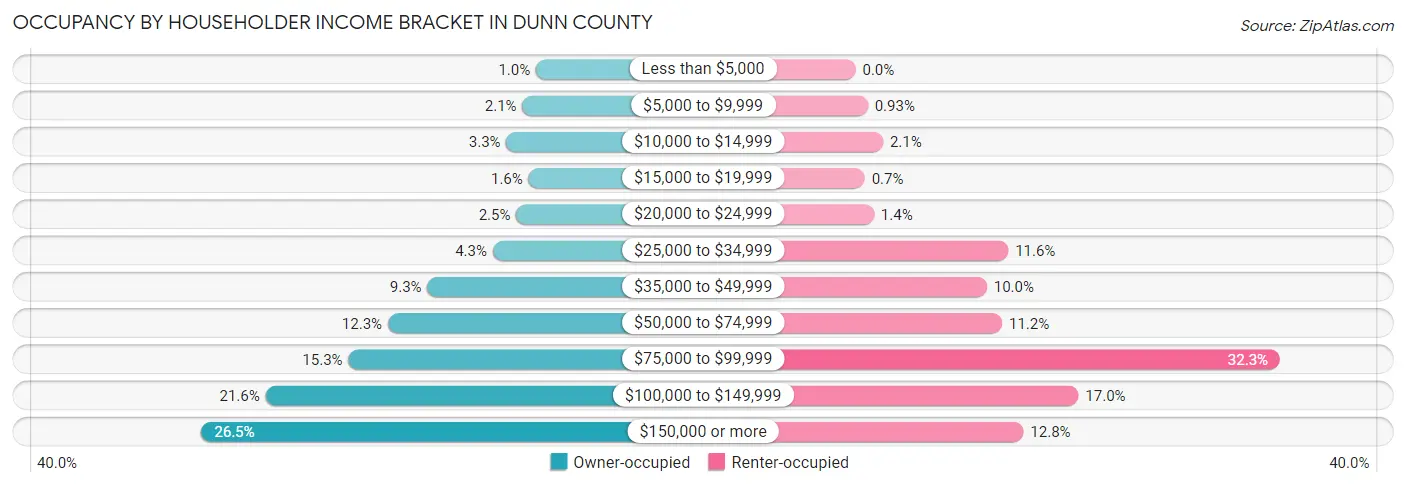
| Income Bracket | Owner-occupied | Renter-occupied |
| Less than $5,000 | 11 (1.0%) | 0 (0.0%) |
| $5,000 to $9,999 | 22 (2.1%) | 4 (0.9%) |
| $10,000 to $14,999 | 35 (3.3%) | 9 (2.1%) |
| $15,000 to $19,999 | 17 (1.6%) | 3 (0.7%) |
| $20,000 to $24,999 | 27 (2.5%) | 6 (1.4%) |
| $25,000 to $34,999 | 46 (4.3%) | 50 (11.6%) |
| $35,000 to $49,999 | 99 (9.3%) | 43 (10.0%) |
| $50,000 to $74,999 | 131 (12.3%) | 48 (11.2%) |
| $75,000 to $99,999 | 163 (15.3%) | 139 (32.3%) |
| $100,000 to $149,999 | 230 (21.6%) | 73 (17.0%) |
| $150,000 or more | 282 (26.5%) | 55 (12.8%) |
| Total | 1,063 (100.0%) | 430 (100.0%) |
Monthly Housing Cost Tiers in Dunn County
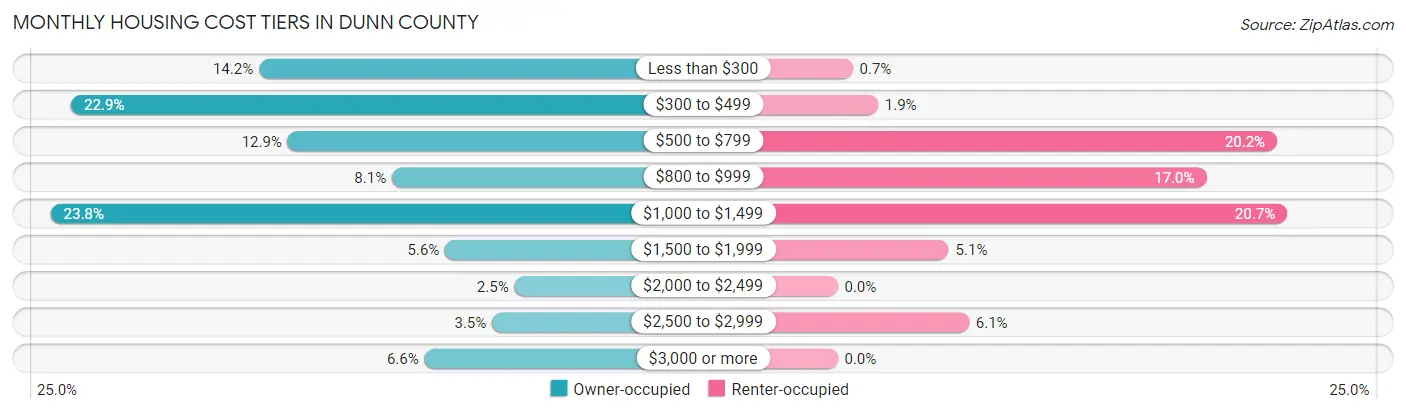
| Monthly Cost | Owner-occupied | Renter-occupied |
| Less than $300 | 151 (14.2%) | 3 (0.7%) |
| $300 to $499 | 243 (22.9%) | 8 (1.9%) |
| $500 to $799 | 137 (12.9%) | 87 (20.2%) |
| $800 to $999 | 86 (8.1%) | 73 (17.0%) |
| $1,000 to $1,499 | 253 (23.8%) | 89 (20.7%) |
| $1,500 to $1,999 | 60 (5.6%) | 22 (5.1%) |
| $2,000 to $2,499 | 26 (2.5%) | 0 (0.0%) |
| $2,500 to $2,999 | 37 (3.5%) | 26 (6.0%) |
| $3,000 or more | 70 (6.6%) | 0 (0.0%) |
| Total | 1,063 (100.0%) | 430 (100.0%) |
Physical Housing Characteristics in Dunn County
Housing Structures in Dunn County
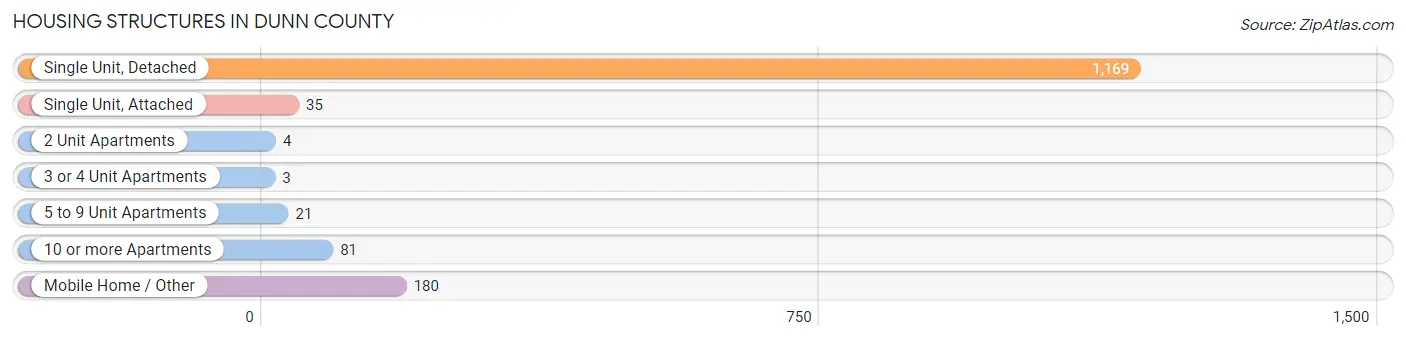
| Structure Type | # Housing Units | % Housing Units |
| Single Unit, Detached | 1,169 | 78.3% |
| Single Unit, Attached | 35 | 2.3% |
| 2 Unit Apartments | 4 | 0.3% |
| 3 or 4 Unit Apartments | 3 | 0.2% |
| 5 to 9 Unit Apartments | 21 | 1.4% |
| 10 or more Apartments | 81 | 5.4% |
| Mobile Home / Other | 180 | 12.1% |
| Total | 1,493 | 100.0% |
Housing Structures by Occupancy in Dunn County
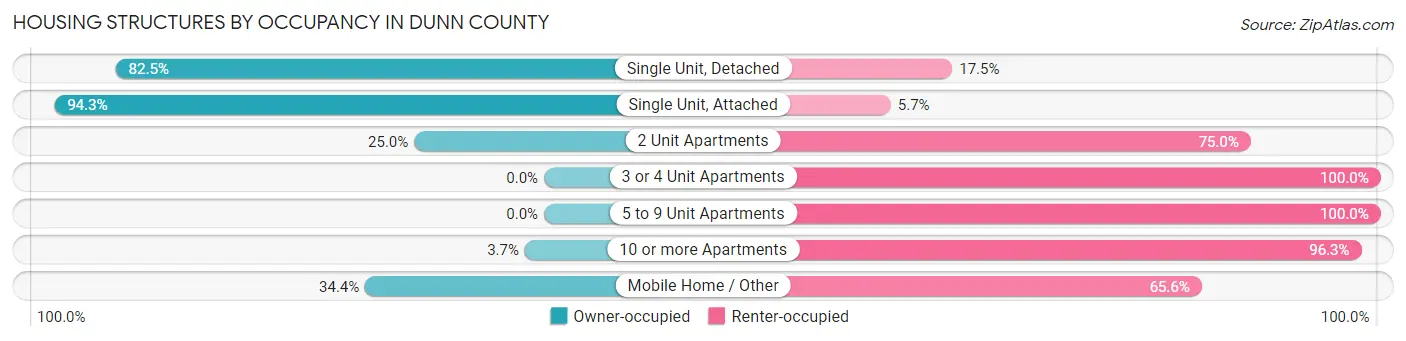
| Structure Type | Owner-occupied | Renter-occupied |
| Single Unit, Detached | 964 (82.5%) | 205 (17.5%) |
| Single Unit, Attached | 33 (94.3%) | 2 (5.7%) |
| 2 Unit Apartments | 1 (25.0%) | 3 (75.0%) |
| 3 or 4 Unit Apartments | 0 (0.0%) | 3 (100.0%) |
| 5 to 9 Unit Apartments | 0 (0.0%) | 21 (100.0%) |
| 10 or more Apartments | 3 (3.7%) | 78 (96.3%) |
| Mobile Home / Other | 62 (34.4%) | 118 (65.6%) |
| Total | 1,063 (71.2%) | 430 (28.8%) |
Housing Structures by Number of Rooms in Dunn County
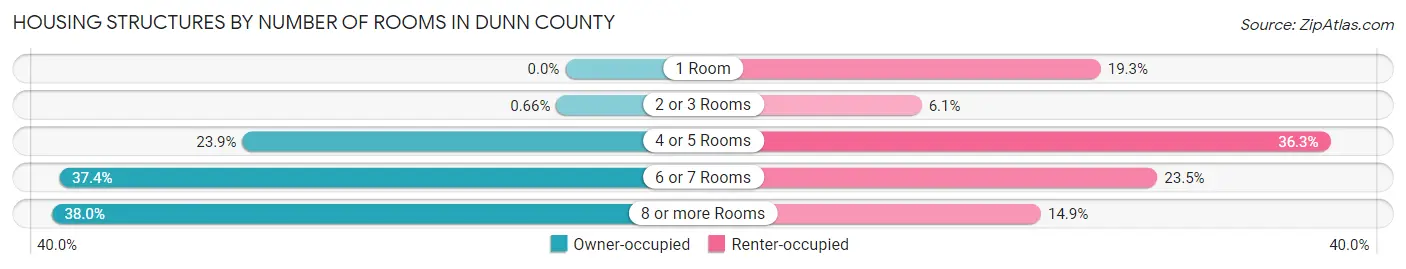
| Number of Rooms | Owner-occupied | Renter-occupied |
| 1 Room | 0 (0.0%) | 83 (19.3%) |
| 2 or 3 Rooms | 7 (0.7%) | 26 (6.0%) |
| 4 or 5 Rooms | 254 (23.9%) | 156 (36.3%) |
| 6 or 7 Rooms | 398 (37.4%) | 101 (23.5%) |
| 8 or more Rooms | 404 (38.0%) | 64 (14.9%) |
| Total | 1,063 (100.0%) | 430 (100.0%) |
Housing Structure by Heating Type in Dunn County
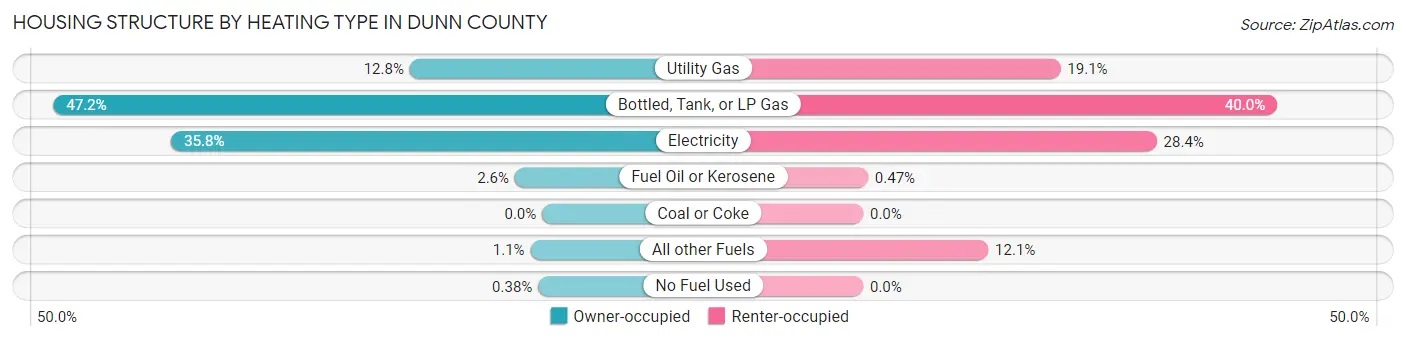
| Heating Type | Owner-occupied | Renter-occupied |
| Utility Gas | 136 (12.8%) | 82 (19.1%) |
| Bottled, Tank, or LP Gas | 502 (47.2%) | 172 (40.0%) |
| Electricity | 381 (35.8%) | 122 (28.4%) |
| Fuel Oil or Kerosene | 28 (2.6%) | 2 (0.5%) |
| Coal or Coke | 0 (0.0%) | 0 (0.0%) |
| All other Fuels | 12 (1.1%) | 52 (12.1%) |
| No Fuel Used | 4 (0.4%) | 0 (0.0%) |
| Total | 1,063 (100.0%) | 430 (100.0%) |
Household Vehicle Usage in Dunn County
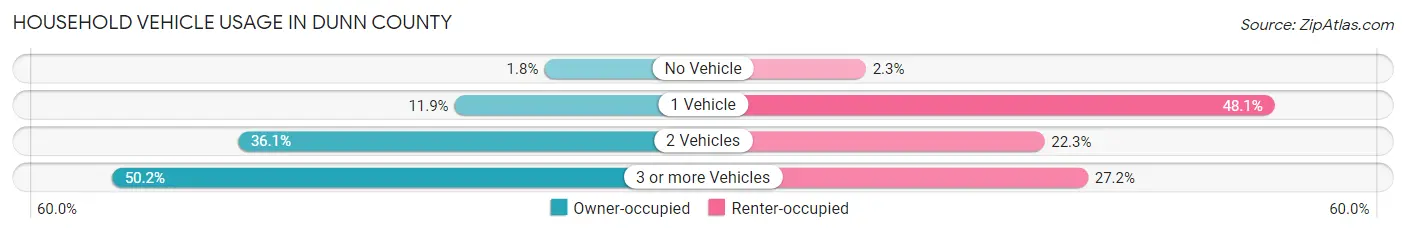
| Vehicles per Household | Owner-occupied | Renter-occupied |
| No Vehicle | 19 (1.8%) | 10 (2.3%) |
| 1 Vehicle | 126 (11.8%) | 207 (48.1%) |
| 2 Vehicles | 384 (36.1%) | 96 (22.3%) |
| 3 or more Vehicles | 534 (50.2%) | 117 (27.2%) |
| Total | 1,063 (100.0%) | 430 (100.0%) |
Real Estate & Mortgages in Dunn County
Real Estate and Mortgage Overview in Dunn County
| Characteristic | Without Mortgage | With Mortgage |
| Housing Units | 663 | 400 |
| Median Property Value | $247,300 | $261,700 |
| Median Household Income | $87,171 | $100 |
| Monthly Housing Costs | $463 | $63 |
| Real Estate Taxes | $1,583 | $20 |
Property Value by Mortgage Status in Dunn County
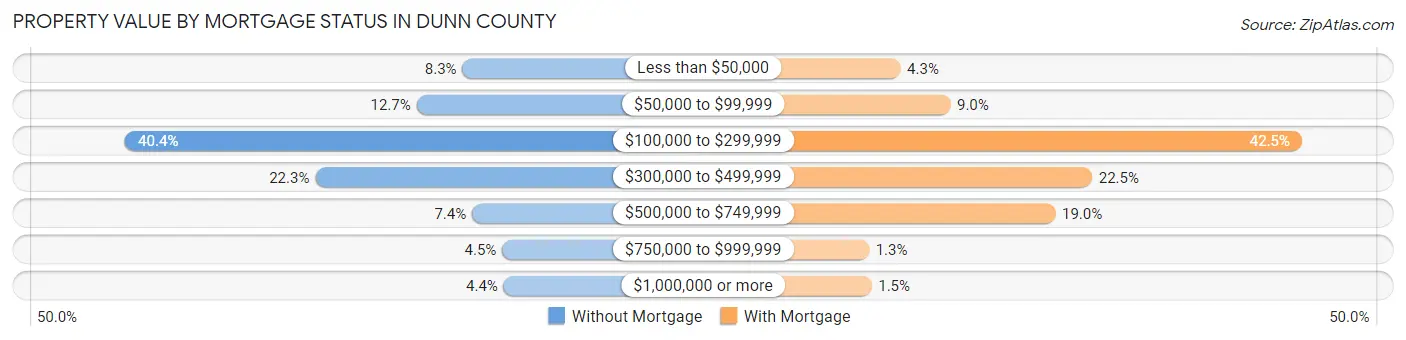
| Property Value | Without Mortgage | With Mortgage |
| Less than $50,000 | 55 (8.3%) | 17 (4.3%) |
| $50,000 to $99,999 | 84 (12.7%) | 36 (9.0%) |
| $100,000 to $299,999 | 268 (40.4%) | 170 (42.5%) |
| $300,000 to $499,999 | 148 (22.3%) | 90 (22.5%) |
| $500,000 to $749,999 | 49 (7.4%) | 76 (19.0%) |
| $750,000 to $999,999 | 30 (4.5%) | 5 (1.3%) |
| $1,000,000 or more | 29 (4.4%) | 6 (1.5%) |
| Total | 663 (100.0%) | 400 (100.0%) |
Household Income by Mortgage Status in Dunn County
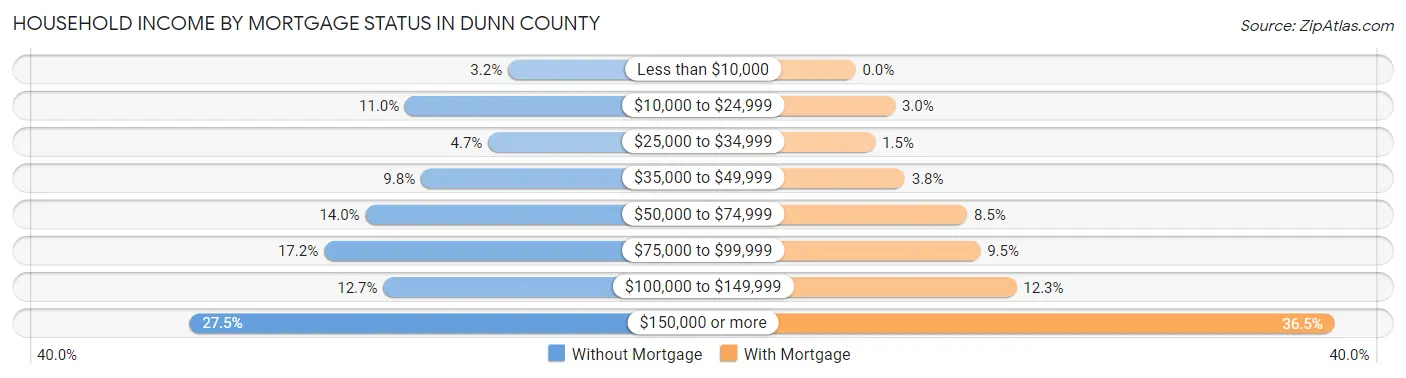
| Household Income | Without Mortgage | With Mortgage |
| Less than $10,000 | 21 (3.2%) | 0 (0.0%) |
| $10,000 to $24,999 | 73 (11.0%) | 12 (3.0%) |
| $25,000 to $34,999 | 31 (4.7%) | 6 (1.5%) |
| $35,000 to $49,999 | 65 (9.8%) | 15 (3.7%) |
| $50,000 to $74,999 | 93 (14.0%) | 34 (8.5%) |
| $75,000 to $99,999 | 114 (17.2%) | 38 (9.5%) |
| $100,000 to $149,999 | 84 (12.7%) | 49 (12.2%) |
| $150,000 or more | 182 (27.5%) | 146 (36.5%) |
| Total | 663 (100.0%) | 400 (100.0%) |
Property Value to Household Income Ratio in Dunn County
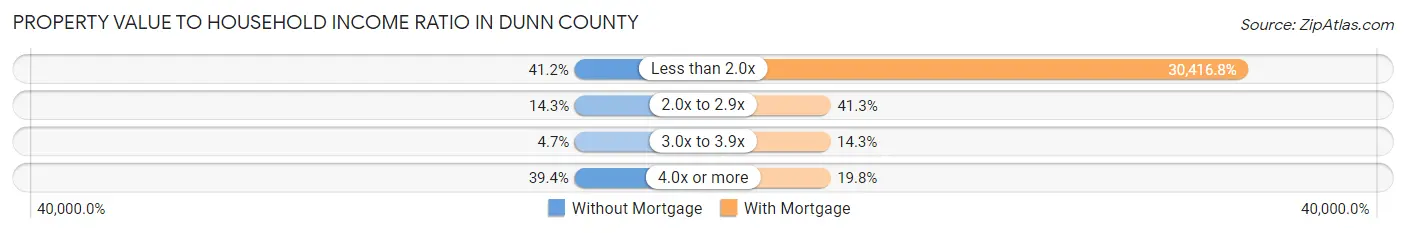
| Value-to-Income Ratio | Without Mortgage | With Mortgage |
| Less than 2.0x | 273 (41.2%) | 121,667 (30,416.8%) |
| 2.0x to 2.9x | 95 (14.3%) | 165 (41.2%) |
| 3.0x to 3.9x | 31 (4.7%) | 57 (14.2%) |
| 4.0x or more | 261 (39.4%) | 79 (19.8%) |
| Total | 663 (100.0%) | 400 (100.0%) |
Real Estate Taxes by Mortgage Status in Dunn County
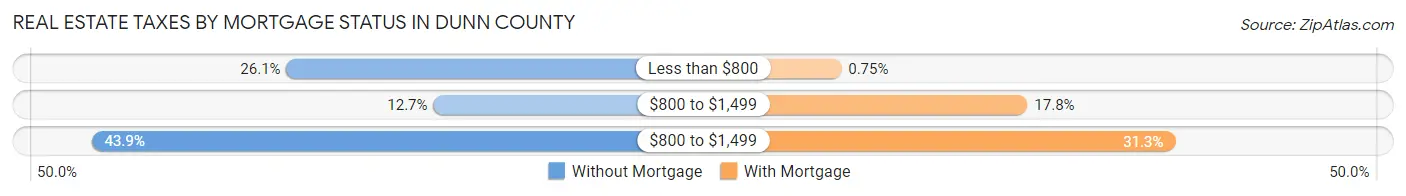
| Property Taxes | Without Mortgage | With Mortgage |
| Less than $800 | 173 (26.1%) | 3 (0.7%) |
| $800 to $1,499 | 84 (12.7%) | 71 (17.7%) |
| $800 to $1,499 | 291 (43.9%) | 125 (31.2%) |
| Total | 663 (100.0%) | 400 (100.0%) |
Health & Disability in Dunn County
Health Insurance Coverage by Age in Dunn County
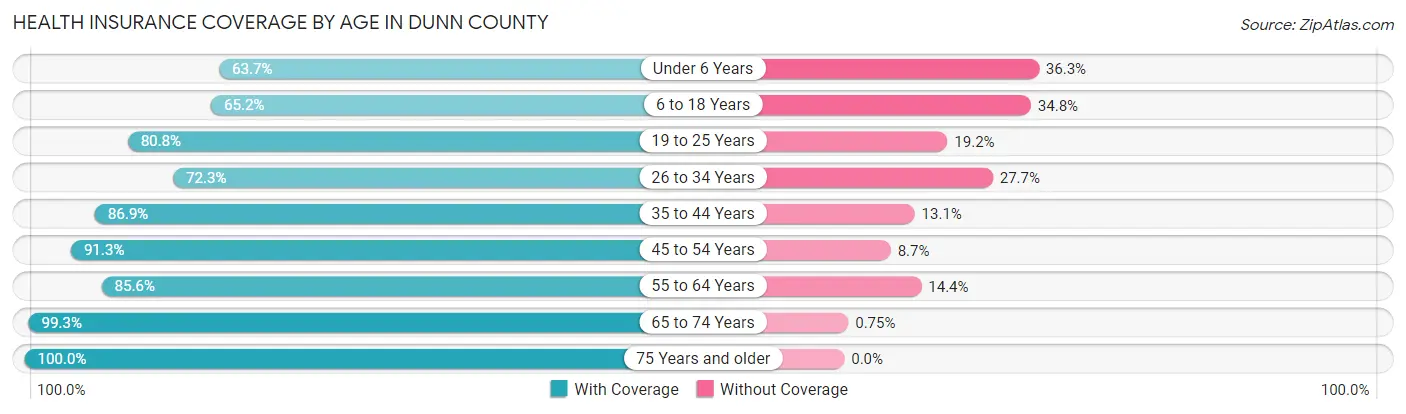
| Age Bracket | With Coverage | Without Coverage |
| Under 6 Years | 223 (63.7%) | 127 (36.3%) |
| 6 to 18 Years | 429 (65.2%) | 229 (34.8%) |
| 19 to 25 Years | 168 (80.8%) | 40 (19.2%) |
| 26 to 34 Years | 350 (72.3%) | 134 (27.7%) |
| 35 to 44 Years | 384 (86.9%) | 58 (13.1%) |
| 45 to 54 Years | 443 (91.3%) | 42 (8.7%) |
| 55 to 64 Years | 596 (85.6%) | 100 (14.4%) |
| 65 to 74 Years | 395 (99.3%) | 3 (0.7%) |
| 75 Years and older | 260 (100.0%) | 0 (0.0%) |
| Total | 3,248 (81.6%) | 733 (18.4%) |
Health Insurance Coverage by Citizenship Status in Dunn County
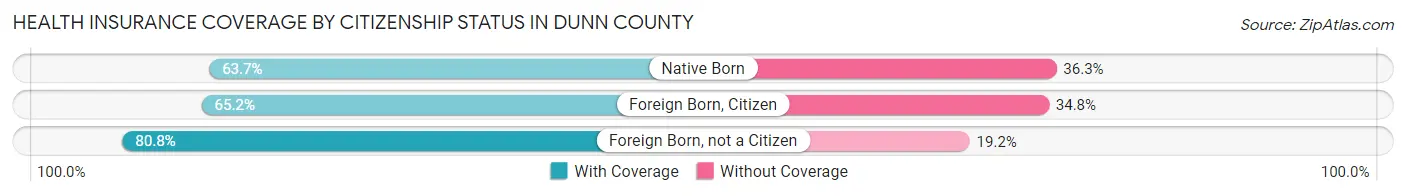
| Citizenship Status | With Coverage | Without Coverage |
| Native Born | 223 (63.7%) | 127 (36.3%) |
| Foreign Born, Citizen | 429 (65.2%) | 229 (34.8%) |
| Foreign Born, not a Citizen | 168 (80.8%) | 40 (19.2%) |
Health Insurance Coverage by Household Income in Dunn County
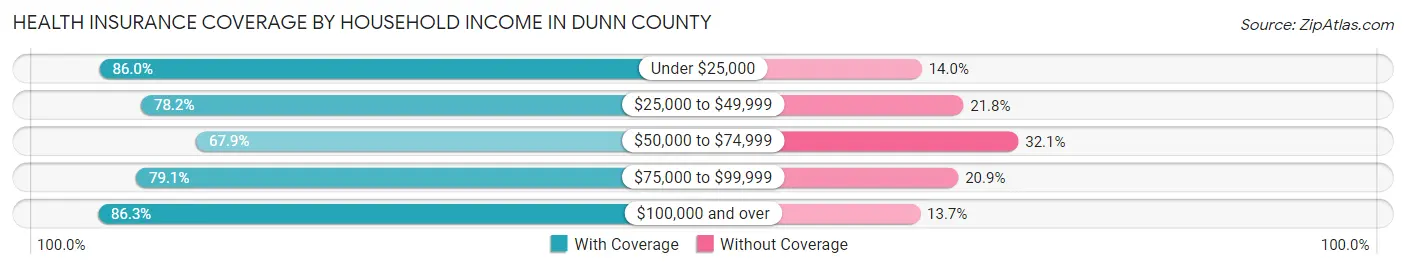
| Household Income | With Coverage | Without Coverage |
| Under $25,000 | 147 (86.0%) | 24 (14.0%) |
| $25,000 to $49,999 | 351 (78.2%) | 98 (21.8%) |
| $50,000 to $74,999 | 357 (67.9%) | 169 (32.1%) |
| $75,000 to $99,999 | 542 (79.1%) | 143 (20.9%) |
| $100,000 and over | 1,814 (86.3%) | 289 (13.7%) |
Public vs Private Health Insurance Coverage by Age in Dunn County
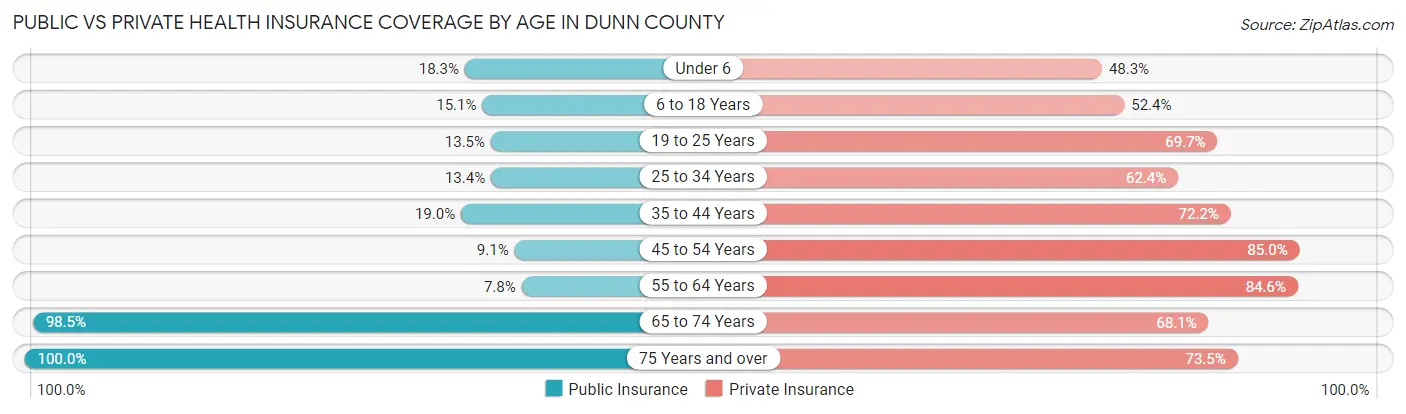
| Age Bracket | Public Insurance | Private Insurance |
| Under 6 | 64 (18.3%) | 169 (48.3%) |
| 6 to 18 Years | 99 (15.0%) | 345 (52.4%) |
| 19 to 25 Years | 28 (13.5%) | 145 (69.7%) |
| 25 to 34 Years | 65 (13.4%) | 302 (62.4%) |
| 35 to 44 Years | 84 (19.0%) | 319 (72.2%) |
| 45 to 54 Years | 44 (9.1%) | 412 (85.0%) |
| 55 to 64 Years | 54 (7.8%) | 589 (84.6%) |
| 65 to 74 Years | 392 (98.5%) | 271 (68.1%) |
| 75 Years and over | 260 (100.0%) | 191 (73.5%) |
| Total | 1,090 (27.4%) | 2,743 (68.9%) |
Disability Status by Sex by Age in Dunn County
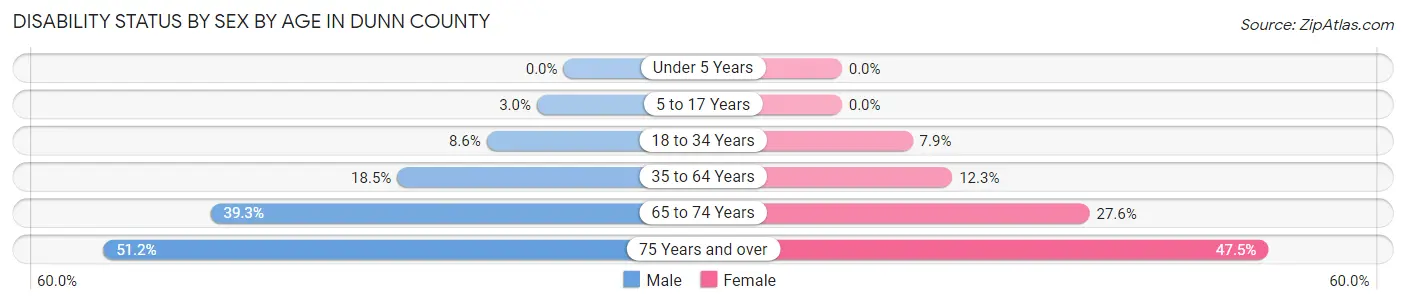
| Age Bracket | Male | Female |
| Under 5 Years | 0 (0.0%) | 0 (0.0%) |
| 5 to 17 Years | 11 (3.0%) | 0 (0.0%) |
| 18 to 34 Years | 37 (8.6%) | 24 (7.9%) |
| 35 to 64 Years | 171 (18.5%) | 86 (12.3%) |
| 65 to 74 Years | 88 (39.3%) | 48 (27.6%) |
| 75 Years and over | 62 (51.2%) | 66 (47.5%) |
Disability Class by Sex by Age in Dunn County
Disability Class: Hearing Difficulty
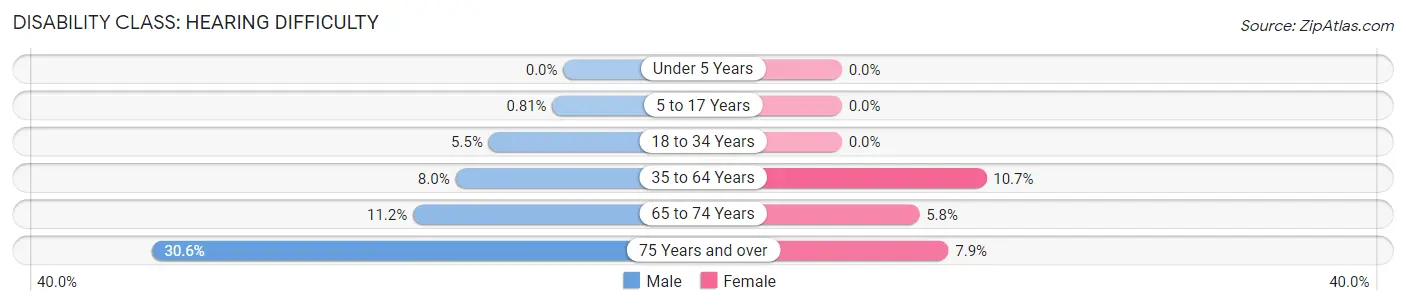
| Age Bracket | Male | Female |
| Under 5 Years | 0 (0.0%) | 0 (0.0%) |
| 5 to 17 Years | 3 (0.8%) | 0 (0.0%) |
| 18 to 34 Years | 24 (5.5%) | 0 (0.0%) |
| 35 to 64 Years | 74 (8.0%) | 75 (10.7%) |
| 65 to 74 Years | 25 (11.2%) | 10 (5.8%) |
| 75 Years and over | 37 (30.6%) | 11 (7.9%) |
Disability Class: Vision Difficulty
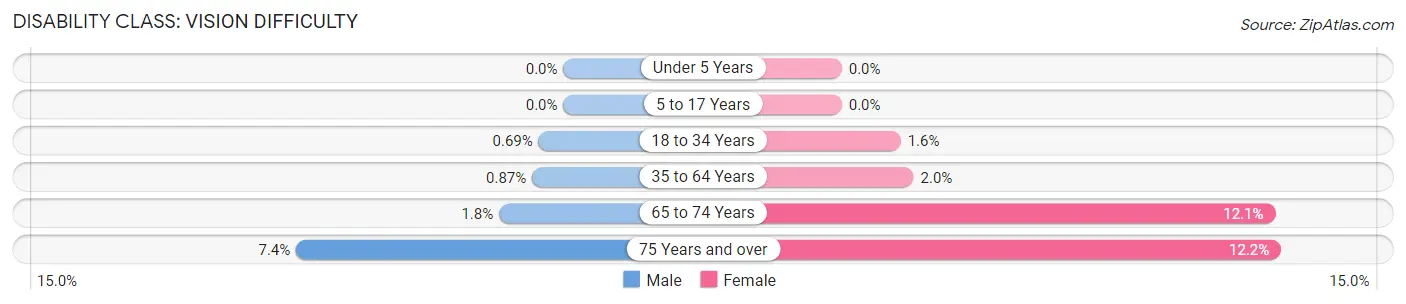
| Age Bracket | Male | Female |
| Under 5 Years | 0 (0.0%) | 0 (0.0%) |
| 5 to 17 Years | 0 (0.0%) | 0 (0.0%) |
| 18 to 34 Years | 3 (0.7%) | 5 (1.6%) |
| 35 to 64 Years | 8 (0.9%) | 14 (2.0%) |
| 65 to 74 Years | 4 (1.8%) | 21 (12.1%) |
| 75 Years and over | 9 (7.4%) | 17 (12.2%) |
Disability Class: Cognitive Difficulty
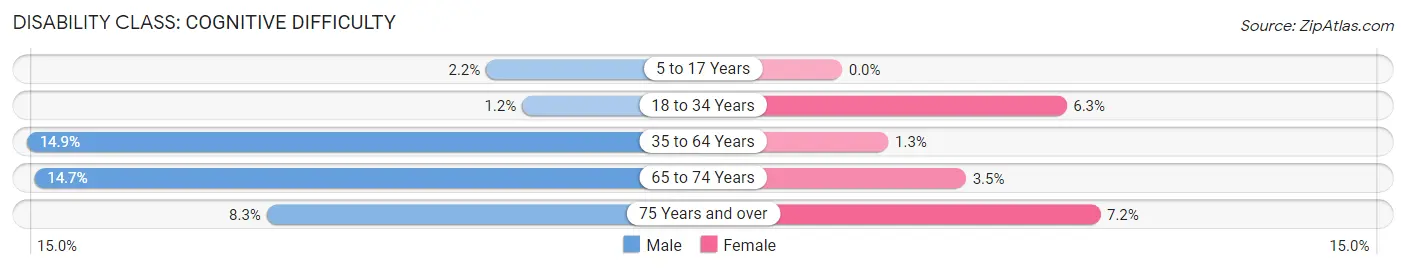
| Age Bracket | Male | Female |
| 5 to 17 Years | 8 (2.1%) | 0 (0.0%) |
| 18 to 34 Years | 5 (1.1%) | 19 (6.2%) |
| 35 to 64 Years | 138 (14.9%) | 9 (1.3%) |
| 65 to 74 Years | 33 (14.7%) | 6 (3.5%) |
| 75 Years and over | 10 (8.3%) | 10 (7.2%) |
Disability Class: Ambulatory Difficulty
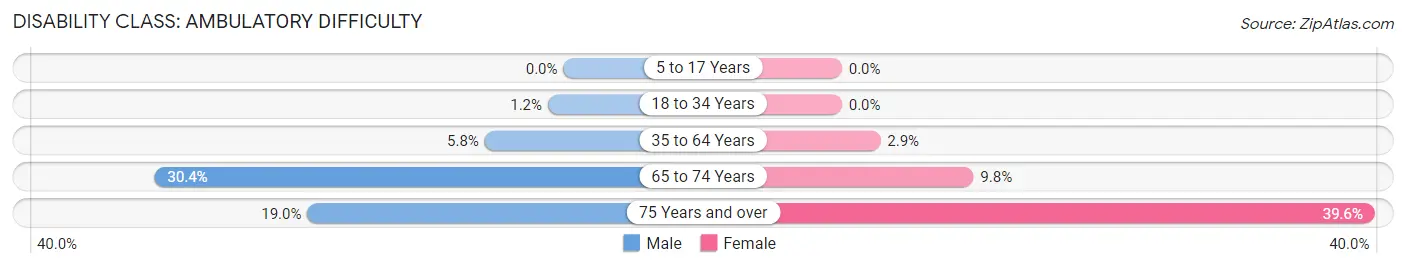
| Age Bracket | Male | Female |
| 5 to 17 Years | 0 (0.0%) | 0 (0.0%) |
| 18 to 34 Years | 5 (1.1%) | 0 (0.0%) |
| 35 to 64 Years | 54 (5.8%) | 20 (2.9%) |
| 65 to 74 Years | 68 (30.4%) | 17 (9.8%) |
| 75 Years and over | 23 (19.0%) | 55 (39.6%) |
Disability Class: Self-Care Difficulty
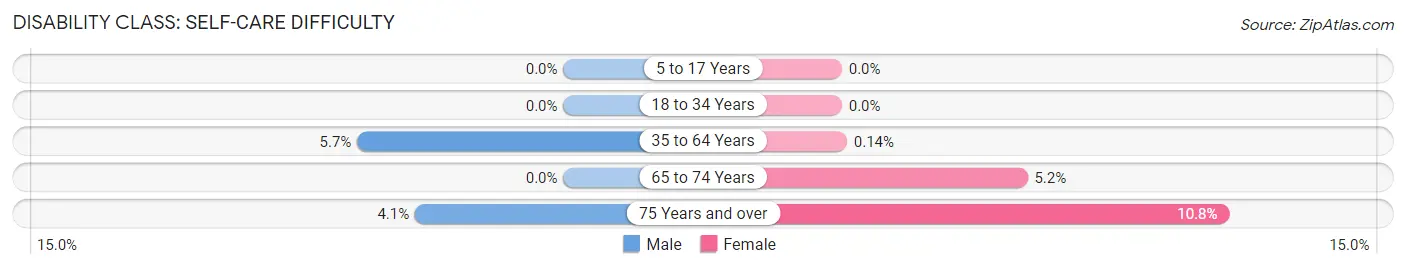
| Age Bracket | Male | Female |
| 5 to 17 Years | 0 (0.0%) | 0 (0.0%) |
| 18 to 34 Years | 0 (0.0%) | 0 (0.0%) |
| 35 to 64 Years | 53 (5.7%) | 1 (0.1%) |
| 65 to 74 Years | 0 (0.0%) | 9 (5.2%) |
| 75 Years and over | 5 (4.1%) | 15 (10.8%) |
Technology Access in Dunn County
Computing Device Access in Dunn County
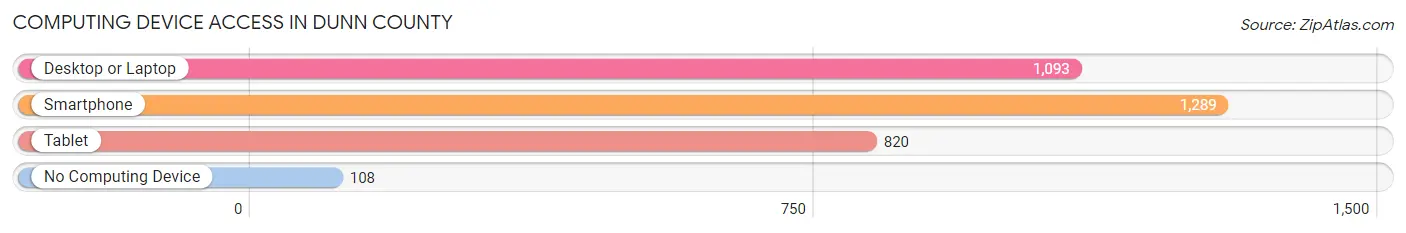
| Device Type | # Households | % Households |
| Desktop or Laptop | 1,093 | 73.2% |
| Smartphone | 1,289 | 86.3% |
| Tablet | 820 | 54.9% |
| No Computing Device | 108 | 7.2% |
| Total | 1,493 | 100.0% |
Internet Access in Dunn County
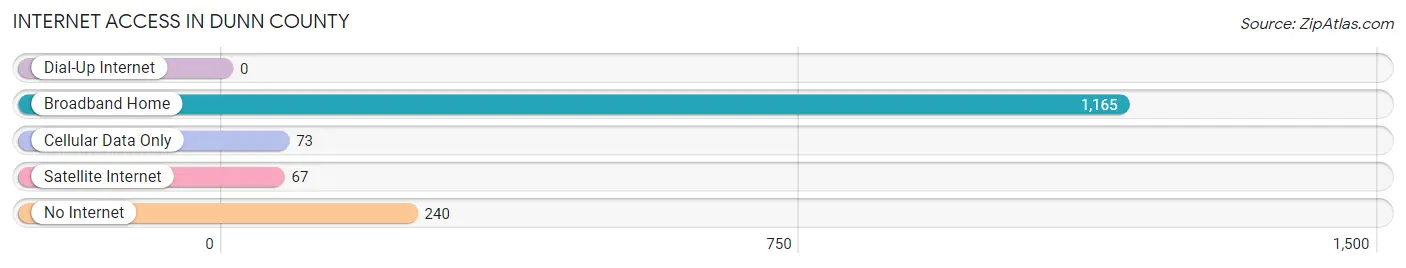
| Internet Type | # Households | % Households |
| Dial-Up Internet | 0 | 0.0% |
| Broadband Home | 1,165 | 78.0% |
| Cellular Data Only | 73 | 4.9% |
| Satellite Internet | 67 | 4.5% |
| No Internet | 240 | 16.1% |
| Total | 1,493 | 100.0% |
Dunn County Summary
Dunn County is located in the western part of North Dakota, and is bordered by McKenzie County to the north, Stark County to the east, Billings County to the south, and Montana to the west. The county seat is Manning, and the largest city is Killdeer. The county was established in 1883 and named after John P. Dunn, a prominent early settler.
Geography
Dunn County covers an area of 1,845 square miles, making it the fourth largest county in North Dakota. The terrain is mostly flat, with rolling hills in the east and south. The Little Missouri River flows through the county, and there are several small lakes and ponds scattered throughout the area. The county is part of the Great Plains region, and is mostly covered in grasslands and prairies.
Demographics
As of the 2010 census, there were 4,039 people living in Dunn County. The population density was 2.2 people per square mile. The racial makeup of the county was 97.3% White, 0.3% Native American, 0.2% Asian, 0.1% Black or African American, 0.1% Pacific Islander, and 1.9% from two or more races. Hispanic or Latino of any race were 1.2% of the population.
The median income for a household in the county was $45,945, and the median income for a family was $51,944. The per capita income for the county was $20,945. About 8.2% of families and 10.2% of the population were below the poverty line, including 12.2% of those under age 18 and 8.2% of those age 65 or over.
Economy
The economy of Dunn County is largely based on agriculture. The county is home to several large farms, and the main crops grown are wheat, barley, oats, and hay. Cattle and sheep are also raised in the area.
Oil and gas production is also an important part of the economy. The county is home to several oil and gas wells, and the industry provides jobs for many local residents.
The county is also home to several small businesses, including restaurants, retail stores, and service providers. Tourism is also an important part of the economy, as the county is home to several popular attractions, including the Killdeer Mountain State Park and the Dunn County Museum.
Conclusion
Dunn County is a rural county located in western North Dakota. The county is home to several large farms, and the main crops grown are wheat, barley, oats, and hay. Oil and gas production is also an important part of the economy, and the county is home to several small businesses and popular tourist attractions. The population of the county is mostly white, and the median income for a household is $45,945.
Common Questions
What is the Total Population of Dunn County?
Total Population of Dunn County is 4,049.
What is the Total Male Population of Dunn County?
Total Male Population of Dunn County is 2,228.
What is the Total Female Population of Dunn County?
Total Female Population of Dunn County is 1,821.
What is the Ratio of Males per 100 Females in Dunn County?
There are 122.35 Males per 100 Females in Dunn County.
What is the Ratio of Females per 100 Males in Dunn County?
There are 81.73 Females per 100 Males in Dunn County.
What is the Median Population Age in Dunn County?
Median Population Age in Dunn County is 42.7 Years.
What is the Average Family Size in Dunn County
Average Family Size in Dunn County is 3.5 People.
What is the Average Household Size in Dunn County
Average Household Size in Dunn County is 2.6 People.
What is Per Capita Income in Dunn County?
Per Capita income in Dunn County is $50,132.
What is the Median Family Income in Dunn County?
Median Family Income in Dunn County is $124,688.
What is the Median Household income in Dunn County?
Median Household Income in Dunn County is $91,758.
What is Income or Wage Gap in Dunn County?
Income or Wage Gap in Dunn County is 38.5%.
Women in Dunn County earn 61.5 cents for every dollar earned by a man.
What is Inequality or Gini Index in Dunn County?
Inequality or Gini Index in Dunn County is 0.45.
How Large is the Labor Force in Dunn County?
There are 1,960 People in the Labor Forcein in Dunn County.
What is the Percentage of People in the Labor Force in Dunn County?
62.0% of People are in the Labor Force in Dunn County.
What is the Unemployment Rate in Dunn County?
Unemployment Rate in Dunn County is 2.4%.