Dickey County, ND
Dickey County Map
Dickey County Overview
5,003
TOTAL POPULATION
2,497
MALE POPULATION
2,506
FEMALE POPULATION
99.64
MALES / 100 FEMALES
100.36
FEMALES / 100 MALES
38.1
MEDIAN AGE
3.2
AVG FAMILY SIZE
2.5
AVG HOUSEHOLD SIZE
$35,649
PER CAPITA INCOME
$88,906
AVG FAMILY INCOME
$60,250
AVG HOUSEHOLD INCOME
45.7%
WAGE / INCOME GAP [ % ]
54.3¢/ $1
WAGE / INCOME GAP [ $ ]
0.47
INEQUALITY / GINI INDEX
2,626
LABOR FORCE [ PEOPLE ]
67.0%
PERCENT IN LABOR FORCE
3.1%
UNEMPLOYMENT RATE
Dickey County Area Codes
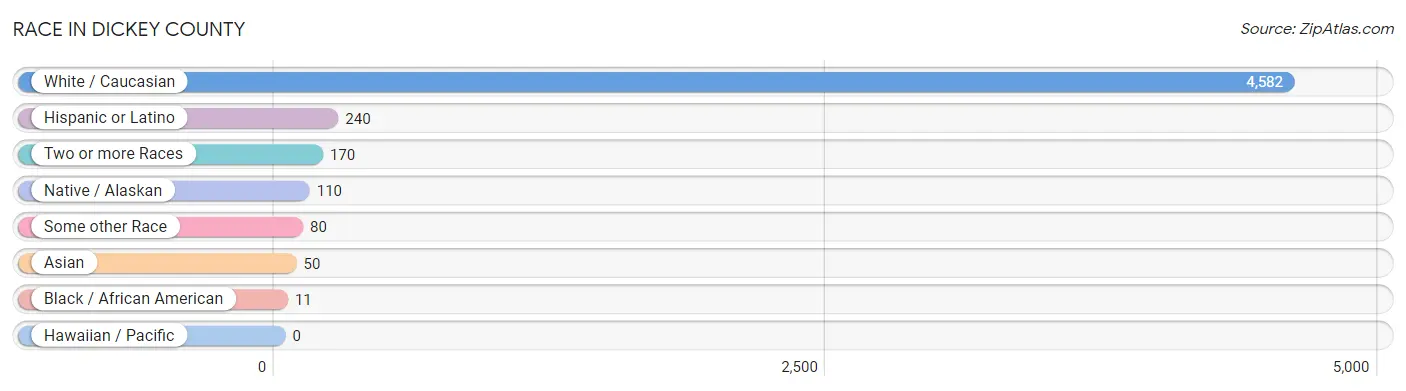
Race in Dickey County
The most populous races in Dickey County are White / Caucasian (4,582 | 91.6%), Hispanic or Latino (240 | 4.8%), and Two or more Races (170 | 3.4%).
| Race | # Population | % Population |
| Asian | 50 | 1.0% |
| Black / African American | 11 | 0.2% |
| Hawaiian / Pacific | 0 | 0.0% |
| Hispanic or Latino | 240 | 4.8% |
| Native / Alaskan | 110 | 2.2% |
| White / Caucasian | 4,582 | 91.6% |
| Two or more Races | 170 | 3.4% |
| Some other Race | 80 | 1.6% |
| Total | 5,003 | 100.0% |
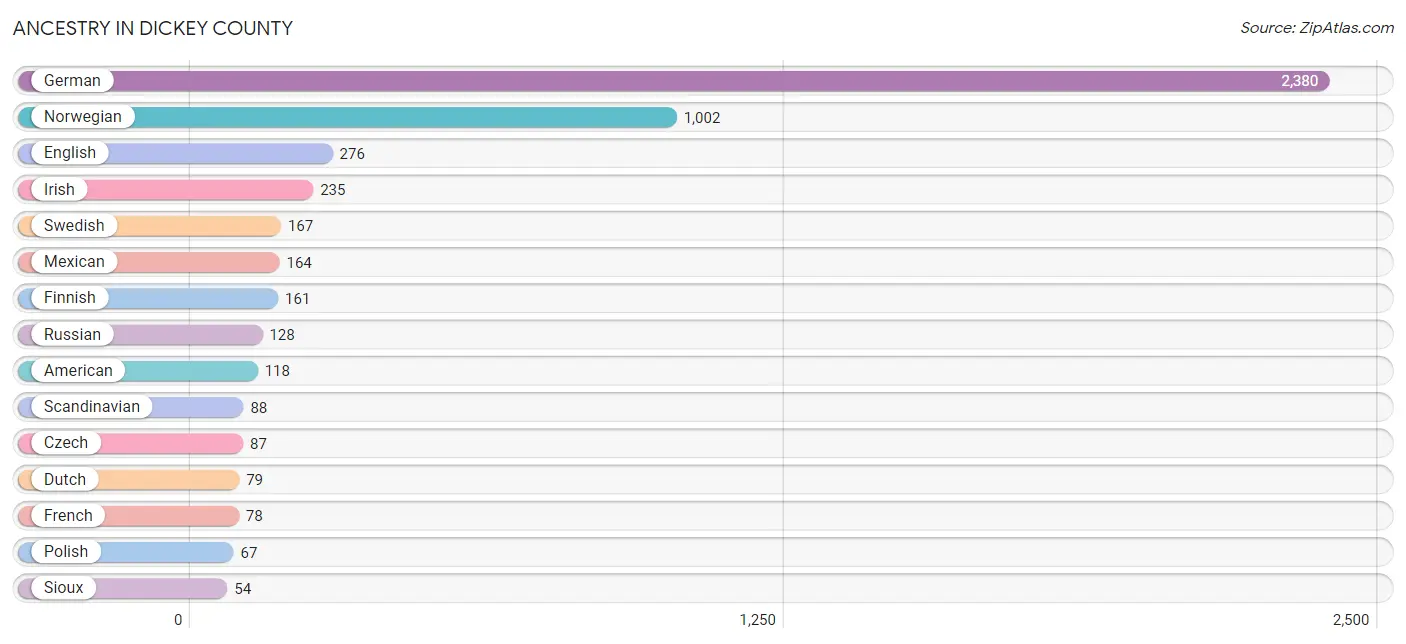
Ancestry in Dickey County
The most populous ancestries reported in Dickey County are German (2,380 | 47.6%), Norwegian (1,002 | 20.0%), English (276 | 5.5%), Irish (235 | 4.7%), and Swedish (167 | 3.3%), together accounting for 81.2% of all Dickey County residents.
| Ancestry | # Population | % Population |
| American | 118 | 2.4% |
| Austrian | 3 | 0.1% |
| British | 7 | 0.1% |
| Canadian | 11 | 0.2% |
| Central American | 11 | 0.2% |
| Creek | 23 | 0.5% |
| Czech | 87 | 1.7% |
| Czechoslovakian | 8 | 0.2% |
| Danish | 53 | 1.1% |
| Dutch | 79 | 1.6% |
| Ecuadorian | 12 | 0.2% |
| English | 276 | 5.5% |
| European | 42 | 0.8% |
| Finnish | 161 | 3.2% |
| French | 78 | 1.6% |
| French Canadian | 23 | 0.5% |
| German | 2,380 | 47.6% |
| German Russian | 16 | 0.3% |
| Greek | 2 | 0.0% |
| Hungarian | 13 | 0.3% |
| Indian (Asian) | 19 | 0.4% |
| Irish | 235 | 4.7% |
| Italian | 18 | 0.4% |
| Korean | 30 | 0.6% |
| Mexican | 164 | 3.3% |
| Nicaraguan | 2 | 0.0% |
| Northern European | 15 | 0.3% |
| Norwegian | 1,002 | 20.0% |
| Polish | 67 | 1.3% |
| Puerto Rican | 3 | 0.1% |
| Romanian | 35 | 0.7% |
| Russian | 128 | 2.6% |
| Salvadoran | 9 | 0.2% |
| Scandinavian | 88 | 1.8% |
| Scotch-Irish | 12 | 0.2% |
| Scottish | 36 | 0.7% |
| Sioux | 54 | 1.1% |
| Slavic | 25 | 0.5% |
| South American | 17 | 0.3% |
| Spaniard | 23 | 0.5% |
| Sri Lankan | 1 | 0.0% |
| Swedish | 167 | 3.3% |
| Swiss | 23 | 0.5% |
| Tlingit-Haida | 35 | 0.7% |
| Ukrainian | 5 | 0.1% |
| Venezuelan | 5 | 0.1% |
| Welsh | 17 | 0.3% |
| Yugoslavian | 3 | 0.1% | View All 48 Rows |
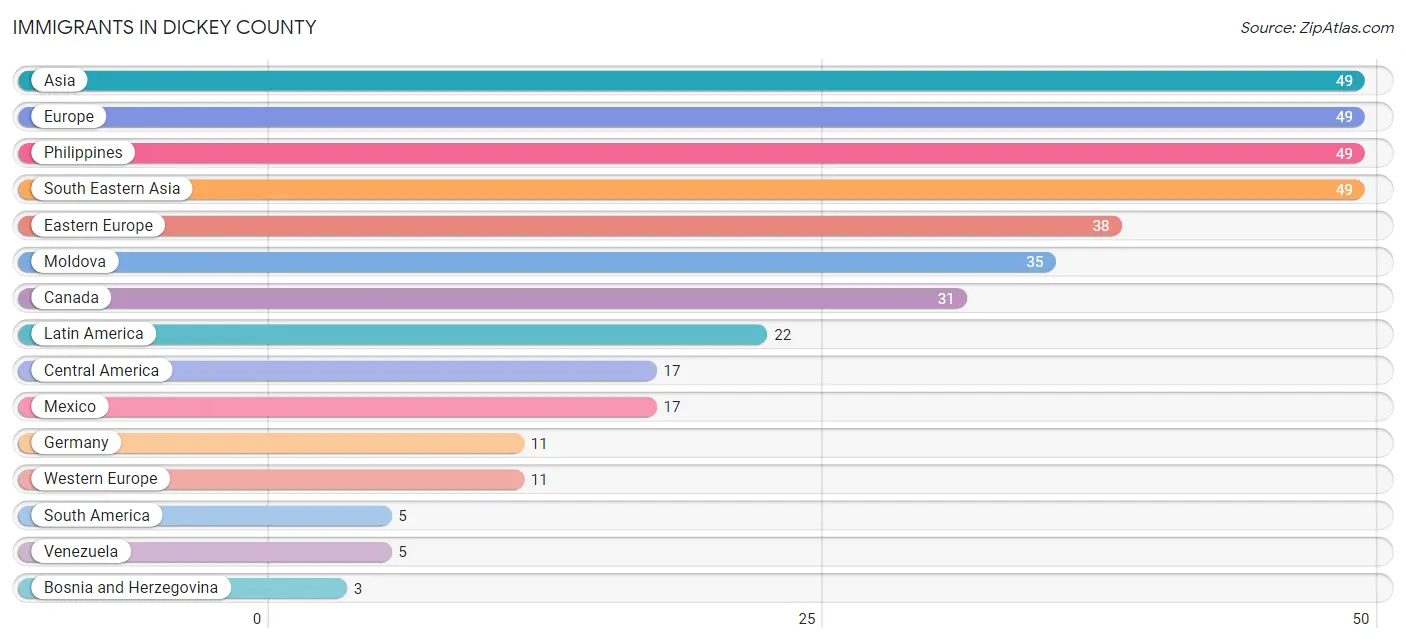
Immigrants in Dickey County
The most numerous immigrant groups reported in Dickey County came from Asia (49 | 1.0%), Europe (49 | 1.0%), Philippines (49 | 1.0%), South Eastern Asia (49 | 1.0%), and Eastern Europe (38 | 0.8%), together accounting for 4.7% of all Dickey County residents.
| Immigration Origin | # Population | % Population |
| Africa | 1 | 0.0% |
| Asia | 49 | 1.0% |
| Bosnia and Herzegovina | 3 | 0.1% |
| Canada | 31 | 0.6% |
| Central America | 17 | 0.3% |
| Eastern Europe | 38 | 0.8% |
| Europe | 49 | 1.0% |
| Germany | 11 | 0.2% |
| Latin America | 22 | 0.4% |
| Mexico | 17 | 0.3% |
| Moldova | 35 | 0.7% |
| Philippines | 49 | 1.0% |
| South Africa | 1 | 0.0% |
| South America | 5 | 0.1% |
| South Eastern Asia | 49 | 1.0% |
| Venezuela | 5 | 0.1% |
| Western Europe | 11 | 0.2% | View All 17 Rows |
Sex and Age in Dickey County
Sex and Age in Dickey County
The most populous age groups in Dickey County are 15 to 19 Years (249 | 10.0%) for men and 15 to 19 Years (276 | 11.0%) for women.

| Age Bracket | Male | Female |
| Under 5 Years | 137 (5.5%) | 167 (6.7%) |
| 5 to 9 Years | 173 (6.9%) | 188 (7.5%) |
| 10 to 14 Years | 182 (7.3%) | 169 (6.7%) |
| 15 to 19 Years | 249 (10.0%) | 276 (11.0%) |
| 20 to 24 Years | 111 (4.4%) | 157 (6.3%) |
| 25 to 29 Years | 130 (5.2%) | 92 (3.7%) |
| 30 to 34 Years | 154 (6.2%) | 130 (5.2%) |
| 35 to 39 Years | 159 (6.4%) | 142 (5.7%) |
| 40 to 44 Years | 129 (5.2%) | 105 (4.2%) |
| 45 to 49 Years | 137 (5.5%) | 113 (4.5%) |
| 50 to 54 Years | 143 (5.7%) | 149 (5.9%) |
| 55 to 59 Years | 214 (8.6%) | 179 (7.1%) |
| 60 to 64 Years | 130 (5.2%) | 134 (5.3%) |
| 65 to 69 Years | 150 (6.0%) | 156 (6.2%) |
| 70 to 74 Years | 110 (4.4%) | 99 (4.0%) |
| 75 to 79 Years | 54 (2.2%) | 79 (3.2%) |
| 80 to 84 Years | 49 (2.0%) | 55 (2.2%) |
| 85 Years and over | 86 (3.4%) | 116 (4.6%) |
| Total | 2,497 (100.0%) | 2,506 (100.0%) |
Families and Households in Dickey County
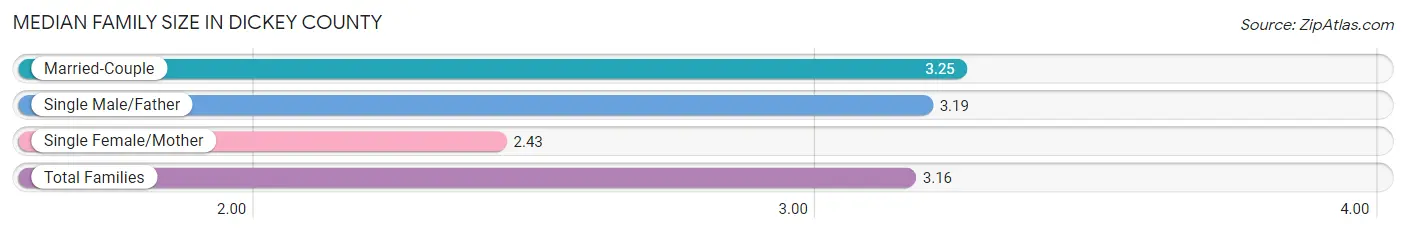
Median Family Size in Dickey County
The median family size in Dickey County is 3.16 persons per family, with married-couple families (1,002 | 83.2%) accounting for the largest median family size of 3.25 persons per family. On the other hand, single female/mother families (124 | 10.3%) represent the smallest median family size with 2.43 persons per family.
| Family Type | # Families | Family Size |
| Married-Couple | 1,002 (83.2%) | 3.25 |
| Single Male/Father | 78 (6.5%) | 3.19 |
| Single Female/Mother | 124 (10.3%) | 2.43 |
| Total Families | 1,204 (100.0%) | 3.16 |
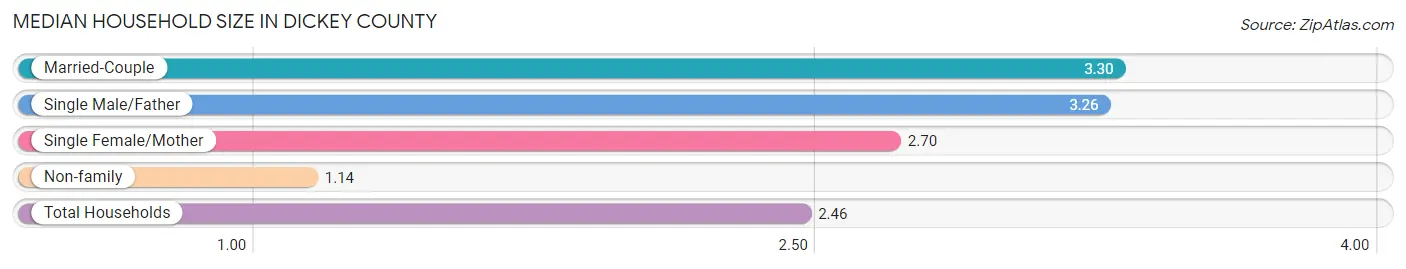
Median Household Size in Dickey County
The median household size in Dickey County is 2.46 persons per household, with married-couple households (1,002 | 52.3%) accounting for the largest median household size of 3.3 persons per household. non-family households (712 | 37.2%) represent the smallest median household size with 1.14 persons per household.
| Household Type | # Households | Household Size |
| Married-Couple | 1,002 (52.3%) | 3.30 |
| Single Male/Father | 78 (4.1%) | 3.26 |
| Single Female/Mother | 124 (6.5%) | 2.70 |
| Non-family | 712 (37.2%) | 1.14 |
| Total Households | 1,916 (100.0%) | 2.46 |
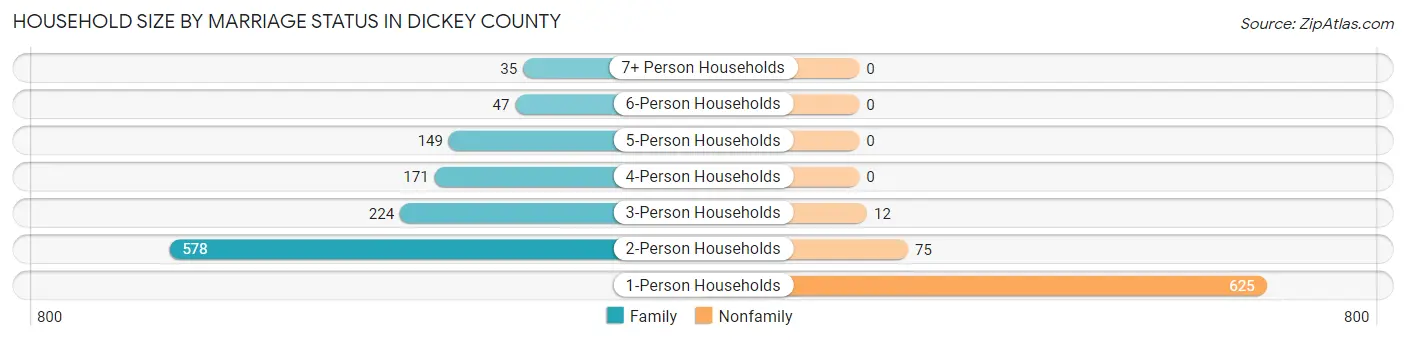
Household Size by Marriage Status in Dickey County
Out of a total of 1,916 households in Dickey County, 1,204 (62.8%) are family households, while 712 (37.2%) are nonfamily households. The most numerous type of family households are 2-person households, comprising 578, and the most common type of nonfamily households are 1-person households, comprising 625.
| Household Size | Family Households | Nonfamily Households |
| 1-Person Households | - | 625 (32.6%) |
| 2-Person Households | 578 (30.2%) | 75 (3.9%) |
| 3-Person Households | 224 (11.7%) | 12 (0.6%) |
| 4-Person Households | 171 (8.9%) | 0 (0.0%) |
| 5-Person Households | 149 (7.8%) | 0 (0.0%) |
| 6-Person Households | 47 (2.5%) | 0 (0.0%) |
| 7+ Person Households | 35 (1.8%) | 0 (0.0%) |
| Total | 1,204 (62.8%) | 712 (37.2%) |
Female Fertility in Dickey County
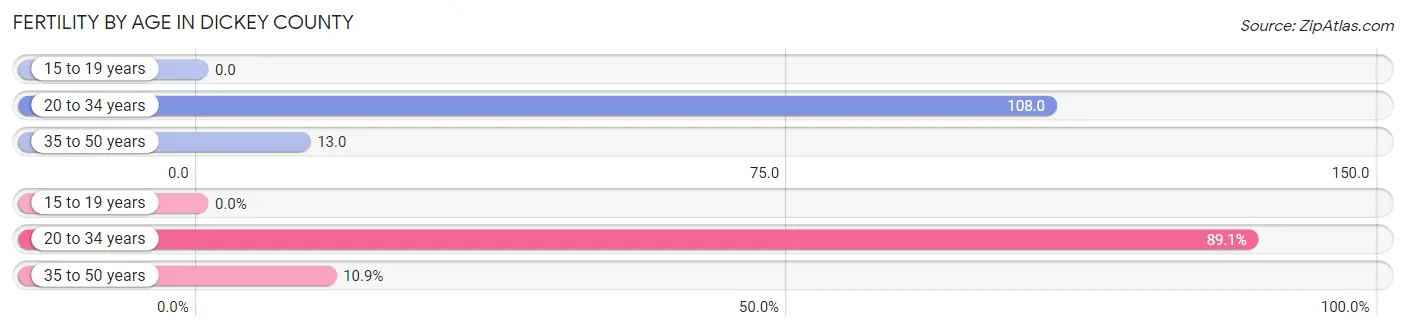
Fertility by Age in Dickey County
Average fertility rate in Dickey County is 45.0 births per 1,000 women. Women in the age bracket of 20 to 34 years have the highest fertility rate with 108.0 births per 1,000 women. Women in the age bracket of 20 to 34 years acount for 89.1% of all women with births.
| Age Bracket | Women with Births | Births / 1,000 Women |
| 15 to 19 years | 0 (0.0%) | 0.0 |
| 20 to 34 years | 41 (89.1%) | 108.0 |
| 35 to 50 years | 5 (10.9%) | 13.0 |
| Total | 46 (100.0%) | 45.0 |
Fertility by Age by Marriage Status in Dickey County
69.6% of women with births (46) in Dickey County are married. The highest percentage of unmarried women with births falls into 20 to 34 years age bracket with 34.2% of them unmarried at the time of birth, while the lowest percentage of unmarried women with births belong to 35 to 50 years age bracket with 0.0% of them unmarried.
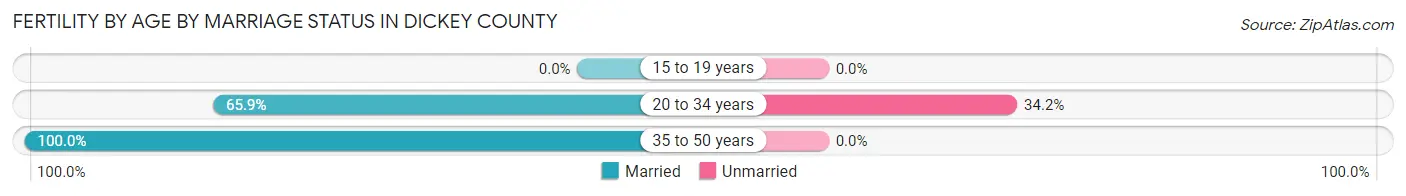
| Age Bracket | Married | Unmarried |
| 15 to 19 years | 0 (0.0%) | 0 (0.0%) |
| 20 to 34 years | 27 (65.8%) | 14 (34.2%) |
| 35 to 50 years | 5 (100.0%) | 0 (0.0%) |
| Total | 32 (69.6%) | 14 (30.4%) |
Fertility by Education in Dickey County
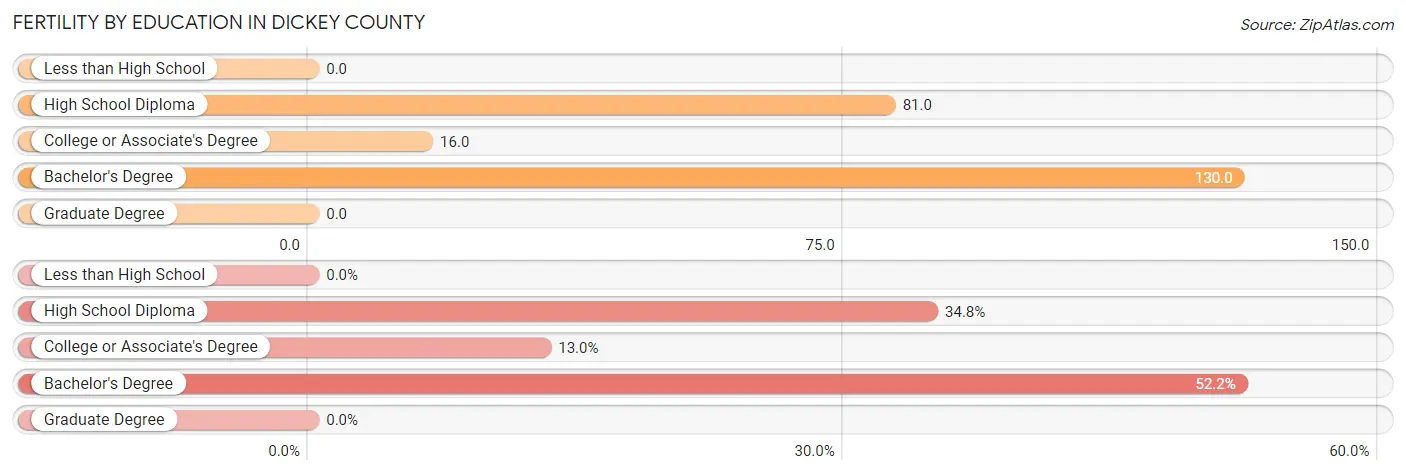
| Educational Attainment | Women with Births | Births / 1,000 Women |
| Less than High School | 0 (0.0%) | 0.0 |
| High School Diploma | 16 (34.8%) | 81.0 |
| College or Associate's Degree | 6 (13.0%) | 16.0 |
| Bachelor's Degree | 24 (52.2%) | 130.0 |
| Graduate Degree | 0 (0.0%) | 0.0 |
| Total | 46 (100.0%) | 45.0 |
Fertility by Education by Marriage Status in Dickey County
30.4% of women with births in Dickey County are unmarried. Women with the educational attainment of college or associate's degree are most likely to be married with 100.0% of them married at childbirth, while women with the educational attainment of high school diploma are least likely to be married with 87.5% of them unmarried at childbirth.
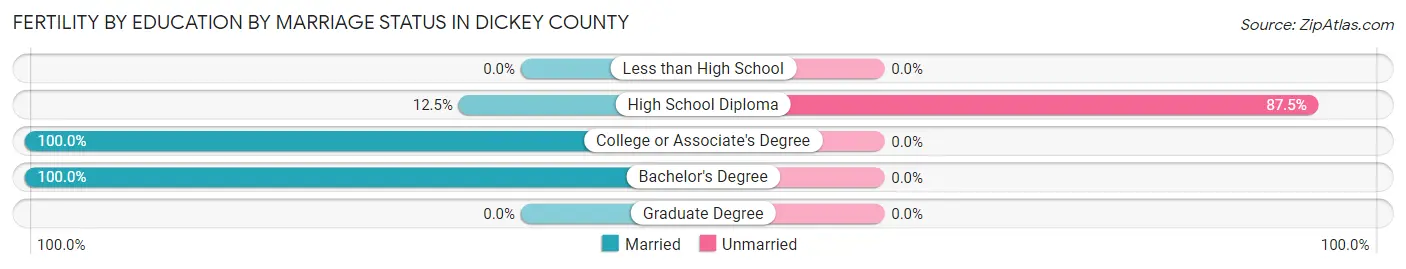
| Educational Attainment | Married | Unmarried |
| Less than High School | 0 (0.0%) | 0 (0.0%) |
| High School Diploma | 2 (12.5%) | 14 (87.5%) |
| College or Associate's Degree | 6 (100.0%) | 0 (0.0%) |
| Bachelor's Degree | 24 (100.0%) | 0 (0.0%) |
| Graduate Degree | 0 (0.0%) | 0 (0.0%) |
| Total | 32 (69.6%) | 14 (30.4%) |
Income in Dickey County
Income Overview in Dickey County
Per Capita Income in Dickey County is $35,649, while median incomes of families and households are $88,906 and $60,250 respectively.
| Characteristic | Number | Measure |
| Per Capita Income | 5,003 | $35,649 |
| Median Family Income | 1,204 | $88,906 |
| Mean Family Income | 1,204 | $114,767 |
| Median Household Income | 1,916 | $60,250 |
| Mean Household Income | 1,916 | $89,244 |
| Income Deficit | 1,204 | $0 |
| Wage / Income Gap (%) | 5,003 | 45.70% |
| Wage / Income Gap ($) | 5,003 | 54.30¢ per $1 |
| Gini / Inequality Index | 5,003 | 0.47 |
Earnings by Sex in Dickey County
Average Earnings in Dickey County are $37,848, $49,100 for men and $26,659 for women, a difference of 45.7%.
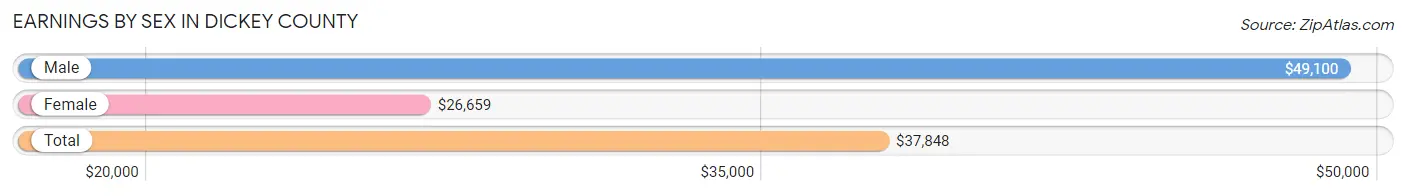
| Sex | Number | Average Earnings |
| Male | 1,436 (50.8%) | $49,100 |
| Female | 1,391 (49.2%) | $26,659 |
| Total | 2,827 (100.0%) | $37,848 |
Earnings by Sex by Income Bracket in Dickey County
The most common earnings brackets in Dickey County are $75,000 to $99,999 for men (234 | 16.3%) and $55,000 to $64,999 for women (149 | 10.7%).
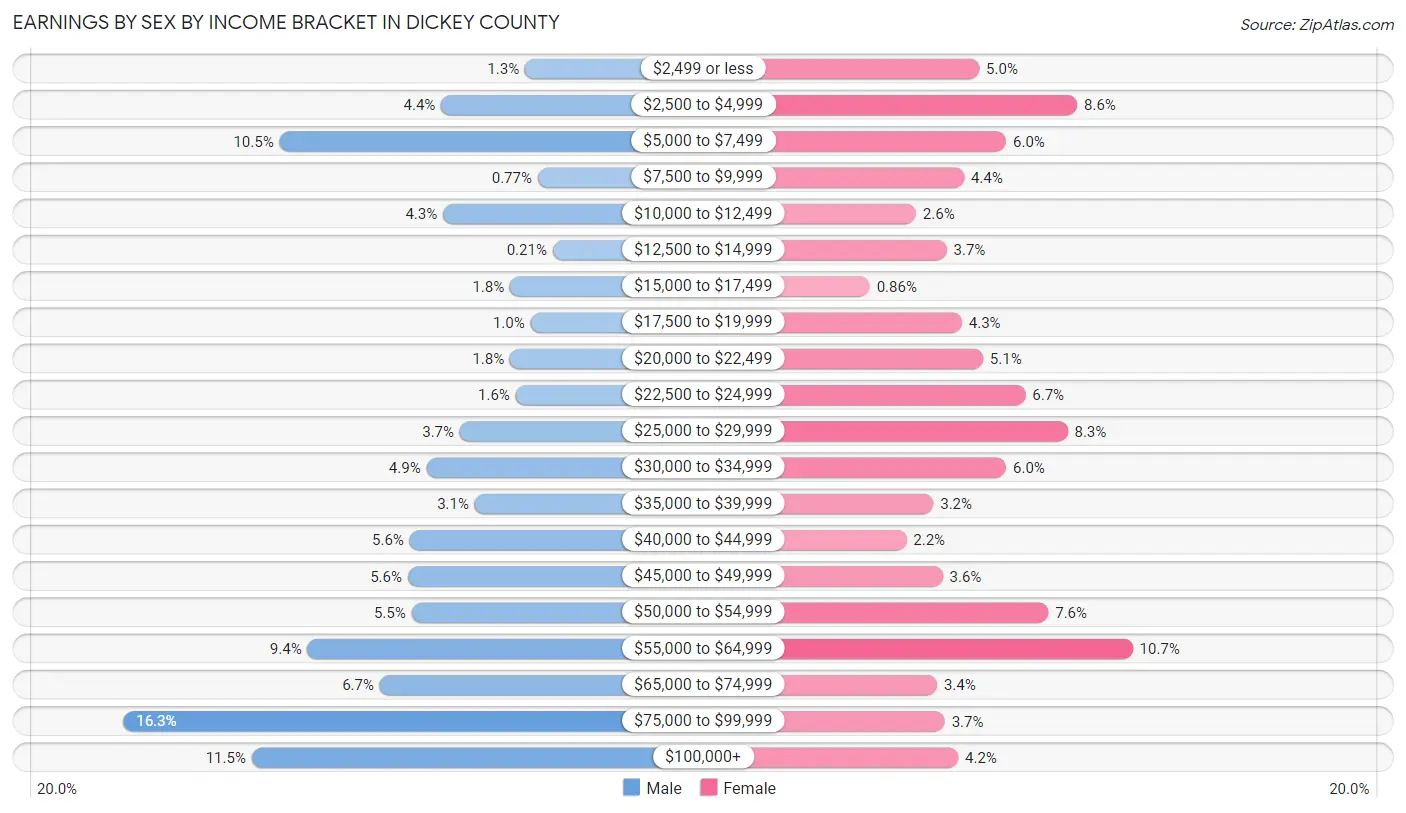
| Income | Male | Female |
| $2,499 or less | 18 (1.3%) | 69 (5.0%) |
| $2,500 to $4,999 | 63 (4.4%) | 120 (8.6%) |
| $5,000 to $7,499 | 150 (10.4%) | 83 (6.0%) |
| $7,500 to $9,999 | 11 (0.8%) | 61 (4.4%) |
| $10,000 to $12,499 | 62 (4.3%) | 36 (2.6%) |
| $12,500 to $14,999 | 3 (0.2%) | 52 (3.7%) |
| $15,000 to $17,499 | 26 (1.8%) | 12 (0.9%) |
| $17,500 to $19,999 | 15 (1.0%) | 60 (4.3%) |
| $20,000 to $22,499 | 26 (1.8%) | 71 (5.1%) |
| $22,500 to $24,999 | 23 (1.6%) | 93 (6.7%) |
| $25,000 to $29,999 | 53 (3.7%) | 115 (8.3%) |
| $30,000 to $34,999 | 71 (4.9%) | 83 (6.0%) |
| $35,000 to $39,999 | 45 (3.1%) | 45 (3.2%) |
| $40,000 to $44,999 | 80 (5.6%) | 31 (2.2%) |
| $45,000 to $49,999 | 81 (5.6%) | 50 (3.6%) |
| $50,000 to $54,999 | 79 (5.5%) | 105 (7.5%) |
| $55,000 to $64,999 | 135 (9.4%) | 149 (10.7%) |
| $65,000 to $74,999 | 96 (6.7%) | 47 (3.4%) |
| $75,000 to $99,999 | 234 (16.3%) | 51 (3.7%) |
| $100,000+ | 165 (11.5%) | 58 (4.2%) |
| Total | 1,436 (100.0%) | 1,391 (100.0%) |
Earnings by Sex by Educational Attainment in Dickey County
Average earnings in Dickey County are $55,625 for men and $32,500 for women, a difference of 41.6%. Men with an educational attainment of bachelor's degree enjoy the highest average annual earnings of $69,375, while those with high school diploma education earn the least with $47,583. Women with an educational attainment of less than high school earn the most with the average annual earnings of $60,375, while those with high school diploma education have the smallest earnings of $23,000.
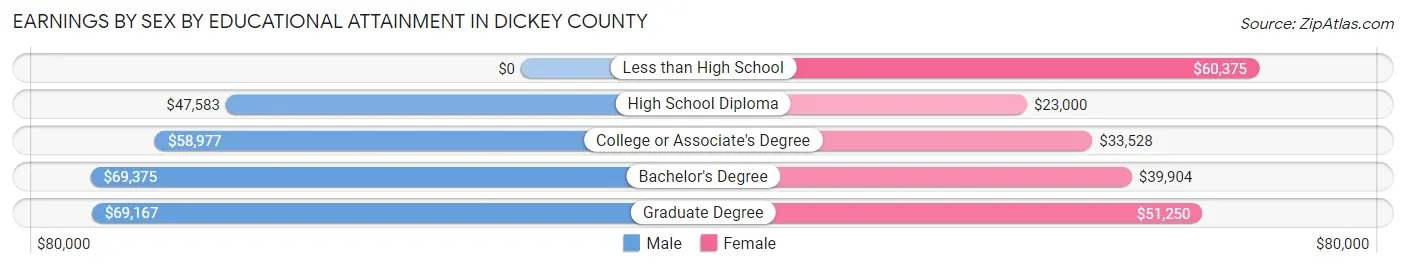
| Educational Attainment | Male Income | Female Income |
| Less than High School | - | - |
| High School Diploma | $47,583 | $23,000 |
| College or Associate's Degree | $58,977 | $33,528 |
| Bachelor's Degree | $69,375 | $39,904 |
| Graduate Degree | $69,167 | $51,250 |
| Total | $55,625 | $32,500 |
Family Income in Dickey County
Family Income Brackets in Dickey County
According to the Dickey County family income data, there are 265 families falling into the $100,000 to $149,999 income range, which is the most common income bracket and makes up 22.0% of all families. Conversely, the less than $10,000 income bracket is the least frequent group with only 6 families (0.5%) belonging to this category.
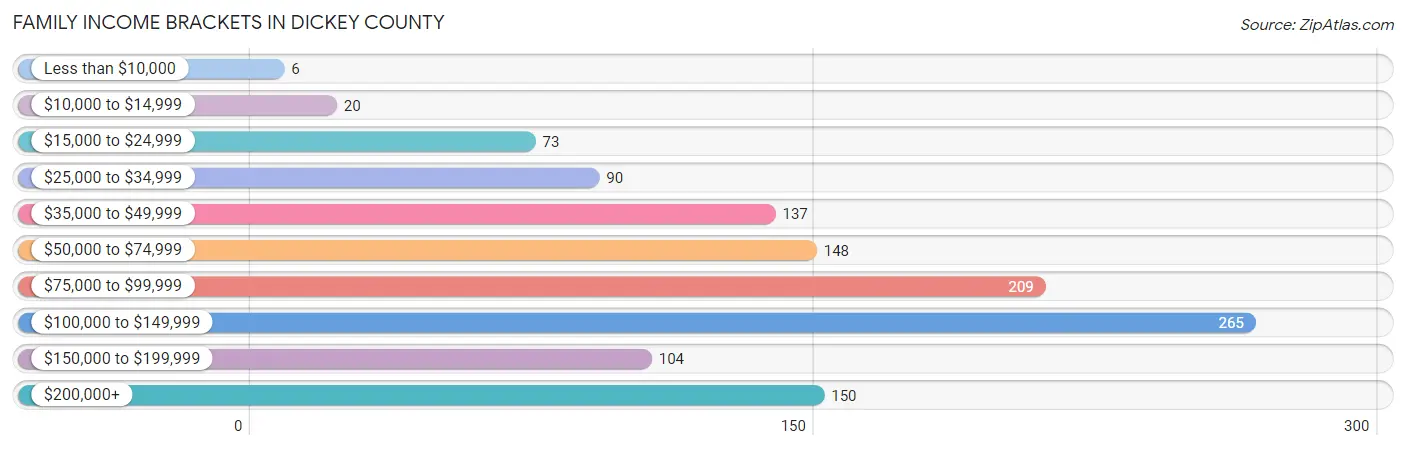
| Income Bracket | # Families | % Families |
| Less than $10,000 | 6 | 0.5% |
| $10,000 to $14,999 | 20 | 1.7% |
| $15,000 to $24,999 | 73 | 6.1% |
| $25,000 to $34,999 | 90 | 7.5% |
| $35,000 to $49,999 | 137 | 11.4% |
| $50,000 to $74,999 | 148 | 12.3% |
| $75,000 to $99,999 | 209 | 17.4% |
| $100,000 to $149,999 | 265 | 22.0% |
| $150,000 to $199,999 | 104 | 8.6% |
| $200,000+ | 150 | 12.5% |
Family Income by Famaliy Size in Dickey County
5-person families (139 | 11.5%) account for the highest median family income in Dickey County with $131,438 per family, while 2-person families (606 | 50.3%) have the highest median income of $37,116 per family member.
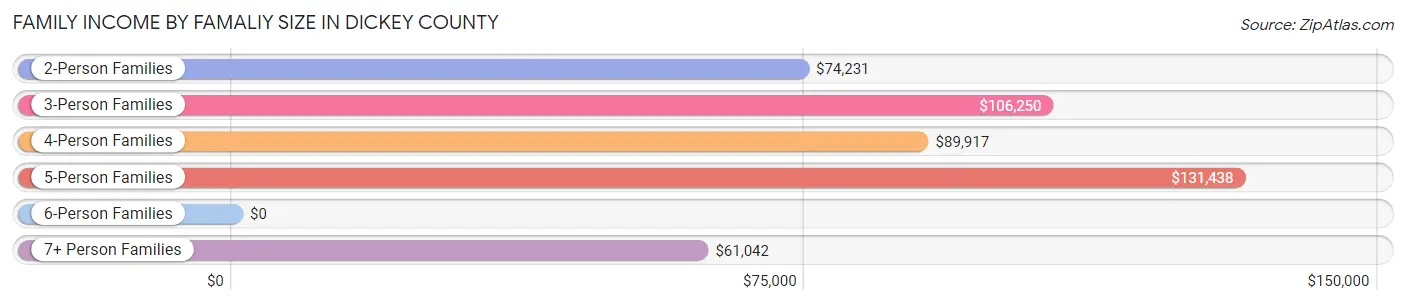
| Income Bracket | # Families | Median Income |
| 2-Person Families | 606 (50.3%) | $74,231 |
| 3-Person Families | 208 (17.3%) | $106,250 |
| 4-Person Families | 179 (14.9%) | $89,917 |
| 5-Person Families | 139 (11.5%) | $131,438 |
| 6-Person Families | 47 (3.9%) | $0 |
| 7+ Person Families | 25 (2.1%) | $61,042 |
| Total | 1,204 (100.0%) | $88,906 |
Family Income by Number of Earners in Dickey County
The median family income in Dickey County is $88,906, with families comprising 3+ earners (100) having the highest median family income of $205,000, while families with no earners (166) have the lowest median family income of $36,447, accounting for 8.3% and 13.8% of families, respectively.
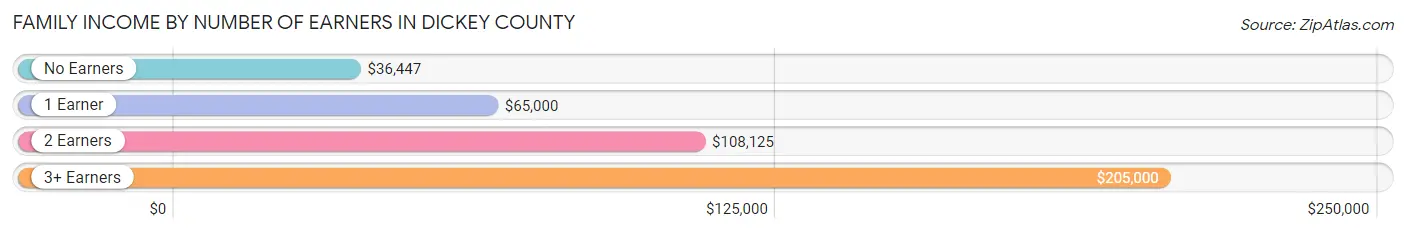
| Number of Earners | # Families | Median Income |
| No Earners | 166 (13.8%) | $36,447 |
| 1 Earner | 310 (25.8%) | $65,000 |
| 2 Earners | 628 (52.2%) | $108,125 |
| 3+ Earners | 100 (8.3%) | $205,000 |
| Total | 1,204 (100.0%) | $88,906 |
Household Income in Dickey County
Household Income Brackets in Dickey County
With 312 households falling in the category, the $50,000 to $74,999 income range is the most frequent in Dickey County, accounting for 16.3% of all households. In contrast, only 65 households (3.4%) fall into the less than $10,000 income bracket, making it the least populous group.
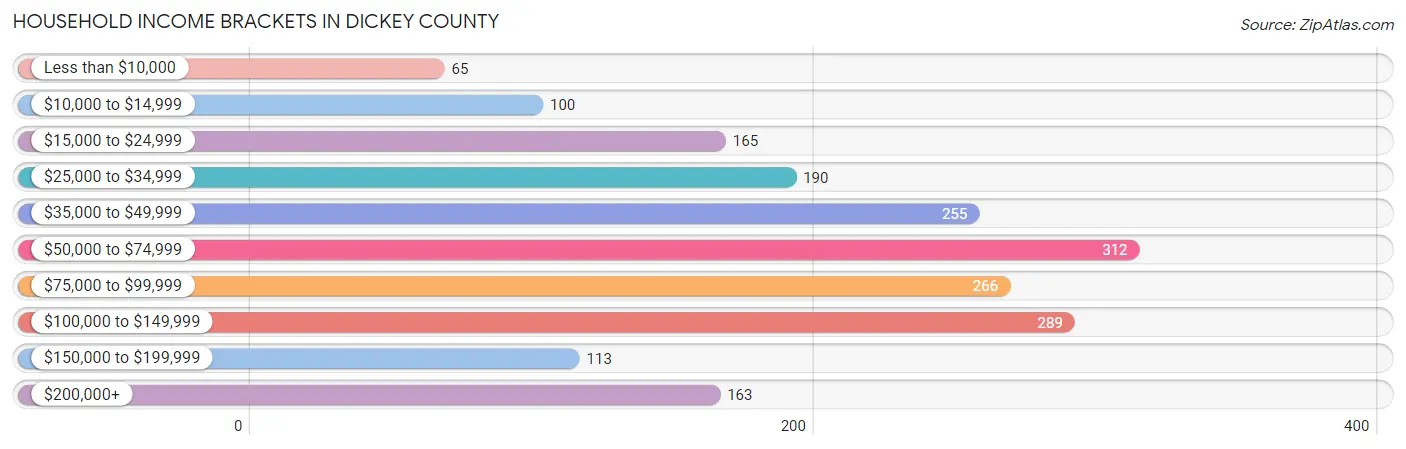
| Income Bracket | # Households | % Households |
| Less than $10,000 | 65 | 3.4% |
| $10,000 to $14,999 | 100 | 5.2% |
| $15,000 to $24,999 | 165 | 8.6% |
| $25,000 to $34,999 | 190 | 9.9% |
| $35,000 to $49,999 | 255 | 13.3% |
| $50,000 to $74,999 | 312 | 16.3% |
| $75,000 to $99,999 | 266 | 13.9% |
| $100,000 to $149,999 | 289 | 15.1% |
| $150,000 to $199,999 | 113 | 5.9% |
| $200,000+ | 163 | 8.5% |
Household Income by Householder Age in Dickey County
The median household income in Dickey County is $60,250, with the highest median household income of $83,068 found in the 45 to 64 years age bracket for the primary householder. A total of 601 households (31.4%) fall into this category. Meanwhile, the 65+ years age bracket for the primary householder has the lowest median household income of $37,357, with 546 households (28.5%) in this group.
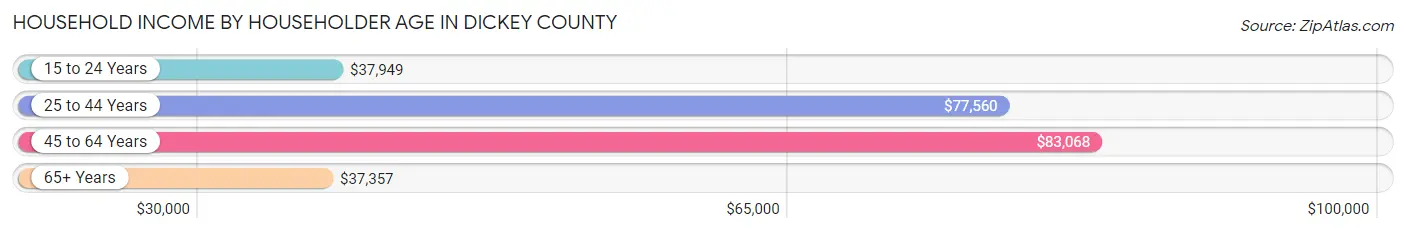
| Income Bracket | # Households | Median Income |
| 15 to 24 Years | 118 (6.2%) | $37,949 |
| 25 to 44 Years | 651 (34.0%) | $77,560 |
| 45 to 64 Years | 601 (31.4%) | $83,068 |
| 65+ Years | 546 (28.5%) | $37,357 |
| Total | 1,916 (100.0%) | $60,250 |
Poverty in Dickey County
Income Below Poverty by Sex and Age in Dickey County
With 8.2% poverty level for males and 10.2% for females among the residents of Dickey County, 16 and 17 year old males and 16 and 17 year old females are the most vulnerable to poverty, with 15 males (22.4%) and 32 females (31.4%) in their respective age groups living below the poverty level.
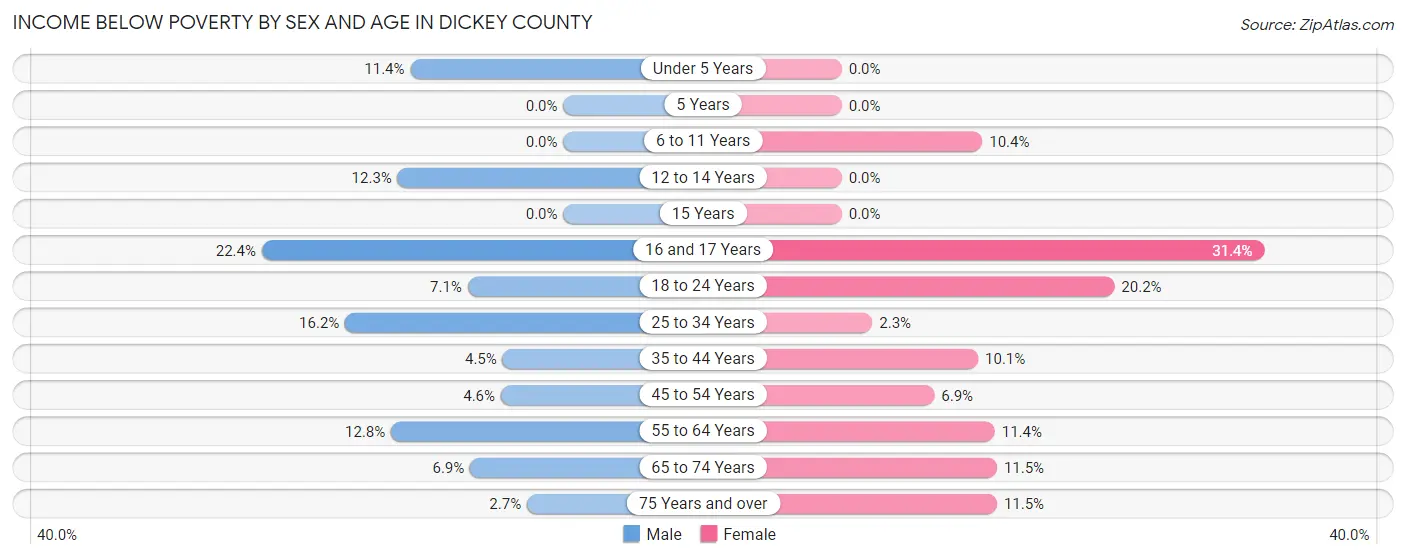
| Age Bracket | Male | Female |
| Under 5 Years | 15 (11.4%) | 0 (0.0%) |
| 5 Years | 0 (0.0%) | 0 (0.0%) |
| 6 to 11 Years | 0 (0.0%) | 22 (10.4%) |
| 12 to 14 Years | 15 (12.3%) | 0 (0.0%) |
| 15 Years | 0 (0.0%) | 0 (0.0%) |
| 16 and 17 Years | 15 (22.4%) | 32 (31.4%) |
| 18 to 24 Years | 12 (7.1%) | 51 (20.2%) |
| 25 to 34 Years | 46 (16.2%) | 5 (2.3%) |
| 35 to 44 Years | 13 (4.5%) | 25 (10.1%) |
| 45 to 54 Years | 13 (4.6%) | 18 (6.9%) |
| 55 to 64 Years | 44 (12.8%) | 35 (11.4%) |
| 65 to 74 Years | 18 (6.9%) | 28 (11.5%) |
| 75 Years and over | 4 (2.7%) | 22 (11.5%) |
| Total | 195 (8.2%) | 238 (10.2%) |
Income Above Poverty by Sex and Age in Dickey County
According to the poverty statistics in Dickey County, males aged 5 years and females aged under 5 years are the age groups that are most secure financially, with 100.0% of males and 100.0% of females in these age groups living above the poverty line.
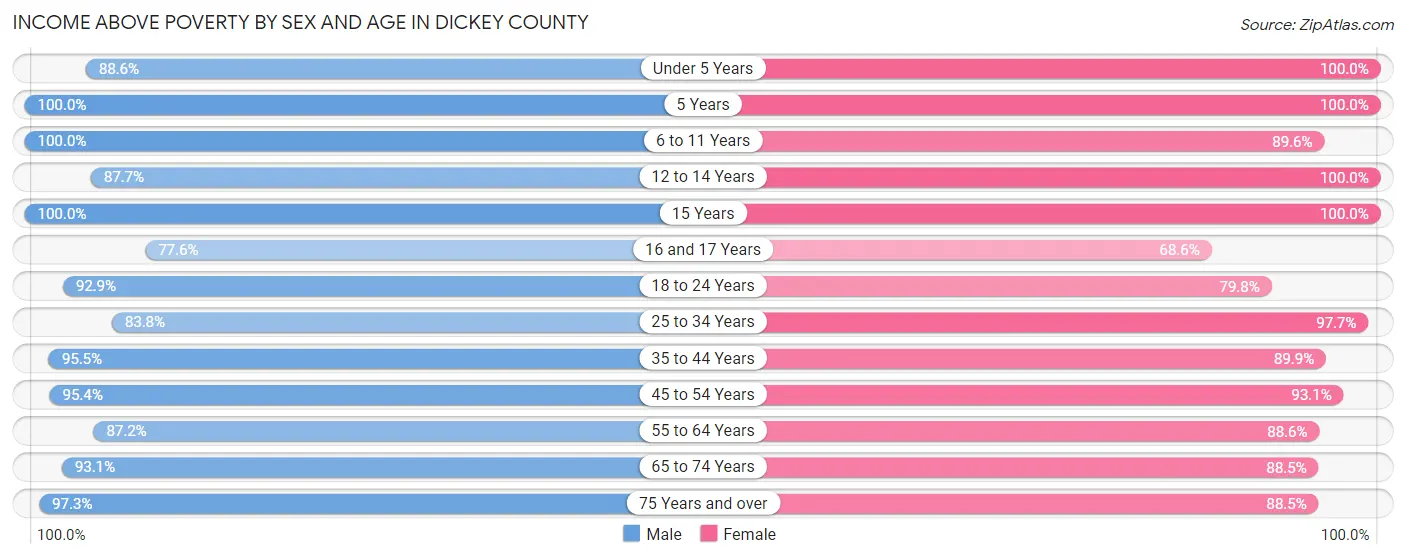
| Age Bracket | Male | Female |
| Under 5 Years | 117 (88.6%) | 143 (100.0%) |
| 5 Years | 25 (100.0%) | 12 (100.0%) |
| 6 to 11 Years | 208 (100.0%) | 189 (89.6%) |
| 12 to 14 Years | 107 (87.7%) | 129 (100.0%) |
| 15 Years | 44 (100.0%) | 24 (100.0%) |
| 16 and 17 Years | 52 (77.6%) | 70 (68.6%) |
| 18 to 24 Years | 157 (92.9%) | 201 (79.8%) |
| 25 to 34 Years | 238 (83.8%) | 215 (97.7%) |
| 35 to 44 Years | 275 (95.5%) | 222 (89.9%) |
| 45 to 54 Years | 267 (95.4%) | 244 (93.1%) |
| 55 to 64 Years | 300 (87.2%) | 273 (88.6%) |
| 65 to 74 Years | 242 (93.1%) | 215 (88.5%) |
| 75 Years and over | 144 (97.3%) | 169 (88.5%) |
| Total | 2,176 (91.8%) | 2,106 (89.8%) |
Income Below Poverty Among Married-Couple Families in Dickey County
The poverty statistics for married-couple families in Dickey County show that 3.8% or 38 of the total 1,002 families live below the poverty line. Families with 3 or 4 children have the highest poverty rate of 7.8%, comprising of 12 families. On the other hand, families with 5 or more children have the lowest poverty rate of 0.0%, which includes 0 families.
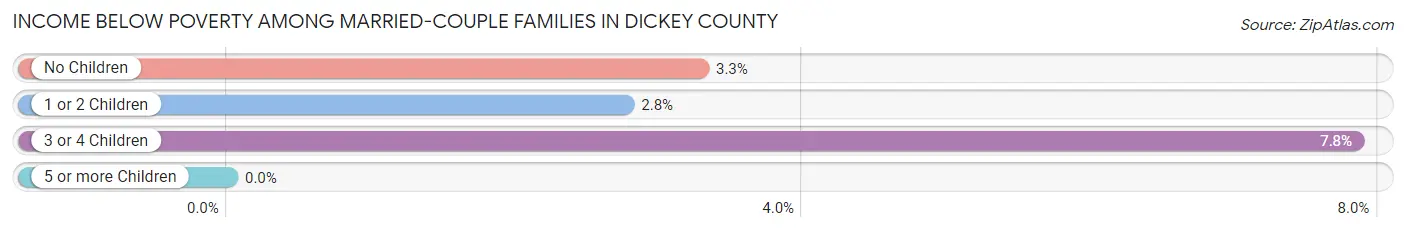
| Children | Above Poverty | Below Poverty |
| No Children | 560 (96.7%) | 19 (3.3%) |
| 1 or 2 Children | 247 (97.2%) | 7 (2.8%) |
| 3 or 4 Children | 141 (92.2%) | 12 (7.8%) |
| 5 or more Children | 16 (100.0%) | 0 (0.0%) |
| Total | 964 (96.2%) | 38 (3.8%) |
Income Below Poverty Among Single-Parent Households in Dickey County
According to the poverty data in Dickey County, 16.7% or 13 single-father households and 17.7% or 22 single-mother households are living below the poverty line. Among single-father households, those with 1 or 2 children have the highest poverty rate, with 10 households (37.0%) experiencing poverty. Likewise, among single-mother households, those with 1 or 2 children have the highest poverty rate, with 22 households (24.7%) falling below the poverty line.
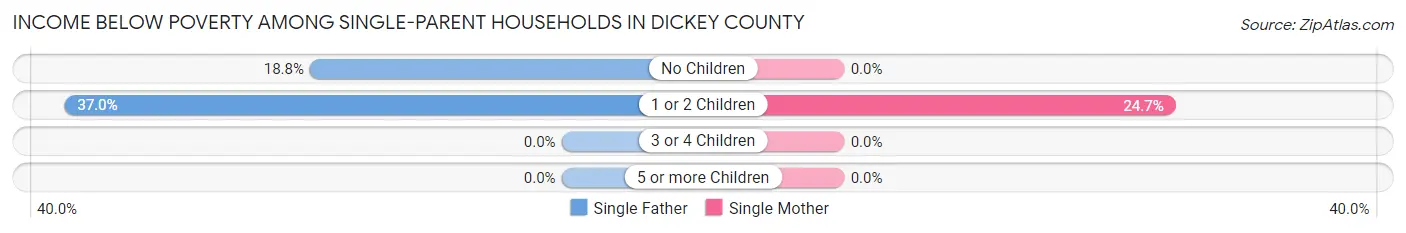
| Children | Single Father | Single Mother |
| No Children | 3 (18.8%) | 0 (0.0%) |
| 1 or 2 Children | 10 (37.0%) | 22 (24.7%) |
| 3 or 4 Children | 0 (0.0%) | 0 (0.0%) |
| 5 or more Children | 0 (0.0%) | 0 (0.0%) |
| Total | 13 (16.7%) | 22 (17.7%) |
Income Below Poverty Among Married-Couple vs Single-Parent Households in Dickey County
The poverty data for Dickey County shows that 38 of the married-couple family households (3.8%) and 35 of the single-parent households (17.3%) are living below the poverty level. Within the married-couple family households, those with 3 or 4 children have the highest poverty rate, with 12 households (7.8%) falling below the poverty line. Among the single-parent households, those with 1 or 2 children have the highest poverty rate, with 32 household (27.6%) living below poverty.
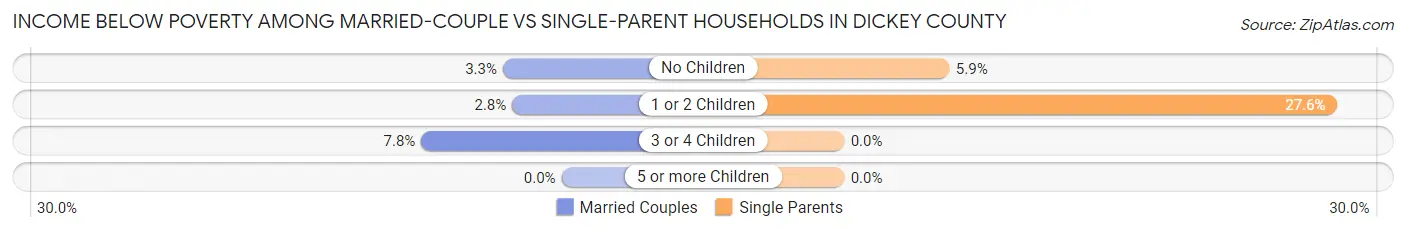
| Children | Married-Couple Families | Single-Parent Households |
| No Children | 19 (3.3%) | 3 (5.9%) |
| 1 or 2 Children | 7 (2.8%) | 32 (27.6%) |
| 3 or 4 Children | 12 (7.8%) | 0 (0.0%) |
| 5 or more Children | 0 (0.0%) | 0 (0.0%) |
| Total | 38 (3.8%) | 35 (17.3%) |
Employment Characteristics in Dickey County
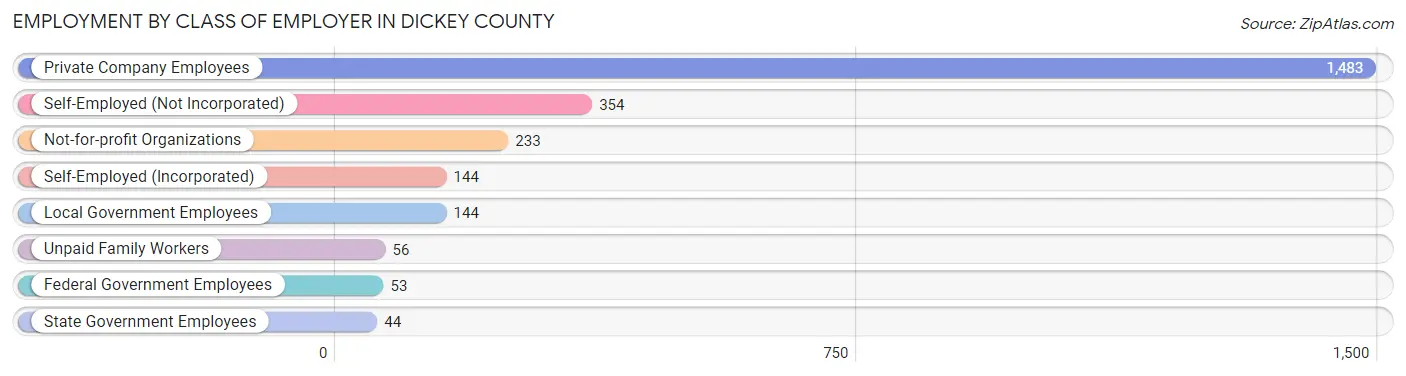
Employment by Class of Employer in Dickey County
Among the 2,511 employed individuals in Dickey County, private company employees (1,483 | 59.1%), self-employed (not incorporated) (354 | 14.1%), and not-for-profit organizations (233 | 9.3%) make up the most common classes of employment.
| Employer Class | # Employees | % Employees |
| Private Company Employees | 1,483 | 59.1% |
| Self-Employed (Incorporated) | 144 | 5.7% |
| Self-Employed (Not Incorporated) | 354 | 14.1% |
| Not-for-profit Organizations | 233 | 9.3% |
| Local Government Employees | 144 | 5.7% |
| State Government Employees | 44 | 1.8% |
| Federal Government Employees | 53 | 2.1% |
| Unpaid Family Workers | 56 | 2.2% |
| Total | 2,511 | 100.0% |
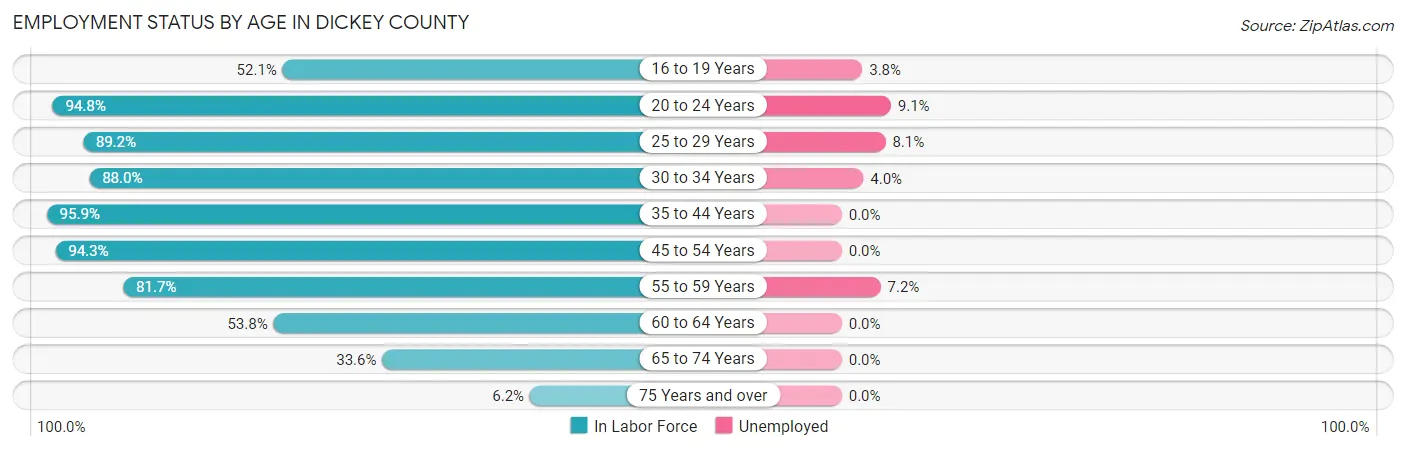
Employment Status by Age in Dickey County
According to the labor force statistics for Dickey County, out of the total population over 16 years of age (3,919), 67.0% or 2,626 individuals are in the labor force, with 3.1% or 81 of them unemployed. The age group with the highest labor force participation rate is 35 to 44 years, with 95.9% or 513 individuals in the labor force. Within the labor force, the 20 to 24 years age range has the highest percentage of unemployed individuals, with 9.1% or 23 of them being unemployed.
| Age Bracket | In Labor Force | Unemployed |
| 16 to 19 Years | 238 (52.1%) | 9 (3.8%) |
| 20 to 24 Years | 254 (94.8%) | 23 (9.1%) |
| 25 to 29 Years | 198 (89.2%) | 16 (8.1%) |
| 30 to 34 Years | 250 (88.0%) | 10 (4.0%) |
| 35 to 44 Years | 513 (95.9%) | 0 (0.0%) |
| 45 to 54 Years | 511 (94.3%) | 0 (0.0%) |
| 55 to 59 Years | 321 (81.7%) | 23 (7.2%) |
| 60 to 64 Years | 142 (53.8%) | 0 (0.0%) |
| 65 to 74 Years | 173 (33.6%) | 0 (0.0%) |
| 75 Years and over | 27 (6.2%) | 0 (0.0%) |
| Total | 2,626 (67.0%) | 81 (3.1%) |
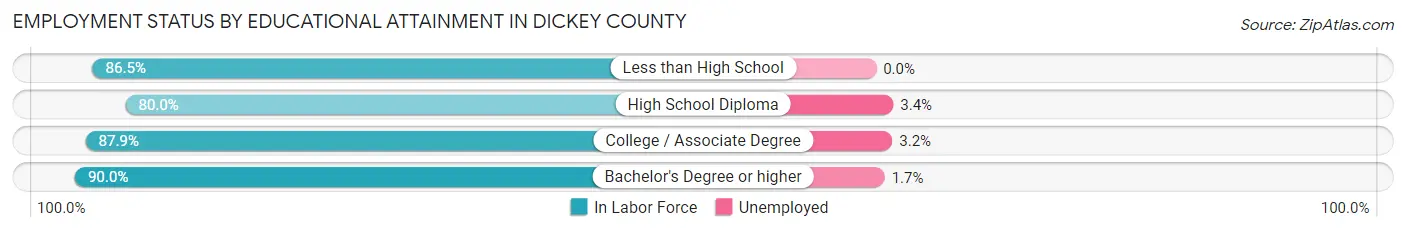
Employment Status by Educational Attainment in Dickey County
According to labor force statistics for Dickey County, 86.4% of individuals (1,935) out of the total population between 25 and 64 years of age (2,240) are in the labor force, with 2.6% or 50 of them being unemployed. The group with the highest labor force participation rate are those with the educational attainment of bachelor's degree or higher, with 90.0% or 603 individuals in the labor force. Within the labor force, individuals with high school diploma education have the highest percentage of unemployment, with 3.4% or 16 of them being unemployed.
| Educational Attainment | In Labor Force | Unemployed |
| Less than High School | 122 (86.5%) | 0 (0.0%) |
| High School Diploma | 465 (80.0%) | 20 (3.4%) |
| College / Associate Degree | 745 (87.9%) | 27 (3.2%) |
| Bachelor's Degree or higher | 603 (90.0%) | 11 (1.7%) |
| Total | 1,935 (86.4%) | 58 (2.6%) |
Employment Occupations by Sex in Dickey County
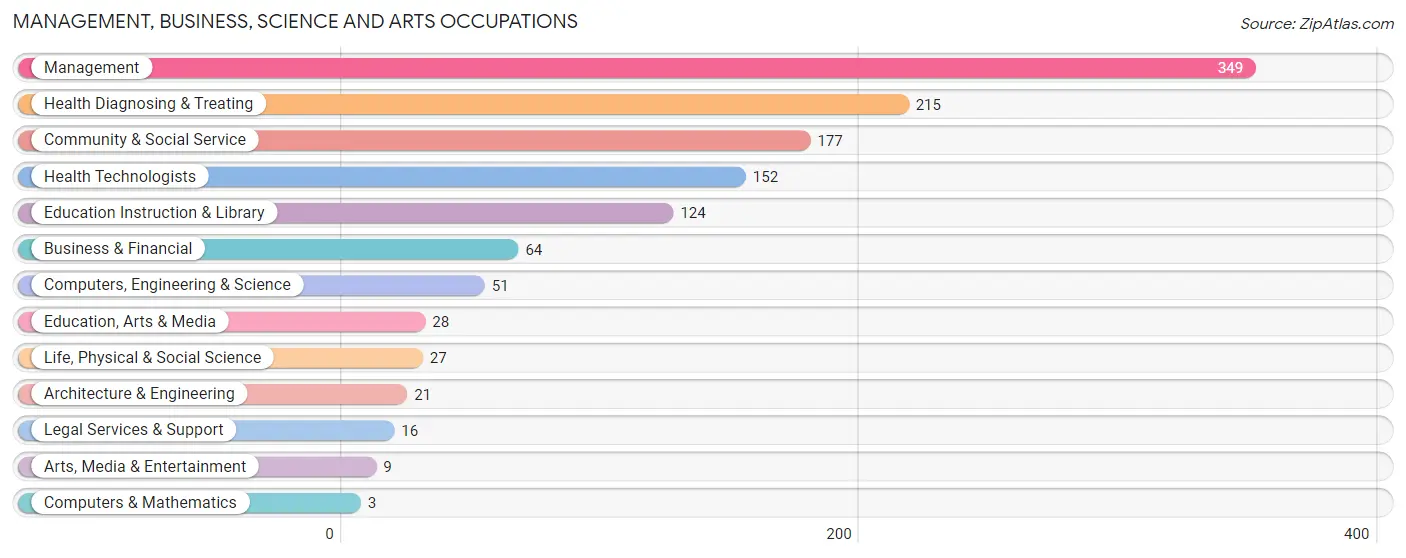
Management, Business, Science and Arts Occupations
The most common Management, Business, Science and Arts occupations in Dickey County are Management (349 | 13.9%), Health Diagnosing & Treating (215 | 8.5%), Community & Social Service (177 | 7.0%), Health Technologists (152 | 6.0%), and Education Instruction & Library (124 | 4.9%).
Management, Business, Science and Arts Occupations by Sex
Within the Management, Business, Science and Arts occupations in Dickey County, the most male-oriented occupations are Computers & Mathematics (100.0%), Architecture & Engineering (100.0%), and Arts, Media & Entertainment (100.0%), while the most female-oriented occupations are Health Technologists (99.3%), Health Diagnosing & Treating (97.2%), and Education Instruction & Library (77.4%).
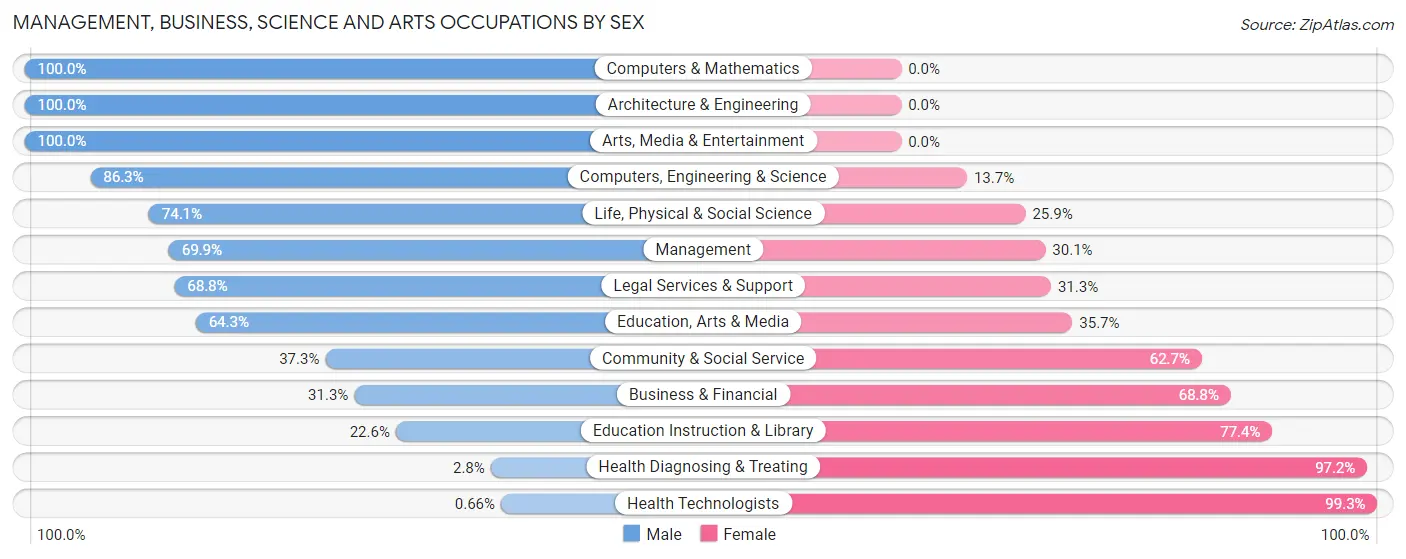
| Occupation | Male | Female |
| Management | 244 (69.9%) | 105 (30.1%) |
| Business & Financial | 20 (31.2%) | 44 (68.8%) |
| Computers, Engineering & Science | 44 (86.3%) | 7 (13.7%) |
| Computers & Mathematics | 3 (100.0%) | 0 (0.0%) |
| Architecture & Engineering | 21 (100.0%) | 0 (0.0%) |
| Life, Physical & Social Science | 20 (74.1%) | 7 (25.9%) |
| Community & Social Service | 66 (37.3%) | 111 (62.7%) |
| Education, Arts & Media | 18 (64.3%) | 10 (35.7%) |
| Legal Services & Support | 11 (68.8%) | 5 (31.2%) |
| Education Instruction & Library | 28 (22.6%) | 96 (77.4%) |
| Arts, Media & Entertainment | 9 (100.0%) | 0 (0.0%) |
| Health Diagnosing & Treating | 6 (2.8%) | 209 (97.2%) |
| Health Technologists | 1 (0.7%) | 151 (99.3%) |
| Total (Category) | 380 (44.4%) | 476 (55.6%) |
| Total (Overall) | 1,240 (49.2%) | 1,280 (50.8%) |
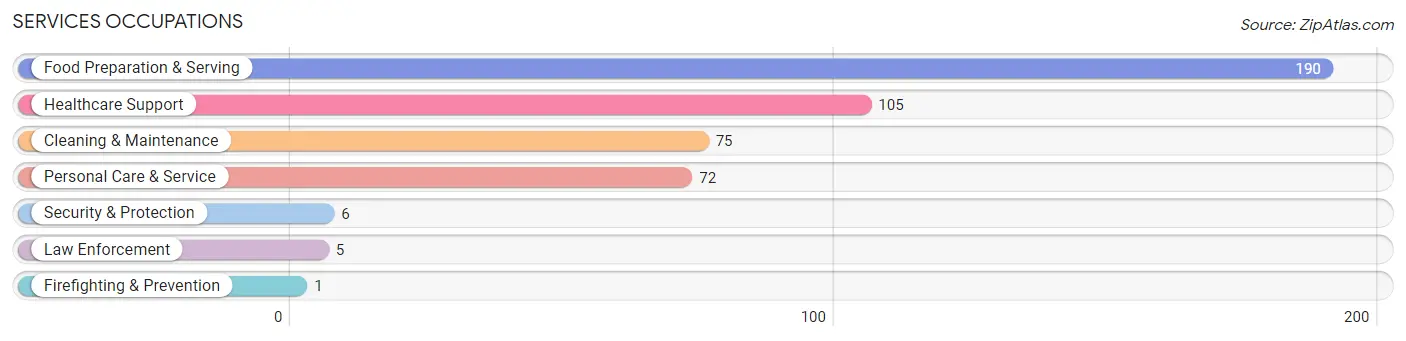
Services Occupations
The most common Services occupations in Dickey County are Food Preparation & Serving (190 | 7.5%), Healthcare Support (105 | 4.2%), Cleaning & Maintenance (75 | 3.0%), Personal Care & Service (72 | 2.9%), and Security & Protection (6 | 0.2%).
Services Occupations by Sex
Within the Services occupations in Dickey County, the most male-oriented occupations are Law Enforcement (100.0%), Security & Protection (83.3%), and Personal Care & Service (25.0%), while the most female-oriented occupations are Firefighting & Prevention (100.0%), Healthcare Support (89.5%), and Cleaning & Maintenance (86.7%).
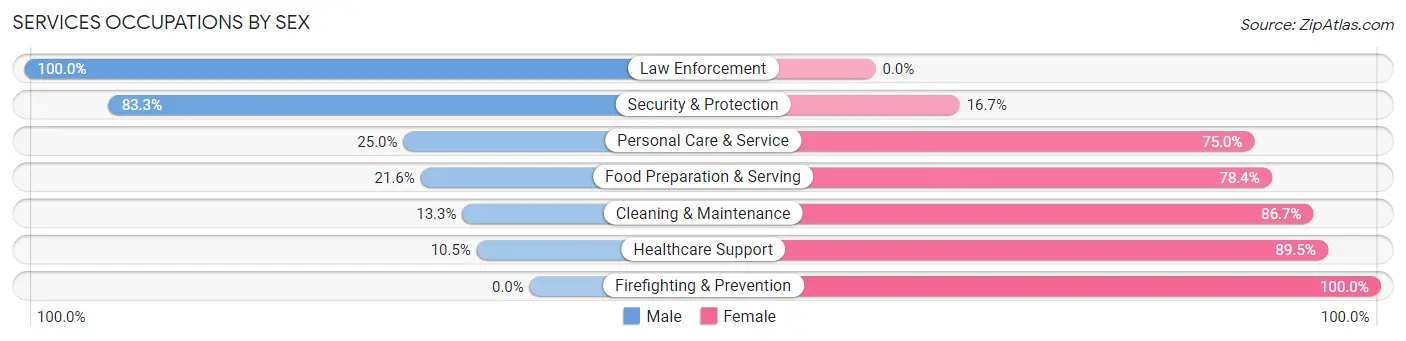
| Occupation | Male | Female |
| Healthcare Support | 11 (10.5%) | 94 (89.5%) |
| Security & Protection | 5 (83.3%) | 1 (16.7%) |
| Firefighting & Prevention | 0 (0.0%) | 1 (100.0%) |
| Law Enforcement | 5 (100.0%) | 0 (0.0%) |
| Food Preparation & Serving | 41 (21.6%) | 149 (78.4%) |
| Cleaning & Maintenance | 10 (13.3%) | 65 (86.7%) |
| Personal Care & Service | 18 (25.0%) | 54 (75.0%) |
| Total (Category) | 85 (19.0%) | 363 (81.0%) |
| Total (Overall) | 1,240 (49.2%) | 1,280 (50.8%) |
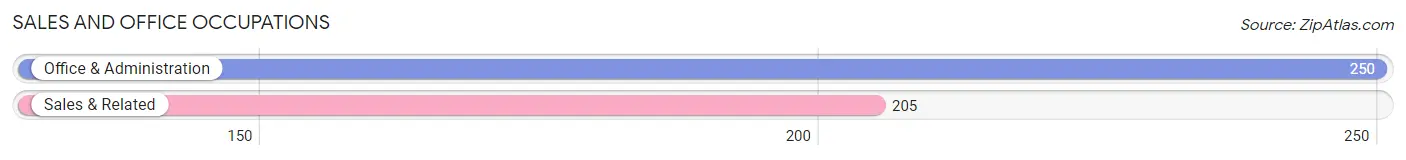
Sales and Office Occupations
The most common Sales and Office occupations in Dickey County are Office & Administration (250 | 9.9%), and Sales & Related (205 | 8.1%).
Sales and Office Occupations by Sex
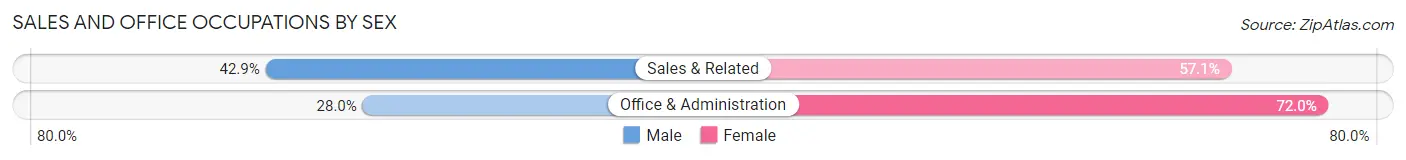
| Occupation | Male | Female |
| Sales & Related | 88 (42.9%) | 117 (57.1%) |
| Office & Administration | 70 (28.0%) | 180 (72.0%) |
| Total (Category) | 158 (34.7%) | 297 (65.3%) |
| Total (Overall) | 1,240 (49.2%) | 1,280 (50.8%) |
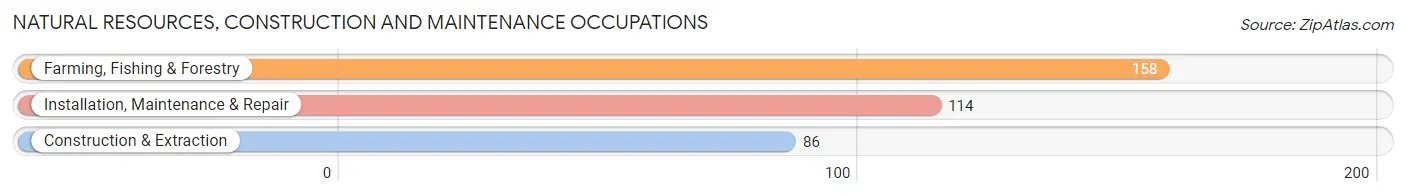
Natural Resources, Construction and Maintenance Occupations
The most common Natural Resources, Construction and Maintenance occupations in Dickey County are Farming, Fishing & Forestry (158 | 6.3%), Installation, Maintenance & Repair (114 | 4.5%), and Construction & Extraction (86 | 3.4%).
Natural Resources, Construction and Maintenance Occupations by Sex
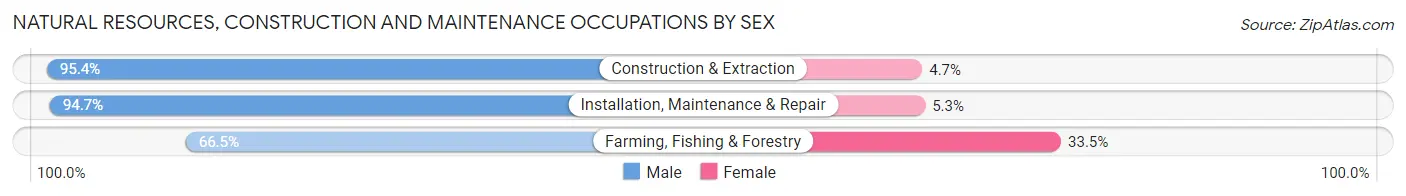
| Occupation | Male | Female |
| Farming, Fishing & Forestry | 105 (66.5%) | 53 (33.5%) |
| Construction & Extraction | 82 (95.4%) | 4 (4.6%) |
| Installation, Maintenance & Repair | 108 (94.7%) | 6 (5.3%) |
| Total (Category) | 295 (82.4%) | 63 (17.6%) |
| Total (Overall) | 1,240 (49.2%) | 1,280 (50.8%) |
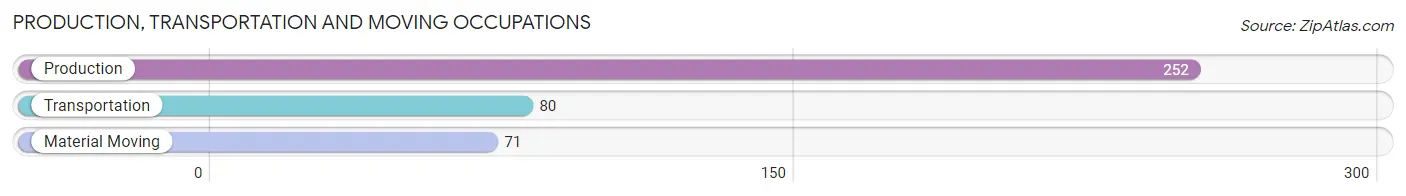
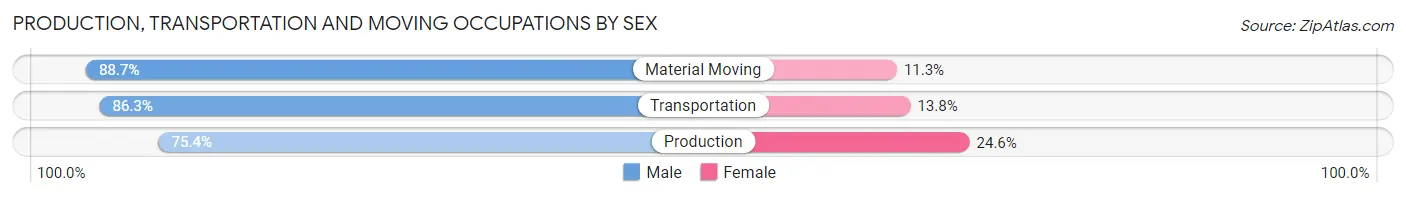
Production, Transportation and Moving Occupations
The most common Production, Transportation and Moving occupations in Dickey County are Production (252 | 10.0%), Transportation (80 | 3.2%), and Material Moving (71 | 2.8%).
Production, Transportation and Moving Occupations by Sex
| Occupation | Male | Female |
| Production | 190 (75.4%) | 62 (24.6%) |
| Transportation | 69 (86.3%) | 11 (13.8%) |
| Material Moving | 63 (88.7%) | 8 (11.3%) |
| Total (Category) | 322 (79.9%) | 81 (20.1%) |
| Total (Overall) | 1,240 (49.2%) | 1,280 (50.8%) |
Employment Industries by Sex in Dickey County
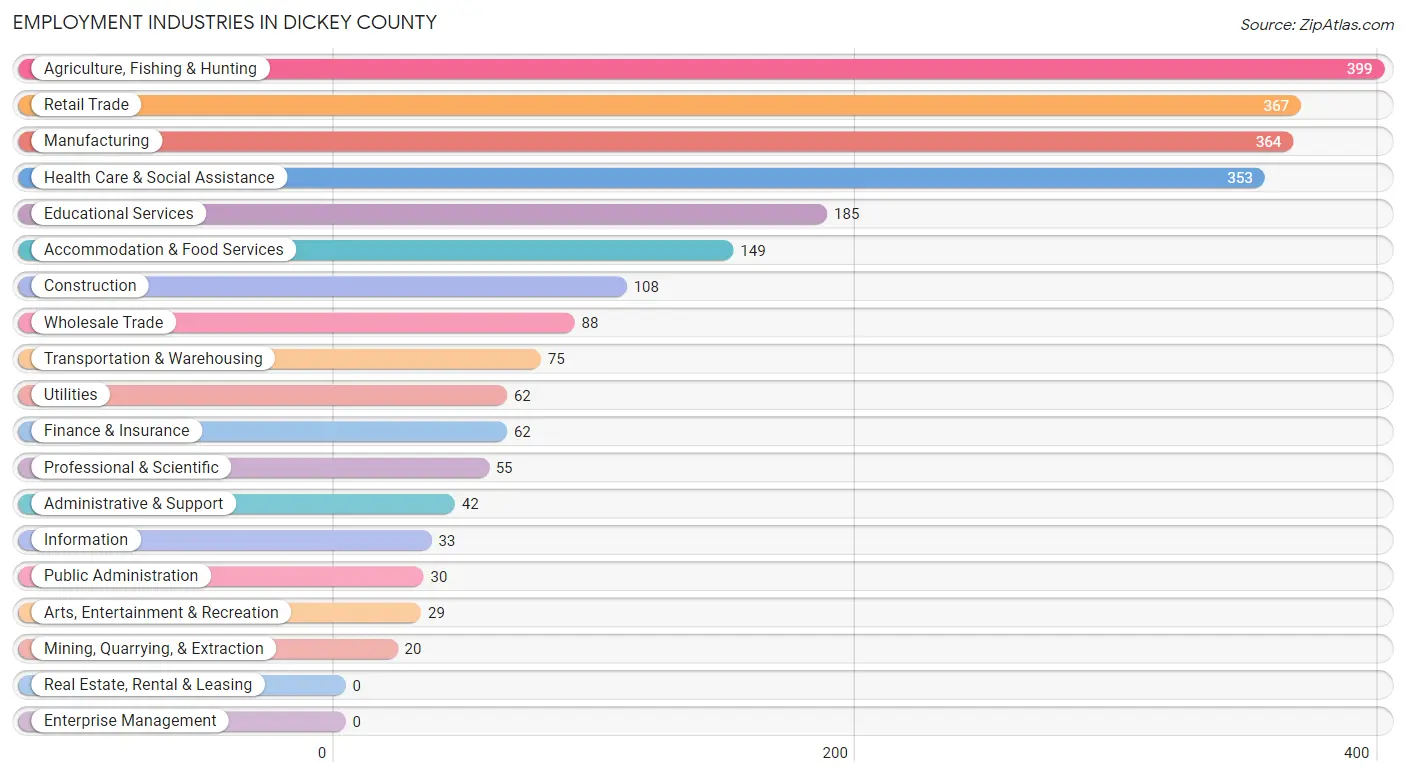
Employment Industries in Dickey County
The major employment industries in Dickey County include Agriculture, Fishing & Hunting (399 | 15.8%), Retail Trade (367 | 14.6%), Manufacturing (364 | 14.4%), Health Care & Social Assistance (353 | 14.0%), and Educational Services (185 | 7.3%).
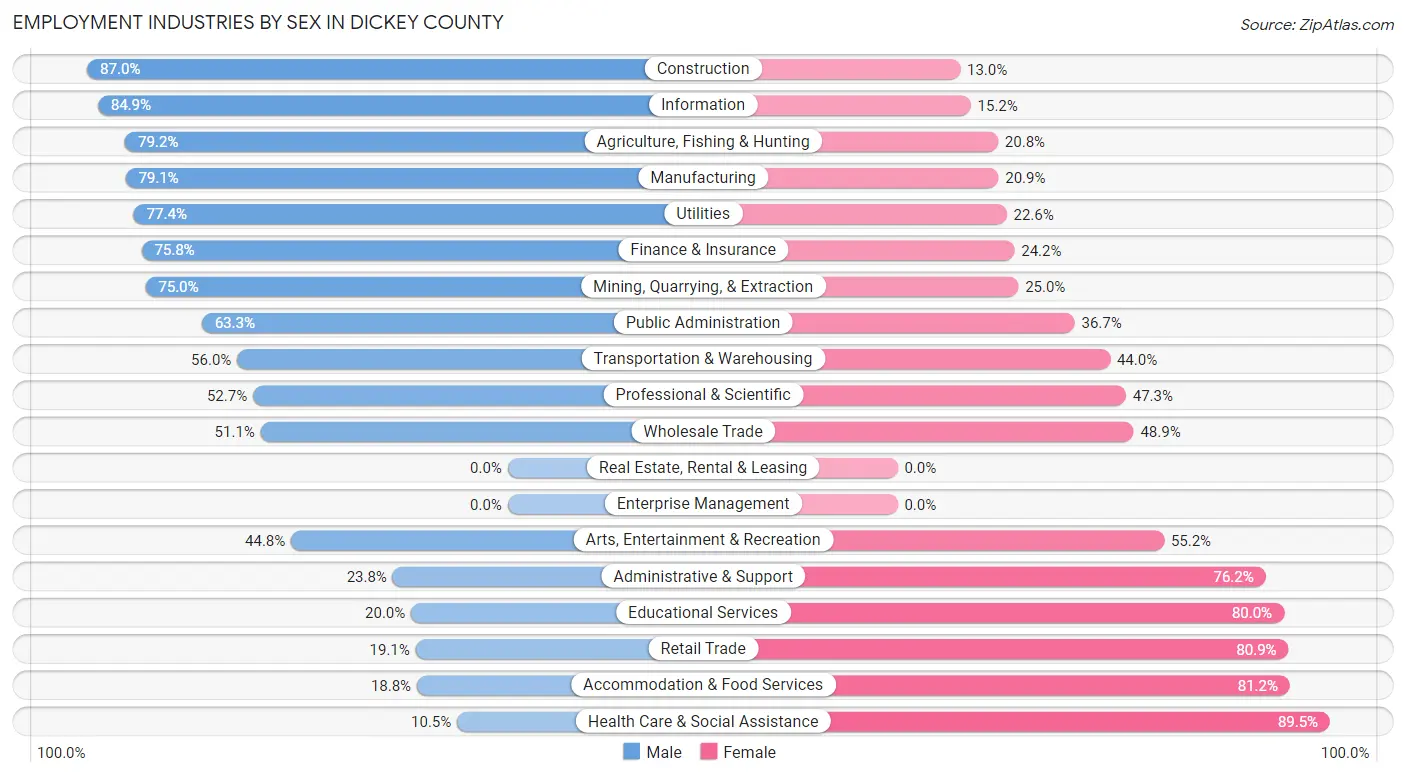
Employment Industries by Sex in Dickey County
The Dickey County industries that see more men than women are Construction (87.0%), Information (84.9%), and Agriculture, Fishing & Hunting (79.2%), whereas the industries that tend to have a higher number of women are Health Care & Social Assistance (89.5%), Accommodation & Food Services (81.2%), and Retail Trade (80.9%).
| Industry | Male | Female |
| Agriculture, Fishing & Hunting | 316 (79.2%) | 83 (20.8%) |
| Mining, Quarrying, & Extraction | 15 (75.0%) | 5 (25.0%) |
| Construction | 94 (87.0%) | 14 (13.0%) |
| Manufacturing | 288 (79.1%) | 76 (20.9%) |
| Wholesale Trade | 45 (51.1%) | 43 (48.9%) |
| Retail Trade | 70 (19.1%) | 297 (80.9%) |
| Transportation & Warehousing | 42 (56.0%) | 33 (44.0%) |
| Utilities | 48 (77.4%) | 14 (22.6%) |
| Information | 28 (84.9%) | 5 (15.1%) |
| Finance & Insurance | 47 (75.8%) | 15 (24.2%) |
| Real Estate, Rental & Leasing | 0 (0.0%) | 0 (0.0%) |
| Professional & Scientific | 29 (52.7%) | 26 (47.3%) |
| Enterprise Management | 0 (0.0%) | 0 (0.0%) |
| Administrative & Support | 10 (23.8%) | 32 (76.2%) |
| Educational Services | 37 (20.0%) | 148 (80.0%) |
| Health Care & Social Assistance | 37 (10.5%) | 316 (89.5%) |
| Arts, Entertainment & Recreation | 13 (44.8%) | 16 (55.2%) |
| Accommodation & Food Services | 28 (18.8%) | 121 (81.2%) |
| Public Administration | 19 (63.3%) | 11 (36.7%) |
| Total | 1,240 (49.2%) | 1,280 (50.8%) |
Education in Dickey County
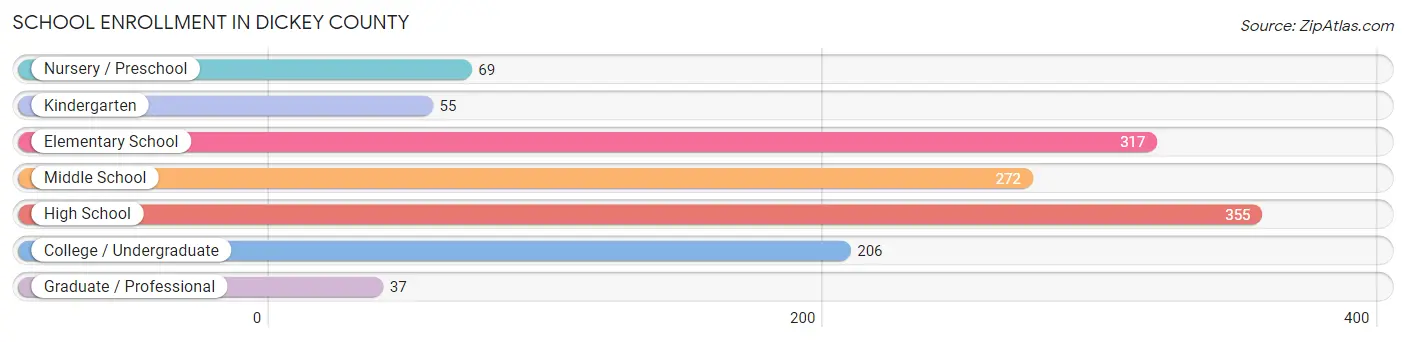
School Enrollment in Dickey County
The most common levels of schooling among the 1,311 students in Dickey County are high school (355 | 27.1%), elementary school (317 | 24.2%), and middle school (272 | 20.7%).
| School Level | # Students | % Students |
| Nursery / Preschool | 69 | 5.3% |
| Kindergarten | 55 | 4.2% |
| Elementary School | 317 | 24.2% |
| Middle School | 272 | 20.7% |
| High School | 355 | 27.1% |
| College / Undergraduate | 206 | 15.7% |
| Graduate / Professional | 37 | 2.8% |
| Total | 1,311 | 100.0% |
School Enrollment by Age by Funding Source in Dickey County
Out of a total of 1,311 students who are enrolled in schools in Dickey County, 202 (15.4%) attend a private institution, while the remaining 1,109 (84.6%) are enrolled in public schools. The age group of 25 to 34 year olds has the highest likelihood of being enrolled in private schools, with 10 (47.6% in the age bracket) enrolled. Conversely, the age group of 35 years and over has the lowest likelihood of being enrolled in a private school, with 30 (100.0% in the age bracket) attending a public institution.
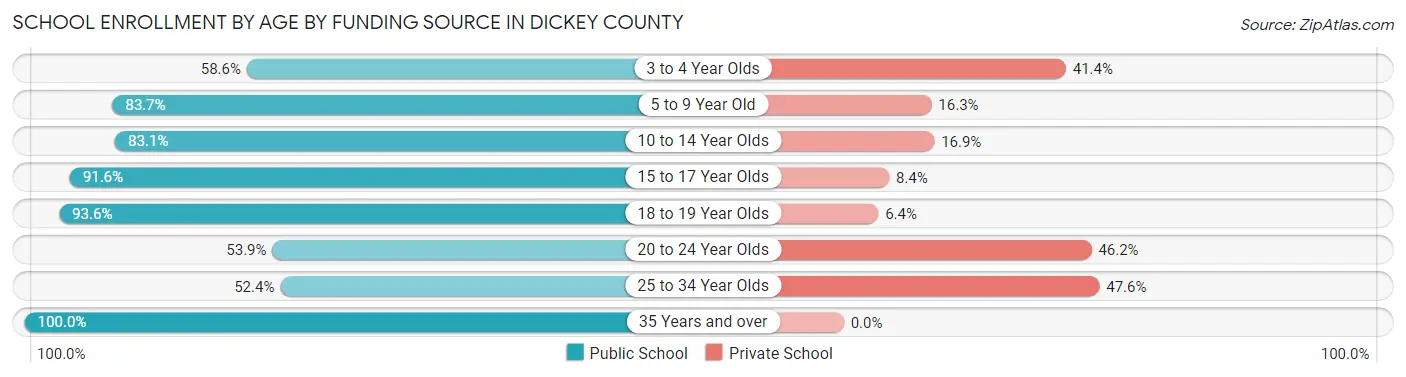
| Age Bracket | Public School | Private School |
| 3 to 4 Year Olds | 34 (58.6%) | 24 (41.4%) |
| 5 to 9 Year Old | 297 (83.7%) | 58 (16.3%) |
| 10 to 14 Year Olds | 281 (83.1%) | 57 (16.9%) |
| 15 to 17 Year Olds | 217 (91.6%) | 20 (8.4%) |
| 18 to 19 Year Olds | 218 (93.6%) | 15 (6.4%) |
| 20 to 24 Year Olds | 21 (53.8%) | 18 (46.2%) |
| 25 to 34 Year Olds | 11 (52.4%) | 10 (47.6%) |
| 35 Years and over | 30 (100.0%) | 0 (0.0%) |
| Total | 1,109 (84.6%) | 202 (15.4%) |
Educational Attainment by Field of Study in Dickey County
Education (286 | 31.3%), business (202 | 22.1%), science & technology (125 | 13.7%), bio, nature & agricultural (93 | 10.2%), and liberal arts & history (72 | 7.9%) are the most common fields of study among 914 individuals in Dickey County who have obtained a bachelor's degree or higher.
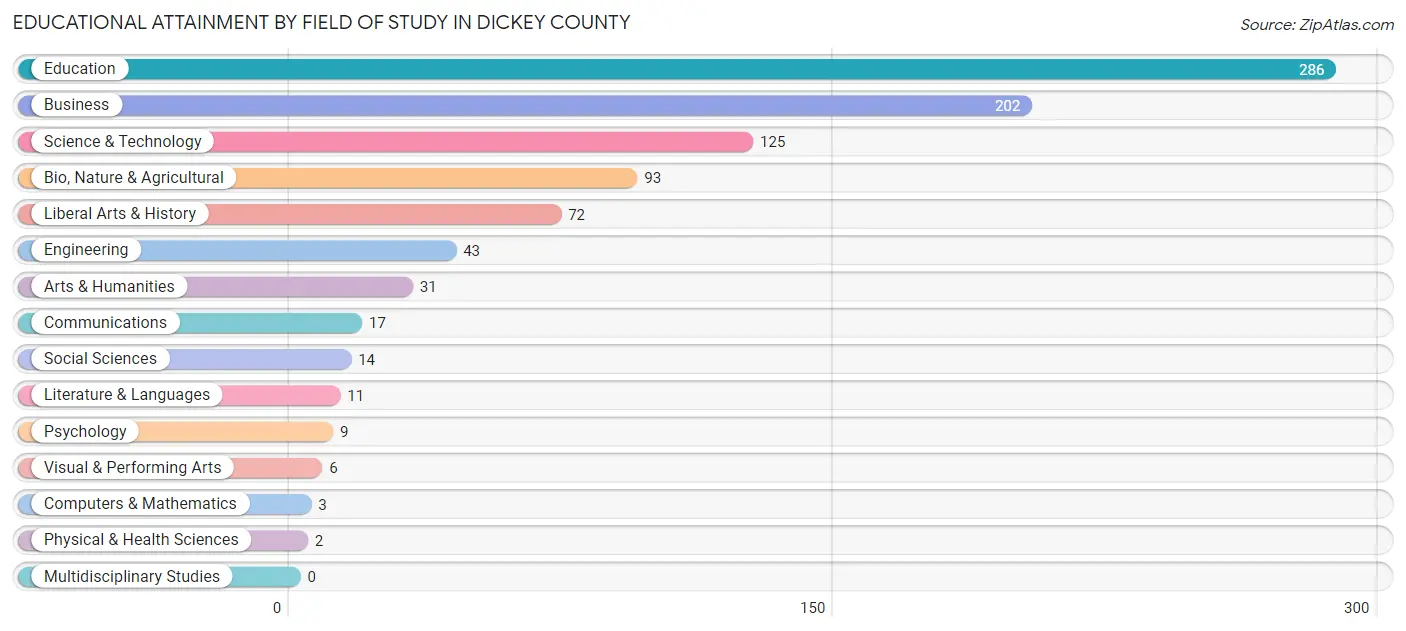
| Field of Study | # Graduates | % Graduates |
| Computers & Mathematics | 3 | 0.3% |
| Bio, Nature & Agricultural | 93 | 10.2% |
| Physical & Health Sciences | 2 | 0.2% |
| Psychology | 9 | 1.0% |
| Social Sciences | 14 | 1.5% |
| Engineering | 43 | 4.7% |
| Multidisciplinary Studies | 0 | 0.0% |
| Science & Technology | 125 | 13.7% |
| Business | 202 | 22.1% |
| Education | 286 | 31.3% |
| Literature & Languages | 11 | 1.2% |
| Liberal Arts & History | 72 | 7.9% |
| Visual & Performing Arts | 6 | 0.7% |
| Communications | 17 | 1.9% |
| Arts & Humanities | 31 | 3.4% |
| Total | 914 | 100.0% |
Transportation & Commute in Dickey County
Vehicle Availability by Sex in Dickey County
The most prevalent vehicle ownership categories in Dickey County are males with 2 vehicles (403, accounting for 32.9%) and females with 2 vehicles (369, making up 34.7%).
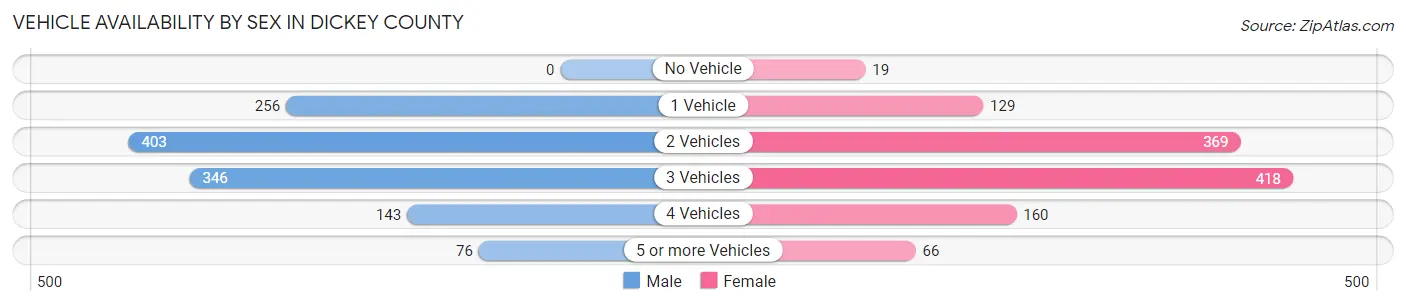
| Vehicles Available | Male | Female |
| No Vehicle | 0 (0.0%) | 19 (1.6%) |
| 1 Vehicle | 256 (20.9%) | 129 (11.1%) |
| 2 Vehicles | 403 (32.9%) | 369 (31.8%) |
| 3 Vehicles | 346 (28.3%) | 418 (36.0%) |
| 4 Vehicles | 143 (11.7%) | 160 (13.8%) |
| 5 or more Vehicles | 76 (6.2%) | 66 (5.7%) |
| Total | 1,224 (100.0%) | 1,161 (100.0%) |
Commute Time in Dickey County
The most frequently occuring commute durations in Dickey County are 5 to 9 minutes (572 commuters, 25.0%), less than 5 minutes (517 commuters, 22.6%), and 30 to 34 minutes (257 commuters, 11.2%).
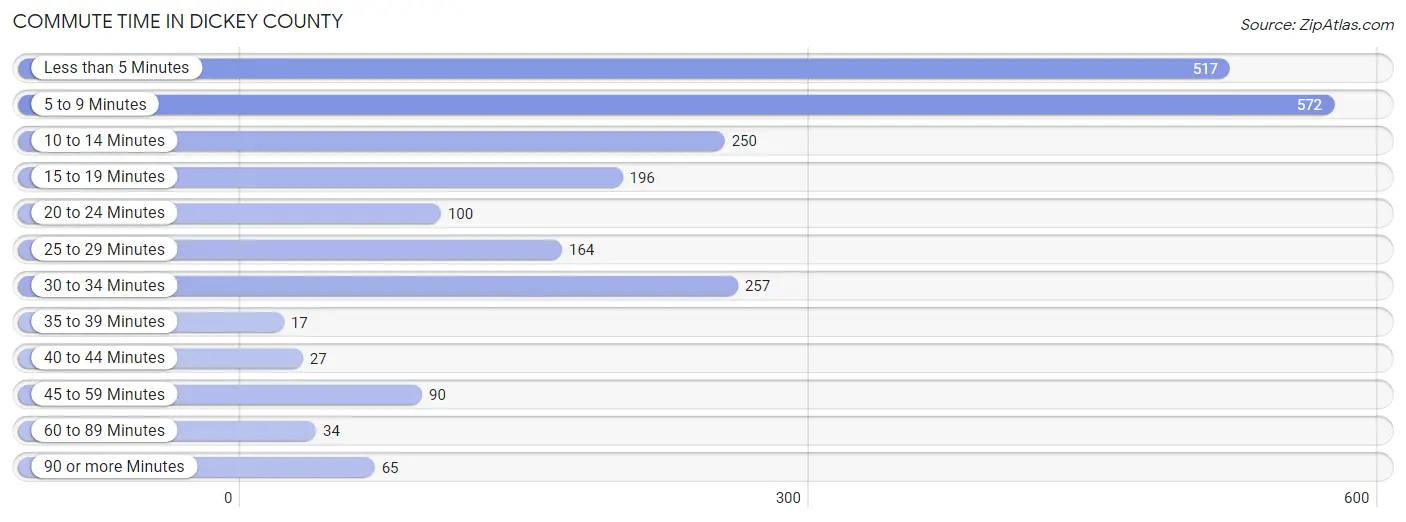
| Commute Time | # Commuters | % Commuters |
| Less than 5 Minutes | 517 | 22.6% |
| 5 to 9 Minutes | 572 | 25.0% |
| 10 to 14 Minutes | 250 | 10.9% |
| 15 to 19 Minutes | 196 | 8.6% |
| 20 to 24 Minutes | 100 | 4.4% |
| 25 to 29 Minutes | 164 | 7.2% |
| 30 to 34 Minutes | 257 | 11.2% |
| 35 to 39 Minutes | 17 | 0.7% |
| 40 to 44 Minutes | 27 | 1.2% |
| 45 to 59 Minutes | 90 | 3.9% |
| 60 to 89 Minutes | 34 | 1.5% |
| 90 or more Minutes | 65 | 2.8% |
Commute Time by Sex in Dickey County
The most common commute times in Dickey County are 5 to 9 minutes (268 commuters, 23.3%) for males and 5 to 9 minutes (304 commuters, 26.6%) for females.
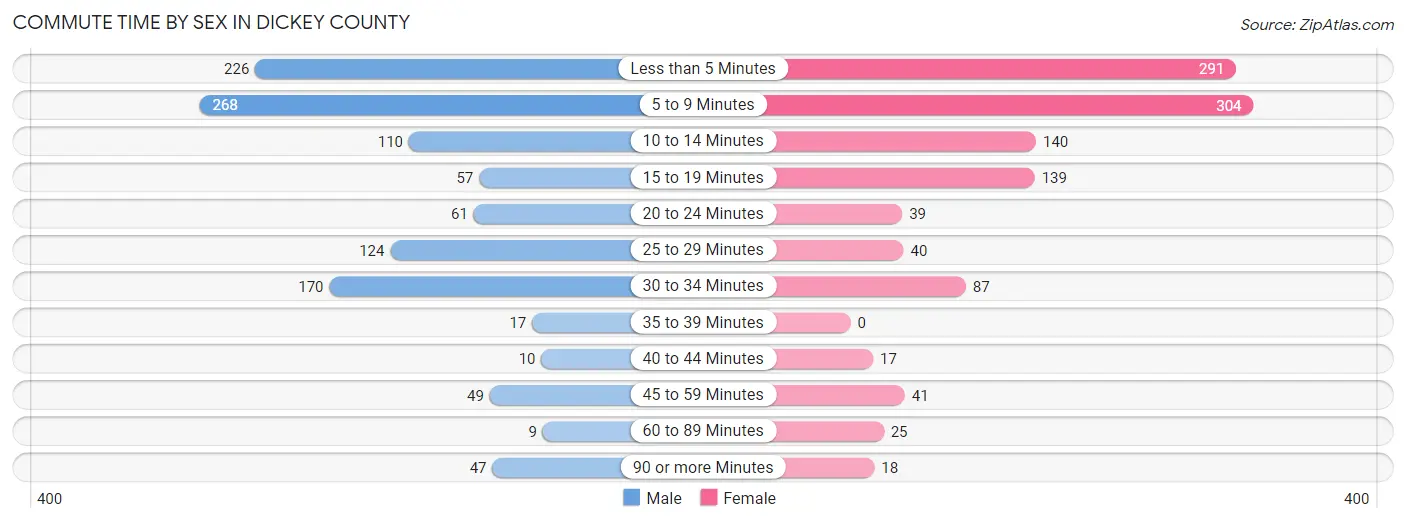
| Commute Time | Male | Female |
| Less than 5 Minutes | 226 (19.7%) | 291 (25.5%) |
| 5 to 9 Minutes | 268 (23.3%) | 304 (26.6%) |
| 10 to 14 Minutes | 110 (9.6%) | 140 (12.3%) |
| 15 to 19 Minutes | 57 (5.0%) | 139 (12.2%) |
| 20 to 24 Minutes | 61 (5.3%) | 39 (3.4%) |
| 25 to 29 Minutes | 124 (10.8%) | 40 (3.5%) |
| 30 to 34 Minutes | 170 (14.8%) | 87 (7.6%) |
| 35 to 39 Minutes | 17 (1.5%) | 0 (0.0%) |
| 40 to 44 Minutes | 10 (0.9%) | 17 (1.5%) |
| 45 to 59 Minutes | 49 (4.3%) | 41 (3.6%) |
| 60 to 89 Minutes | 9 (0.8%) | 25 (2.2%) |
| 90 or more Minutes | 47 (4.1%) | 18 (1.6%) |
Time of Departure to Work by Sex in Dickey County
The most frequent times of departure to work in Dickey County are 7:30 AM to 7:59 AM (238, 20.7%) for males and 8:00 AM to 8:29 AM (208, 18.2%) for females.
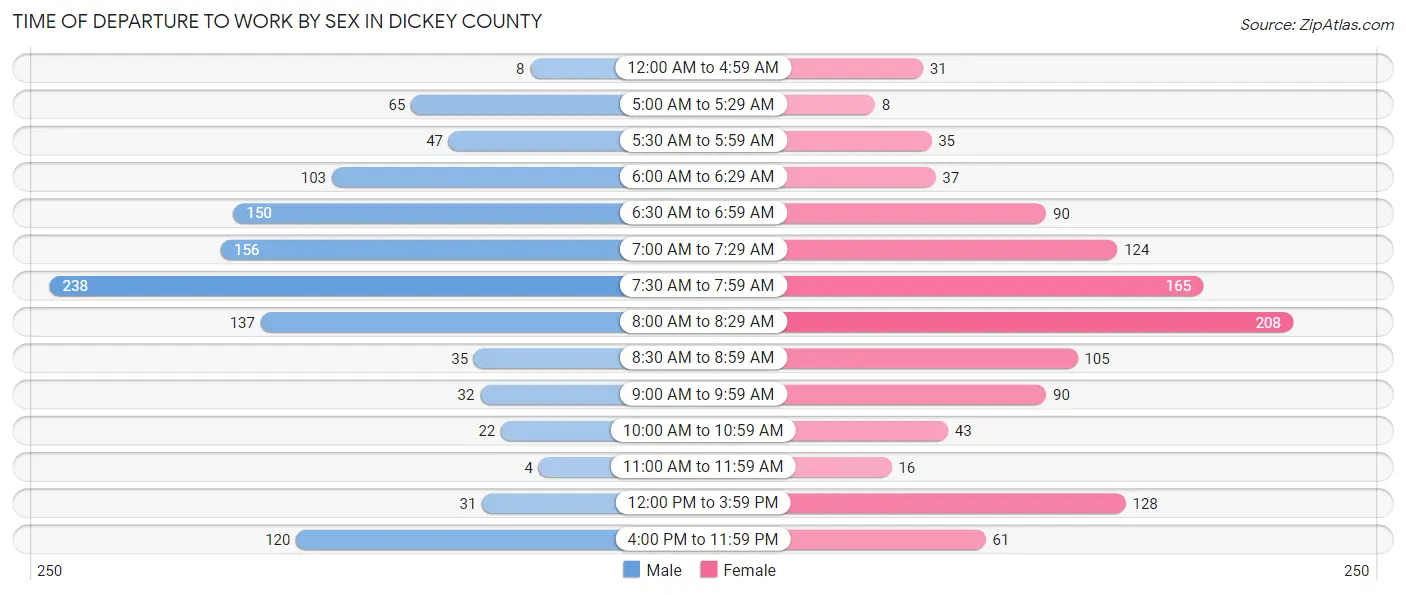
| Time of Departure | Male | Female |
| 12:00 AM to 4:59 AM | 8 (0.7%) | 31 (2.7%) |
| 5:00 AM to 5:29 AM | 65 (5.7%) | 8 (0.7%) |
| 5:30 AM to 5:59 AM | 47 (4.1%) | 35 (3.1%) |
| 6:00 AM to 6:29 AM | 103 (9.0%) | 37 (3.2%) |
| 6:30 AM to 6:59 AM | 150 (13.1%) | 90 (7.9%) |
| 7:00 AM to 7:29 AM | 156 (13.6%) | 124 (10.9%) |
| 7:30 AM to 7:59 AM | 238 (20.7%) | 165 (14.5%) |
| 8:00 AM to 8:29 AM | 137 (11.9%) | 208 (18.2%) |
| 8:30 AM to 8:59 AM | 35 (3.0%) | 105 (9.2%) |
| 9:00 AM to 9:59 AM | 32 (2.8%) | 90 (7.9%) |
| 10:00 AM to 10:59 AM | 22 (1.9%) | 43 (3.8%) |
| 11:00 AM to 11:59 AM | 4 (0.4%) | 16 (1.4%) |
| 12:00 PM to 3:59 PM | 31 (2.7%) | 128 (11.2%) |
| 4:00 PM to 11:59 PM | 120 (10.4%) | 61 (5.3%) |
| Total | 1,148 (100.0%) | 1,141 (100.0%) |
Housing Occupancy in Dickey County
Occupancy by Ownership in Dickey County
Of the total 1,916 dwellings in Dickey County, owner-occupied units account for 1,490 (77.8%), while renter-occupied units make up 426 (22.2%).
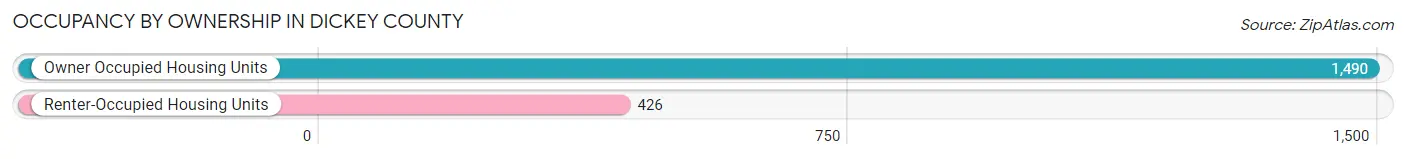
| Occupancy | # Housing Units | % Housing Units |
| Owner Occupied Housing Units | 1,490 | 77.8% |
| Renter-Occupied Housing Units | 426 | 22.2% |
| Total Occupied Housing Units | 1,916 | 100.0% |
Occupancy by Household Size in Dickey County
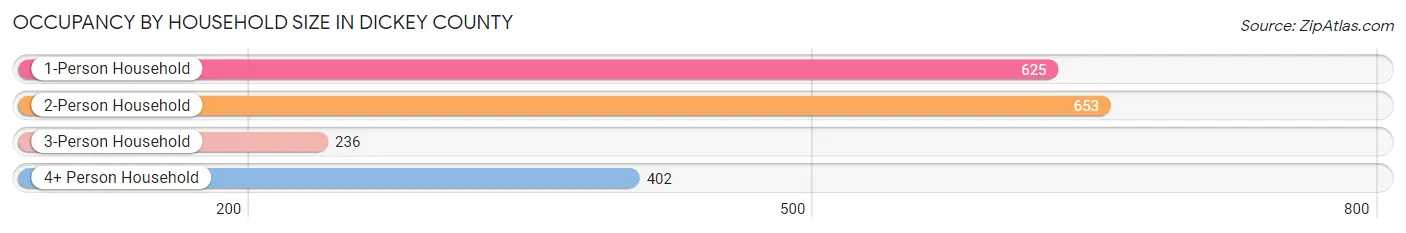
| Household Size | # Housing Units | % Housing Units |
| 1-Person Household | 625 | 32.6% |
| 2-Person Household | 653 | 34.1% |
| 3-Person Household | 236 | 12.3% |
| 4+ Person Household | 402 | 21.0% |
| Total Housing Units | 1,916 | 100.0% |
Occupancy by Ownership by Household Size in Dickey County
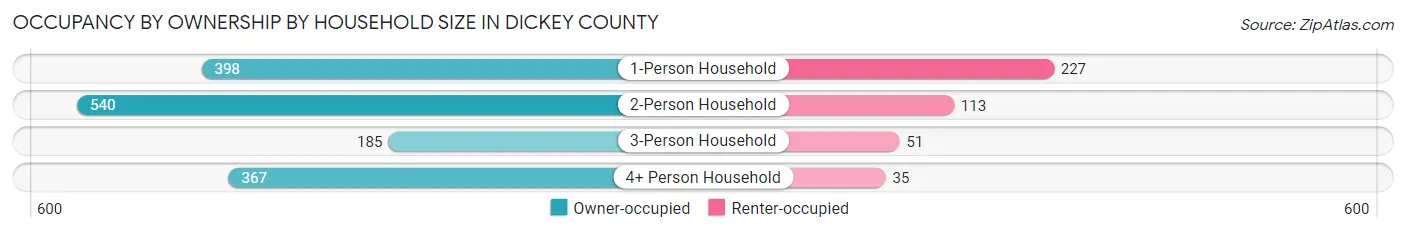
| Household Size | Owner-occupied | Renter-occupied |
| 1-Person Household | 398 (63.7%) | 227 (36.3%) |
| 2-Person Household | 540 (82.7%) | 113 (17.3%) |
| 3-Person Household | 185 (78.4%) | 51 (21.6%) |
| 4+ Person Household | 367 (91.3%) | 35 (8.7%) |
| Total Housing Units | 1,490 (77.8%) | 426 (22.2%) |
Occupancy by Educational Attainment in Dickey County
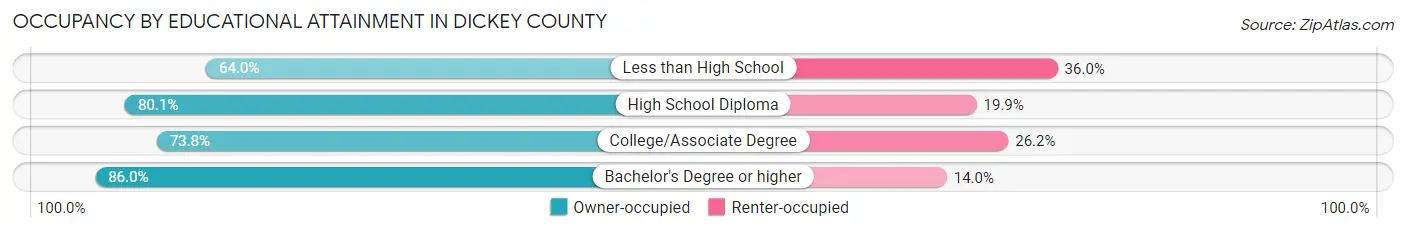
| Household Size | Owner-occupied | Renter-occupied |
| Less than High School | 105 (64.0%) | 59 (36.0%) |
| High School Diploma | 374 (80.1%) | 93 (19.9%) |
| College/Associate Degree | 569 (73.8%) | 202 (26.2%) |
| Bachelor's Degree or higher | 442 (86.0%) | 72 (14.0%) |
Occupancy by Age of Householder in Dickey County
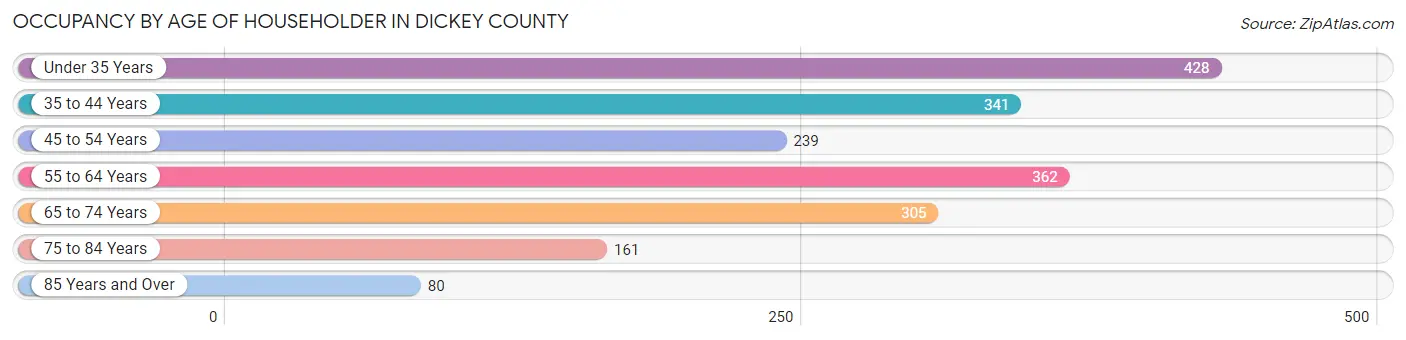
| Age Bracket | # Households | % Households |
| Under 35 Years | 428 | 22.3% |
| 35 to 44 Years | 341 | 17.8% |
| 45 to 54 Years | 239 | 12.5% |
| 55 to 64 Years | 362 | 18.9% |
| 65 to 74 Years | 305 | 15.9% |
| 75 to 84 Years | 161 | 8.4% |
| 85 Years and Over | 80 | 4.2% |
| Total | 1,916 | 100.0% |
Housing Finances in Dickey County
Median Income by Occupancy in Dickey County
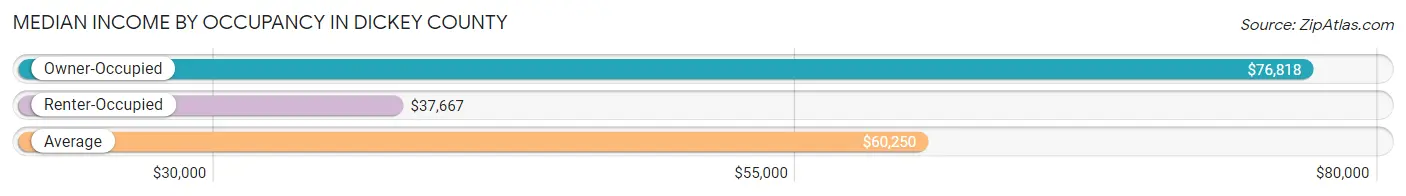
| Occupancy Type | # Households | Median Income |
| Owner-Occupied | 1,490 (77.8%) | $76,818 |
| Renter-Occupied | 426 (22.2%) | $37,667 |
| Average | 1,916 (100.0%) | $60,250 |
Occupancy by Householder Income Bracket in Dickey County
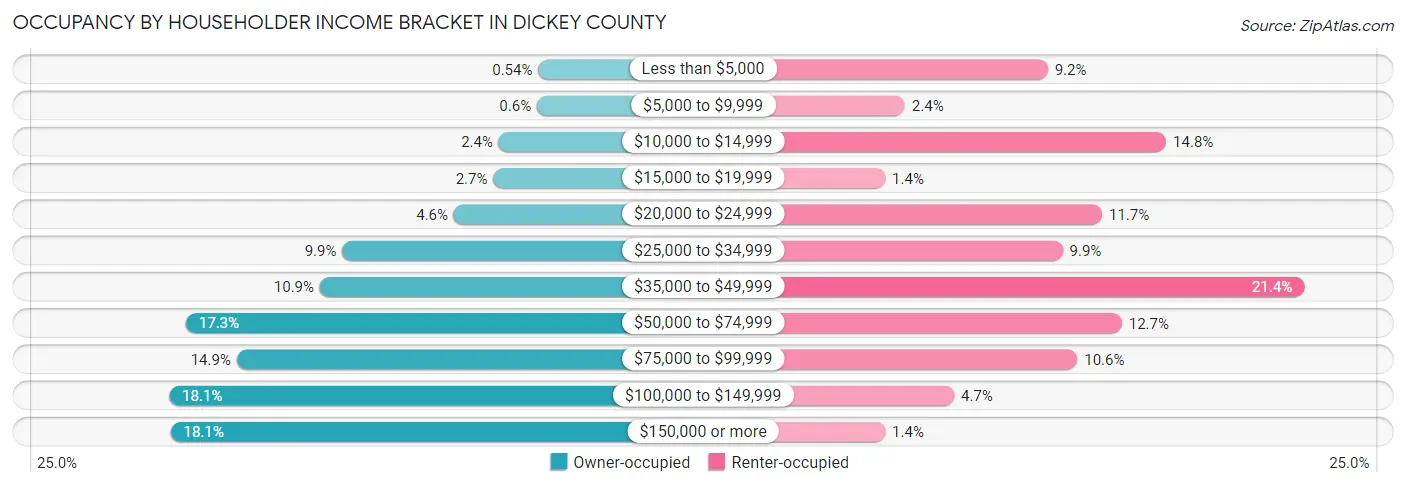
| Income Bracket | Owner-occupied | Renter-occupied |
| Less than $5,000 | 8 (0.5%) | 39 (9.1%) |
| $5,000 to $9,999 | 9 (0.6%) | 10 (2.4%) |
| $10,000 to $14,999 | 36 (2.4%) | 63 (14.8%) |
| $15,000 to $19,999 | 40 (2.7%) | 6 (1.4%) |
| $20,000 to $24,999 | 68 (4.6%) | 50 (11.7%) |
| $25,000 to $34,999 | 147 (9.9%) | 42 (9.9%) |
| $35,000 to $49,999 | 163 (10.9%) | 91 (21.4%) |
| $50,000 to $74,999 | 258 (17.3%) | 54 (12.7%) |
| $75,000 to $99,999 | 222 (14.9%) | 45 (10.6%) |
| $100,000 to $149,999 | 270 (18.1%) | 20 (4.7%) |
| $150,000 or more | 269 (18.0%) | 6 (1.4%) |
| Total | 1,490 (100.0%) | 426 (100.0%) |
Monthly Housing Cost Tiers in Dickey County
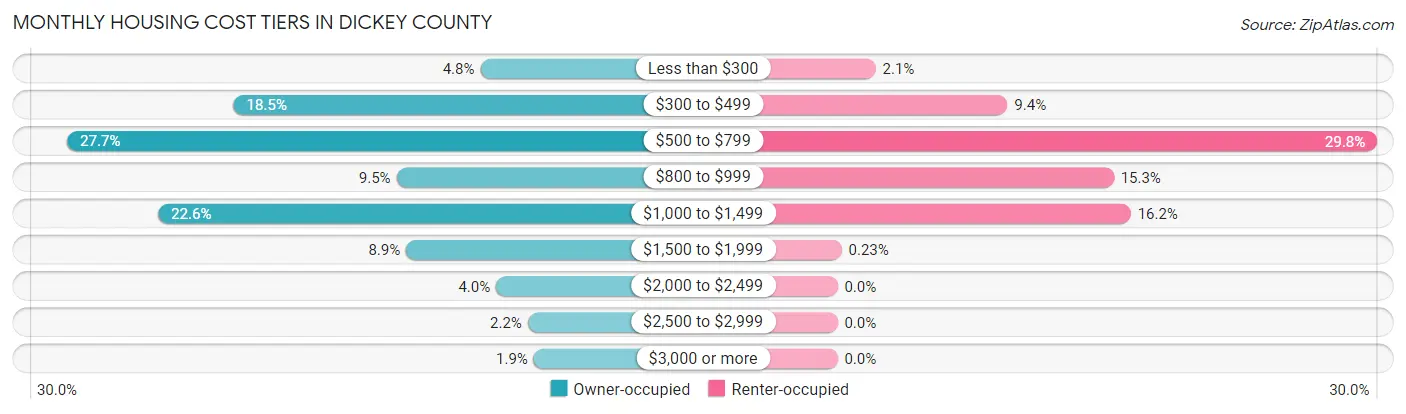
| Monthly Cost | Owner-occupied | Renter-occupied |
| Less than $300 | 72 (4.8%) | 9 (2.1%) |
| $300 to $499 | 275 (18.5%) | 40 (9.4%) |
| $500 to $799 | 412 (27.7%) | 127 (29.8%) |
| $800 to $999 | 141 (9.5%) | 65 (15.3%) |
| $1,000 to $1,499 | 337 (22.6%) | 69 (16.2%) |
| $1,500 to $1,999 | 133 (8.9%) | 1 (0.2%) |
| $2,000 to $2,499 | 59 (4.0%) | 0 (0.0%) |
| $2,500 to $2,999 | 33 (2.2%) | 0 (0.0%) |
| $3,000 or more | 28 (1.9%) | 0 (0.0%) |
| Total | 1,490 (100.0%) | 426 (100.0%) |
Physical Housing Characteristics in Dickey County
Housing Structures in Dickey County
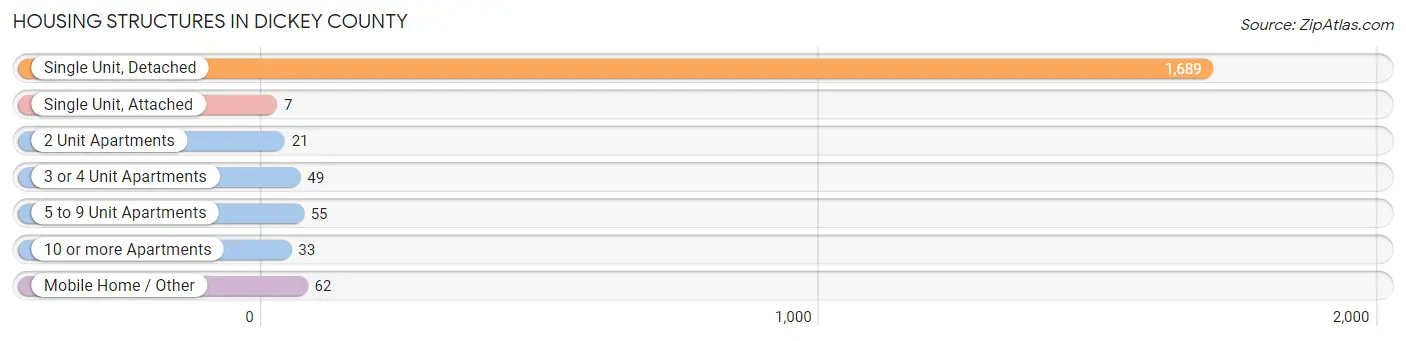
| Structure Type | # Housing Units | % Housing Units |
| Single Unit, Detached | 1,689 | 88.1% |
| Single Unit, Attached | 7 | 0.4% |
| 2 Unit Apartments | 21 | 1.1% |
| 3 or 4 Unit Apartments | 49 | 2.6% |
| 5 to 9 Unit Apartments | 55 | 2.9% |
| 10 or more Apartments | 33 | 1.7% |
| Mobile Home / Other | 62 | 3.2% |
| Total | 1,916 | 100.0% |
Housing Structures by Occupancy in Dickey County
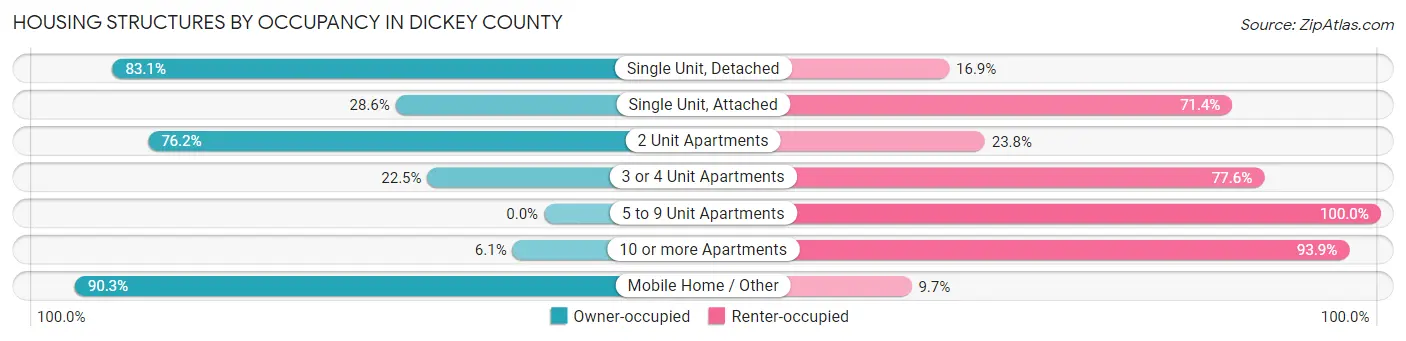
| Structure Type | Owner-occupied | Renter-occupied |
| Single Unit, Detached | 1,403 (83.1%) | 286 (16.9%) |
| Single Unit, Attached | 2 (28.6%) | 5 (71.4%) |
| 2 Unit Apartments | 16 (76.2%) | 5 (23.8%) |
| 3 or 4 Unit Apartments | 11 (22.5%) | 38 (77.5%) |
| 5 to 9 Unit Apartments | 0 (0.0%) | 55 (100.0%) |
| 10 or more Apartments | 2 (6.1%) | 31 (93.9%) |
| Mobile Home / Other | 56 (90.3%) | 6 (9.7%) |
| Total | 1,490 (77.8%) | 426 (22.2%) |
Housing Structures by Number of Rooms in Dickey County
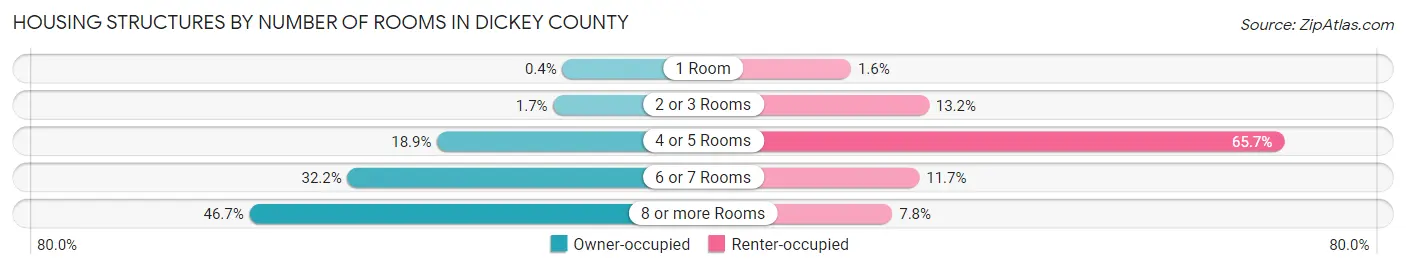
| Number of Rooms | Owner-occupied | Renter-occupied |
| 1 Room | 6 (0.4%) | 7 (1.6%) |
| 2 or 3 Rooms | 26 (1.7%) | 56 (13.2%) |
| 4 or 5 Rooms | 282 (18.9%) | 280 (65.7%) |
| 6 or 7 Rooms | 480 (32.2%) | 50 (11.7%) |
| 8 or more Rooms | 696 (46.7%) | 33 (7.7%) |
| Total | 1,490 (100.0%) | 426 (100.0%) |
Housing Structure by Heating Type in Dickey County
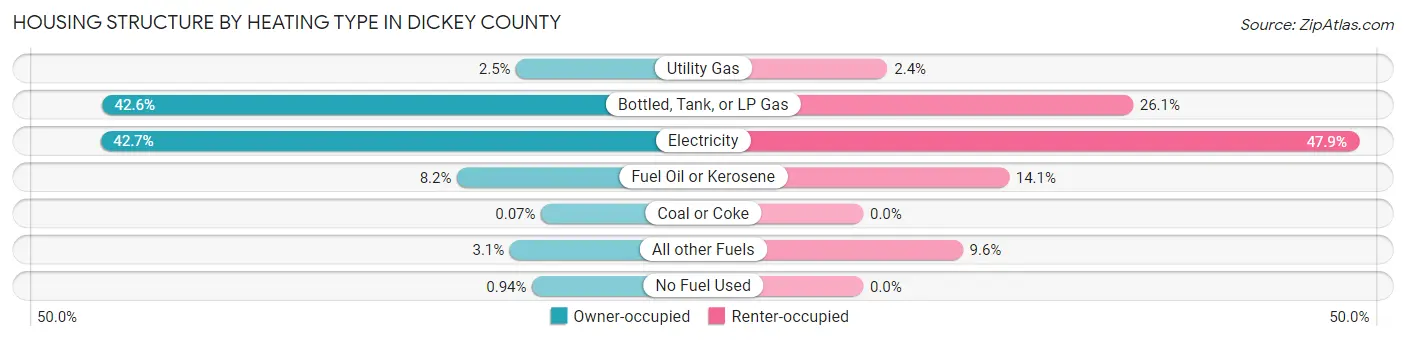
| Heating Type | Owner-occupied | Renter-occupied |
| Utility Gas | 37 (2.5%) | 10 (2.4%) |
| Bottled, Tank, or LP Gas | 634 (42.5%) | 111 (26.1%) |
| Electricity | 636 (42.7%) | 204 (47.9%) |
| Fuel Oil or Kerosene | 122 (8.2%) | 60 (14.1%) |
| Coal or Coke | 1 (0.1%) | 0 (0.0%) |
| All other Fuels | 46 (3.1%) | 41 (9.6%) |
| No Fuel Used | 14 (0.9%) | 0 (0.0%) |
| Total | 1,490 (100.0%) | 426 (100.0%) |
Household Vehicle Usage in Dickey County
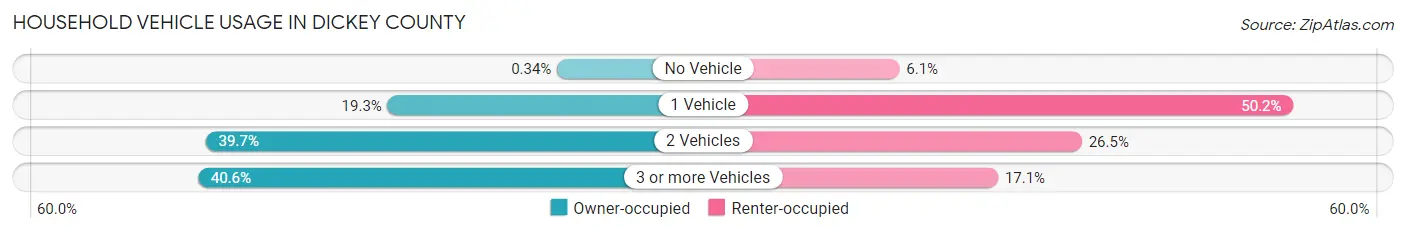
| Vehicles per Household | Owner-occupied | Renter-occupied |
| No Vehicle | 5 (0.3%) | 26 (6.1%) |
| 1 Vehicle | 288 (19.3%) | 214 (50.2%) |
| 2 Vehicles | 592 (39.7%) | 113 (26.5%) |
| 3 or more Vehicles | 605 (40.6%) | 73 (17.1%) |
| Total | 1,490 (100.0%) | 426 (100.0%) |
Real Estate & Mortgages in Dickey County
Real Estate and Mortgage Overview in Dickey County
| Characteristic | Without Mortgage | With Mortgage |
| Housing Units | 793 | 697 |
| Median Property Value | $147,000 | $183,000 |
| Median Household Income | $58,945 | $156 |
| Monthly Housing Costs | $543 | $28 |
| Real Estate Taxes | $1,475 | $35 |
Property Value by Mortgage Status in Dickey County
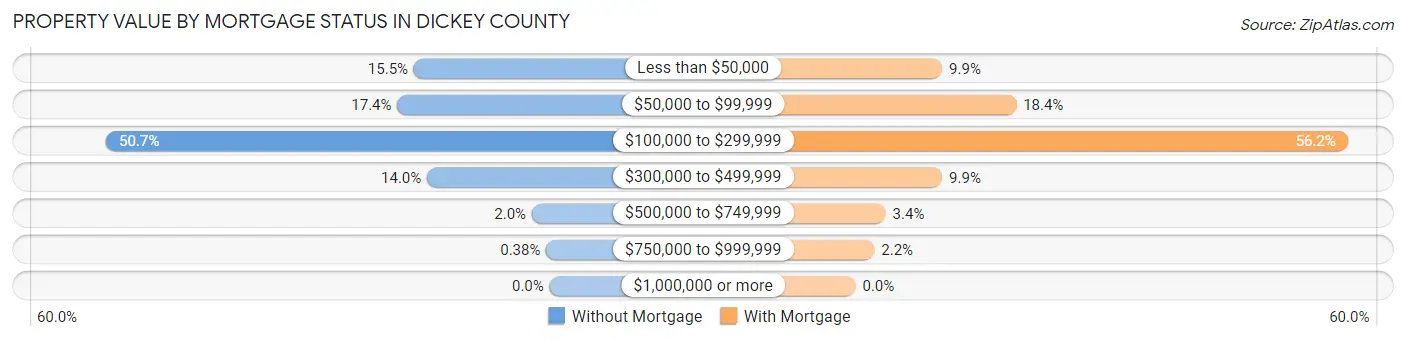
| Property Value | Without Mortgage | With Mortgage |
| Less than $50,000 | 123 (15.5%) | 69 (9.9%) |
| $50,000 to $99,999 | 138 (17.4%) | 128 (18.4%) |
| $100,000 to $299,999 | 402 (50.7%) | 392 (56.2%) |
| $300,000 to $499,999 | 111 (14.0%) | 69 (9.9%) |
| $500,000 to $749,999 | 16 (2.0%) | 24 (3.4%) |
| $750,000 to $999,999 | 3 (0.4%) | 15 (2.1%) |
| $1,000,000 or more | 0 (0.0%) | 0 (0.0%) |
| Total | 793 (100.0%) | 697 (100.0%) |
Household Income by Mortgage Status in Dickey County
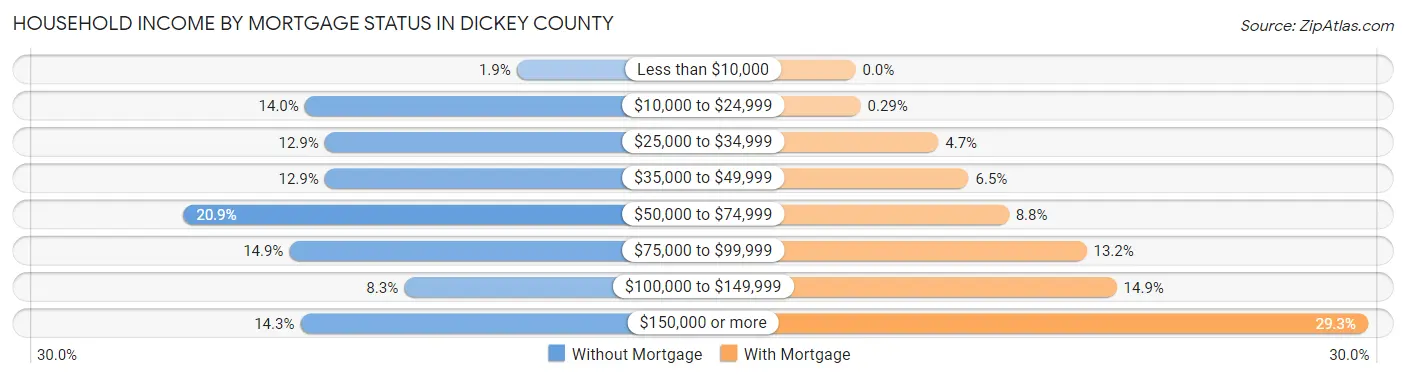
| Household Income | Without Mortgage | With Mortgage |
| Less than $10,000 | 15 (1.9%) | 0 (0.0%) |
| $10,000 to $24,999 | 111 (14.0%) | 2 (0.3%) |
| $25,000 to $34,999 | 102 (12.9%) | 33 (4.7%) |
| $35,000 to $49,999 | 102 (12.9%) | 45 (6.5%) |
| $50,000 to $74,999 | 166 (20.9%) | 61 (8.7%) |
| $75,000 to $99,999 | 118 (14.9%) | 92 (13.2%) |
| $100,000 to $149,999 | 66 (8.3%) | 104 (14.9%) |
| $150,000 or more | 113 (14.2%) | 204 (29.3%) |
| Total | 793 (100.0%) | 697 (100.0%) |
Property Value to Household Income Ratio in Dickey County
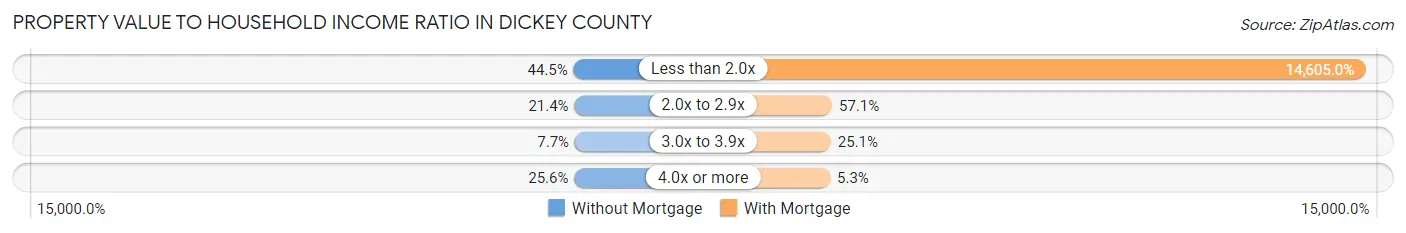
| Value-to-Income Ratio | Without Mortgage | With Mortgage |
| Less than 2.0x | 353 (44.5%) | 101,797 (14,605.0%) |
| 2.0x to 2.9x | 170 (21.4%) | 398 (57.1%) |
| 3.0x to 3.9x | 61 (7.7%) | 175 (25.1%) |
| 4.0x or more | 203 (25.6%) | 37 (5.3%) |
| Total | 793 (100.0%) | 697 (100.0%) |
Real Estate Taxes by Mortgage Status in Dickey County
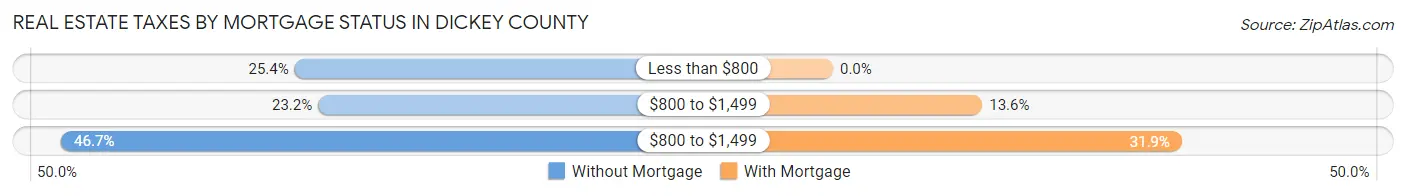
| Property Taxes | Without Mortgage | With Mortgage |
| Less than $800 | 201 (25.4%) | 0 (0.0%) |
| $800 to $1,499 | 184 (23.2%) | 95 (13.6%) |
| $800 to $1,499 | 370 (46.7%) | 222 (31.9%) |
| Total | 793 (100.0%) | 697 (100.0%) |
Health & Disability in Dickey County
Health Insurance Coverage by Age in Dickey County
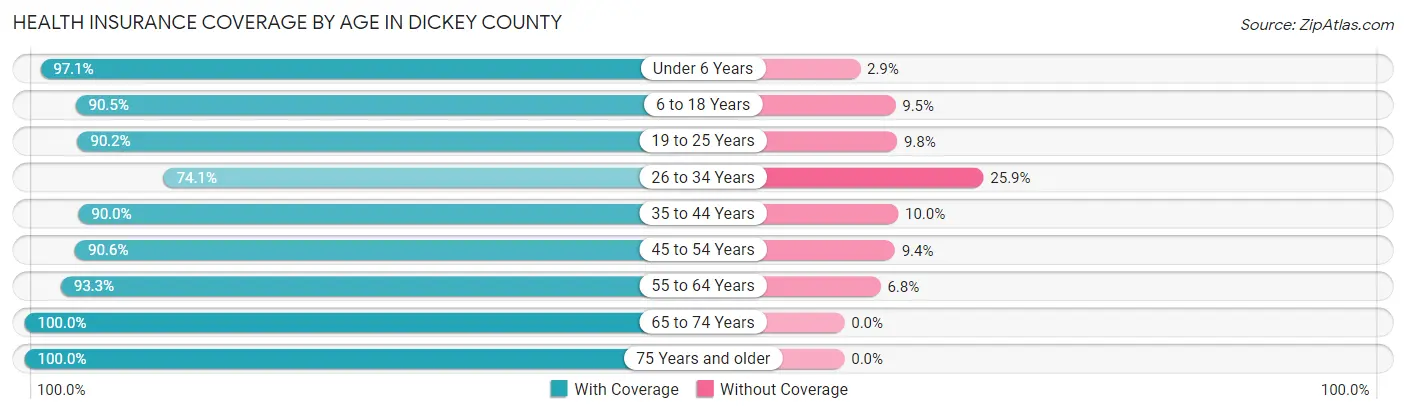
| Age Bracket | With Coverage | Without Coverage |
| Under 6 Years | 331 (97.1%) | 10 (2.9%) |
| 6 to 18 Years | 951 (90.5%) | 100 (9.5%) |
| 19 to 25 Years | 422 (90.2%) | 46 (9.8%) |
| 26 to 34 Years | 337 (74.1%) | 118 (25.9%) |
| 35 to 44 Years | 458 (90.0%) | 51 (10.0%) |
| 45 to 54 Years | 491 (90.6%) | 51 (9.4%) |
| 55 to 64 Years | 608 (93.2%) | 44 (6.8%) |
| 65 to 74 Years | 503 (100.0%) | 0 (0.0%) |
| 75 Years and older | 339 (100.0%) | 0 (0.0%) |
| Total | 4,440 (91.4%) | 420 (8.6%) |
Health Insurance Coverage by Citizenship Status in Dickey County
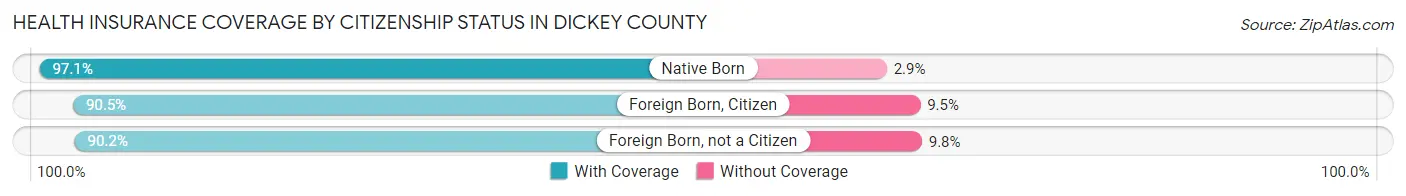
| Citizenship Status | With Coverage | Without Coverage |
| Native Born | 331 (97.1%) | 10 (2.9%) |
| Foreign Born, Citizen | 951 (90.5%) | 100 (9.5%) |
| Foreign Born, not a Citizen | 422 (90.2%) | 46 (9.8%) |
Health Insurance Coverage by Household Income in Dickey County
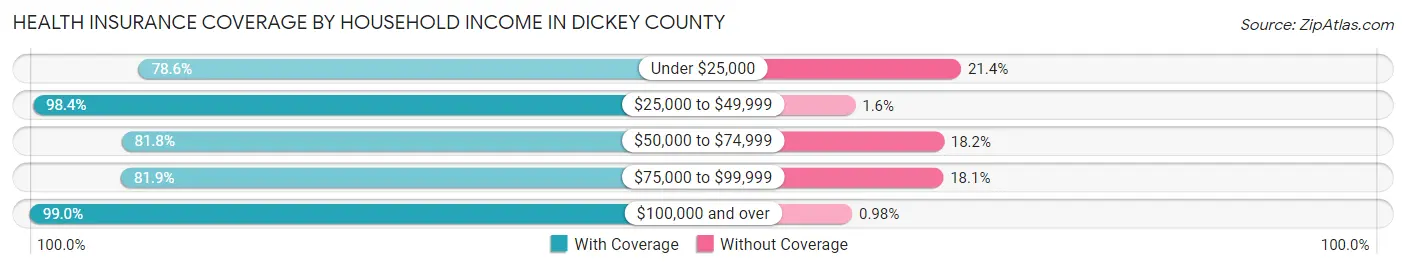
| Household Income | With Coverage | Without Coverage |
| Under $25,000 | 327 (78.6%) | 89 (21.4%) |
| $25,000 to $49,999 | 806 (98.4%) | 13 (1.6%) |
| $50,000 to $74,999 | 581 (81.8%) | 129 (18.2%) |
| $75,000 to $99,999 | 662 (81.9%) | 146 (18.1%) |
| $100,000 and over | 1,911 (99.0%) | 19 (1.0%) |
Public vs Private Health Insurance Coverage by Age in Dickey County
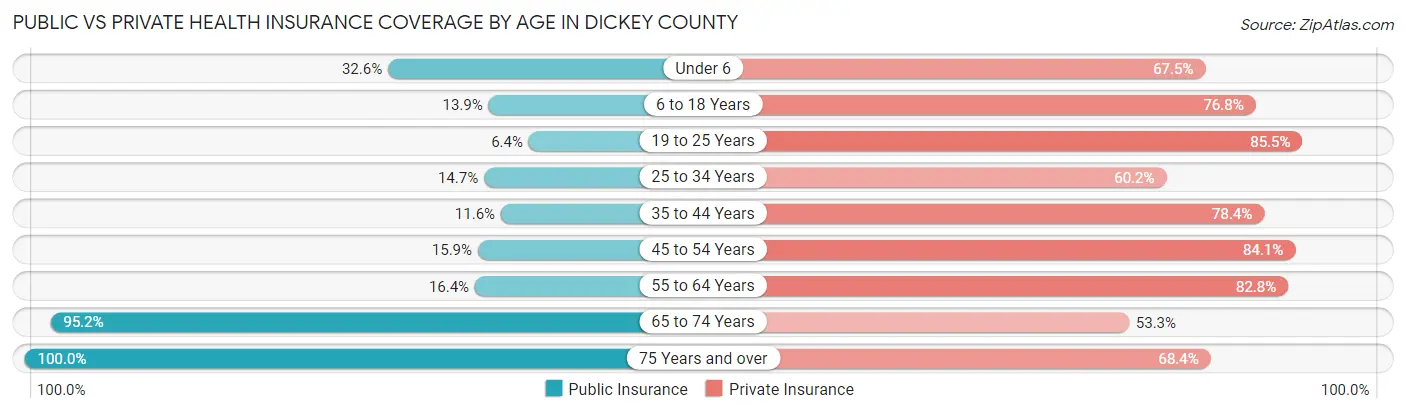
| Age Bracket | Public Insurance | Private Insurance |
| Under 6 | 111 (32.6%) | 230 (67.4%) |
| 6 to 18 Years | 146 (13.9%) | 807 (76.8%) |
| 19 to 25 Years | 30 (6.4%) | 400 (85.5%) |
| 25 to 34 Years | 67 (14.7%) | 274 (60.2%) |
| 35 to 44 Years | 59 (11.6%) | 399 (78.4%) |
| 45 to 54 Years | 86 (15.9%) | 456 (84.1%) |
| 55 to 64 Years | 107 (16.4%) | 540 (82.8%) |
| 65 to 74 Years | 479 (95.2%) | 268 (53.3%) |
| 75 Years and over | 339 (100.0%) | 232 (68.4%) |
| Total | 1,424 (29.3%) | 3,606 (74.2%) |
Disability Status by Sex by Age in Dickey County
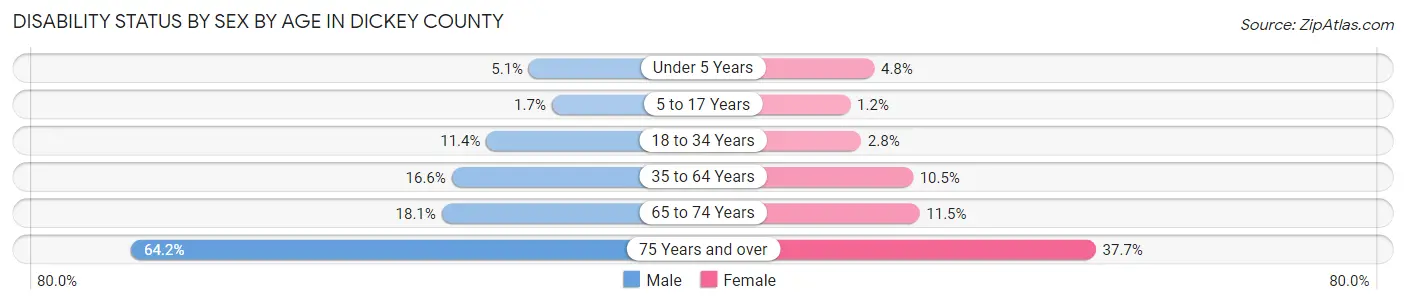
| Age Bracket | Male | Female |
| Under 5 Years | 7 (5.1%) | 8 (4.8%) |
| 5 to 17 Years | 8 (1.7%) | 6 (1.2%) |
| 18 to 34 Years | 61 (11.4%) | 15 (2.8%) |
| 35 to 64 Years | 147 (16.6%) | 86 (10.5%) |
| 65 to 74 Years | 47 (18.1%) | 28 (11.5%) |
| 75 Years and over | 95 (64.2%) | 72 (37.7%) |
Disability Class by Sex by Age in Dickey County
Disability Class: Hearing Difficulty
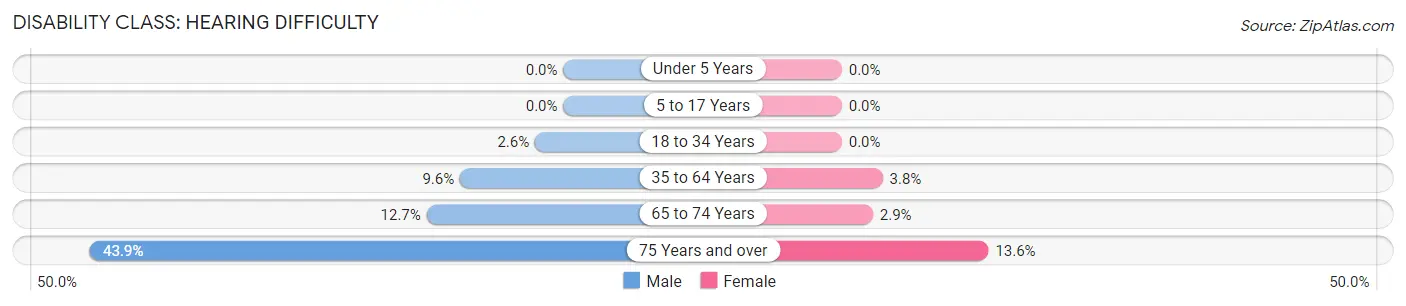
| Age Bracket | Male | Female |
| Under 5 Years | 0 (0.0%) | 0 (0.0%) |
| 5 to 17 Years | 0 (0.0%) | 0 (0.0%) |
| 18 to 34 Years | 14 (2.6%) | 0 (0.0%) |
| 35 to 64 Years | 85 (9.6%) | 31 (3.8%) |
| 65 to 74 Years | 33 (12.7%) | 7 (2.9%) |
| 75 Years and over | 65 (43.9%) | 26 (13.6%) |
Disability Class: Vision Difficulty
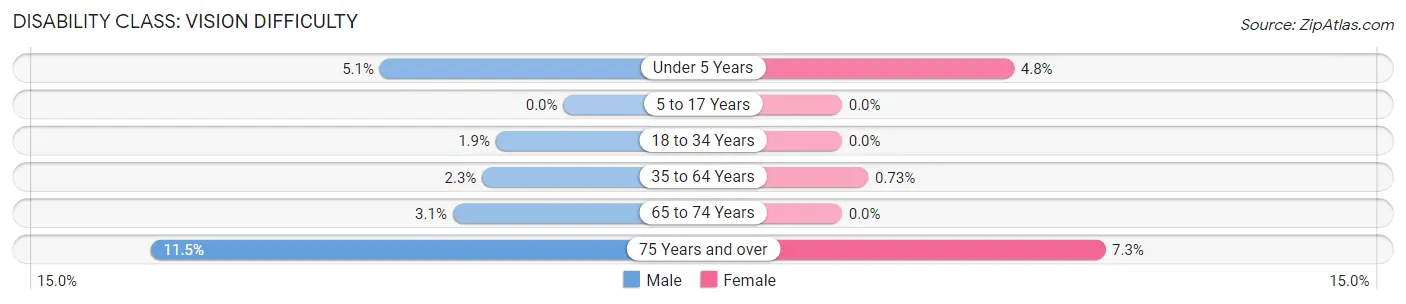
| Age Bracket | Male | Female |
| Under 5 Years | 7 (5.1%) | 8 (4.8%) |
| 5 to 17 Years | 0 (0.0%) | 0 (0.0%) |
| 18 to 34 Years | 10 (1.9%) | 0 (0.0%) |
| 35 to 64 Years | 20 (2.3%) | 6 (0.7%) |
| 65 to 74 Years | 8 (3.1%) | 0 (0.0%) |
| 75 Years and over | 17 (11.5%) | 14 (7.3%) |
Disability Class: Cognitive Difficulty
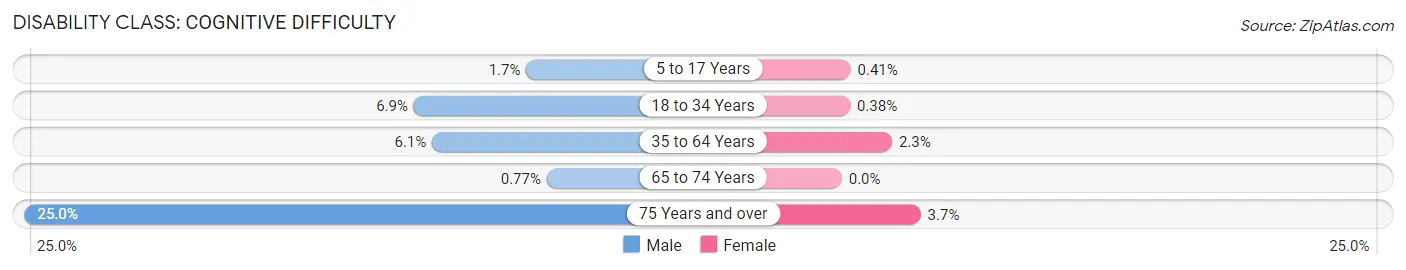
| Age Bracket | Male | Female |
| 5 to 17 Years | 8 (1.7%) | 2 (0.4%) |
| 18 to 34 Years | 37 (6.9%) | 2 (0.4%) |
| 35 to 64 Years | 54 (6.1%) | 19 (2.3%) |
| 65 to 74 Years | 2 (0.8%) | 0 (0.0%) |
| 75 Years and over | 37 (25.0%) | 7 (3.7%) |
Disability Class: Ambulatory Difficulty
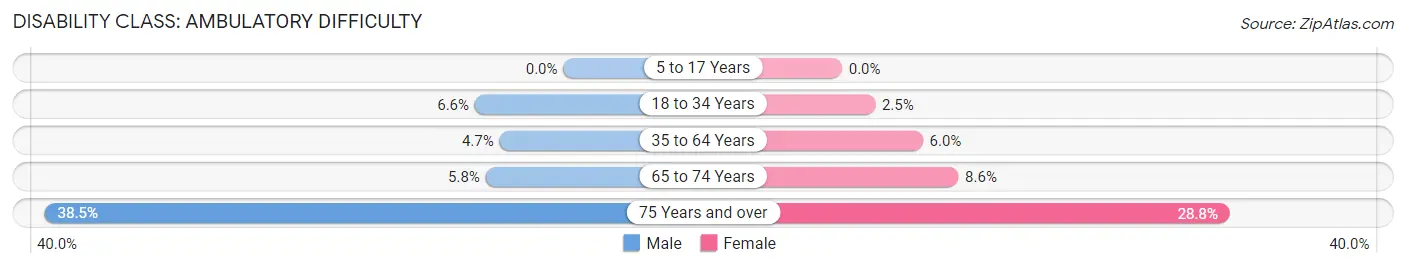
| Age Bracket | Male | Female |
| 5 to 17 Years | 0 (0.0%) | 0 (0.0%) |
| 18 to 34 Years | 35 (6.6%) | 13 (2.5%) |
| 35 to 64 Years | 42 (4.7%) | 49 (6.0%) |
| 65 to 74 Years | 15 (5.8%) | 21 (8.6%) |
| 75 Years and over | 57 (38.5%) | 55 (28.8%) |
Disability Class: Self-Care Difficulty
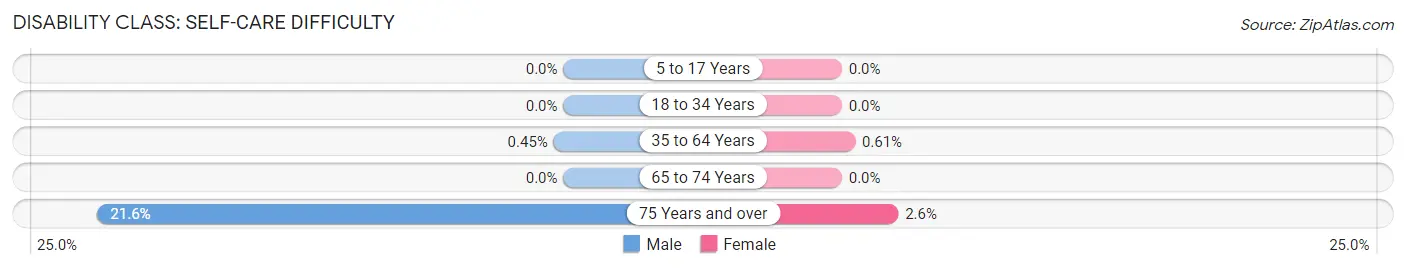
| Age Bracket | Male | Female |
| 5 to 17 Years | 0 (0.0%) | 0 (0.0%) |
| 18 to 34 Years | 0 (0.0%) | 0 (0.0%) |
| 35 to 64 Years | 4 (0.4%) | 5 (0.6%) |
| 65 to 74 Years | 0 (0.0%) | 0 (0.0%) |
| 75 Years and over | 32 (21.6%) | 5 (2.6%) |
Technology Access in Dickey County
Computing Device Access in Dickey County
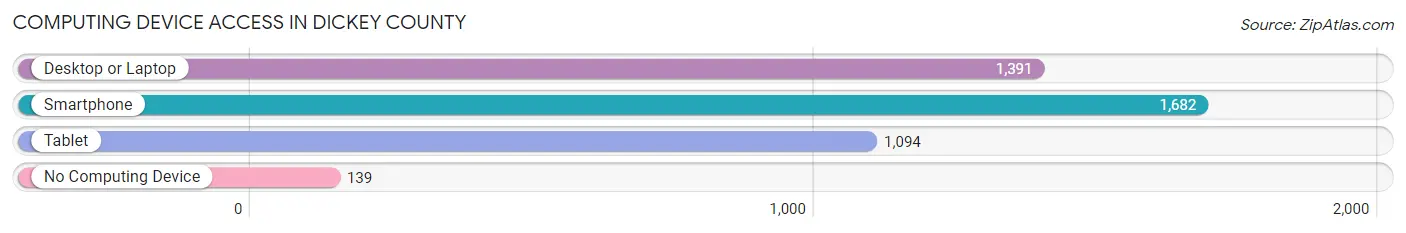
| Device Type | # Households | % Households |
| Desktop or Laptop | 1,391 | 72.6% |
| Smartphone | 1,682 | 87.8% |
| Tablet | 1,094 | 57.1% |
| No Computing Device | 139 | 7.2% |
| Total | 1,916 | 100.0% |
Internet Access in Dickey County
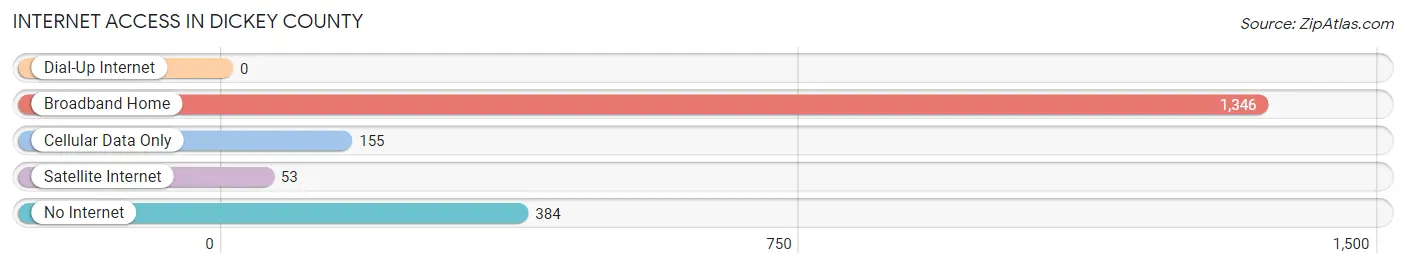
| Internet Type | # Households | % Households |
| Dial-Up Internet | 0 | 0.0% |
| Broadband Home | 1,346 | 70.3% |
| Cellular Data Only | 155 | 8.1% |
| Satellite Internet | 53 | 2.8% |
| No Internet | 384 | 20.0% |
| Total | 1,916 | 100.0% |
Dickey County Summary
Dickey County is located in the southeastern corner of North Dakota, and is bordered by South Dakota to the south, and Minnesota to the east. It is part of the James River Valley region, and is the only county in the state to be completely surrounded by other states. The county seat is Ellendale, and the county was named after James W. Dickey, a former North Dakota Supreme Court Justice.
Geography
Dickey County covers an area of 1,068 square miles, and is the fourth largest county in North Dakota. The terrain is mostly flat, with some rolling hills in the western part of the county. The James River flows through the county, and there are several small lakes and ponds scattered throughout the area. The county is mostly rural, with a few small towns and villages. The largest town is Ellendale, with a population of 1,845 in 2010.
Climate
Dickey County has a humid continental climate, with cold winters and hot summers. The average annual temperature is 45°F, and the average annual precipitation is 22 inches. The county is prone to severe weather, including tornadoes, thunderstorms, and blizzards.
Demographics
As of the 2010 census, there were 5,289 people, 2,093 households, and 1,420 families living in Dickey County. The population density was 4.9 people per square mile. The racial makeup of the county was 97.3% White, 0.3% African American, 0.3% Native American, 0.2% Asian, 0.1% Pacific Islander, 0.7% from other races, and 0.9% from two or more races. Hispanic or Latino of any race were 1.7% of the population.
Economy
The economy of Dickey County is largely based on agriculture. The county is home to several large farms, and the main crops grown are wheat, corn, soybeans, and sunflowers. The county also has a large dairy industry, and is home to several cheese factories. Other industries in the county include manufacturing, retail, and tourism.
The county is served by several state and federal highways, and is home to the Ellendale Municipal Airport. The county is also served by several railroads, and is home to the Ellendale Industrial Park.
Conclusion
Dickey County is a rural county located in the southeastern corner of North Dakota. It is bordered by South Dakota to the south, and Minnesota to the east. The county is mostly rural, with a few small towns and villages. The economy is largely based on agriculture, and the county is served by several state and federal highways, and railroads. The county is also home to the Ellendale Municipal Airport, and the Ellendale Industrial Park.
Common Questions
What is the Total Population of Dickey County?
Total Population of Dickey County is 5,003.
What is the Total Male Population of Dickey County?
Total Male Population of Dickey County is 2,497.
What is the Total Female Population of Dickey County?
Total Female Population of Dickey County is 2,506.
What is the Ratio of Males per 100 Females in Dickey County?
There are 99.64 Males per 100 Females in Dickey County.
What is the Ratio of Females per 100 Males in Dickey County?
There are 100.36 Females per 100 Males in Dickey County.
What is the Median Population Age in Dickey County?
Median Population Age in Dickey County is 38.1 Years.
What is the Average Family Size in Dickey County
Average Family Size in Dickey County is 3.2 People.
What is the Average Household Size in Dickey County
Average Household Size in Dickey County is 2.5 People.
What is Per Capita Income in Dickey County?
Per Capita income in Dickey County is $35,649.
What is the Median Family Income in Dickey County?
Median Family Income in Dickey County is $88,906.
What is the Median Household income in Dickey County?
Median Household Income in Dickey County is $60,250.
What is Income or Wage Gap in Dickey County?
Income or Wage Gap in Dickey County is 45.7%.
Women in Dickey County earn 54.3 cents for every dollar earned by a man.
What is Inequality or Gini Index in Dickey County?
Inequality or Gini Index in Dickey County is 0.47.
How Large is the Labor Force in Dickey County?
There are 2,626 People in the Labor Forcein in Dickey County.
What is the Percentage of People in the Labor Force in Dickey County?
67.0% of People are in the Labor Force in Dickey County.
What is the Unemployment Rate in Dickey County?
Unemployment Rate in Dickey County is 3.1%.