Cass County, ND
Cass County Map
Cass County Overview
186,328
TOTAL POPULATION
94,537
MALE POPULATION
91,791
FEMALE POPULATION
102.99
MALES / 100 FEMALES
97.10
FEMALES / 100 MALES
32.7
MEDIAN AGE
3.0
AVG FAMILY SIZE
2.3
AVG HOUSEHOLD SIZE
$43,474
PER CAPITA INCOME
$104,847
AVG FAMILY INCOME
$73,249
AVG HOUSEHOLD INCOME
22.4%
WAGE / INCOME GAP [ % ]
77.6¢/ $1
WAGE / INCOME GAP [ $ ]
$9,600
FAMILY INCOME DEFICIT
0.47
INEQUALITY / GINI INDEX
113,159
LABOR FORCE [ PEOPLE ]
76.0%
PERCENT IN LABOR FORCE
2.8%
UNEMPLOYMENT RATE
Cass County Area Codes
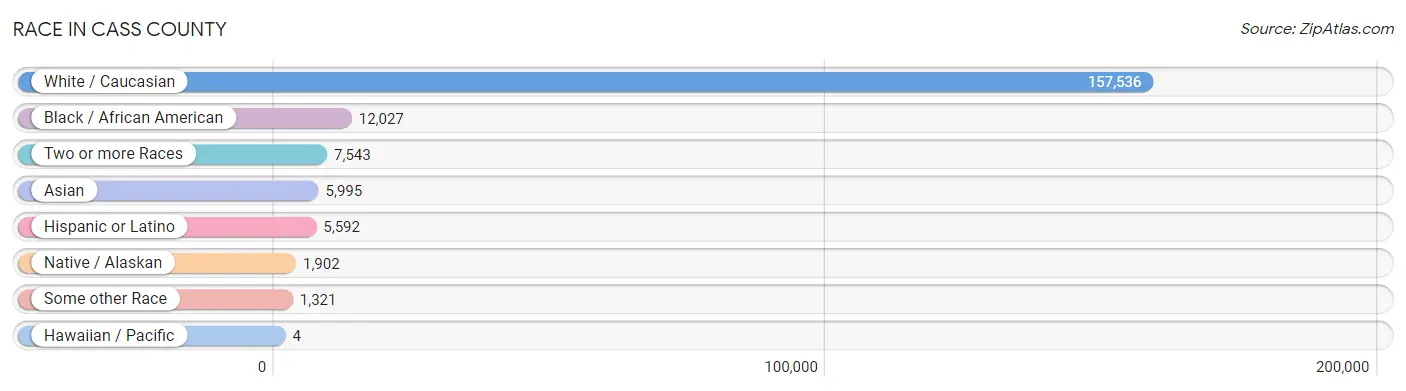
Race in Cass County
The most populous races in Cass County are White / Caucasian (157,536 | 84.6%), Black / African American (12,027 | 6.5%), and Two or more Races (7,543 | 4.1%).
| Race | # Population | % Population |
| Asian | 5,995 | 3.2% |
| Black / African American | 12,027 | 6.5% |
| Hawaiian / Pacific | 4 | 0.0% |
| Hispanic or Latino | 5,592 | 3.0% |
| Native / Alaskan | 1,902 | 1.0% |
| White / Caucasian | 157,536 | 84.6% |
| Two or more Races | 7,543 | 4.1% |
| Some other Race | 1,321 | 0.7% |
| Total | 186,328 | 100.0% |
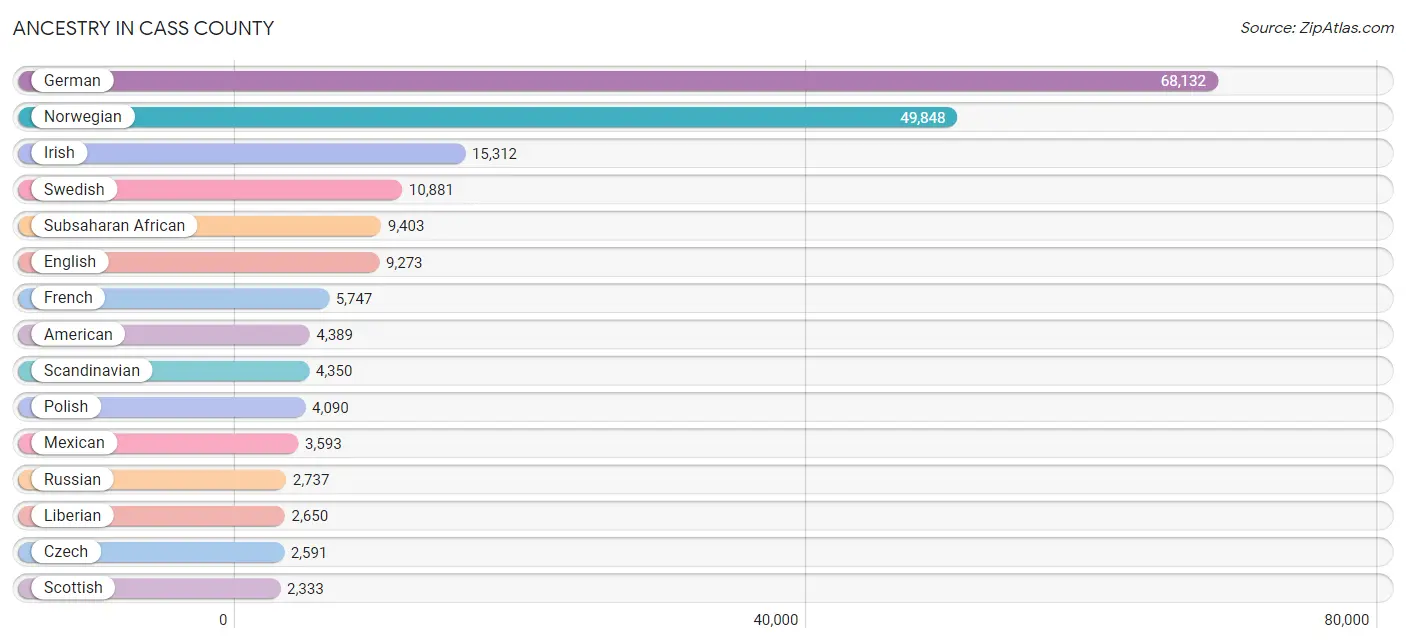
Ancestry in Cass County
The most populous ancestries reported in Cass County are German (68,132 | 36.6%), Norwegian (49,848 | 26.8%), Irish (15,312 | 8.2%), Swedish (10,881 | 5.8%), and Subsaharan African (9,403 | 5.1%), together accounting for 82.4% of all Cass County residents.
| Ancestry | # Population | % Population |
| Afghan | 415 | 0.2% |
| African | 2,154 | 1.2% |
| Alaska Native | 17 | 0.0% |
| Albanian | 96 | 0.1% |
| American | 4,389 | 2.4% |
| Apache | 13 | 0.0% |
| Arab | 1,263 | 0.7% |
| Arapaho | 5 | 0.0% |
| Argentinean | 25 | 0.0% |
| Armenian | 20 | 0.0% |
| Australian | 24 | 0.0% |
| Austrian | 317 | 0.2% |
| Bahamian | 1 | 0.0% |
| Bangladeshi | 9 | 0.0% |
| Belgian | 267 | 0.1% |
| Bhutanese | 239 | 0.1% |
| Blackfeet | 33 | 0.0% |
| Brazilian | 88 | 0.1% |
| British | 525 | 0.3% |
| Bulgarian | 121 | 0.1% |
| Burmese | 1,280 | 0.7% |
| Cambodian | 62 | 0.0% |
| Canadian | 84 | 0.1% |
| Celtic | 17 | 0.0% |
| Central American | 238 | 0.1% |
| Central American Indian | 26 | 0.0% |
| Cherokee | 104 | 0.1% |
| Cheyenne | 36 | 0.0% |
| Chilean | 20 | 0.0% |
| Chippewa | 1,456 | 0.8% |
| Colombian | 99 | 0.1% |
| Cree | 5 | 0.0% |
| Croatian | 144 | 0.1% |
| Crow | 92 | 0.1% |
| Cuban | 23 | 0.0% |
| Czech | 2,591 | 1.4% |
| Czechoslovakian | 278 | 0.2% |
| Danish | 2,048 | 1.1% |
| Dominican | 11 | 0.0% |
| Dutch | 1,681 | 0.9% |
| Eastern European | 230 | 0.1% |
| Ecuadorian | 4 | 0.0% |
| Egyptian | 142 | 0.1% |
| English | 9,273 | 5.0% |
| Estonian | 10 | 0.0% |
| European | 1,495 | 0.8% |
| Filipino | 72 | 0.0% |
| Finnish | 1,371 | 0.7% |
| French | 5,747 | 3.1% |
| French American Indian | 30 | 0.0% |
| French Canadian | 1,213 | 0.6% |
| German | 68,132 | 36.6% |
| German Russian | 462 | 0.3% |
| Ghanaian | 96 | 0.1% |
| Greek | 103 | 0.1% |
| Guatemalan | 96 | 0.1% |
| Haitian | 75 | 0.0% |
| Honduran | 107 | 0.1% |
| Hungarian | 165 | 0.1% |
| Icelander | 582 | 0.3% |
| Indian (Asian) | 954 | 0.5% |
| Inupiat | 74 | 0.0% |
| Iranian | 106 | 0.1% |
| Iraqi | 10 | 0.0% |
| Irish | 15,312 | 8.2% |
| Iroquois | 81 | 0.0% |
| Italian | 2,006 | 1.1% |
| Jamaican | 144 | 0.1% |
| Japanese | 124 | 0.1% |
| Kenyan | 716 | 0.4% |
| Korean | 992 | 0.5% |
| Latvian | 8 | 0.0% |
| Lebanese | 243 | 0.1% |
| Liberian | 2,650 | 1.4% |
| Lithuanian | 23 | 0.0% |
| Lumbee | 18 | 0.0% |
| Luxembourger | 303 | 0.2% |
| Malaysian | 51 | 0.0% |
| Mexican | 3,593 | 1.9% |
| Mexican American Indian | 29 | 0.0% |
| Moroccan | 15 | 0.0% |
| Native Hawaiian | 18 | 0.0% |
| Nigerian | 934 | 0.5% |
| Northern European | 355 | 0.2% |
| Norwegian | 49,848 | 26.8% |
| Pakistani | 82 | 0.0% |
| Pennsylvania German | 54 | 0.0% |
| Peruvian | 46 | 0.0% |
| Polish | 4,090 | 2.2% |
| Portuguese | 75 | 0.0% |
| Potawatomi | 45 | 0.0% |
| Puerto Rican | 744 | 0.4% |
| Romanian | 163 | 0.1% |
| Russian | 2,737 | 1.5% |
| Salvadoran | 35 | 0.0% |
| Scandinavian | 4,350 | 2.3% |
| Scotch-Irish | 832 | 0.4% |
| Scottish | 2,333 | 1.3% |
| Senegalese | 51 | 0.0% |
| Serbian | 11 | 0.0% |
| Sierra Leonean | 4 | 0.0% |
| Sioux | 1,547 | 0.8% |
| Slavic | 3 | 0.0% |
| Slovak | 117 | 0.1% |
| Slovene | 252 | 0.1% |
| Somali | 1,183 | 0.6% |
| South African | 206 | 0.1% |
| South American | 206 | 0.1% |
| Spaniard | 364 | 0.2% |
| Spanish | 98 | 0.1% |
| Sri Lankan | 515 | 0.3% |
| Subsaharan African | 9,403 | 5.1% |
| Sudanese | 94 | 0.1% |
| Swedish | 10,881 | 5.8% |
| Swiss | 476 | 0.3% |
| Syrian | 233 | 0.1% |
| Thai | 1,400 | 0.7% |
| Tlingit-Haida | 5 | 0.0% |
| Turkish | 3 | 0.0% |
| Ukrainian | 751 | 0.4% |
| Ute | 1 | 0.0% |
| Vietnamese | 121 | 0.1% |
| Welsh | 634 | 0.3% |
| Yugoslavian | 482 | 0.3% |
| Zimbabwean | 2 | 0.0% | View All 125 Rows |
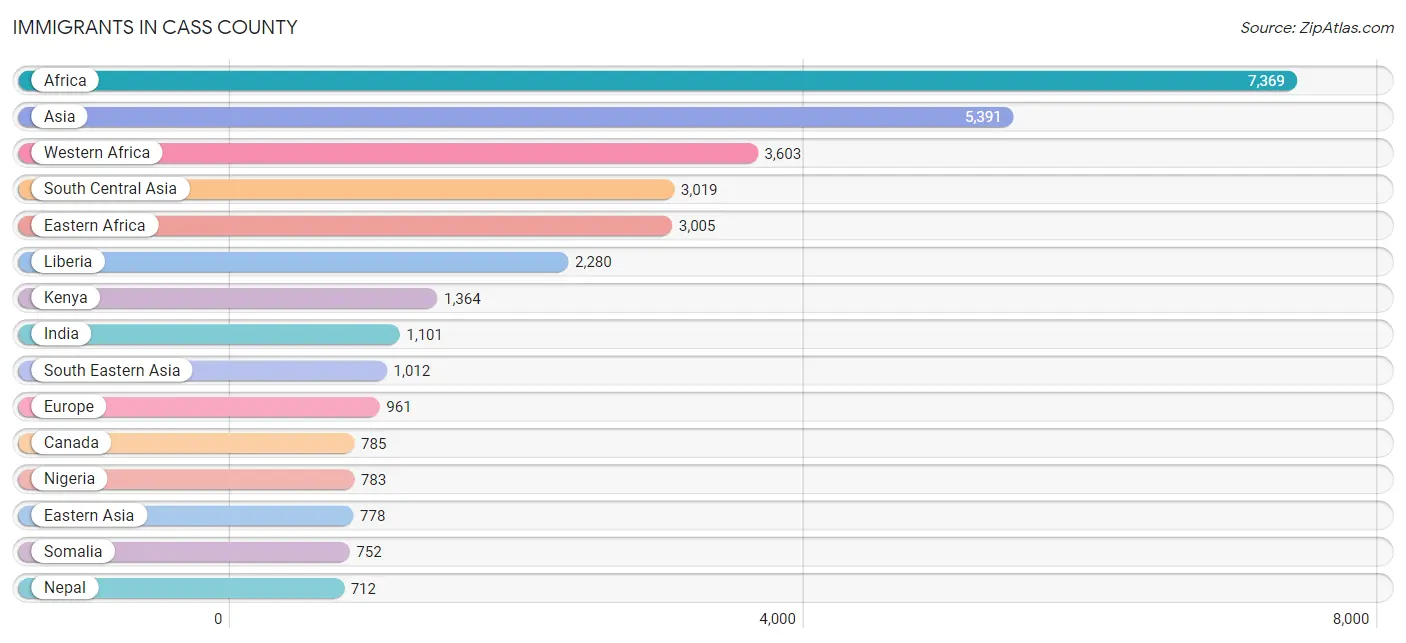
Immigrants in Cass County
The most numerous immigrant groups reported in Cass County came from Africa (7,369 | 4.0%), Asia (5,391 | 2.9%), Western Africa (3,603 | 1.9%), South Central Asia (3,019 | 1.6%), and Eastern Africa (3,005 | 1.6%), together accounting for 12.0% of all Cass County residents.
| Immigration Origin | # Population | % Population |
| Afghanistan | 303 | 0.2% |
| Africa | 7,369 | 4.0% |
| Argentina | 17 | 0.0% |
| Asia | 5,391 | 2.9% |
| Australia | 23 | 0.0% |
| Austria | 50 | 0.0% |
| Bangladesh | 129 | 0.1% |
| Belarus | 12 | 0.0% |
| Bosnia and Herzegovina | 322 | 0.2% |
| Brazil | 73 | 0.0% |
| Bulgaria | 27 | 0.0% |
| Cameroon | 3 | 0.0% |
| Canada | 785 | 0.4% |
| Caribbean | 107 | 0.1% |
| Central America | 340 | 0.2% |
| Chile | 9 | 0.0% |
| China | 279 | 0.2% |
| Colombia | 52 | 0.0% |
| Congo | 156 | 0.1% |
| Denmark | 7 | 0.0% |
| Eastern Africa | 3,005 | 1.6% |
| Eastern Asia | 778 | 0.4% |
| Eastern Europe | 602 | 0.3% |
| Egypt | 44 | 0.0% |
| England | 5 | 0.0% |
| Eritrea | 50 | 0.0% |
| Ethiopia | 26 | 0.0% |
| Europe | 961 | 0.5% |
| France | 13 | 0.0% |
| Germany | 47 | 0.0% |
| Ghana | 177 | 0.1% |
| Greece | 37 | 0.0% |
| Guatemala | 56 | 0.0% |
| Haiti | 25 | 0.0% |
| Honduras | 35 | 0.0% |
| India | 1,101 | 0.6% |
| Iran | 75 | 0.0% |
| Iraq | 209 | 0.1% |
| Ireland | 3 | 0.0% |
| Israel | 19 | 0.0% |
| Italy | 9 | 0.0% |
| Jamaica | 80 | 0.0% |
| Japan | 183 | 0.1% |
| Jordan | 20 | 0.0% |
| Kazakhstan | 8 | 0.0% |
| Kenya | 1,364 | 0.7% |
| Korea | 295 | 0.2% |
| Laos | 39 | 0.0% |
| Latin America | 644 | 0.4% |
| Liberia | 2,280 | 1.2% |
| Malaysia | 8 | 0.0% |
| Mexico | 249 | 0.1% |
| Middle Africa | 303 | 0.2% |
| Morocco | 15 | 0.0% |
| Nepal | 712 | 0.4% |
| Nigeria | 783 | 0.4% |
| Northern Africa | 289 | 0.2% |
| Northern Europe | 119 | 0.1% |
| Norway | 18 | 0.0% |
| Oceania | 50 | 0.0% |
| Pakistan | 120 | 0.1% |
| Peru | 46 | 0.0% |
| Philippines | 548 | 0.3% |
| Romania | 76 | 0.0% |
| Russia | 83 | 0.0% |
| Serbia | 12 | 0.0% |
| Sierra Leone | 53 | 0.0% |
| Somalia | 752 | 0.4% |
| South Africa | 16 | 0.0% |
| South America | 197 | 0.1% |
| South Central Asia | 3,019 | 1.6% |
| South Eastern Asia | 1,012 | 0.5% |
| Southern Europe | 130 | 0.1% |
| Spain | 84 | 0.1% |
| Sri Lanka | 62 | 0.0% |
| Sudan | 218 | 0.1% |
| Syria | 183 | 0.1% |
| Taiwan | 56 | 0.0% |
| Thailand | 62 | 0.0% |
| Trinidad and Tobago | 2 | 0.0% |
| Uganda | 85 | 0.1% |
| Ukraine | 5 | 0.0% |
| Vietnam | 355 | 0.2% |
| Western Africa | 3,603 | 1.9% |
| Western Asia | 582 | 0.3% |
| Western Europe | 110 | 0.1% |
| Yemen | 65 | 0.0% |
| Zaire | 144 | 0.1% |
| Zimbabwe | 2 | 0.0% | View All 89 Rows |
Sex and Age in Cass County
Sex and Age in Cass County
The most populous age groups in Cass County are 20 to 24 Years (10,120 | 10.7%) for men and 20 to 24 Years (10,021 | 10.9%) for women.
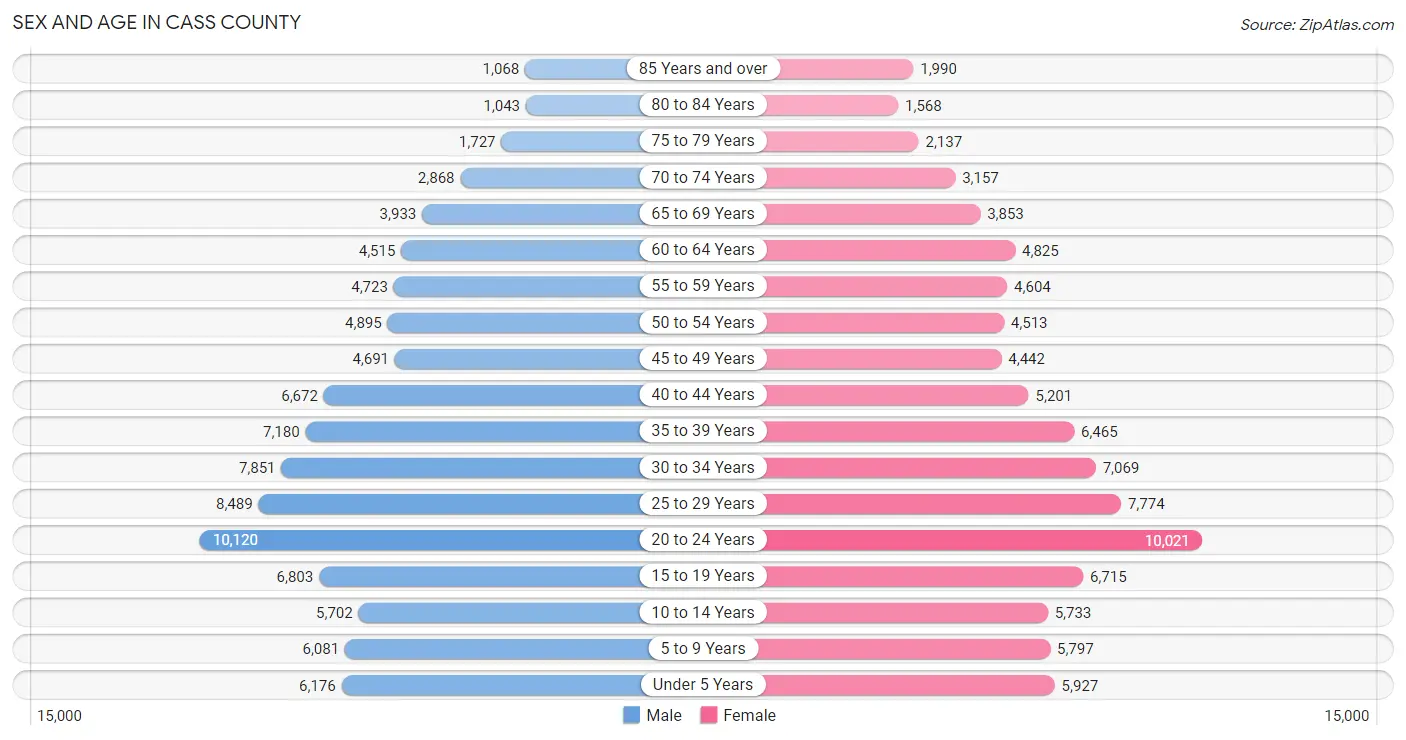
| Age Bracket | Male | Female |
| Under 5 Years | 6,176 (6.5%) | 5,927 (6.5%) |
| 5 to 9 Years | 6,081 (6.4%) | 5,797 (6.3%) |
| 10 to 14 Years | 5,702 (6.0%) | 5,733 (6.2%) |
| 15 to 19 Years | 6,803 (7.2%) | 6,715 (7.3%) |
| 20 to 24 Years | 10,120 (10.7%) | 10,021 (10.9%) |
| 25 to 29 Years | 8,489 (9.0%) | 7,774 (8.5%) |
| 30 to 34 Years | 7,851 (8.3%) | 7,069 (7.7%) |
| 35 to 39 Years | 7,180 (7.6%) | 6,465 (7.0%) |
| 40 to 44 Years | 6,672 (7.1%) | 5,201 (5.7%) |
| 45 to 49 Years | 4,691 (5.0%) | 4,442 (4.8%) |
| 50 to 54 Years | 4,895 (5.2%) | 4,513 (4.9%) |
| 55 to 59 Years | 4,723 (5.0%) | 4,604 (5.0%) |
| 60 to 64 Years | 4,515 (4.8%) | 4,825 (5.3%) |
| 65 to 69 Years | 3,933 (4.2%) | 3,853 (4.2%) |
| 70 to 74 Years | 2,868 (3.0%) | 3,157 (3.4%) |
| 75 to 79 Years | 1,727 (1.8%) | 2,137 (2.3%) |
| 80 to 84 Years | 1,043 (1.1%) | 1,568 (1.7%) |
| 85 Years and over | 1,068 (1.1%) | 1,990 (2.2%) |
| Total | 94,537 (100.0%) | 91,791 (100.0%) |
Families and Households in Cass County
Median Family Size in Cass County
The median family size in Cass County is 2.99 persons per family, with married-couple families (35,061 | 80.2%) accounting for the largest median family size of 3.04 persons per family. On the other hand, single male/father families (2,577 | 5.9%) represent the smallest median family size with 2.75 persons per family.
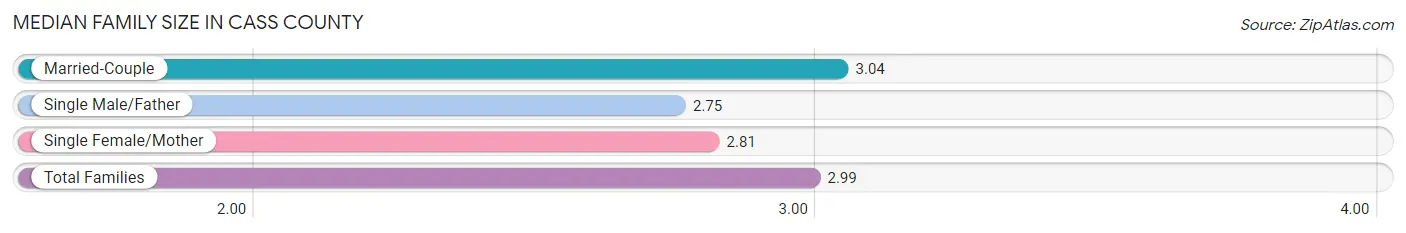
| Family Type | # Families | Family Size |
| Married-Couple | 35,061 (80.2%) | 3.04 |
| Single Male/Father | 2,577 (5.9%) | 2.75 |
| Single Female/Mother | 6,100 (14.0%) | 2.81 |
| Total Families | 43,738 (100.0%) | 2.99 |
Median Household Size in Cass County
The median household size in Cass County is 2.27 persons per household, with single male/father households (2,577 | 3.2%) accounting for the largest median household size of 3.13 persons per household. non-family households (35,767 | 45.0%) represent the smallest median household size with 1.31 persons per household.
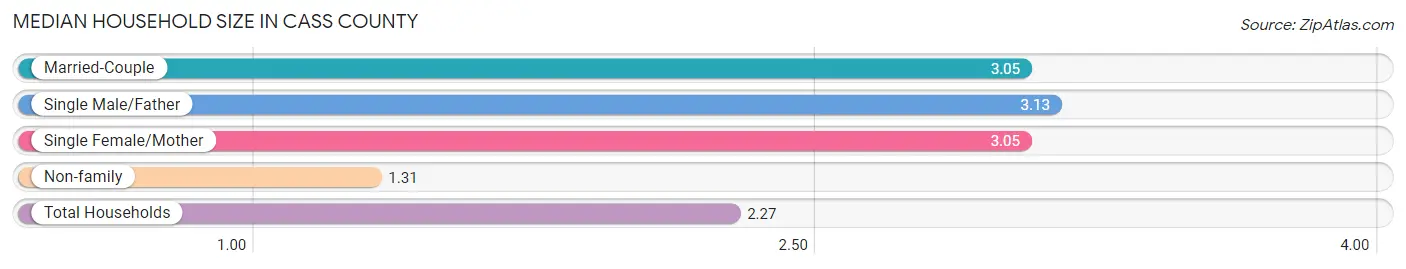
| Household Type | # Households | Household Size |
| Married-Couple | 35,061 (44.1%) | 3.05 |
| Single Male/Father | 2,577 (3.2%) | 3.13 |
| Single Female/Mother | 6,100 (7.7%) | 3.05 |
| Non-family | 35,767 (45.0%) | 1.31 |
| Total Households | 79,505 (100.0%) | 2.27 |
Household Size by Marriage Status in Cass County
Out of a total of 79,505 households in Cass County, 43,738 (55.0%) are family households, while 35,767 (45.0%) are nonfamily households. The most numerous type of family households are 2-person households, comprising 20,831, and the most common type of nonfamily households are 1-person households, comprising 27,290.
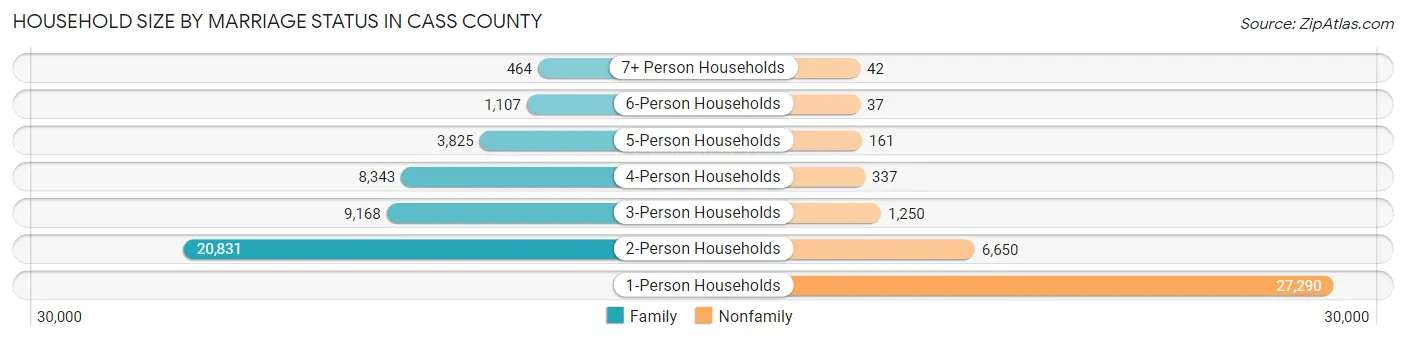
| Household Size | Family Households | Nonfamily Households |
| 1-Person Households | - | 27,290 (34.3%) |
| 2-Person Households | 20,831 (26.2%) | 6,650 (8.4%) |
| 3-Person Households | 9,168 (11.5%) | 1,250 (1.6%) |
| 4-Person Households | 8,343 (10.5%) | 337 (0.4%) |
| 5-Person Households | 3,825 (4.8%) | 161 (0.2%) |
| 6-Person Households | 1,107 (1.4%) | 37 (0.1%) |
| 7+ Person Households | 464 (0.6%) | 42 (0.1%) |
| Total | 43,738 (55.0%) | 35,767 (45.0%) |
Female Fertility in Cass County
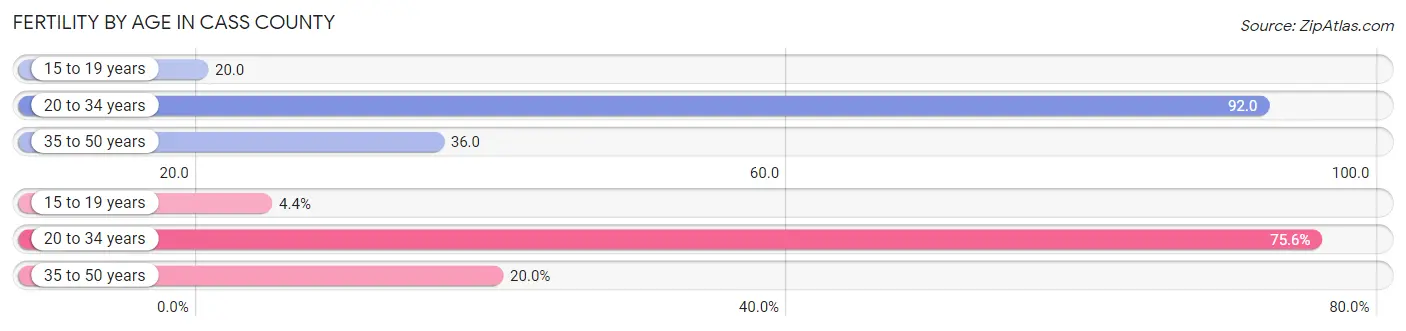
Fertility by Age in Cass County
Average fertility rate in Cass County is 62.0 births per 1,000 women. Women in the age bracket of 20 to 34 years have the highest fertility rate with 92.0 births per 1,000 women. Women in the age bracket of 20 to 34 years acount for 75.6% of all women with births.
| Age Bracket | Women with Births | Births / 1,000 Women |
| 15 to 19 years | 131 (4.3%) | 20.0 |
| 20 to 34 years | 2,277 (75.6%) | 92.0 |
| 35 to 50 years | 603 (20.0%) | 36.0 |
| Total | 3,011 (100.0%) | 62.0 |
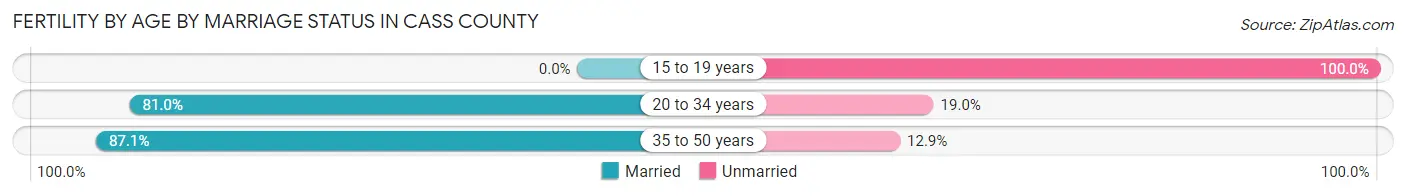
Fertility by Age by Marriage Status in Cass County
78.7% of women with births (3,011) in Cass County are married. The highest percentage of unmarried women with births falls into 15 to 19 years age bracket with 100.0% of them unmarried at the time of birth, while the lowest percentage of unmarried women with births belong to 35 to 50 years age bracket with 12.9% of them unmarried.
| Age Bracket | Married | Unmarried |
| 15 to 19 years | 0 (0.0%) | 131 (100.0%) |
| 20 to 34 years | 1,844 (81.0%) | 433 (19.0%) |
| 35 to 50 years | 525 (87.1%) | 78 (12.9%) |
| Total | 2,370 (78.7%) | 641 (21.3%) |
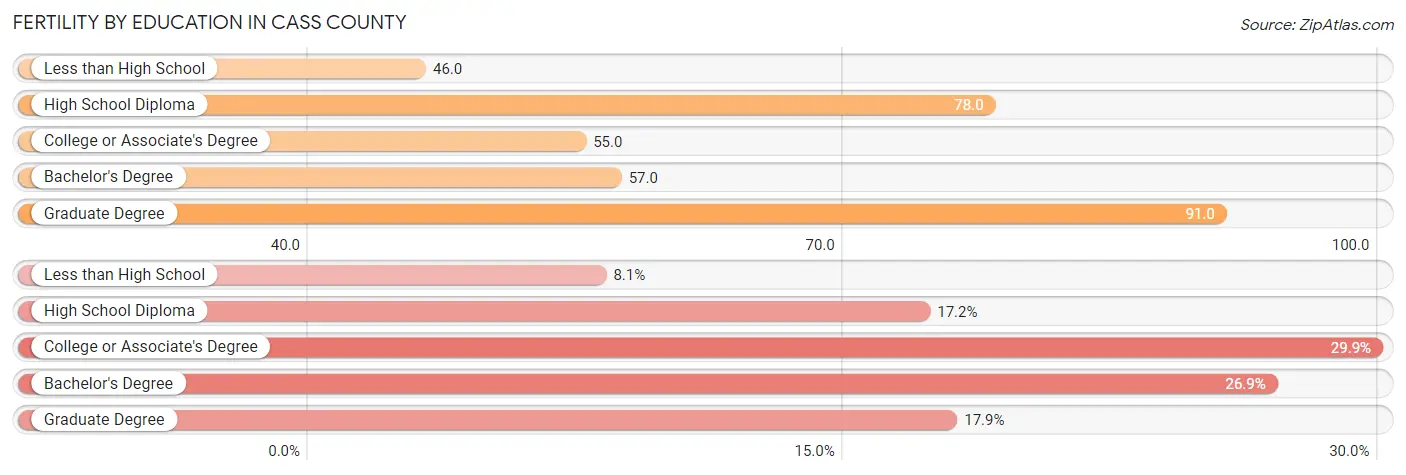
Fertility by Education in Cass County
Average fertility rate in Cass County is 62.0 births per 1,000 women. Women with the education attainment of graduate degree have the highest fertility rate of 91.0 births per 1,000 women, while women with the education attainment of less than high school have the lowest fertility at 46.0 births per 1,000 women. Women with the education attainment of college or associate's degree represent 29.9% of all women with births.
| Educational Attainment | Women with Births | Births / 1,000 Women |
| Less than High School | 243 (8.1%) | 46.0 |
| High School Diploma | 517 (17.2%) | 78.0 |
| College or Associate's Degree | 900 (29.9%) | 55.0 |
| Bachelor's Degree | 811 (26.9%) | 57.0 |
| Graduate Degree | 540 (17.9%) | 91.0 |
| Total | 3,011 (100.0%) | 62.0 |
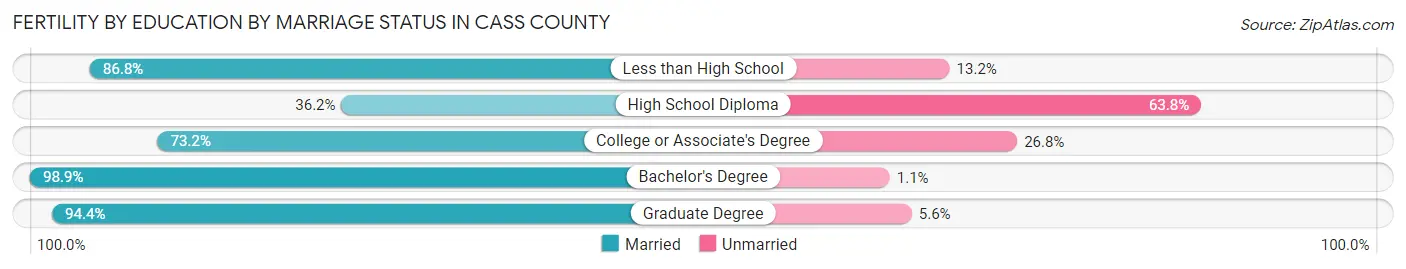
Fertility by Education by Marriage Status in Cass County
21.3% of women with births in Cass County are unmarried. Women with the educational attainment of bachelor's degree are most likely to be married with 98.9% of them married at childbirth, while women with the educational attainment of high school diploma are least likely to be married with 63.8% of them unmarried at childbirth.
| Educational Attainment | Married | Unmarried |
| Less than High School | 211 (86.8%) | 32 (13.2%) |
| High School Diploma | 187 (36.2%) | 330 (63.8%) |
| College or Associate's Degree | 659 (73.2%) | 241 (26.8%) |
| Bachelor's Degree | 802 (98.9%) | 9 (1.1%) |
| Graduate Degree | 510 (94.4%) | 30 (5.6%) |
| Total | 2,370 (78.7%) | 641 (21.3%) |
Income in Cass County
Income Overview in Cass County
Per Capita Income in Cass County is $43,474, while median incomes of families and households are $104,847 and $73,249 respectively.
| Characteristic | Number | Measure |
| Per Capita Income | 186,328 | $43,474 |
| Median Family Income | 43,738 | $104,847 |
| Mean Family Income | 43,738 | $135,287 |
| Median Household Income | 79,505 | $73,249 |
| Mean Household Income | 79,505 | $101,026 |
| Income Deficit | 43,738 | $9,600 |
| Wage / Income Gap (%) | 186,328 | 22.36% |
| Wage / Income Gap ($) | 186,328 | 77.64¢ per $1 |
| Gini / Inequality Index | 186,328 | 0.47 |
Earnings by Sex in Cass County
Average Earnings in Cass County are $41,750, $46,597 for men and $36,179 for women, a difference of 22.4%.
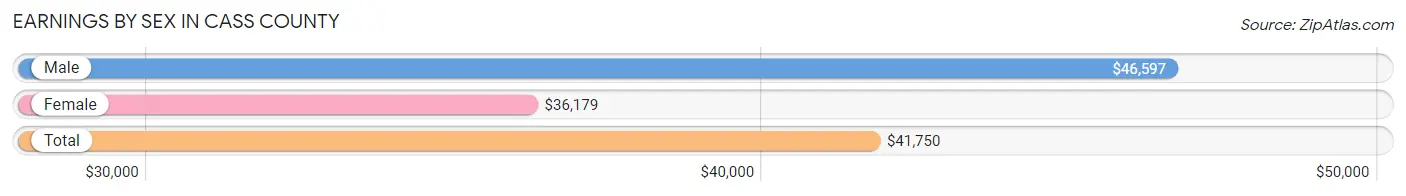
| Sex | Number | Average Earnings |
| Male | 64,009 (53.3%) | $46,597 |
| Female | 55,966 (46.7%) | $36,179 |
| Total | 119,975 (100.0%) | $41,750 |
Earnings by Sex by Income Bracket in Cass County
The most common earnings brackets in Cass County are $100,000+ for men (9,526 | 14.9%) and $75,000 to $99,999 for women (4,908 | 8.8%).
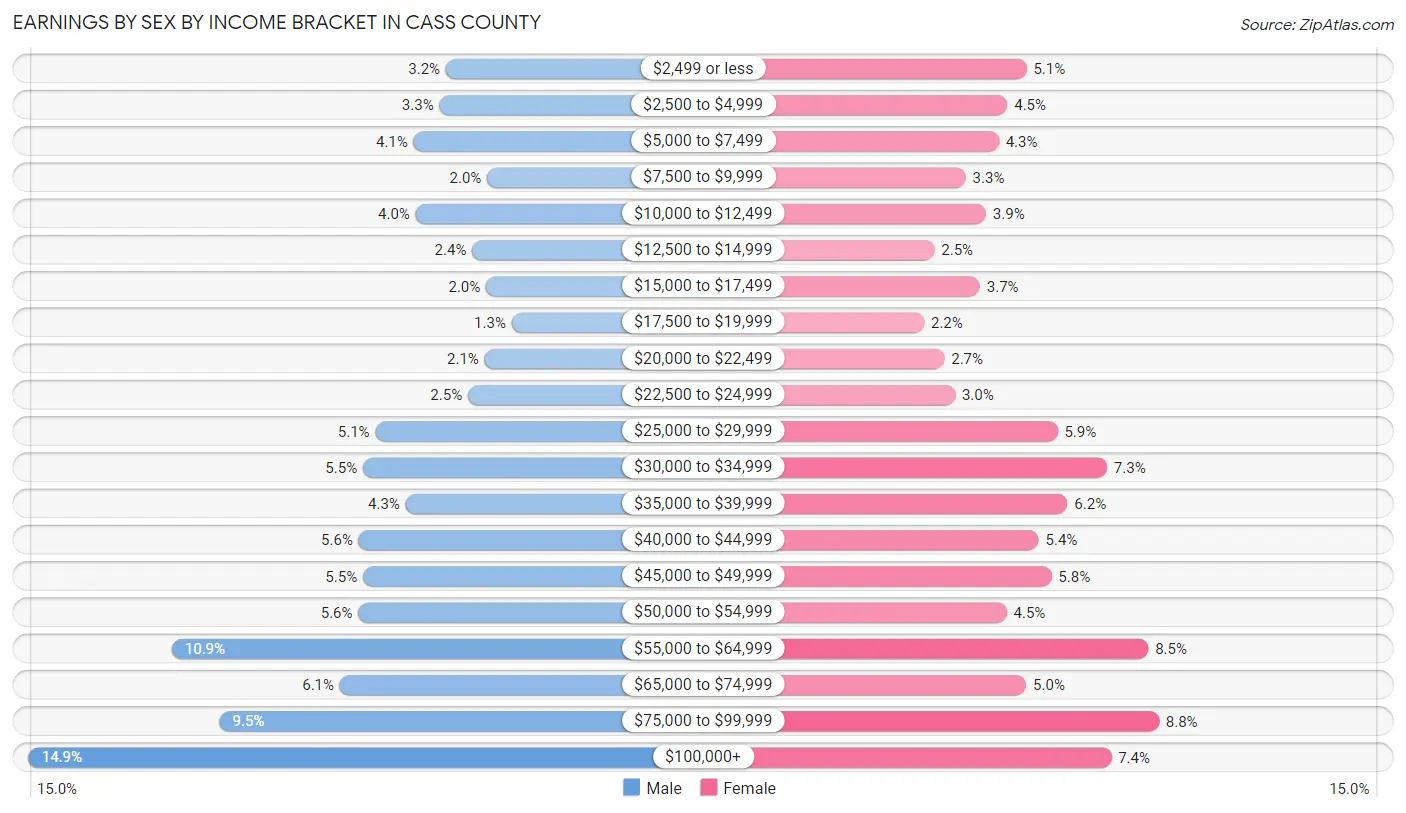
| Income | Male | Female |
| $2,499 or less | 2,023 (3.2%) | 2,824 (5.1%) |
| $2,500 to $4,999 | 2,138 (3.3%) | 2,522 (4.5%) |
| $5,000 to $7,499 | 2,603 (4.1%) | 2,389 (4.3%) |
| $7,500 to $9,999 | 1,279 (2.0%) | 1,868 (3.3%) |
| $10,000 to $12,499 | 2,564 (4.0%) | 2,186 (3.9%) |
| $12,500 to $14,999 | 1,552 (2.4%) | 1,375 (2.5%) |
| $15,000 to $17,499 | 1,302 (2.0%) | 2,095 (3.7%) |
| $17,500 to $19,999 | 836 (1.3%) | 1,216 (2.2%) |
| $20,000 to $22,499 | 1,322 (2.1%) | 1,536 (2.7%) |
| $22,500 to $24,999 | 1,623 (2.5%) | 1,700 (3.0%) |
| $25,000 to $29,999 | 3,292 (5.1%) | 3,312 (5.9%) |
| $30,000 to $34,999 | 3,512 (5.5%) | 4,093 (7.3%) |
| $35,000 to $39,999 | 2,746 (4.3%) | 3,471 (6.2%) |
| $40,000 to $44,999 | 3,593 (5.6%) | 3,018 (5.4%) |
| $45,000 to $49,999 | 3,517 (5.5%) | 3,219 (5.8%) |
| $50,000 to $54,999 | 3,599 (5.6%) | 2,512 (4.5%) |
| $55,000 to $64,999 | 6,953 (10.9%) | 4,738 (8.5%) |
| $65,000 to $74,999 | 3,933 (6.1%) | 2,823 (5.0%) |
| $75,000 to $99,999 | 6,096 (9.5%) | 4,908 (8.8%) |
| $100,000+ | 9,526 (14.9%) | 4,161 (7.4%) |
| Total | 64,009 (100.0%) | 55,966 (100.0%) |
Earnings by Sex by Educational Attainment in Cass County
Average earnings in Cass County are $55,457 for men and $45,802 for women, a difference of 17.4%. Men with an educational attainment of graduate degree enjoy the highest average annual earnings of $75,646, while those with less than high school education earn the least with $32,616. Women with an educational attainment of graduate degree earn the most with the average annual earnings of $75,534, while those with less than high school education have the smallest earnings of $24,844.
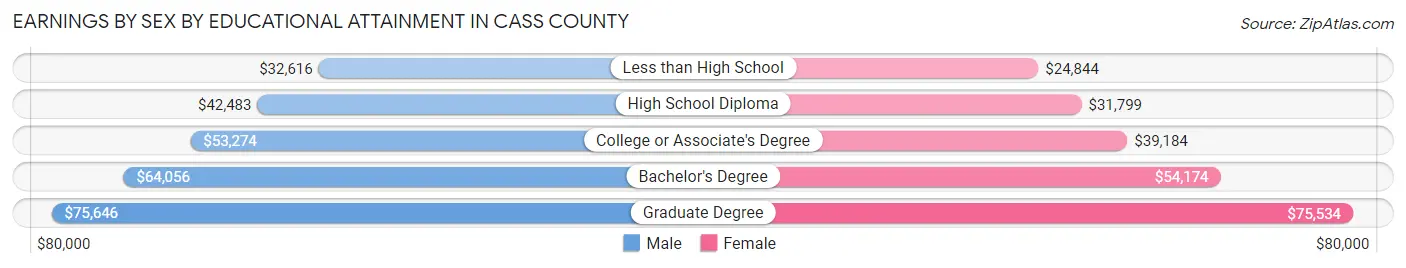
| Educational Attainment | Male Income | Female Income |
| Less than High School | $32,616 | $24,844 |
| High School Diploma | $42,483 | $31,799 |
| College or Associate's Degree | $53,274 | $39,184 |
| Bachelor's Degree | $64,056 | $54,174 |
| Graduate Degree | $75,646 | $75,534 |
| Total | $55,457 | $45,802 |
Family Income in Cass County
Family Income Brackets in Cass County
According to the Cass County family income data, there are 10,541 families falling into the $100,000 to $149,999 income range, which is the most common income bracket and makes up 24.1% of all families. Conversely, the less than $10,000 income bracket is the least frequent group with only 525 families (1.2%) belonging to this category.
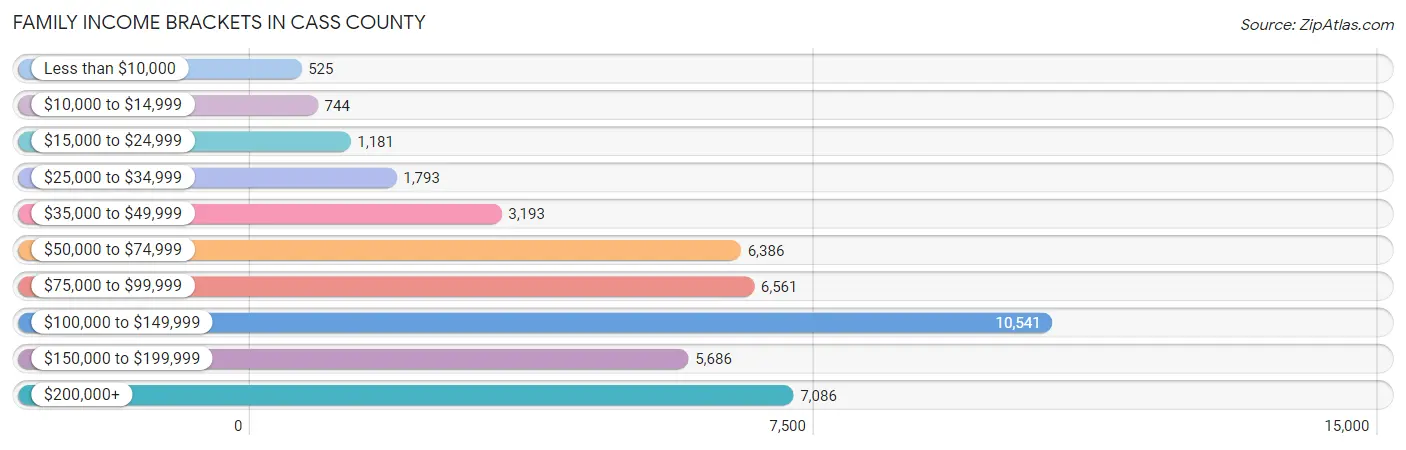
| Income Bracket | # Families | % Families |
| Less than $10,000 | 525 | 1.2% |
| $10,000 to $14,999 | 744 | 1.7% |
| $15,000 to $24,999 | 1,181 | 2.7% |
| $25,000 to $34,999 | 1,793 | 4.1% |
| $35,000 to $49,999 | 3,193 | 7.3% |
| $50,000 to $74,999 | 6,386 | 14.6% |
| $75,000 to $99,999 | 6,561 | 15.0% |
| $100,000 to $149,999 | 10,541 | 24.1% |
| $150,000 to $199,999 | 5,686 | 13.0% |
| $200,000+ | 7,086 | 16.2% |
Family Income by Famaliy Size in Cass County
6-person families (1,020 | 2.3%) account for the highest median family income in Cass County with $136,220 per family, while 2-person families (22,257 | 50.9%) have the highest median income of $47,834 per family member.
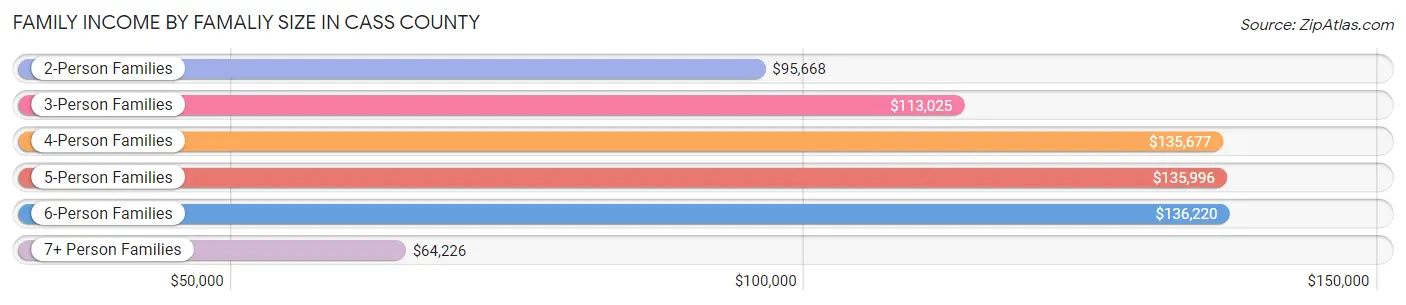
| Income Bracket | # Families | Median Income |
| 2-Person Families | 22,257 (50.9%) | $95,668 |
| 3-Person Families | 8,333 (19.1%) | $113,025 |
| 4-Person Families | 8,416 (19.2%) | $135,677 |
| 5-Person Families | 3,326 (7.6%) | $135,996 |
| 6-Person Families | 1,020 (2.3%) | $136,220 |
| 7+ Person Families | 386 (0.9%) | $64,226 |
| Total | 43,738 (100.0%) | $104,847 |
Family Income by Number of Earners in Cass County
The median family income in Cass County is $104,847, with families comprising 3+ earners (4,097) having the highest median family income of $149,600, while families with 1 earner (10,853) have the lowest median family income of $63,829, accounting for 9.4% and 24.8% of families, respectively.
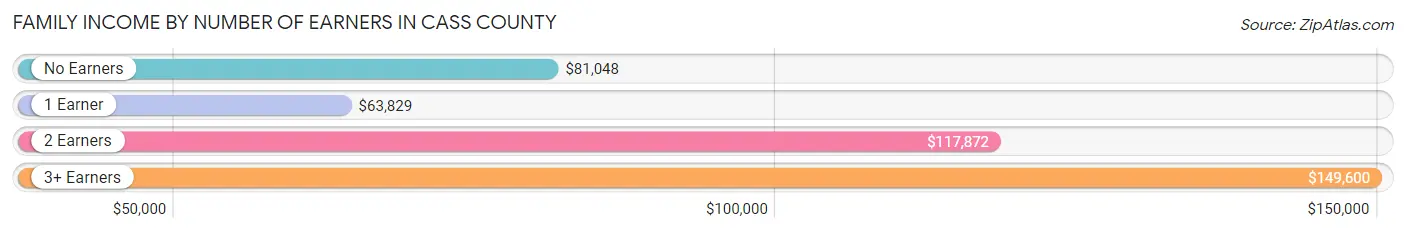
| Number of Earners | # Families | Median Income |
| No Earners | 4,514 (10.3%) | $81,048 |
| 1 Earner | 10,853 (24.8%) | $63,829 |
| 2 Earners | 24,274 (55.5%) | $117,872 |
| 3+ Earners | 4,097 (9.4%) | $149,600 |
| Total | 43,738 (100.0%) | $104,847 |
Household Income in Cass County
Household Income Brackets in Cass County
With 14,231 households falling in the category, the $50,000 to $74,999 income range is the most frequent in Cass County, accounting for 17.9% of all households. In contrast, only 2,783 households (3.5%) fall into the $10,000 to $14,999 income bracket, making it the least populous group.
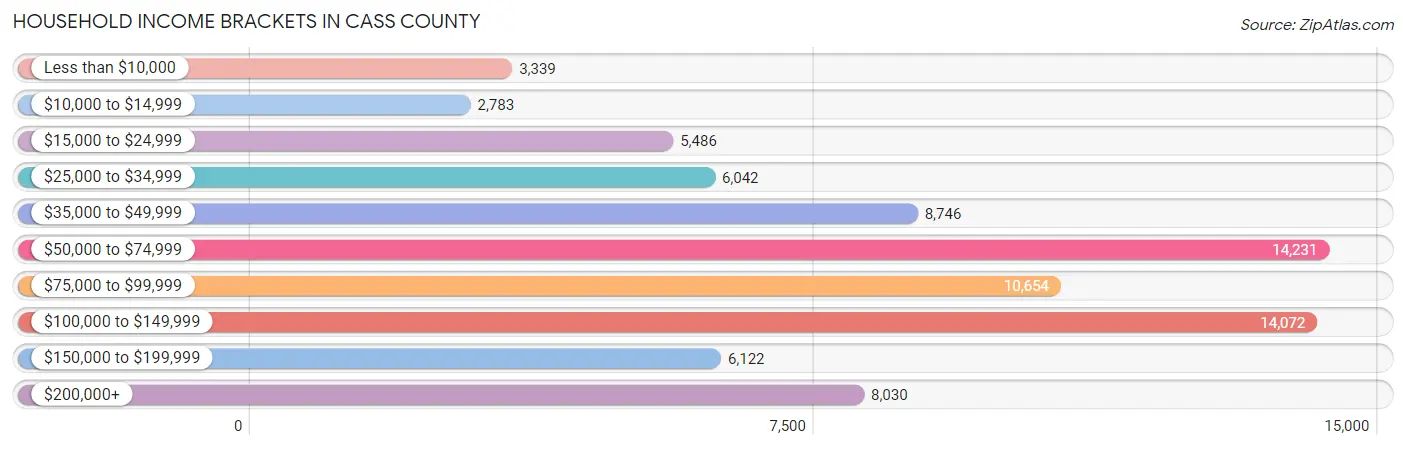
| Income Bracket | # Households | % Households |
| Less than $10,000 | 3,339 | 4.2% |
| $10,000 to $14,999 | 2,783 | 3.5% |
| $15,000 to $24,999 | 5,486 | 6.9% |
| $25,000 to $34,999 | 6,042 | 7.6% |
| $35,000 to $49,999 | 8,746 | 11.0% |
| $50,000 to $74,999 | 14,231 | 17.9% |
| $75,000 to $99,999 | 10,654 | 13.4% |
| $100,000 to $149,999 | 14,072 | 17.7% |
| $150,000 to $199,999 | 6,122 | 7.7% |
| $200,000+ | 8,030 | 10.1% |
Household Income by Householder Age in Cass County
The median household income in Cass County is $73,249, with the highest median household income of $95,747 found in the 45 to 64 years age bracket for the primary householder. A total of 22,445 households (28.2%) fall into this category. Meanwhile, the 15 to 24 years age bracket for the primary householder has the lowest median household income of $39,257, with 9,352 households (11.8%) in this group.
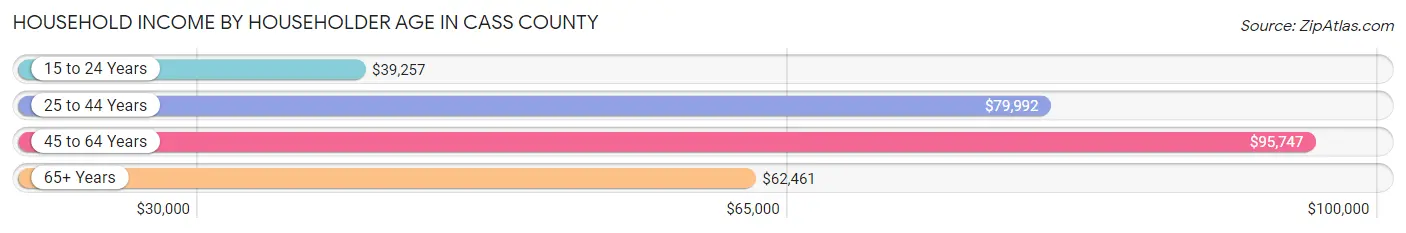
| Income Bracket | # Households | Median Income |
| 15 to 24 Years | 9,352 (11.8%) | $39,257 |
| 25 to 44 Years | 32,796 (41.2%) | $79,992 |
| 45 to 64 Years | 22,445 (28.2%) | $95,747 |
| 65+ Years | 14,912 (18.8%) | $62,461 |
| Total | 79,505 (100.0%) | $73,249 |
Poverty in Cass County
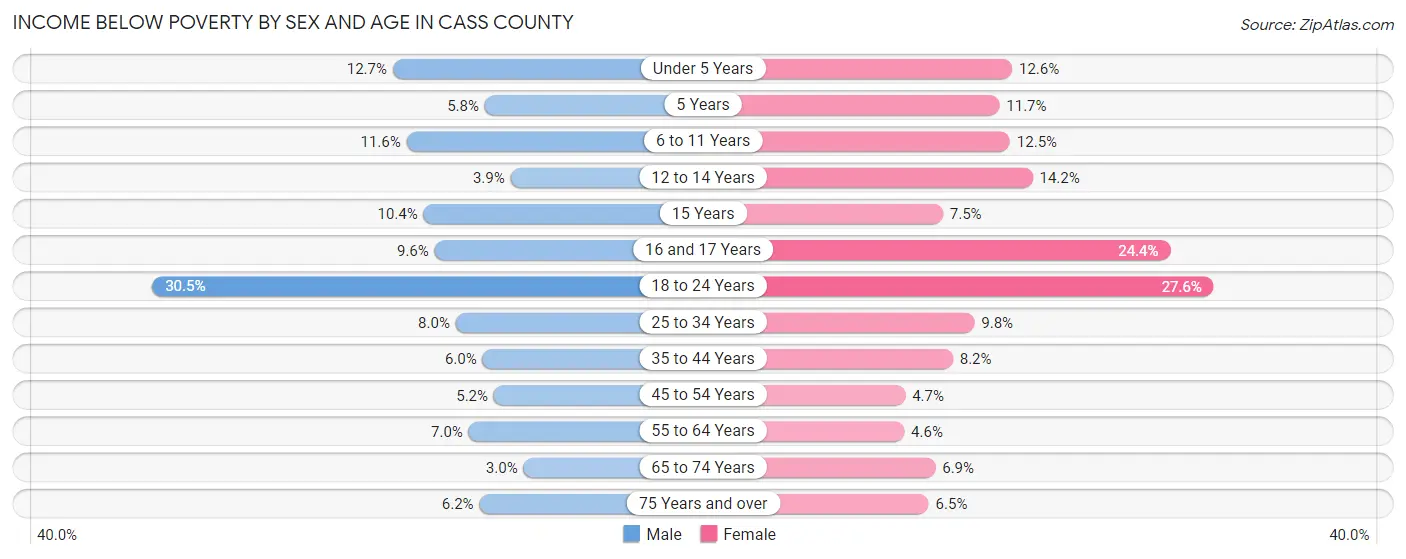
Income Below Poverty by Sex and Age in Cass County
With 10.3% poverty level for males and 11.4% for females among the residents of Cass County, 18 to 24 year old males and 18 to 24 year old females are the most vulnerable to poverty, with 3,721 males (30.5%) and 3,262 females (27.6%) in their respective age groups living below the poverty level.
| Age Bracket | Male | Female |
| Under 5 Years | 761 (12.7%) | 743 (12.6%) |
| 5 Years | 65 (5.8%) | 146 (11.7%) |
| 6 to 11 Years | 820 (11.6%) | 848 (12.5%) |
| 12 to 14 Years | 139 (3.9%) | 486 (14.2%) |
| 15 Years | 90 (10.4%) | 86 (7.5%) |
| 16 and 17 Years | 182 (9.6%) | 473 (24.4%) |
| 18 to 24 Years | 3,721 (30.5%) | 3,262 (27.6%) |
| 25 to 34 Years | 1,295 (8.0%) | 1,457 (9.8%) |
| 35 to 44 Years | 823 (6.0%) | 955 (8.2%) |
| 45 to 54 Years | 490 (5.2%) | 421 (4.7%) |
| 55 to 64 Years | 649 (7.0%) | 434 (4.6%) |
| 65 to 74 Years | 199 (3.0%) | 483 (6.9%) |
| 75 Years and over | 222 (6.2%) | 340 (6.5%) |
| Total | 9,456 (10.3%) | 10,134 (11.4%) |
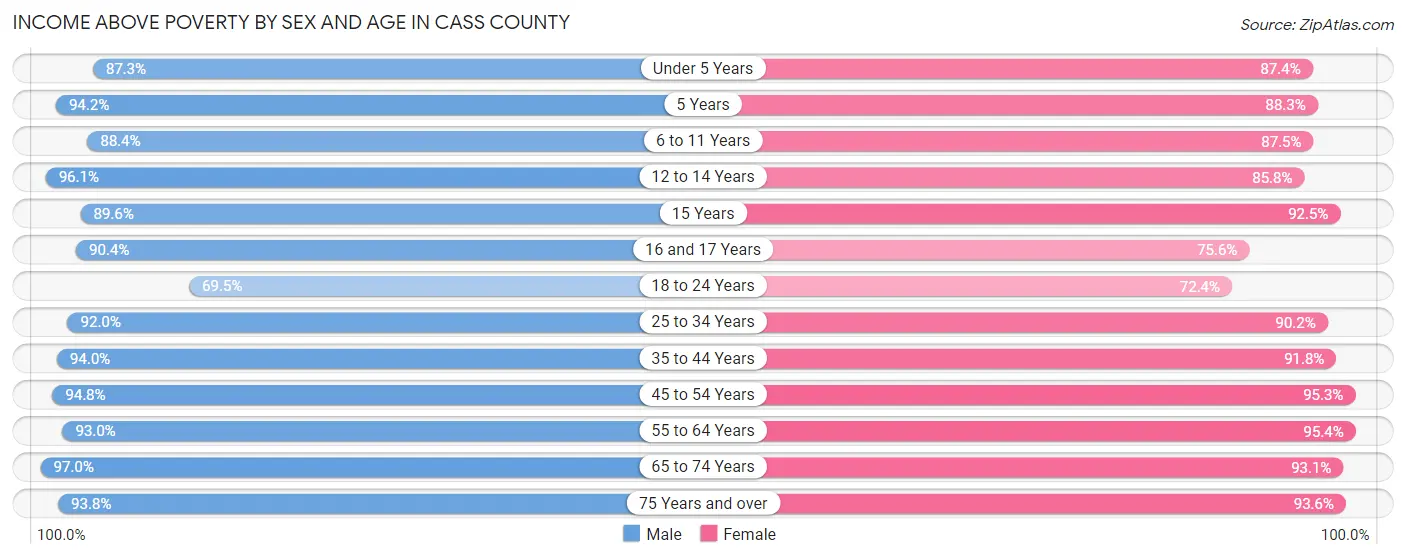
Income Above Poverty by Sex and Age in Cass County
According to the poverty statistics in Cass County, males aged 65 to 74 years and females aged 55 to 64 years are the age groups that are most secure financially, with 97.0% of males and 95.4% of females in these age groups living above the poverty line.
| Age Bracket | Male | Female |
| Under 5 Years | 5,250 (87.3%) | 5,134 (87.4%) |
| 5 Years | 1,050 (94.2%) | 1,102 (88.3%) |
| 6 to 11 Years | 6,223 (88.4%) | 5,945 (87.5%) |
| 12 to 14 Years | 3,410 (96.1%) | 2,946 (85.8%) |
| 15 Years | 777 (89.6%) | 1,061 (92.5%) |
| 16 and 17 Years | 1,721 (90.4%) | 1,466 (75.6%) |
| 18 to 24 Years | 8,472 (69.5%) | 8,552 (72.4%) |
| 25 to 34 Years | 14,918 (92.0%) | 13,348 (90.2%) |
| 35 to 44 Years | 12,900 (94.0%) | 10,633 (91.8%) |
| 45 to 54 Years | 9,003 (94.8%) | 8,514 (95.3%) |
| 55 to 64 Years | 8,577 (93.0%) | 8,948 (95.4%) |
| 65 to 74 Years | 6,534 (97.0%) | 6,481 (93.1%) |
| 75 Years and over | 3,343 (93.8%) | 4,935 (93.5%) |
| Total | 82,178 (89.7%) | 79,065 (88.6%) |
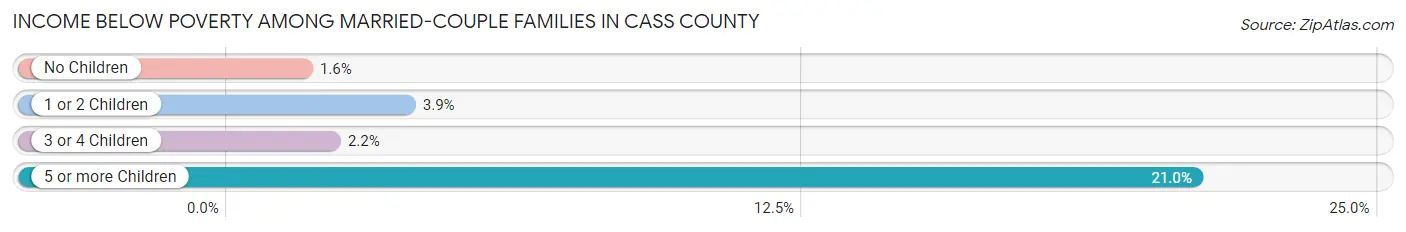
Income Below Poverty Among Married-Couple Families in Cass County
The poverty statistics for married-couple families in Cass County show that 2.6% or 918 of the total 35,061 families live below the poverty line. Families with 5 or more children have the highest poverty rate of 21.0%, comprising of 54 families. On the other hand, families with no children have the lowest poverty rate of 1.6%, which includes 316 families.
| Children | Above Poverty | Below Poverty |
| No Children | 19,028 (98.4%) | 316 (1.6%) |
| 1 or 2 Children | 11,860 (96.1%) | 478 (3.9%) |
| 3 or 4 Children | 3,052 (97.8%) | 70 (2.2%) |
| 5 or more Children | 203 (79.0%) | 54 (21.0%) |
| Total | 34,143 (97.4%) | 918 (2.6%) |
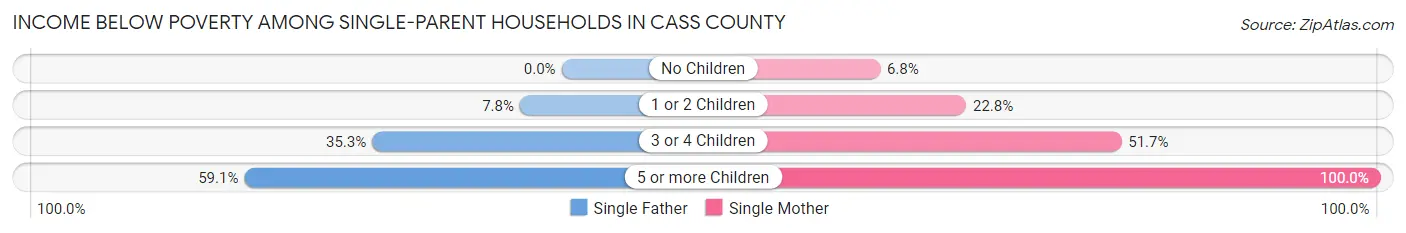
Income Below Poverty Among Single-Parent Households in Cass County
According to the poverty data in Cass County, 8.2% or 212 single-father households and 22.7% or 1,387 single-mother households are living below the poverty line. Among single-father households, those with 5 or more children have the highest poverty rate, with 52 households (59.1%) experiencing poverty. Likewise, among single-mother households, those with 5 or more children have the highest poverty rate, with 79 households (100.0%) falling below the poverty line.
| Children | Single Father | Single Mother |
| No Children | 0 (0.0%) | 120 (6.8%) |
| 1 or 2 Children | 100 (7.8%) | 794 (22.8%) |
| 3 or 4 Children | 60 (35.3%) | 394 (51.7%) |
| 5 or more Children | 52 (59.1%) | 79 (100.0%) |
| Total | 212 (8.2%) | 1,387 (22.7%) |
Income Below Poverty Among Married-Couple vs Single-Parent Households in Cass County
The poverty data for Cass County shows that 918 of the married-couple family households (2.6%) and 1,599 of the single-parent households (18.4%) are living below the poverty level. Within the married-couple family households, those with 5 or more children have the highest poverty rate, with 54 households (21.0%) falling below the poverty line. Among the single-parent households, those with 5 or more children have the highest poverty rate, with 131 household (78.4%) living below poverty.
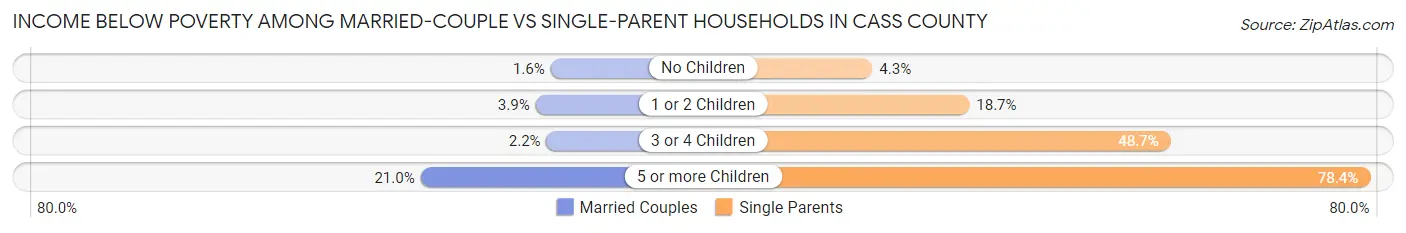
| Children | Married-Couple Families | Single-Parent Households |
| No Children | 316 (1.6%) | 120 (4.3%) |
| 1 or 2 Children | 478 (3.9%) | 894 (18.7%) |
| 3 or 4 Children | 70 (2.2%) | 454 (48.7%) |
| 5 or more Children | 54 (21.0%) | 131 (78.4%) |
| Total | 918 (2.6%) | 1,599 (18.4%) |
Employment Characteristics in Cass County
Employment by Class of Employer in Cass County
Among the 107,914 employed individuals in Cass County, private company employees (72,946 | 67.6%), not-for-profit organizations (12,846 | 11.9%), and local government employees (6,462 | 6.0%) make up the most common classes of employment.
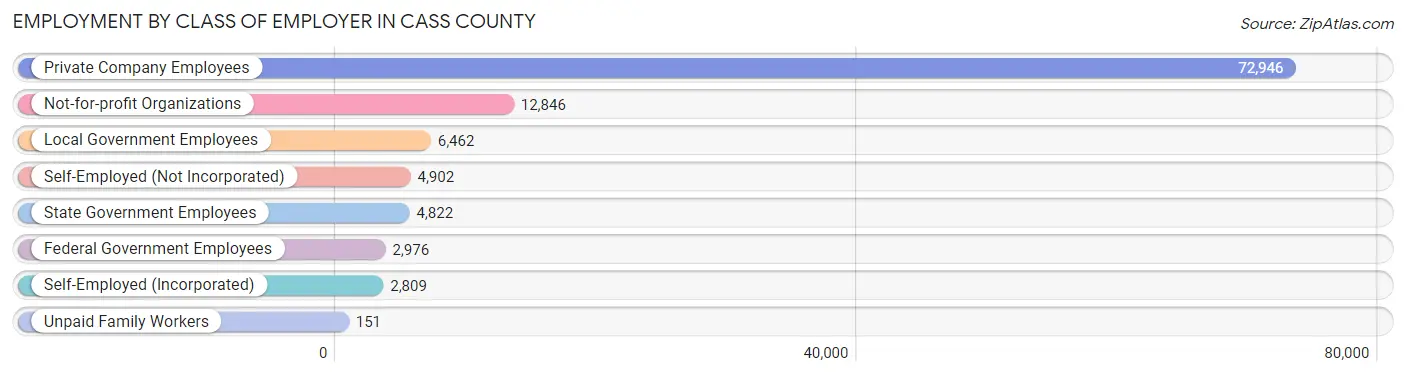
| Employer Class | # Employees | % Employees |
| Private Company Employees | 72,946 | 67.6% |
| Self-Employed (Incorporated) | 2,809 | 2.6% |
| Self-Employed (Not Incorporated) | 4,902 | 4.5% |
| Not-for-profit Organizations | 12,846 | 11.9% |
| Local Government Employees | 6,462 | 6.0% |
| State Government Employees | 4,822 | 4.5% |
| Federal Government Employees | 2,976 | 2.8% |
| Unpaid Family Workers | 151 | 0.1% |
| Total | 107,914 | 100.0% |
Employment Status by Age in Cass County
According to the labor force statistics for Cass County, out of the total population over 16 years of age (148,893), 76.0% or 113,159 individuals are in the labor force, with 2.8% or 3,168 of them unemployed. The age group with the highest labor force participation rate is 30 to 34 years, with 93.4% or 13,935 individuals in the labor force. Within the labor force, the 16 to 19 years age range has the highest percentage of unemployed individuals, with 11.0% or 730 of them being unemployed.
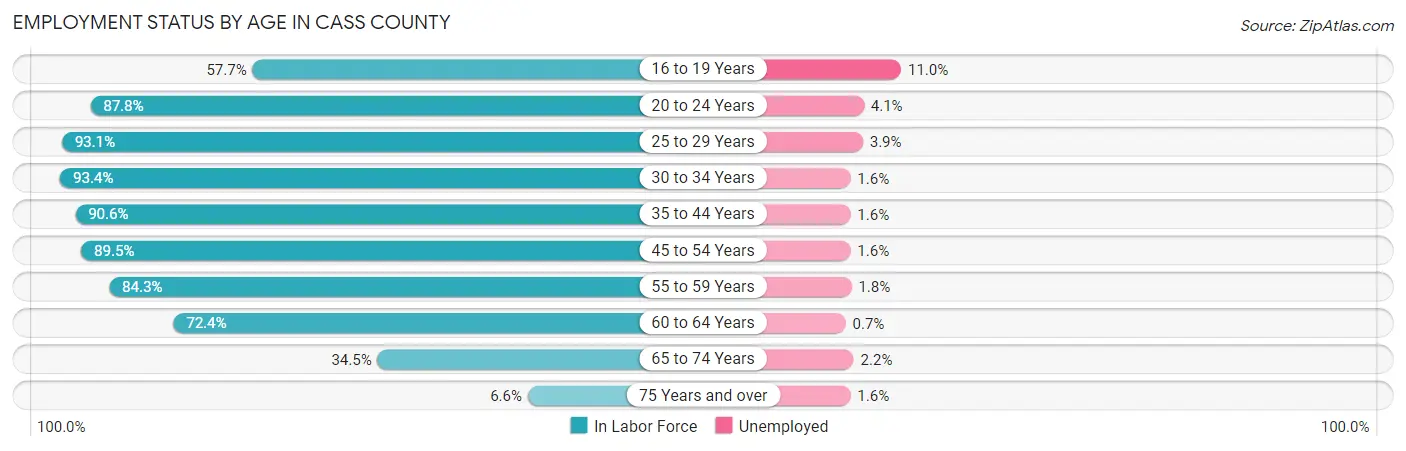
| Age Bracket | In Labor Force | Unemployed |
| 16 to 19 Years | 6,635 (57.7%) | 730 (11.0%) |
| 20 to 24 Years | 17,684 (87.8%) | 725 (4.1%) |
| 25 to 29 Years | 15,141 (93.1%) | 590 (3.9%) |
| 30 to 34 Years | 13,935 (93.4%) | 223 (1.6%) |
| 35 to 44 Years | 23,119 (90.6%) | 370 (1.6%) |
| 45 to 54 Years | 16,594 (89.5%) | 266 (1.6%) |
| 55 to 59 Years | 7,863 (84.3%) | 142 (1.8%) |
| 60 to 64 Years | 6,762 (72.4%) | 47 (0.7%) |
| 65 to 74 Years | 4,765 (34.5%) | 105 (2.2%) |
| 75 Years and over | 629 (6.6%) | 10 (1.6%) |
| Total | 113,159 (76.0%) | 3,168 (2.8%) |
Employment Status by Educational Attainment in Cass County
According to labor force statistics for Cass County, 88.8% of individuals (83,391) out of the total population between 25 and 64 years of age (93,909) are in the labor force, with 2.0% or 1,668 of them being unemployed. The group with the highest labor force participation rate are those with the educational attainment of bachelor's degree or higher, with 91.4% or 38,560 individuals in the labor force. Within the labor force, individuals with less than high school education have the highest percentage of unemployment, with 9.6% or 263 of them being unemployed.
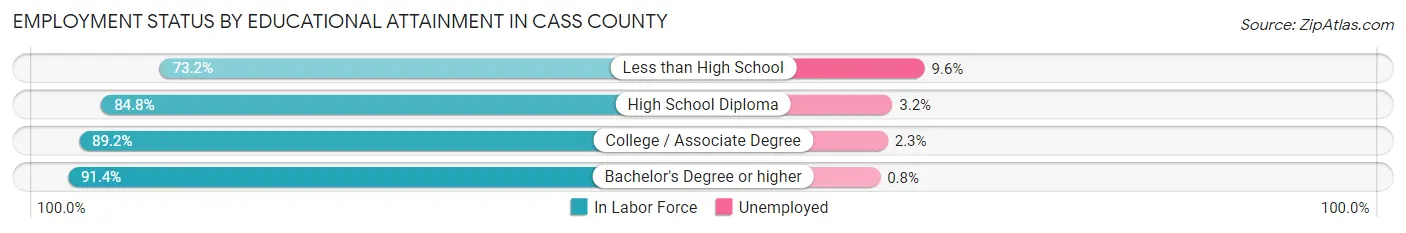
| Educational Attainment | In Labor Force | Unemployed |
| Less than High School | 2,744 (73.2%) | 360 (9.6%) |
| High School Diploma | 13,909 (84.8%) | 525 (3.2%) |
| College / Associate Degree | 28,161 (89.2%) | 726 (2.3%) |
| Bachelor's Degree or higher | 38,560 (91.4%) | 338 (0.8%) |
| Total | 83,391 (88.8%) | 1,878 (2.0%) |
Employment Occupations by Sex in Cass County
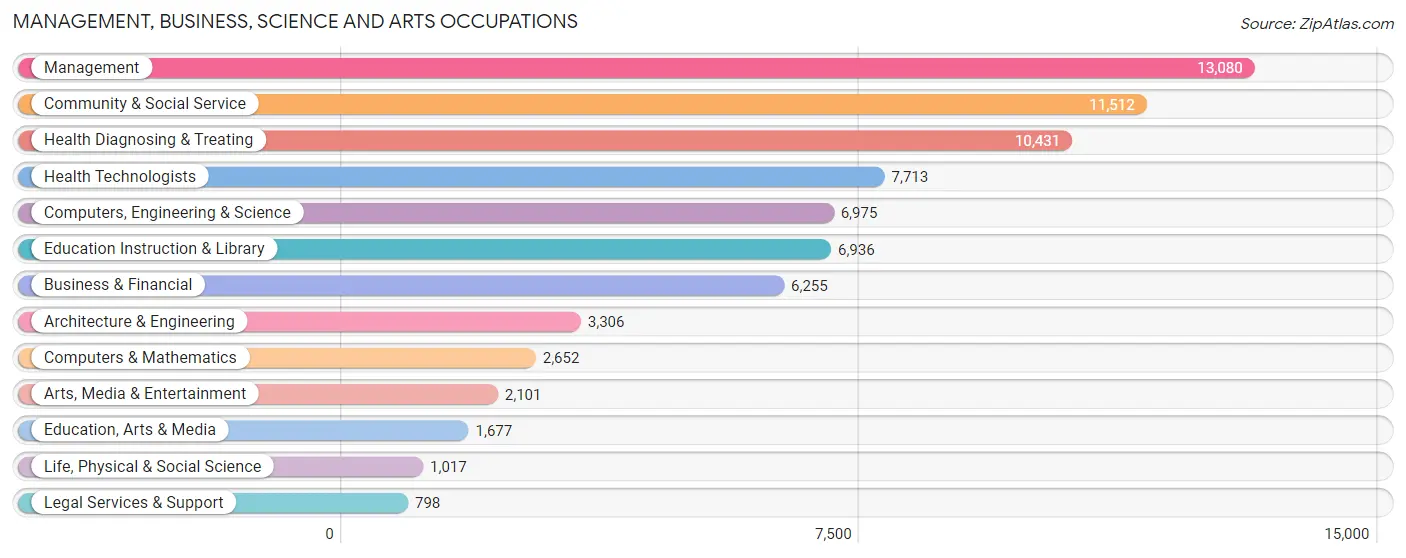
Management, Business, Science and Arts Occupations
The most common Management, Business, Science and Arts occupations in Cass County are Management (13,080 | 12.0%), Community & Social Service (11,512 | 10.5%), Health Diagnosing & Treating (10,431 | 9.5%), Health Technologists (7,713 | 7.1%), and Computers, Engineering & Science (6,975 | 6.4%).
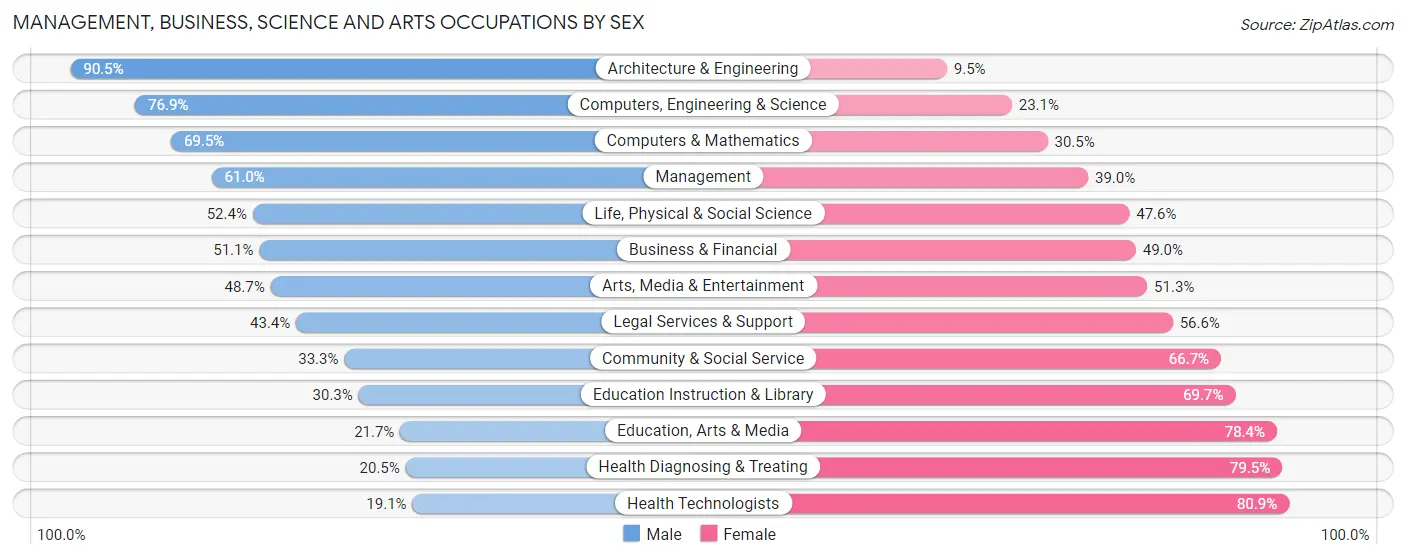
Management, Business, Science and Arts Occupations by Sex
Within the Management, Business, Science and Arts occupations in Cass County, the most male-oriented occupations are Architecture & Engineering (90.5%), Computers, Engineering & Science (76.9%), and Computers & Mathematics (69.5%), while the most female-oriented occupations are Health Technologists (80.9%), Health Diagnosing & Treating (79.5%), and Education, Arts & Media (78.3%).
| Occupation | Male | Female |
| Management | 7,982 (61.0%) | 5,098 (39.0%) |
| Business & Financial | 3,193 (51.0%) | 3,062 (48.9%) |
| Computers, Engineering & Science | 5,366 (76.9%) | 1,609 (23.1%) |
| Computers & Mathematics | 1,842 (69.5%) | 810 (30.5%) |
| Architecture & Engineering | 2,991 (90.5%) | 315 (9.5%) |
| Life, Physical & Social Science | 533 (52.4%) | 484 (47.6%) |
| Community & Social Service | 3,835 (33.3%) | 7,677 (66.7%) |
| Education, Arts & Media | 363 (21.6%) | 1,314 (78.3%) |
| Legal Services & Support | 346 (43.4%) | 452 (56.6%) |
| Education Instruction & Library | 2,103 (30.3%) | 4,833 (69.7%) |
| Arts, Media & Entertainment | 1,023 (48.7%) | 1,078 (51.3%) |
| Health Diagnosing & Treating | 2,143 (20.5%) | 8,288 (79.5%) |
| Health Technologists | 1,473 (19.1%) | 6,240 (80.9%) |
| Total (Category) | 22,519 (46.7%) | 25,734 (53.3%) |
| Total (Overall) | 58,006 (53.1%) | 51,295 (46.9%) |
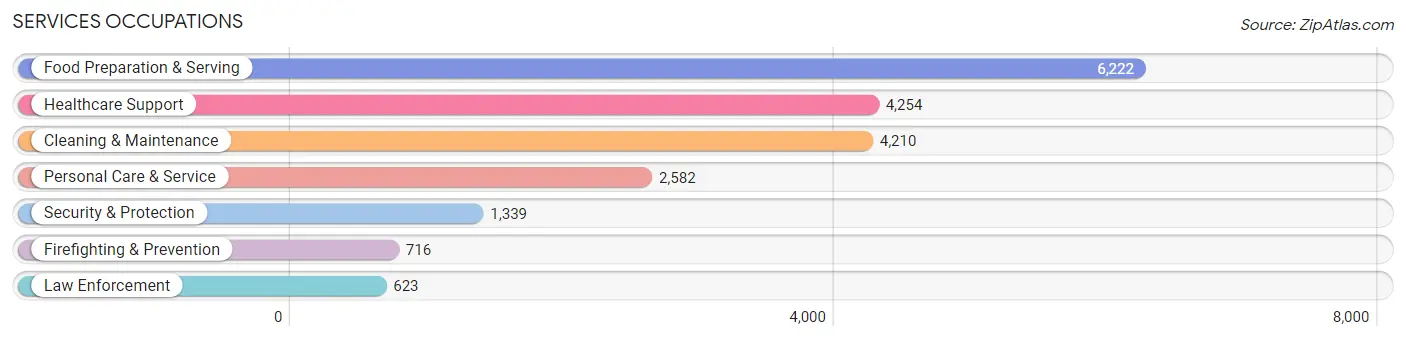
Services Occupations
The most common Services occupations in Cass County are Food Preparation & Serving (6,222 | 5.7%), Healthcare Support (4,254 | 3.9%), Cleaning & Maintenance (4,210 | 3.8%), Personal Care & Service (2,582 | 2.4%), and Security & Protection (1,339 | 1.2%).
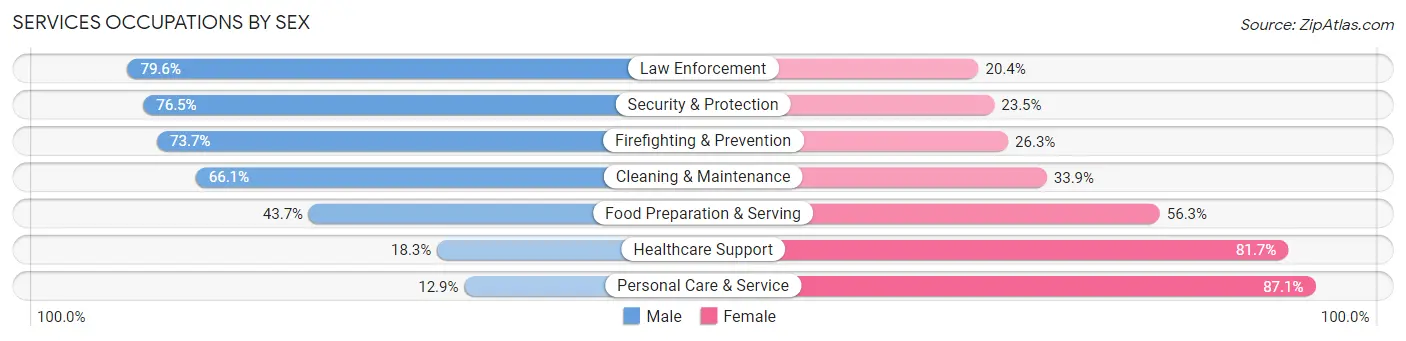
Services Occupations by Sex
Within the Services occupations in Cass County, the most male-oriented occupations are Law Enforcement (79.6%), Security & Protection (76.5%), and Firefighting & Prevention (73.7%), while the most female-oriented occupations are Personal Care & Service (87.1%), Healthcare Support (81.7%), and Food Preparation & Serving (56.3%).
| Occupation | Male | Female |
| Healthcare Support | 779 (18.3%) | 3,475 (81.7%) |
| Security & Protection | 1,024 (76.5%) | 315 (23.5%) |
| Firefighting & Prevention | 528 (73.7%) | 188 (26.3%) |
| Law Enforcement | 496 (79.6%) | 127 (20.4%) |
| Food Preparation & Serving | 2,719 (43.7%) | 3,503 (56.3%) |
| Cleaning & Maintenance | 2,782 (66.1%) | 1,428 (33.9%) |
| Personal Care & Service | 334 (12.9%) | 2,248 (87.1%) |
| Total (Category) | 7,638 (41.0%) | 10,969 (59.0%) |
| Total (Overall) | 58,006 (53.1%) | 51,295 (46.9%) |
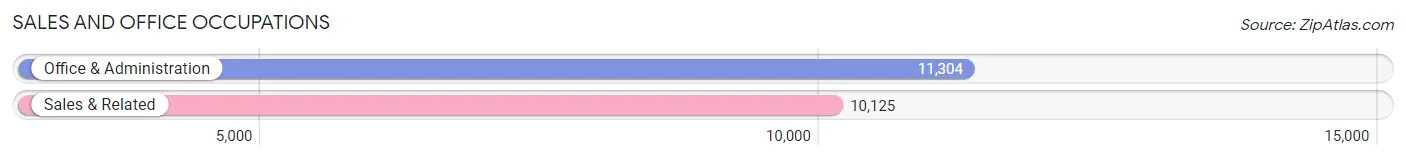
Sales and Office Occupations
The most common Sales and Office occupations in Cass County are Office & Administration (11,304 | 10.3%), and Sales & Related (10,125 | 9.3%).
Sales and Office Occupations by Sex
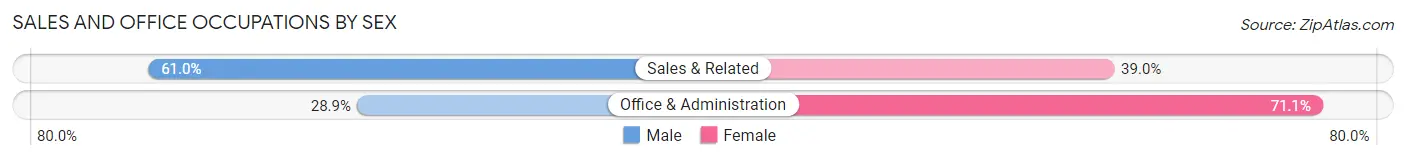
| Occupation | Male | Female |
| Sales & Related | 6,174 (61.0%) | 3,951 (39.0%) |
| Office & Administration | 3,266 (28.9%) | 8,038 (71.1%) |
| Total (Category) | 9,440 (44.1%) | 11,989 (55.9%) |
| Total (Overall) | 58,006 (53.1%) | 51,295 (46.9%) |
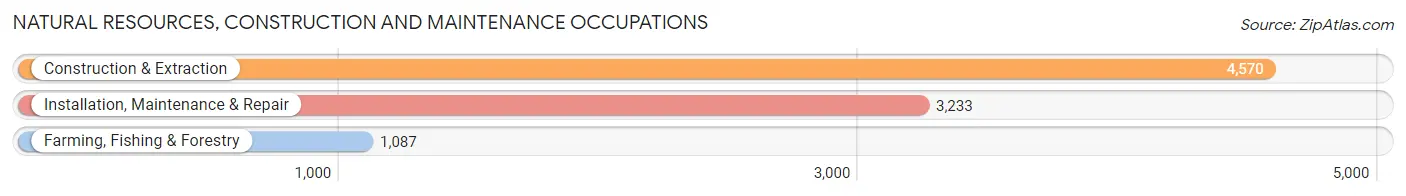
Natural Resources, Construction and Maintenance Occupations
The most common Natural Resources, Construction and Maintenance occupations in Cass County are Construction & Extraction (4,570 | 4.2%), Installation, Maintenance & Repair (3,233 | 3.0%), and Farming, Fishing & Forestry (1,087 | 1.0%).
Natural Resources, Construction and Maintenance Occupations by Sex
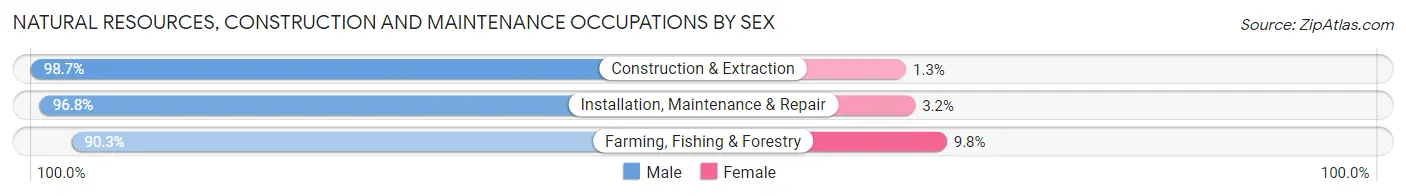
| Occupation | Male | Female |
| Farming, Fishing & Forestry | 981 (90.2%) | 106 (9.8%) |
| Construction & Extraction | 4,511 (98.7%) | 59 (1.3%) |
| Installation, Maintenance & Repair | 3,130 (96.8%) | 103 (3.2%) |
| Total (Category) | 8,622 (97.0%) | 268 (3.0%) |
| Total (Overall) | 58,006 (53.1%) | 51,295 (46.9%) |
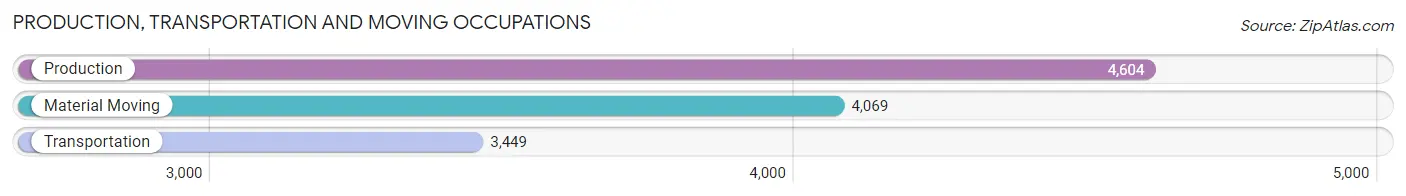
Production, Transportation and Moving Occupations
The most common Production, Transportation and Moving occupations in Cass County are Production (4,604 | 4.2%), Material Moving (4,069 | 3.7%), and Transportation (3,449 | 3.2%).
Production, Transportation and Moving Occupations by Sex
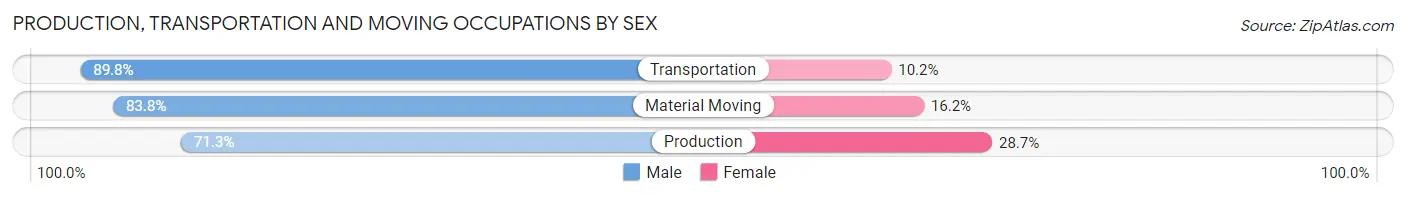
| Occupation | Male | Female |
| Production | 3,282 (71.3%) | 1,322 (28.7%) |
| Transportation | 3,096 (89.8%) | 353 (10.2%) |
| Material Moving | 3,409 (83.8%) | 660 (16.2%) |
| Total (Category) | 9,787 (80.7%) | 2,335 (19.3%) |
| Total (Overall) | 58,006 (53.1%) | 51,295 (46.9%) |
Employment Industries by Sex in Cass County
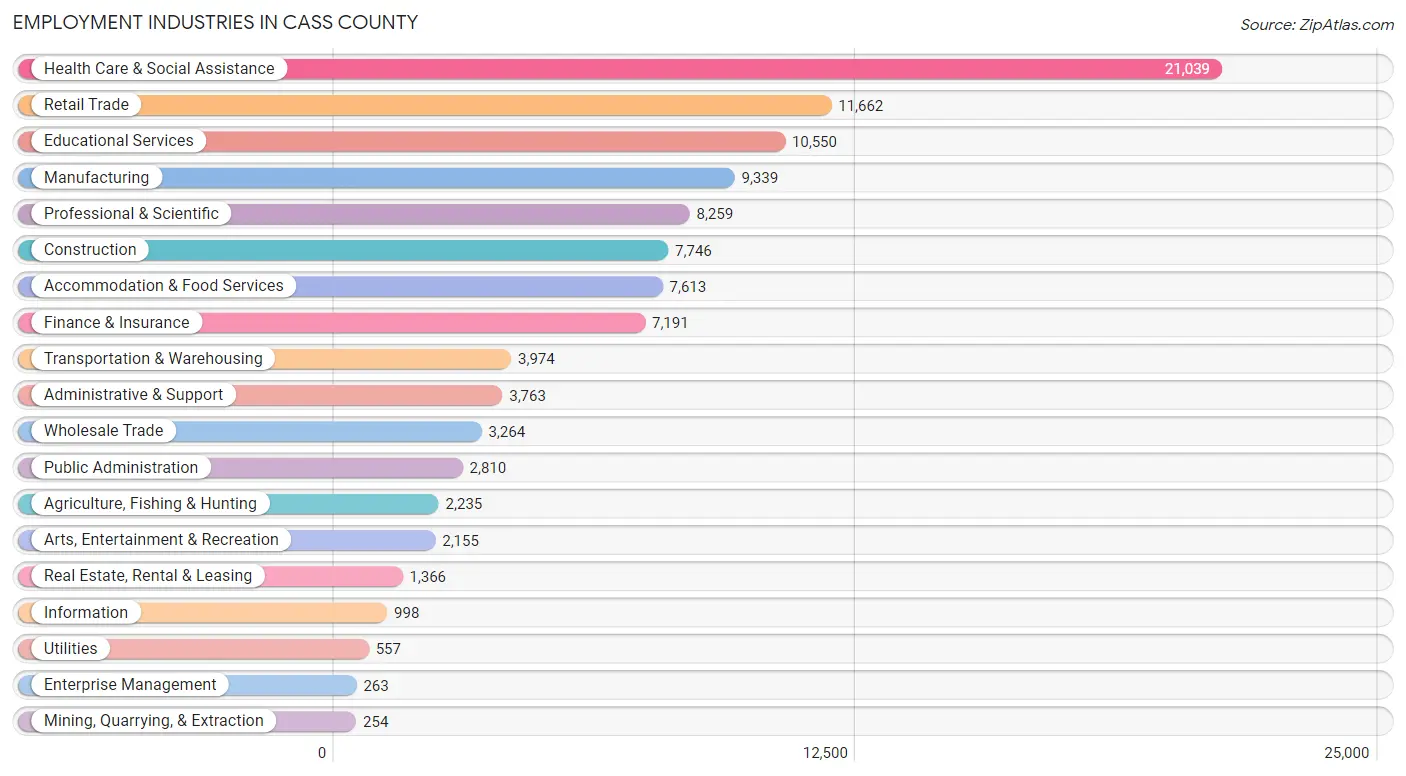
Employment Industries in Cass County
The major employment industries in Cass County include Health Care & Social Assistance (21,039 | 19.3%), Retail Trade (11,662 | 10.7%), Educational Services (10,550 | 9.7%), Manufacturing (9,339 | 8.5%), and Professional & Scientific (8,259 | 7.6%).
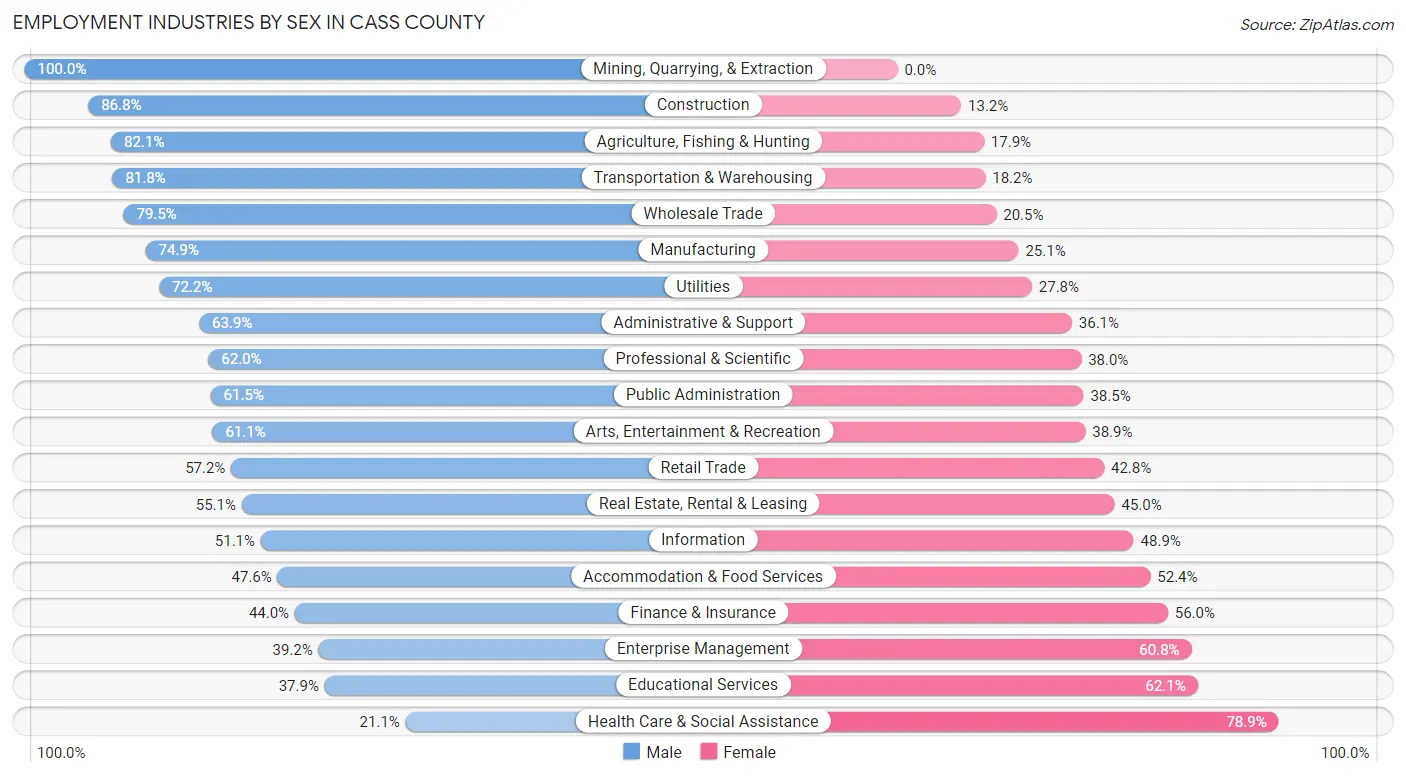
Employment Industries by Sex in Cass County
The Cass County industries that see more men than women are Mining, Quarrying, & Extraction (100.0%), Construction (86.8%), and Agriculture, Fishing & Hunting (82.1%), whereas the industries that tend to have a higher number of women are Health Care & Social Assistance (78.9%), Educational Services (62.1%), and Enterprise Management (60.8%).
| Industry | Male | Female |
| Agriculture, Fishing & Hunting | 1,835 (82.1%) | 400 (17.9%) |
| Mining, Quarrying, & Extraction | 254 (100.0%) | 0 (0.0%) |
| Construction | 6,725 (86.8%) | 1,021 (13.2%) |
| Manufacturing | 6,999 (74.9%) | 2,340 (25.1%) |
| Wholesale Trade | 2,596 (79.5%) | 668 (20.5%) |
| Retail Trade | 6,675 (57.2%) | 4,987 (42.8%) |
| Transportation & Warehousing | 3,251 (81.8%) | 723 (18.2%) |
| Utilities | 402 (72.2%) | 155 (27.8%) |
| Information | 510 (51.1%) | 488 (48.9%) |
| Finance & Insurance | 3,167 (44.0%) | 4,024 (56.0%) |
| Real Estate, Rental & Leasing | 752 (55.0%) | 614 (45.0%) |
| Professional & Scientific | 5,117 (62.0%) | 3,142 (38.0%) |
| Enterprise Management | 103 (39.2%) | 160 (60.8%) |
| Administrative & Support | 2,404 (63.9%) | 1,359 (36.1%) |
| Educational Services | 3,996 (37.9%) | 6,554 (62.1%) |
| Health Care & Social Assistance | 4,445 (21.1%) | 16,594 (78.9%) |
| Arts, Entertainment & Recreation | 1,317 (61.1%) | 838 (38.9%) |
| Accommodation & Food Services | 3,627 (47.6%) | 3,986 (52.4%) |
| Public Administration | 1,728 (61.5%) | 1,082 (38.5%) |
| Total | 58,006 (53.1%) | 51,295 (46.9%) |
Education in Cass County
School Enrollment in Cass County
The most common levels of schooling among the 51,978 students in Cass County are college / undergraduate (16,497 | 31.7%), elementary school (9,329 | 17.9%), and middle school (9,108 | 17.5%).
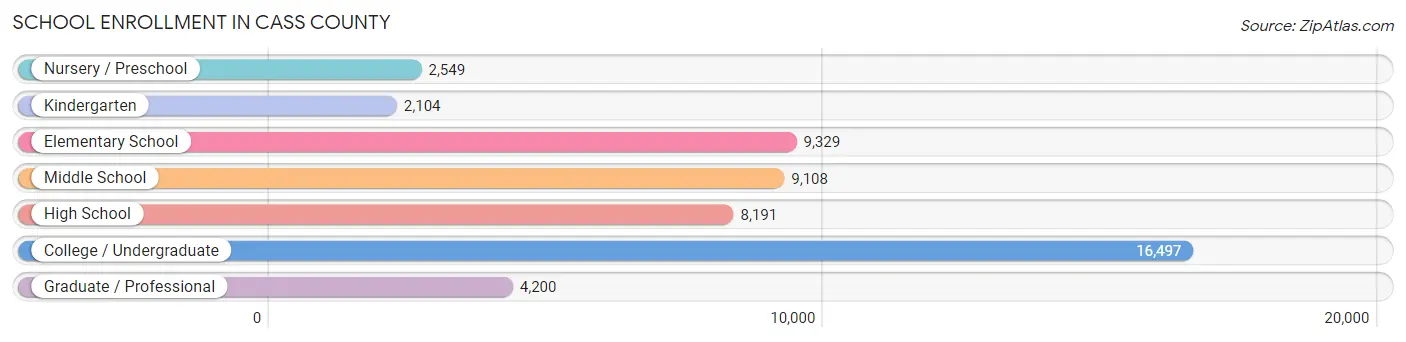
| School Level | # Students | % Students |
| Nursery / Preschool | 2,549 | 4.9% |
| Kindergarten | 2,104 | 4.1% |
| Elementary School | 9,329 | 17.9% |
| Middle School | 9,108 | 17.5% |
| High School | 8,191 | 15.8% |
| College / Undergraduate | 16,497 | 31.7% |
| Graduate / Professional | 4,200 | 8.1% |
| Total | 51,978 | 100.0% |
School Enrollment by Age by Funding Source in Cass County
Out of a total of 51,978 students who are enrolled in schools in Cass County, 5,146 (9.9%) attend a private institution, while the remaining 46,832 (90.1%) are enrolled in public schools. The age group of 3 to 4 year olds has the highest likelihood of being enrolled in private schools, with 694 (45.2% in the age bracket) enrolled. Conversely, the age group of 18 to 19 year olds has the lowest likelihood of being enrolled in a private school, with 6,125 (97.4% in the age bracket) attending a public institution.
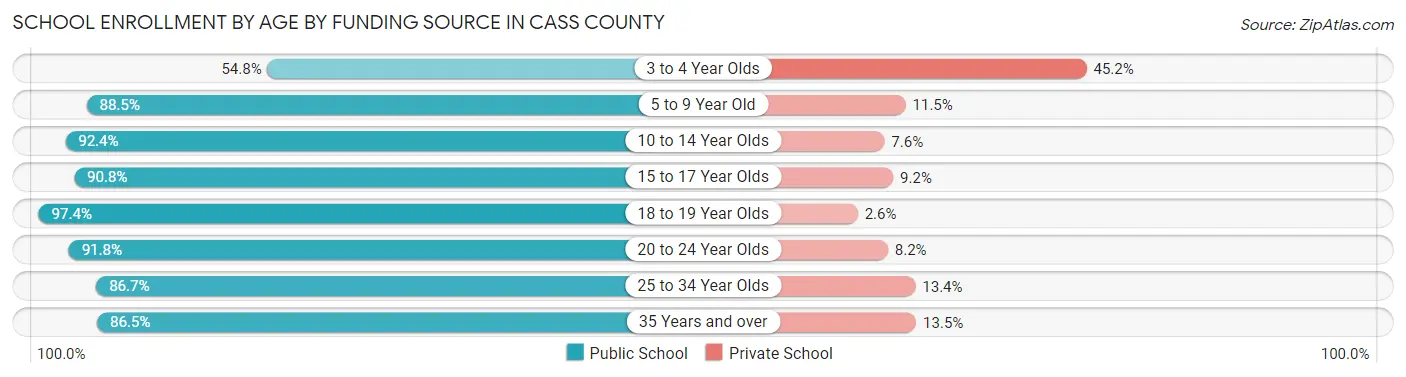
| Age Bracket | Public School | Private School |
| 3 to 4 Year Olds | 840 (54.8%) | 694 (45.2%) |
| 5 to 9 Year Old | 9,859 (88.5%) | 1,286 (11.5%) |
| 10 to 14 Year Olds | 10,296 (92.4%) | 846 (7.6%) |
| 15 to 17 Year Olds | 5,287 (90.8%) | 537 (9.2%) |
| 18 to 19 Year Olds | 6,125 (97.4%) | 165 (2.6%) |
| 20 to 24 Year Olds | 9,231 (91.8%) | 828 (8.2%) |
| 25 to 34 Year Olds | 3,285 (86.7%) | 506 (13.4%) |
| 35 Years and over | 1,897 (86.5%) | 296 (13.5%) |
| Total | 46,832 (90.1%) | 5,146 (9.9%) |
Educational Attainment by Field of Study in Cass County
Business (11,133 | 20.4%), science & technology (8,411 | 15.4%), education (7,142 | 13.1%), arts & humanities (4,773 | 8.7%), and bio, nature & agricultural (4,285 | 7.8%) are the most common fields of study among 54,650 individuals in Cass County who have obtained a bachelor's degree or higher.
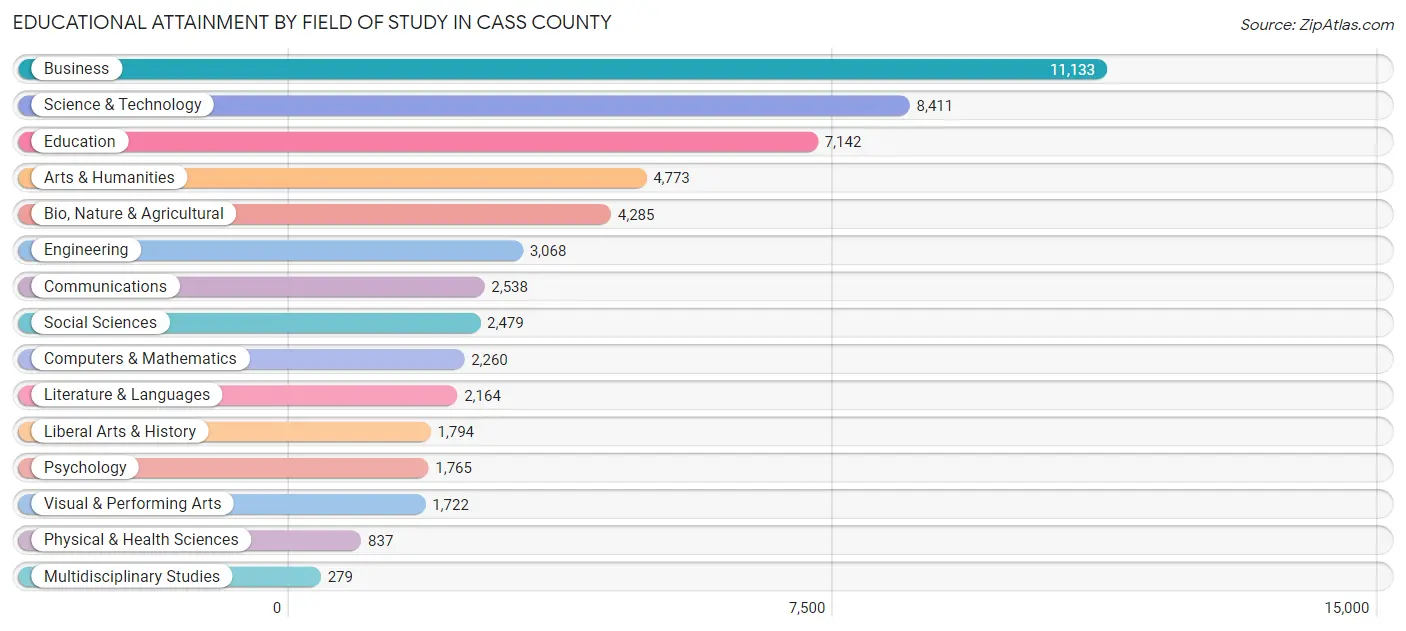
| Field of Study | # Graduates | % Graduates |
| Computers & Mathematics | 2,260 | 4.1% |
| Bio, Nature & Agricultural | 4,285 | 7.8% |
| Physical & Health Sciences | 837 | 1.5% |
| Psychology | 1,765 | 3.2% |
| Social Sciences | 2,479 | 4.5% |
| Engineering | 3,068 | 5.6% |
| Multidisciplinary Studies | 279 | 0.5% |
| Science & Technology | 8,411 | 15.4% |
| Business | 11,133 | 20.4% |
| Education | 7,142 | 13.1% |
| Literature & Languages | 2,164 | 4.0% |
| Liberal Arts & History | 1,794 | 3.3% |
| Visual & Performing Arts | 1,722 | 3.2% |
| Communications | 2,538 | 4.6% |
| Arts & Humanities | 4,773 | 8.7% |
| Total | 54,650 | 100.0% |
Transportation & Commute in Cass County
Vehicle Availability by Sex in Cass County
The most prevalent vehicle ownership categories in Cass County are males with 2 vehicles (26,774, accounting for 47.4%) and females with 2 vehicles (24,684, making up 54.6%).
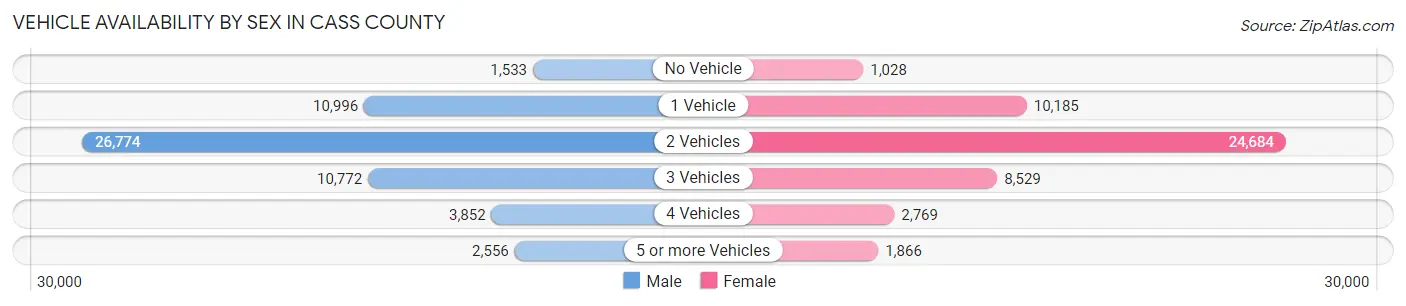
| Vehicles Available | Male | Female |
| No Vehicle | 1,533 (2.7%) | 1,028 (2.1%) |
| 1 Vehicle | 10,996 (19.5%) | 10,185 (20.8%) |
| 2 Vehicles | 26,774 (47.4%) | 24,684 (50.3%) |
| 3 Vehicles | 10,772 (19.1%) | 8,529 (17.4%) |
| 4 Vehicles | 3,852 (6.8%) | 2,769 (5.6%) |
| 5 or more Vehicles | 2,556 (4.5%) | 1,866 (3.8%) |
| Total | 56,483 (100.0%) | 49,061 (100.0%) |
Commute Time in Cass County
The most frequently occuring commute durations in Cass County are 10 to 14 minutes (27,014 commuters, 27.0%), 15 to 19 minutes (26,685 commuters, 26.6%), and 5 to 9 minutes (15,114 commuters, 15.1%).
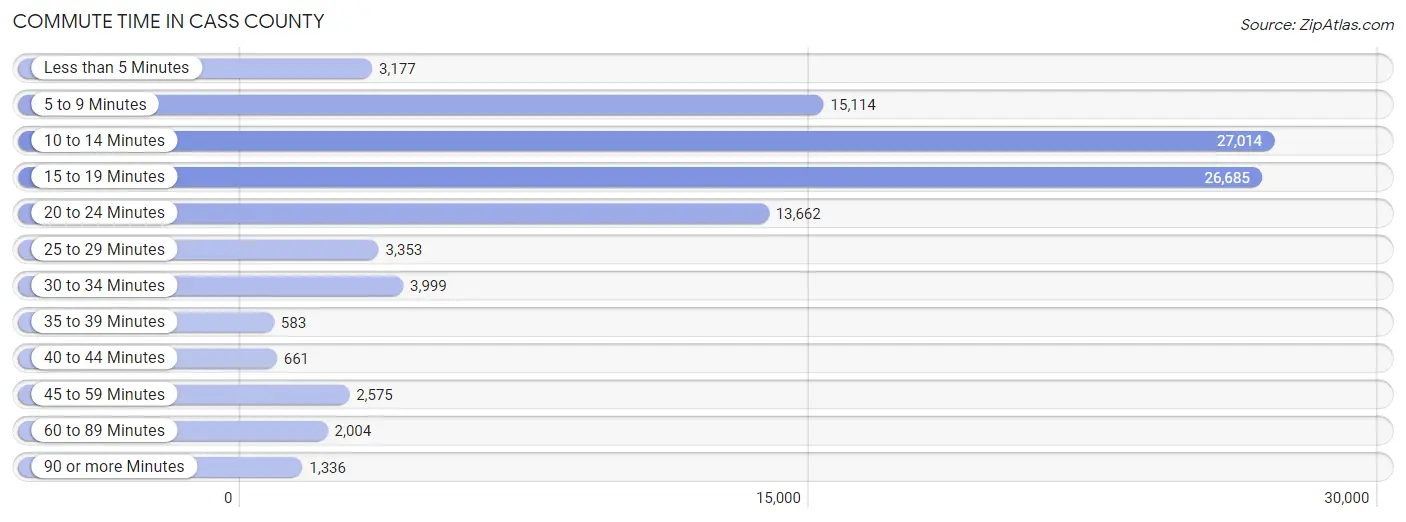
| Commute Time | # Commuters | % Commuters |
| Less than 5 Minutes | 3,177 | 3.2% |
| 5 to 9 Minutes | 15,114 | 15.1% |
| 10 to 14 Minutes | 27,014 | 27.0% |
| 15 to 19 Minutes | 26,685 | 26.6% |
| 20 to 24 Minutes | 13,662 | 13.6% |
| 25 to 29 Minutes | 3,353 | 3.4% |
| 30 to 34 Minutes | 3,999 | 4.0% |
| 35 to 39 Minutes | 583 | 0.6% |
| 40 to 44 Minutes | 661 | 0.7% |
| 45 to 59 Minutes | 2,575 | 2.6% |
| 60 to 89 Minutes | 2,004 | 2.0% |
| 90 or more Minutes | 1,336 | 1.3% |
Commute Time by Sex in Cass County
The most common commute times in Cass County are 10 to 14 minutes (15,055 commuters, 28.0%) for males and 10 to 14 minutes (11,959 commuters, 25.8%) for females.
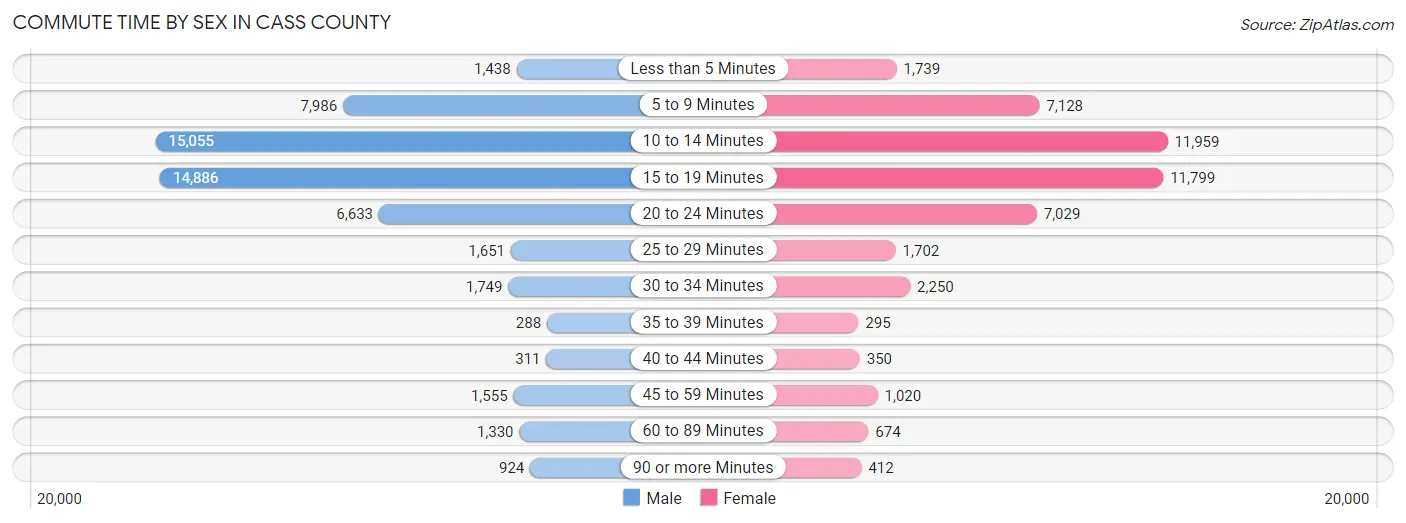
| Commute Time | Male | Female |
| Less than 5 Minutes | 1,438 (2.7%) | 1,739 (3.7%) |
| 5 to 9 Minutes | 7,986 (14.8%) | 7,128 (15.4%) |
| 10 to 14 Minutes | 15,055 (28.0%) | 11,959 (25.8%) |
| 15 to 19 Minutes | 14,886 (27.7%) | 11,799 (25.5%) |
| 20 to 24 Minutes | 6,633 (12.3%) | 7,029 (15.2%) |
| 25 to 29 Minutes | 1,651 (3.1%) | 1,702 (3.7%) |
| 30 to 34 Minutes | 1,749 (3.3%) | 2,250 (4.9%) |
| 35 to 39 Minutes | 288 (0.5%) | 295 (0.6%) |
| 40 to 44 Minutes | 311 (0.6%) | 350 (0.8%) |
| 45 to 59 Minutes | 1,555 (2.9%) | 1,020 (2.2%) |
| 60 to 89 Minutes | 1,330 (2.5%) | 674 (1.5%) |
| 90 or more Minutes | 924 (1.7%) | 412 (0.9%) |
Time of Departure to Work by Sex in Cass County
The most frequent times of departure to work in Cass County are 7:30 AM to 7:59 AM (9,935, 18.5%) for males and 7:30 AM to 7:59 AM (10,545, 22.8%) for females.
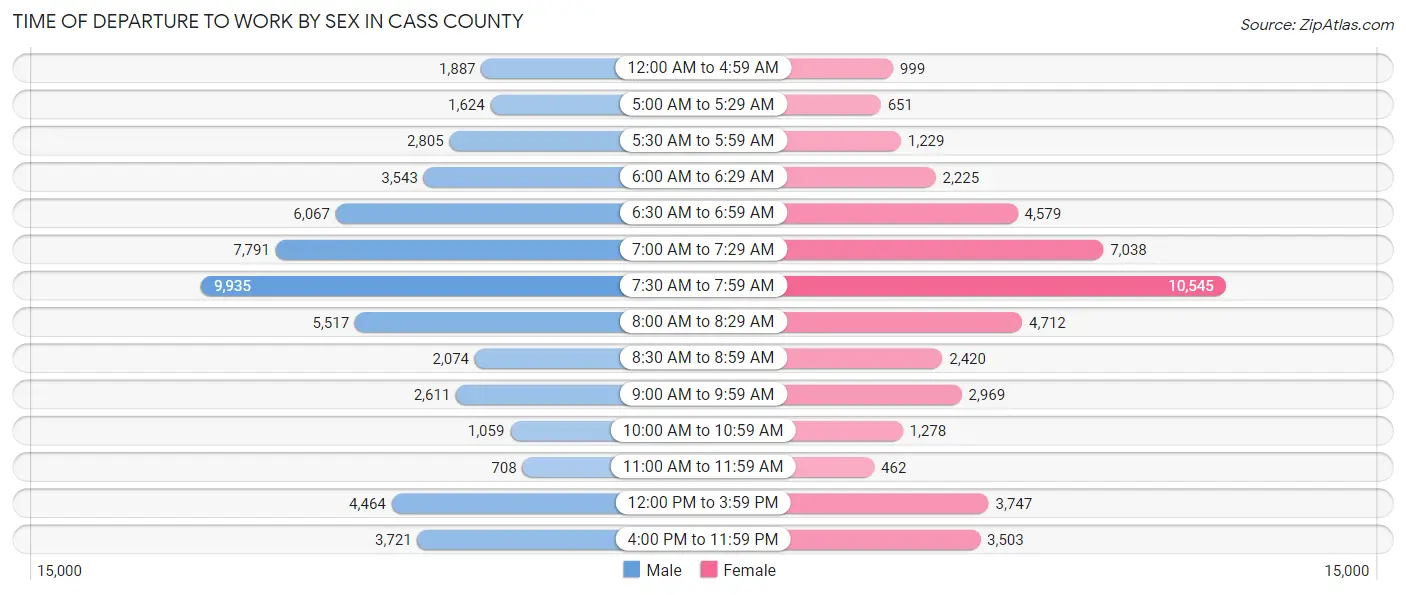
| Time of Departure | Male | Female |
| 12:00 AM to 4:59 AM | 1,887 (3.5%) | 999 (2.2%) |
| 5:00 AM to 5:29 AM | 1,624 (3.0%) | 651 (1.4%) |
| 5:30 AM to 5:59 AM | 2,805 (5.2%) | 1,229 (2.6%) |
| 6:00 AM to 6:29 AM | 3,543 (6.6%) | 2,225 (4.8%) |
| 6:30 AM to 6:59 AM | 6,067 (11.3%) | 4,579 (9.9%) |
| 7:00 AM to 7:29 AM | 7,791 (14.5%) | 7,038 (15.2%) |
| 7:30 AM to 7:59 AM | 9,935 (18.5%) | 10,545 (22.8%) |
| 8:00 AM to 8:29 AM | 5,517 (10.2%) | 4,712 (10.2%) |
| 8:30 AM to 8:59 AM | 2,074 (3.8%) | 2,420 (5.2%) |
| 9:00 AM to 9:59 AM | 2,611 (4.9%) | 2,969 (6.4%) |
| 10:00 AM to 10:59 AM | 1,059 (2.0%) | 1,278 (2.8%) |
| 11:00 AM to 11:59 AM | 708 (1.3%) | 462 (1.0%) |
| 12:00 PM to 3:59 PM | 4,464 (8.3%) | 3,747 (8.1%) |
| 4:00 PM to 11:59 PM | 3,721 (6.9%) | 3,503 (7.6%) |
| Total | 53,806 (100.0%) | 46,357 (100.0%) |
Housing Occupancy in Cass County
Occupancy by Ownership in Cass County
Of the total 79,505 dwellings in Cass County, owner-occupied units account for 41,610 (52.3%), while renter-occupied units make up 37,895 (47.7%).
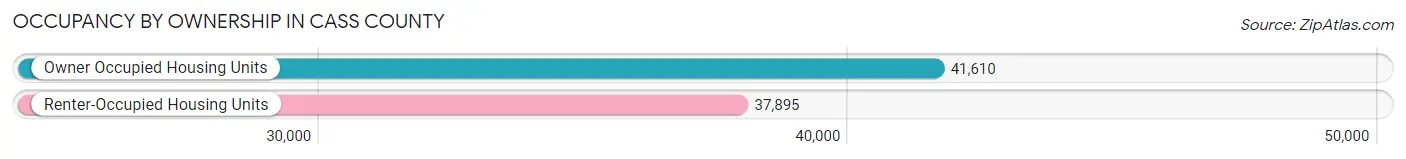
| Occupancy | # Housing Units | % Housing Units |
| Owner Occupied Housing Units | 41,610 | 52.3% |
| Renter-Occupied Housing Units | 37,895 | 47.7% |
| Total Occupied Housing Units | 79,505 | 100.0% |
Occupancy by Household Size in Cass County
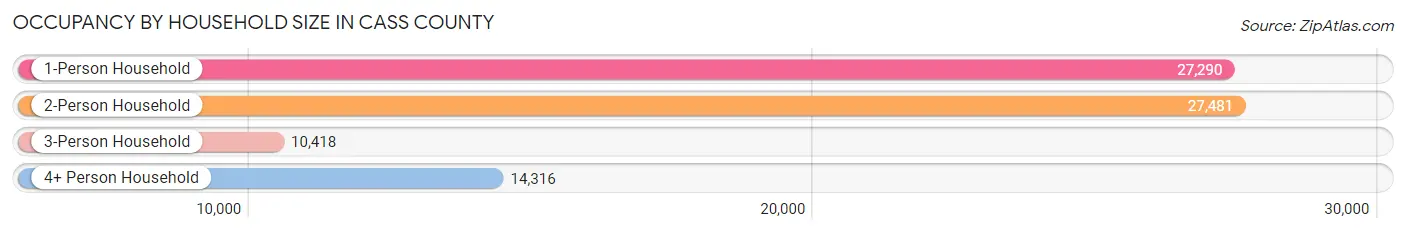
| Household Size | # Housing Units | % Housing Units |
| 1-Person Household | 27,290 | 34.3% |
| 2-Person Household | 27,481 | 34.6% |
| 3-Person Household | 10,418 | 13.1% |
| 4+ Person Household | 14,316 | 18.0% |
| Total Housing Units | 79,505 | 100.0% |
Occupancy by Ownership by Household Size in Cass County
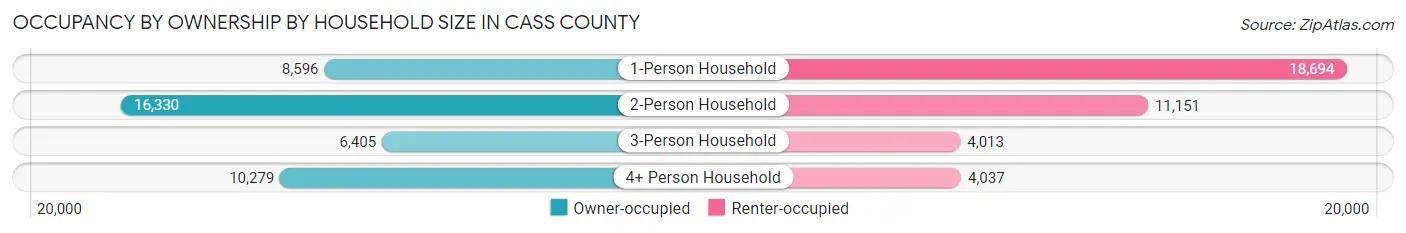
| Household Size | Owner-occupied | Renter-occupied |
| 1-Person Household | 8,596 (31.5%) | 18,694 (68.5%) |
| 2-Person Household | 16,330 (59.4%) | 11,151 (40.6%) |
| 3-Person Household | 6,405 (61.5%) | 4,013 (38.5%) |
| 4+ Person Household | 10,279 (71.8%) | 4,037 (28.2%) |
| Total Housing Units | 41,610 (52.3%) | 37,895 (47.7%) |
Occupancy by Educational Attainment in Cass County
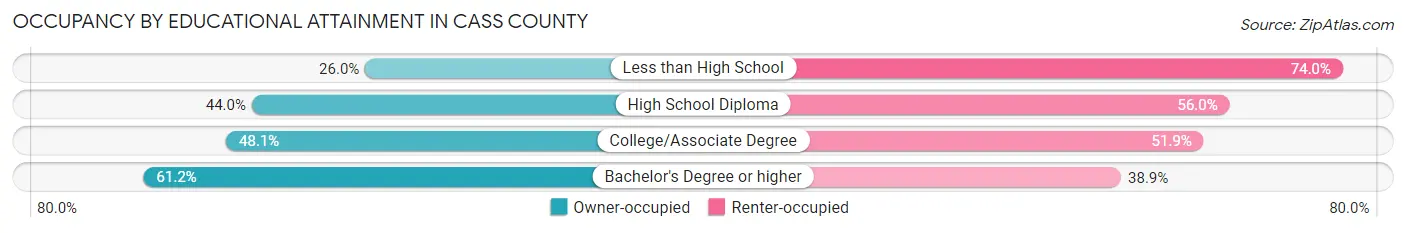
| Household Size | Owner-occupied | Renter-occupied |
| Less than High School | 672 (26.0%) | 1,915 (74.0%) |
| High School Diploma | 5,945 (44.0%) | 7,579 (56.0%) |
| College/Associate Degree | 13,851 (48.1%) | 14,971 (51.9%) |
| Bachelor's Degree or higher | 21,142 (61.2%) | 13,430 (38.9%) |
Occupancy by Age of Householder in Cass County
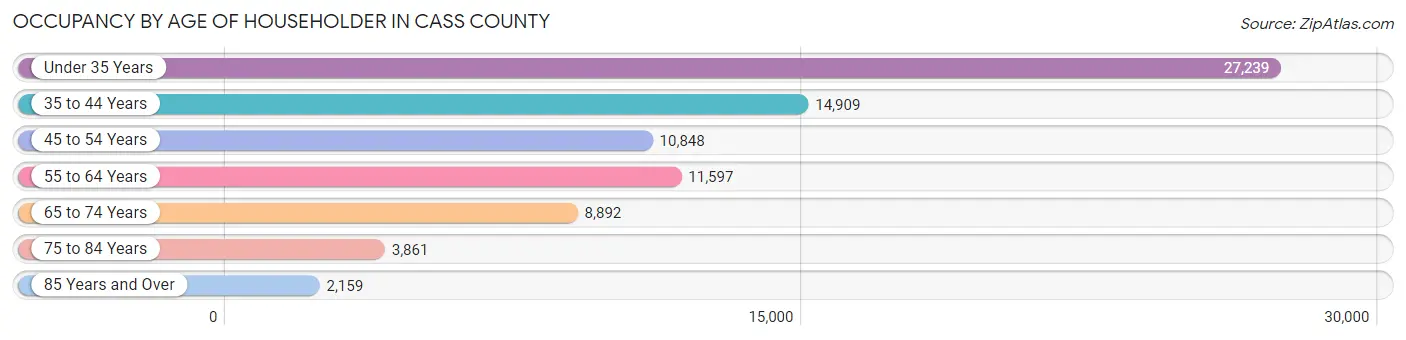
| Age Bracket | # Households | % Households |
| Under 35 Years | 27,239 | 34.3% |
| 35 to 44 Years | 14,909 | 18.8% |
| 45 to 54 Years | 10,848 | 13.6% |
| 55 to 64 Years | 11,597 | 14.6% |
| 65 to 74 Years | 8,892 | 11.2% |
| 75 to 84 Years | 3,861 | 4.9% |
| 85 Years and Over | 2,159 | 2.7% |
| Total | 79,505 | 100.0% |
Housing Finances in Cass County
Median Income by Occupancy in Cass County
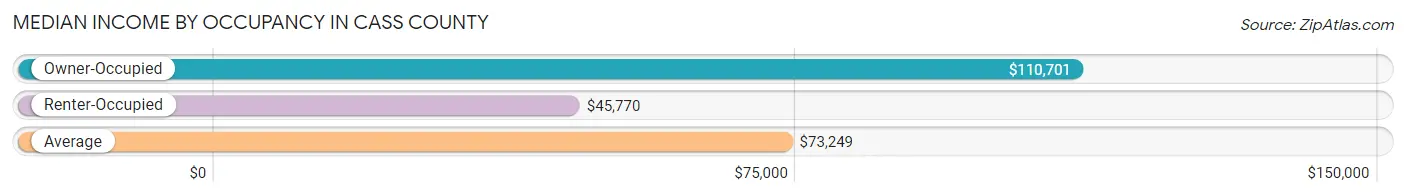
| Occupancy Type | # Households | Median Income |
| Owner-Occupied | 41,610 (52.3%) | $110,701 |
| Renter-Occupied | 37,895 (47.7%) | $45,770 |
| Average | 79,505 (100.0%) | $73,249 |
Occupancy by Householder Income Bracket in Cass County
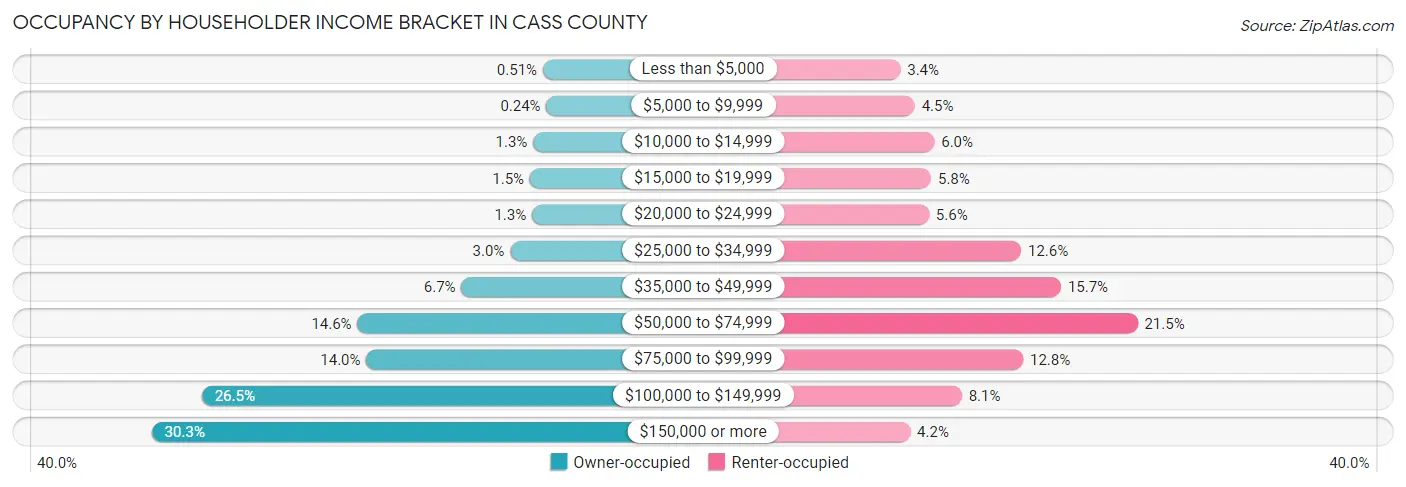
| Income Bracket | Owner-occupied | Renter-occupied |
| Less than $5,000 | 214 (0.5%) | 1,293 (3.4%) |
| $5,000 to $9,999 | 101 (0.2%) | 1,710 (4.5%) |
| $10,000 to $14,999 | 522 (1.3%) | 2,273 (6.0%) |
| $15,000 to $19,999 | 624 (1.5%) | 2,179 (5.8%) |
| $20,000 to $24,999 | 558 (1.3%) | 2,119 (5.6%) |
| $25,000 to $34,999 | 1,249 (3.0%) | 4,777 (12.6%) |
| $35,000 to $49,999 | 2,795 (6.7%) | 5,931 (15.7%) |
| $50,000 to $74,999 | 6,092 (14.6%) | 8,138 (21.5%) |
| $75,000 to $99,999 | 5,807 (14.0%) | 4,834 (12.8%) |
| $100,000 to $149,999 | 11,026 (26.5%) | 3,065 (8.1%) |
| $150,000 or more | 12,622 (30.3%) | 1,576 (4.2%) |
| Total | 41,610 (100.0%) | 37,895 (100.0%) |
Monthly Housing Cost Tiers in Cass County
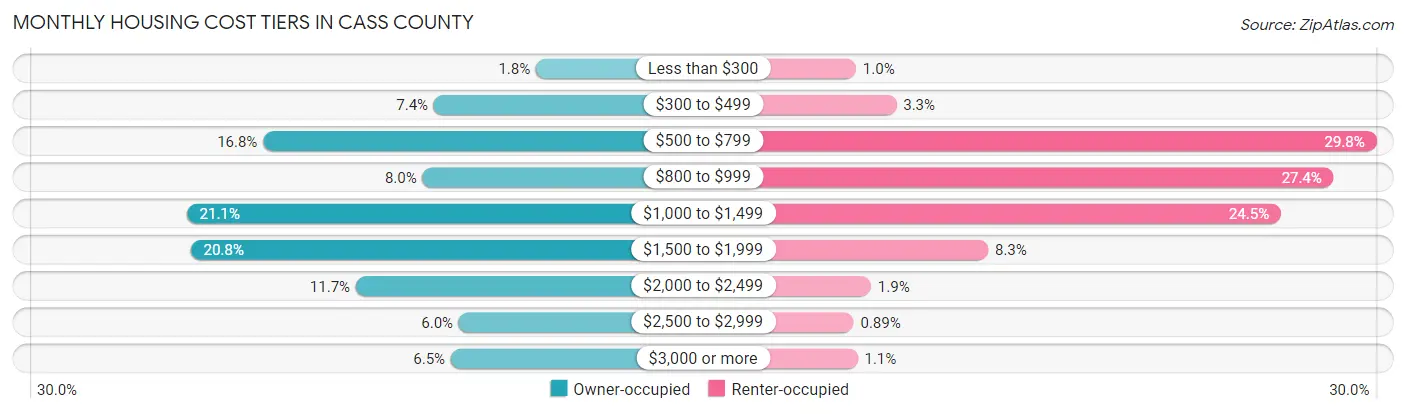
| Monthly Cost | Owner-occupied | Renter-occupied |
| Less than $300 | 729 (1.8%) | 388 (1.0%) |
| $300 to $499 | 3,075 (7.4%) | 1,233 (3.3%) |
| $500 to $799 | 6,997 (16.8%) | 11,286 (29.8%) |
| $800 to $999 | 3,336 (8.0%) | 10,387 (27.4%) |
| $1,000 to $1,499 | 8,757 (21.0%) | 9,283 (24.5%) |
| $1,500 to $1,999 | 8,666 (20.8%) | 3,151 (8.3%) |
| $2,000 to $2,499 | 4,867 (11.7%) | 702 (1.8%) |
| $2,500 to $2,999 | 2,501 (6.0%) | 337 (0.9%) |
| $3,000 or more | 2,682 (6.5%) | 419 (1.1%) |
| Total | 41,610 (100.0%) | 37,895 (100.0%) |
Physical Housing Characteristics in Cass County
Housing Structures in Cass County
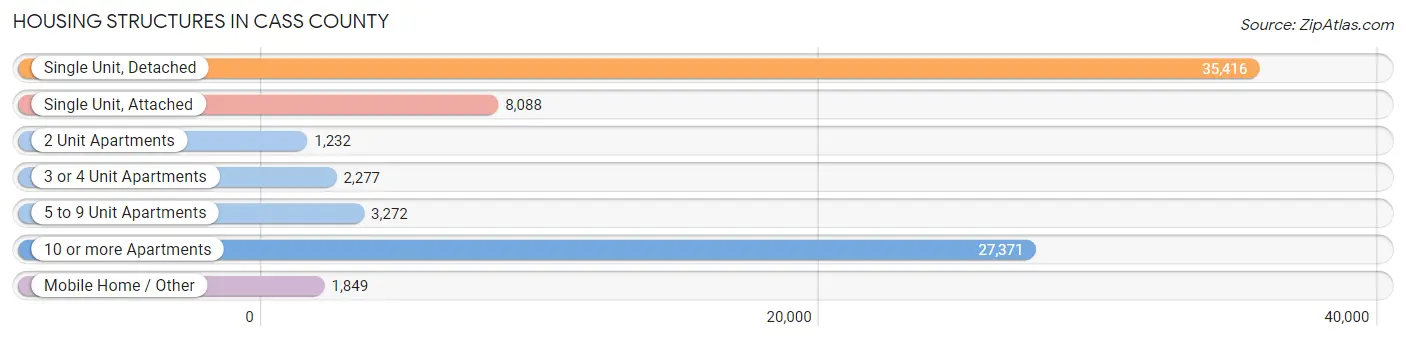
| Structure Type | # Housing Units | % Housing Units |
| Single Unit, Detached | 35,416 | 44.6% |
| Single Unit, Attached | 8,088 | 10.2% |
| 2 Unit Apartments | 1,232 | 1.5% |
| 3 or 4 Unit Apartments | 2,277 | 2.9% |
| 5 to 9 Unit Apartments | 3,272 | 4.1% |
| 10 or more Apartments | 27,371 | 34.4% |
| Mobile Home / Other | 1,849 | 2.3% |
| Total | 79,505 | 100.0% |
Housing Structures by Occupancy in Cass County
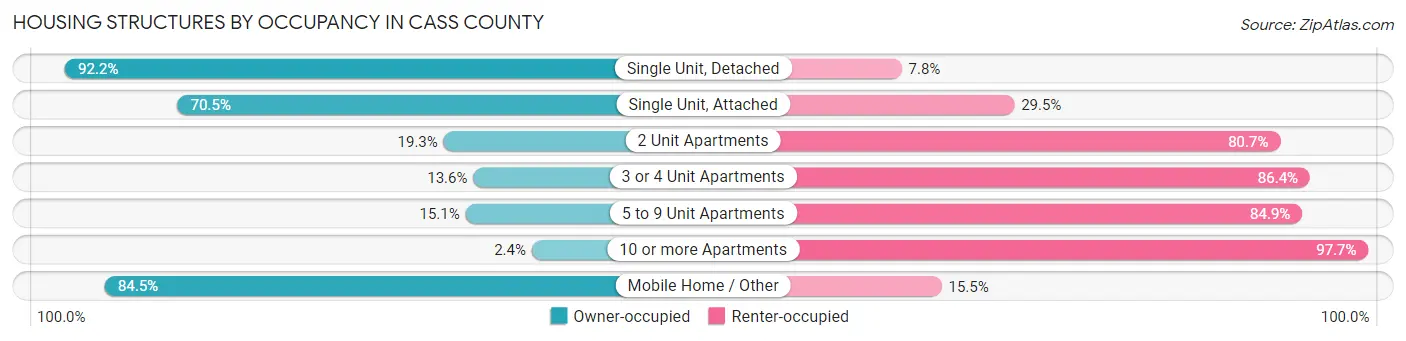
| Structure Type | Owner-occupied | Renter-occupied |
| Single Unit, Detached | 32,658 (92.2%) | 2,758 (7.8%) |
| Single Unit, Attached | 5,705 (70.5%) | 2,383 (29.5%) |
| 2 Unit Apartments | 238 (19.3%) | 994 (80.7%) |
| 3 or 4 Unit Apartments | 310 (13.6%) | 1,967 (86.4%) |
| 5 to 9 Unit Apartments | 494 (15.1%) | 2,778 (84.9%) |
| 10 or more Apartments | 642 (2.4%) | 26,729 (97.7%) |
| Mobile Home / Other | 1,563 (84.5%) | 286 (15.5%) |
| Total | 41,610 (52.3%) | 37,895 (47.7%) |
Housing Structures by Number of Rooms in Cass County
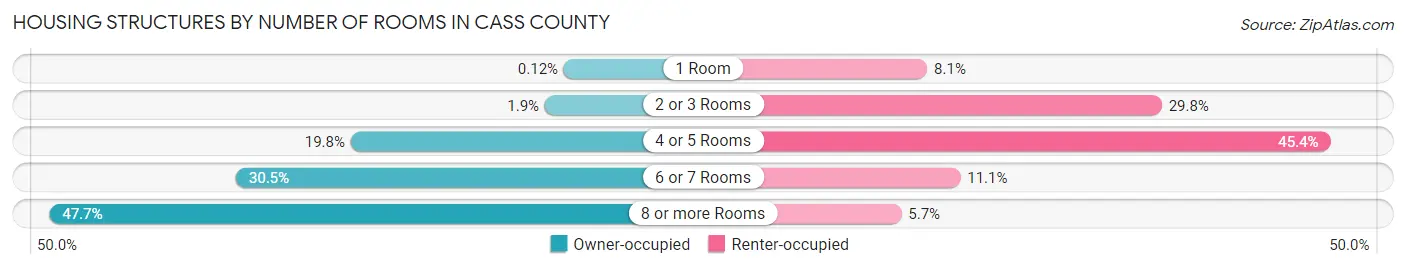
| Number of Rooms | Owner-occupied | Renter-occupied |
| 1 Room | 48 (0.1%) | 3,057 (8.1%) |
| 2 or 3 Rooms | 784 (1.9%) | 11,279 (29.8%) |
| 4 or 5 Rooms | 8,251 (19.8%) | 17,190 (45.4%) |
| 6 or 7 Rooms | 12,675 (30.5%) | 4,217 (11.1%) |
| 8 or more Rooms | 19,852 (47.7%) | 2,152 (5.7%) |
| Total | 41,610 (100.0%) | 37,895 (100.0%) |
Housing Structure by Heating Type in Cass County
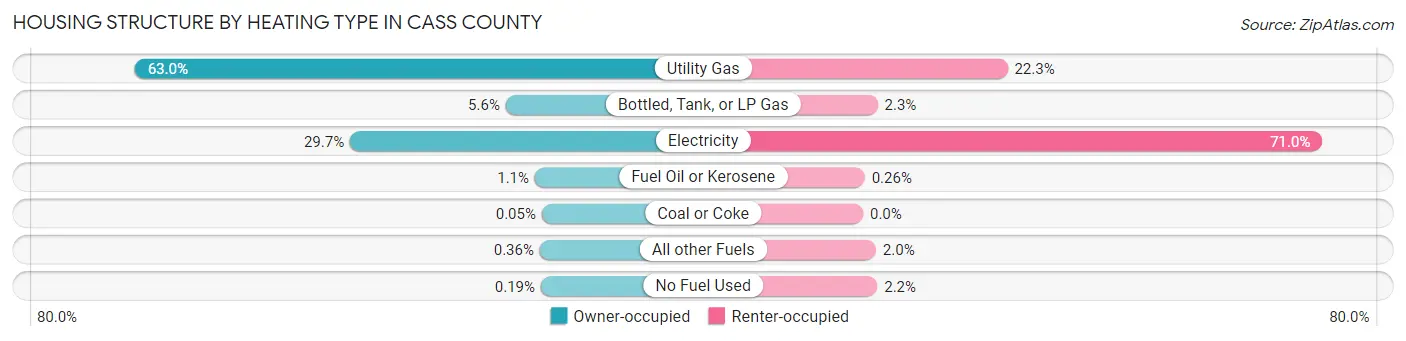
| Heating Type | Owner-occupied | Renter-occupied |
| Utility Gas | 26,201 (63.0%) | 8,462 (22.3%) |
| Bottled, Tank, or LP Gas | 2,340 (5.6%) | 853 (2.2%) |
| Electricity | 12,358 (29.7%) | 26,896 (71.0%) |
| Fuel Oil or Kerosene | 465 (1.1%) | 97 (0.3%) |
| Coal or Coke | 19 (0.1%) | 0 (0.0%) |
| All other Fuels | 149 (0.4%) | 753 (2.0%) |
| No Fuel Used | 78 (0.2%) | 834 (2.2%) |
| Total | 41,610 (100.0%) | 37,895 (100.0%) |
Household Vehicle Usage in Cass County
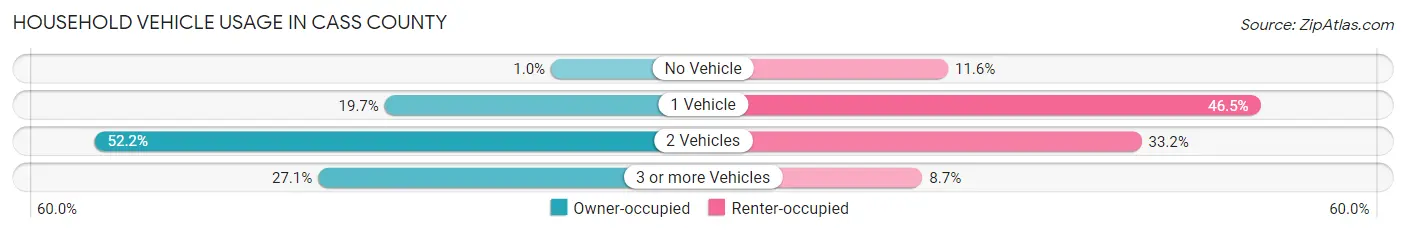
| Vehicles per Household | Owner-occupied | Renter-occupied |
| No Vehicle | 434 (1.0%) | 4,375 (11.6%) |
| 1 Vehicle | 8,185 (19.7%) | 17,638 (46.5%) |
| 2 Vehicles | 21,701 (52.1%) | 12,591 (33.2%) |
| 3 or more Vehicles | 11,290 (27.1%) | 3,291 (8.7%) |
| Total | 41,610 (100.0%) | 37,895 (100.0%) |
Real Estate & Mortgages in Cass County
Real Estate and Mortgage Overview in Cass County
| Characteristic | Without Mortgage | With Mortgage |
| Housing Units | 13,983 | 27,627 |
| Median Property Value | $261,300 | $275,600 |
| Median Household Income | $89,004 | $9,066 |
| Monthly Housing Costs | $636 | $2,638 |
| Real Estate Taxes | $3,160 | $444 |
Property Value by Mortgage Status in Cass County
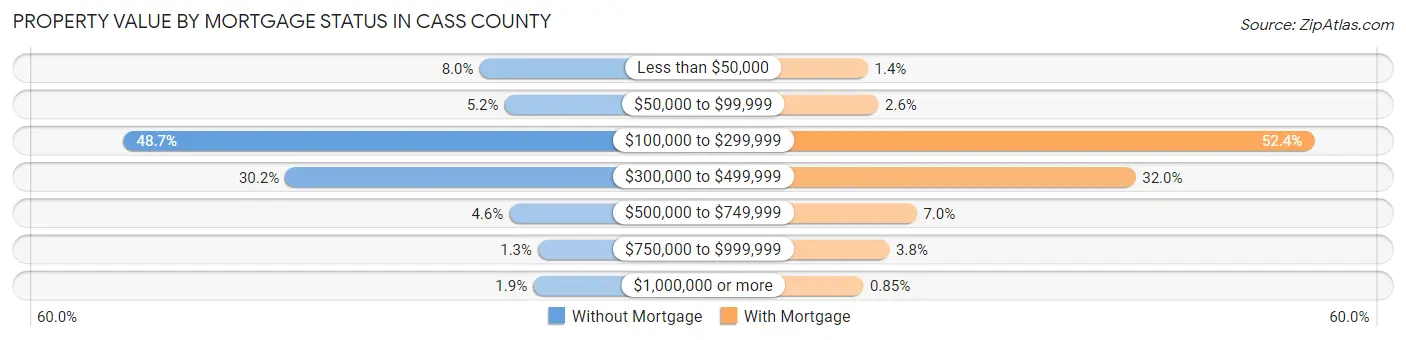
| Property Value | Without Mortgage | With Mortgage |
| Less than $50,000 | 1,123 (8.0%) | 382 (1.4%) |
| $50,000 to $99,999 | 725 (5.2%) | 712 (2.6%) |
| $100,000 to $299,999 | 6,807 (48.7%) | 14,480 (52.4%) |
| $300,000 to $499,999 | 4,229 (30.2%) | 8,833 (32.0%) |
| $500,000 to $749,999 | 647 (4.6%) | 1,923 (7.0%) |
| $750,000 to $999,999 | 187 (1.3%) | 1,061 (3.8%) |
| $1,000,000 or more | 265 (1.9%) | 236 (0.9%) |
| Total | 13,983 (100.0%) | 27,627 (100.0%) |
Household Income by Mortgage Status in Cass County
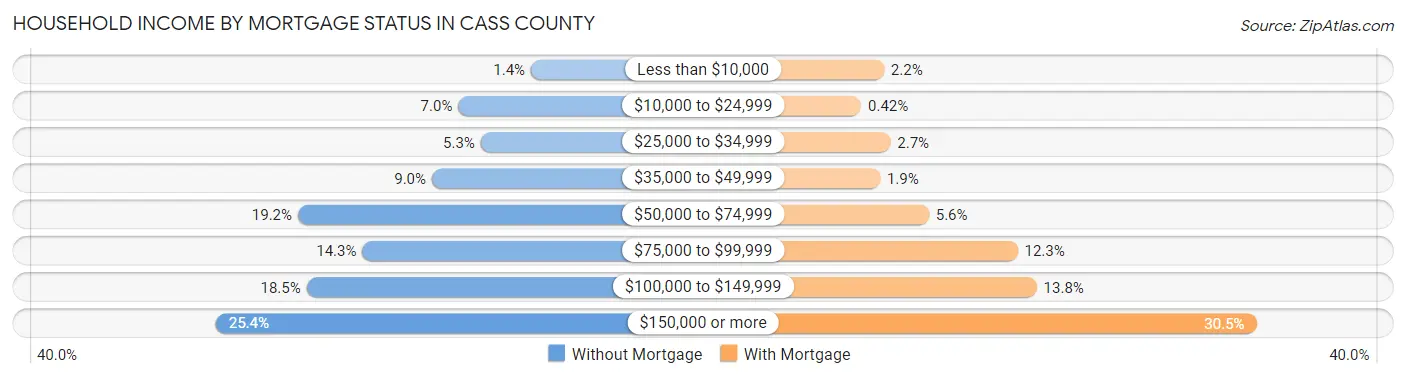
| Household Income | Without Mortgage | With Mortgage |
| Less than $10,000 | 199 (1.4%) | 598 (2.2%) |
| $10,000 to $24,999 | 973 (7.0%) | 116 (0.4%) |
| $25,000 to $34,999 | 734 (5.2%) | 731 (2.6%) |
| $35,000 to $49,999 | 1,254 (9.0%) | 515 (1.9%) |
| $50,000 to $74,999 | 2,682 (19.2%) | 1,541 (5.6%) |
| $75,000 to $99,999 | 1,995 (14.3%) | 3,410 (12.3%) |
| $100,000 to $149,999 | 2,590 (18.5%) | 3,812 (13.8%) |
| $150,000 or more | 3,556 (25.4%) | 8,436 (30.5%) |
| Total | 13,983 (100.0%) | 27,627 (100.0%) |
Property Value to Household Income Ratio in Cass County
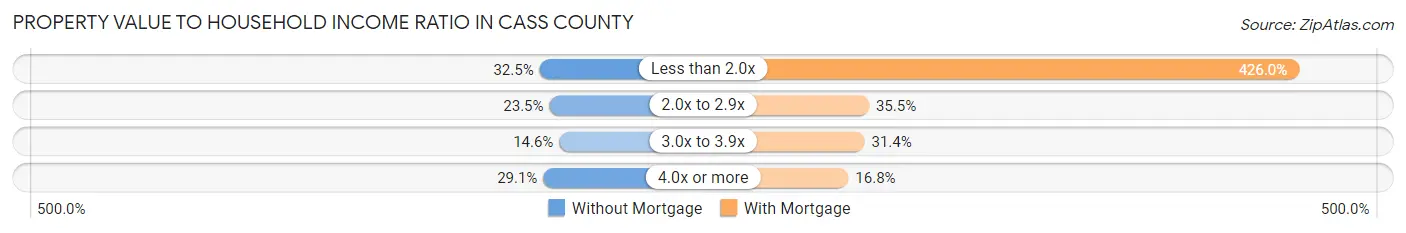
| Value-to-Income Ratio | Without Mortgage | With Mortgage |
| Less than 2.0x | 4,537 (32.5%) | 117,693 (426.0%) |
| 2.0x to 2.9x | 3,285 (23.5%) | 9,796 (35.5%) |
| 3.0x to 3.9x | 2,036 (14.6%) | 8,678 (31.4%) |
| 4.0x or more | 4,067 (29.1%) | 4,635 (16.8%) |
| Total | 13,983 (100.0%) | 27,627 (100.0%) |
Real Estate Taxes by Mortgage Status in Cass County
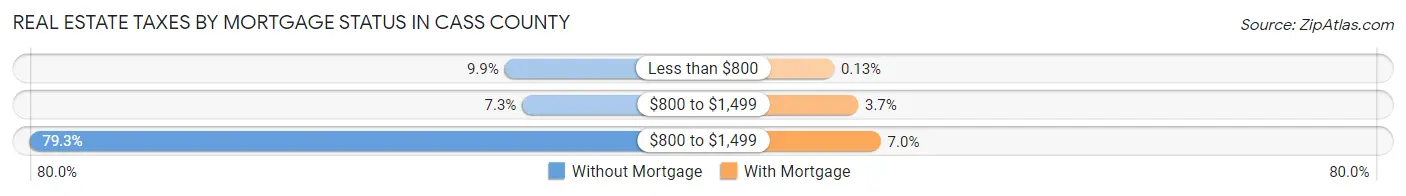
| Property Taxes | Without Mortgage | With Mortgage |
| Less than $800 | 1,380 (9.9%) | 35 (0.1%) |
| $800 to $1,499 | 1,020 (7.3%) | 1,009 (3.6%) |
| $800 to $1,499 | 11,090 (79.3%) | 1,923 (7.0%) |
| Total | 13,983 (100.0%) | 27,627 (100.0%) |
Health & Disability in Cass County
Health Insurance Coverage by Age in Cass County
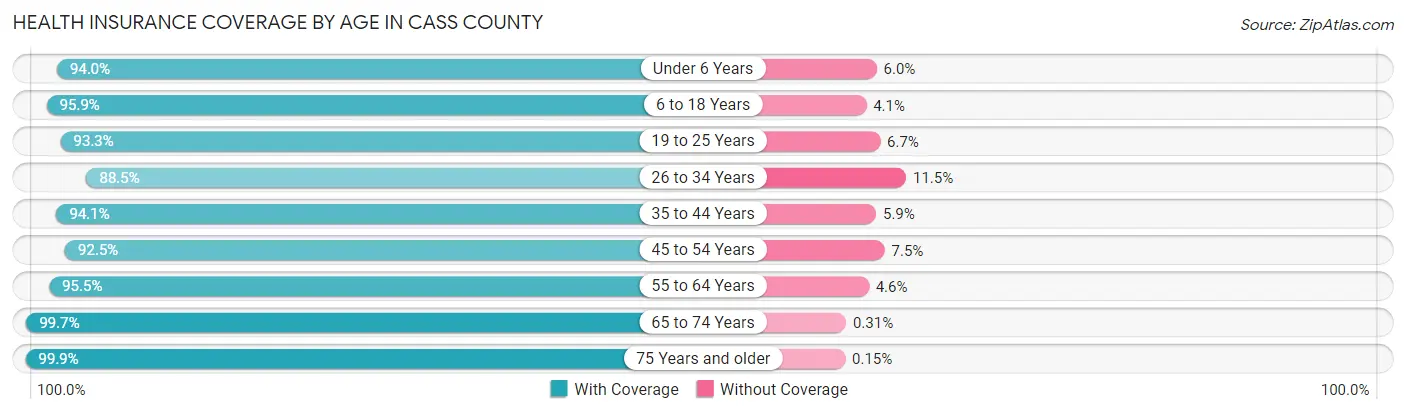
| Age Bracket | With Coverage | Without Coverage |
| Under 6 Years | 13,603 (94.0%) | 872 (6.0%) |
| 6 to 18 Years | 29,027 (95.9%) | 1,235 (4.1%) |
| 19 to 25 Years | 25,852 (93.3%) | 1,848 (6.7%) |
| 26 to 34 Years | 24,165 (88.5%) | 3,147 (11.5%) |
| 35 to 44 Years | 23,683 (94.1%) | 1,491 (5.9%) |
| 45 to 54 Years | 17,037 (92.5%) | 1,385 (7.5%) |
| 55 to 64 Years | 17,752 (95.5%) | 847 (4.5%) |
| 65 to 74 Years | 13,655 (99.7%) | 42 (0.3%) |
| 75 Years and older | 8,827 (99.9%) | 13 (0.2%) |
| Total | 173,601 (94.1%) | 10,880 (5.9%) |
Health Insurance Coverage by Citizenship Status in Cass County
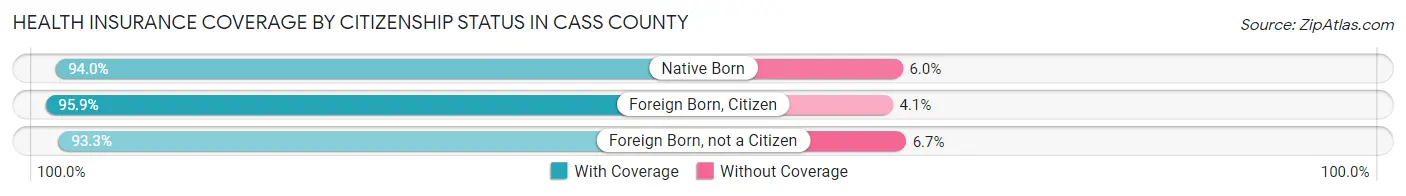
| Citizenship Status | With Coverage | Without Coverage |
| Native Born | 13,603 (94.0%) | 872 (6.0%) |
| Foreign Born, Citizen | 29,027 (95.9%) | 1,235 (4.1%) |
| Foreign Born, not a Citizen | 25,852 (93.3%) | 1,848 (6.7%) |
Health Insurance Coverage by Household Income in Cass County
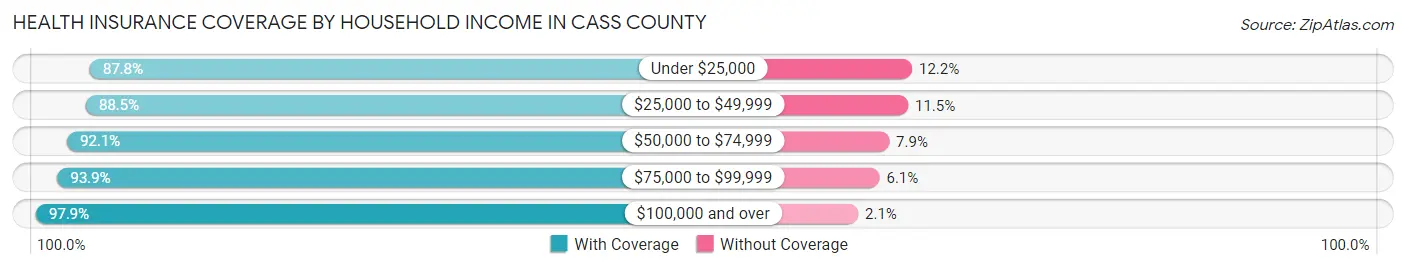
| Household Income | With Coverage | Without Coverage |
| Under $25,000 | 15,373 (87.8%) | 2,140 (12.2%) |
| $25,000 to $49,999 | 21,618 (88.5%) | 2,800 (11.5%) |
| $50,000 to $74,999 | 25,967 (92.1%) | 2,239 (7.9%) |
| $75,000 to $99,999 | 24,435 (93.9%) | 1,599 (6.1%) |
| $100,000 and over | 81,945 (97.9%) | 1,777 (2.1%) |
Public vs Private Health Insurance Coverage by Age in Cass County
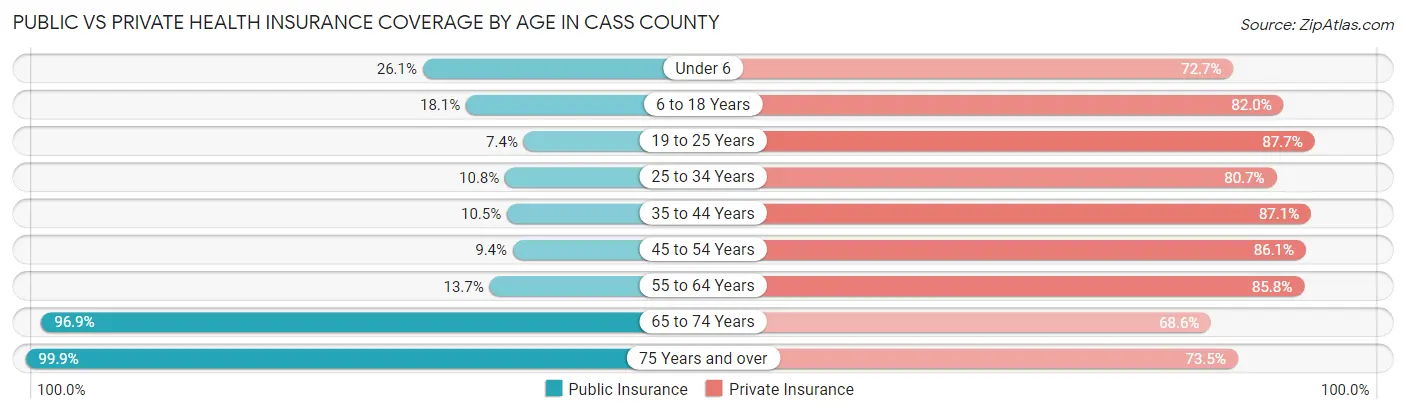
| Age Bracket | Public Insurance | Private Insurance |
| Under 6 | 3,777 (26.1%) | 10,519 (72.7%) |
| 6 to 18 Years | 5,465 (18.1%) | 24,816 (82.0%) |
| 19 to 25 Years | 2,037 (7.3%) | 24,304 (87.7%) |
| 25 to 34 Years | 2,953 (10.8%) | 22,031 (80.7%) |
| 35 to 44 Years | 2,631 (10.4%) | 21,922 (87.1%) |
| 45 to 54 Years | 1,727 (9.4%) | 15,867 (86.1%) |
| 55 to 64 Years | 2,548 (13.7%) | 15,957 (85.8%) |
| 65 to 74 Years | 13,271 (96.9%) | 9,390 (68.6%) |
| 75 Years and over | 8,827 (99.9%) | 6,495 (73.5%) |
| Total | 43,236 (23.4%) | 151,301 (82.0%) |
Disability Status by Sex by Age in Cass County
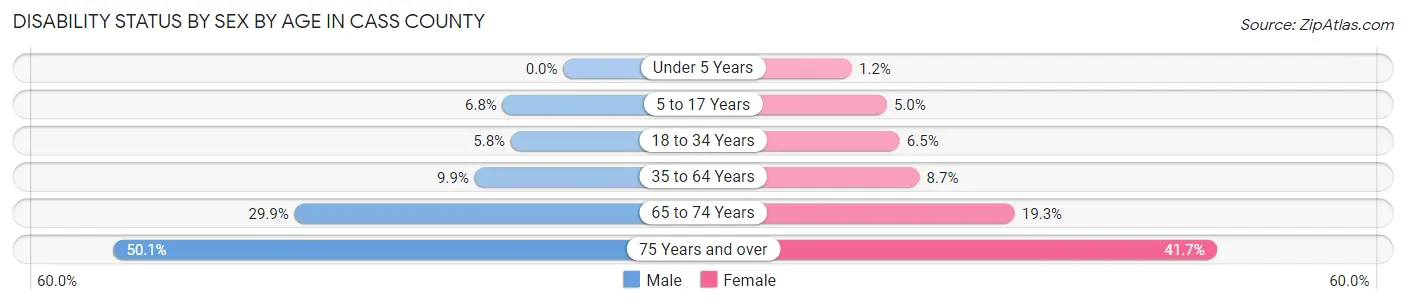
| Age Bracket | Male | Female |
| Under 5 Years | 0 (0.0%) | 68 (1.1%) |
| 5 to 17 Years | 984 (6.8%) | 735 (5.0%) |
| 18 to 34 Years | 1,764 (5.8%) | 1,830 (6.5%) |
| 35 to 64 Years | 3,185 (9.9%) | 2,595 (8.7%) |
| 65 to 74 Years | 2,015 (29.9%) | 1,343 (19.3%) |
| 75 Years and over | 1,786 (50.1%) | 2,201 (41.7%) |
Disability Class by Sex by Age in Cass County
Disability Class: Hearing Difficulty
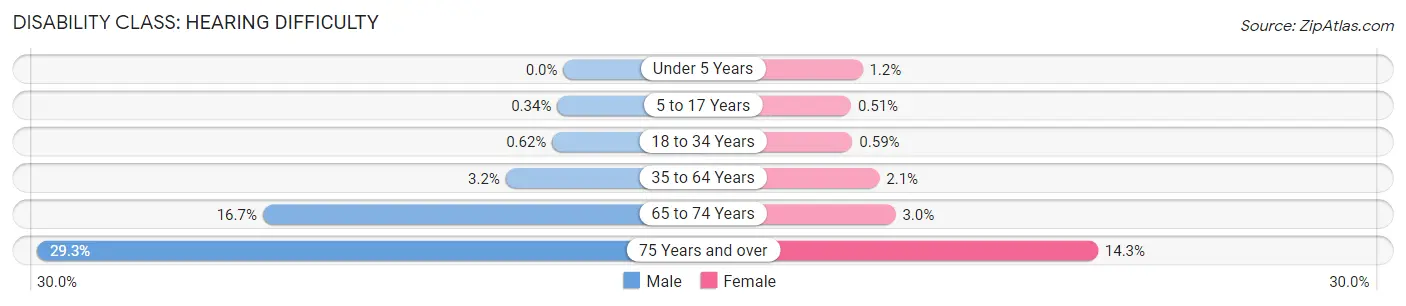
| Age Bracket | Male | Female |
| Under 5 Years | 0 (0.0%) | 68 (1.1%) |
| 5 to 17 Years | 49 (0.3%) | 75 (0.5%) |
| 18 to 34 Years | 187 (0.6%) | 168 (0.6%) |
| 35 to 64 Years | 1,035 (3.2%) | 626 (2.1%) |
| 65 to 74 Years | 1,127 (16.7%) | 208 (3.0%) |
| 75 Years and over | 1,045 (29.3%) | 752 (14.3%) |
Disability Class: Vision Difficulty
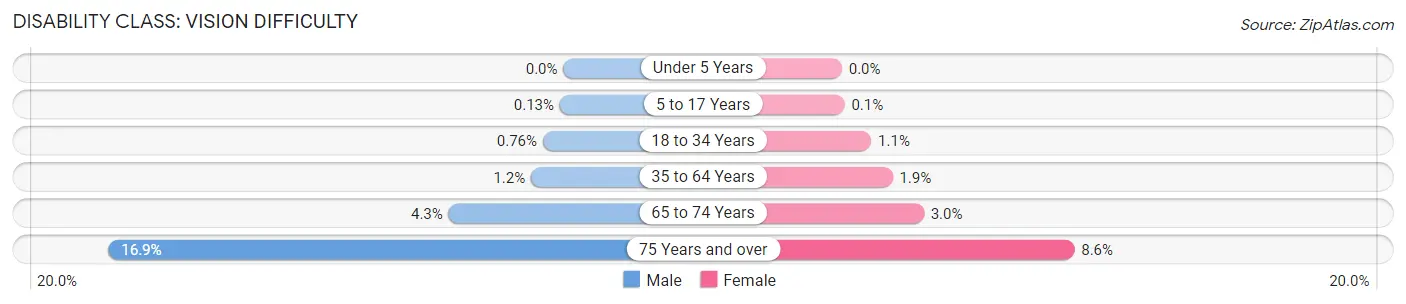
| Age Bracket | Male | Female |
| Under 5 Years | 0 (0.0%) | 0 (0.0%) |
| 5 to 17 Years | 19 (0.1%) | 15 (0.1%) |
| 18 to 34 Years | 231 (0.8%) | 308 (1.1%) |
| 35 to 64 Years | 386 (1.2%) | 562 (1.9%) |
| 65 to 74 Years | 287 (4.3%) | 212 (3.0%) |
| 75 Years and over | 602 (16.9%) | 455 (8.6%) |
Disability Class: Cognitive Difficulty
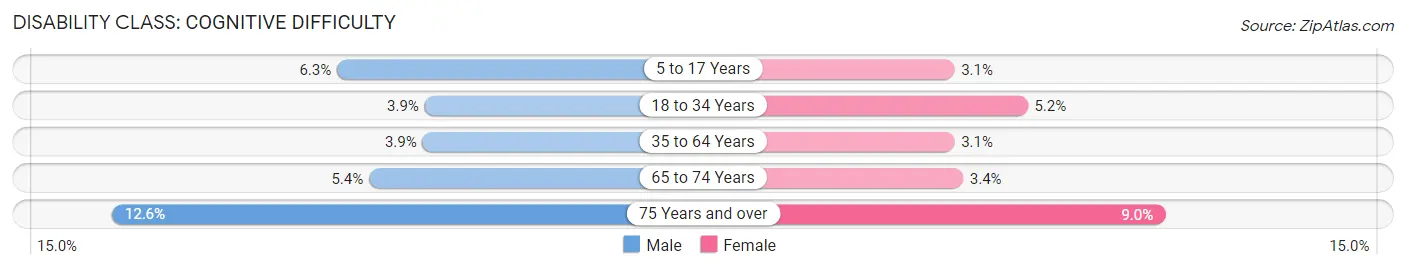
| Age Bracket | Male | Female |
| 5 to 17 Years | 916 (6.3%) | 458 (3.1%) |
| 18 to 34 Years | 1,166 (3.9%) | 1,460 (5.2%) |
| 35 to 64 Years | 1,265 (3.9%) | 938 (3.1%) |
| 65 to 74 Years | 364 (5.4%) | 235 (3.4%) |
| 75 Years and over | 448 (12.6%) | 475 (9.0%) |
Disability Class: Ambulatory Difficulty
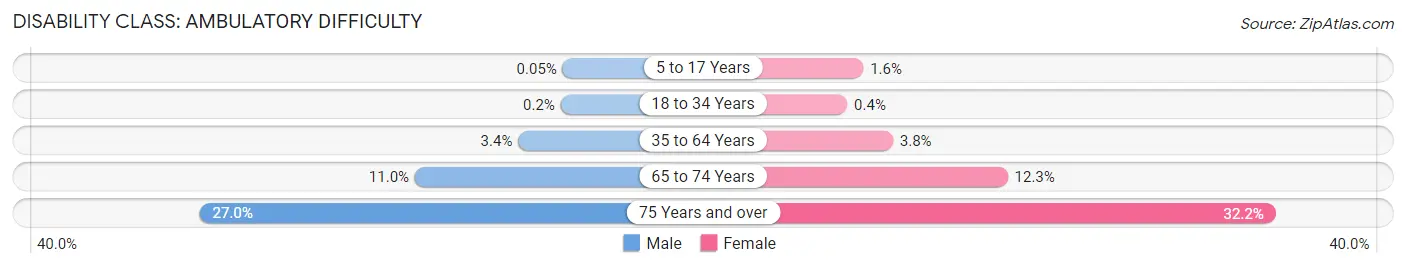
| Age Bracket | Male | Female |
| 5 to 17 Years | 7 (0.1%) | 232 (1.6%) |
| 18 to 34 Years | 61 (0.2%) | 112 (0.4%) |
| 35 to 64 Years | 1,082 (3.4%) | 1,133 (3.8%) |
| 65 to 74 Years | 742 (11.0%) | 857 (12.3%) |
| 75 Years and over | 963 (27.0%) | 1,699 (32.2%) |
Disability Class: Self-Care Difficulty
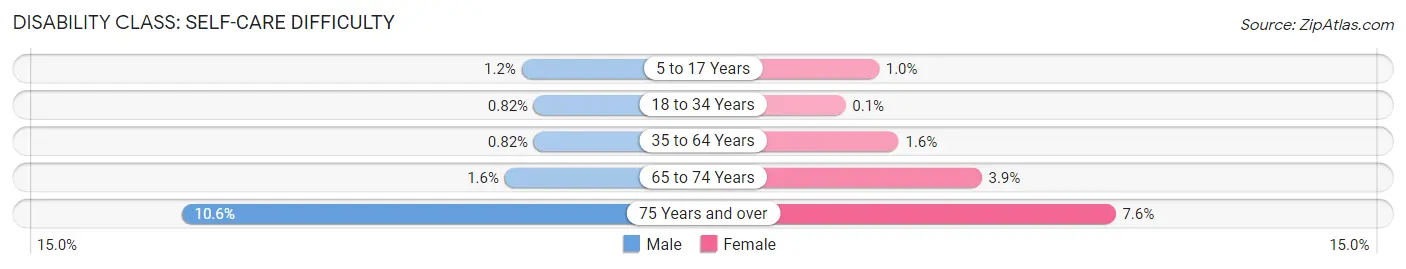
| Age Bracket | Male | Female |
| 5 to 17 Years | 169 (1.2%) | 151 (1.0%) |
| 18 to 34 Years | 248 (0.8%) | 27 (0.1%) |
| 35 to 64 Years | 263 (0.8%) | 474 (1.6%) |
| 65 to 74 Years | 110 (1.6%) | 271 (3.9%) |
| 75 Years and over | 379 (10.6%) | 402 (7.6%) |
Technology Access in Cass County
Computing Device Access in Cass County
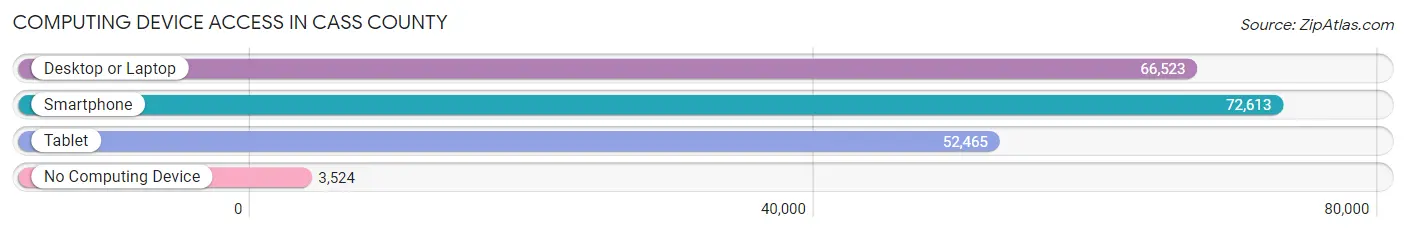
| Device Type | # Households | % Households |
| Desktop or Laptop | 66,523 | 83.7% |
| Smartphone | 72,613 | 91.3% |
| Tablet | 52,465 | 66.0% |
| No Computing Device | 3,524 | 4.4% |
| Total | 79,505 | 100.0% |
Internet Access in Cass County
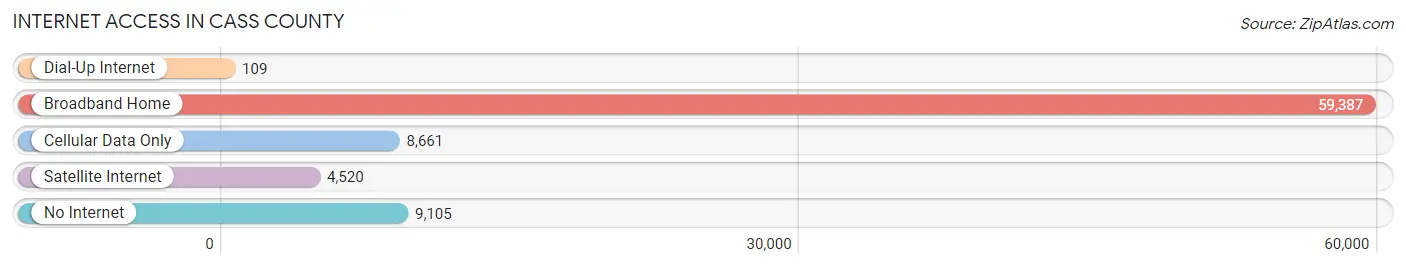
| Internet Type | # Households | % Households |
| Dial-Up Internet | 109 | 0.1% |
| Broadband Home | 59,387 | 74.7% |
| Cellular Data Only | 8,661 | 10.9% |
| Satellite Internet | 4,520 | 5.7% |
| No Internet | 9,105 | 11.5% |
| Total | 79,505 | 100.0% |
Cass County Summary
Cass County, North Dakota is located in the eastern part of the state and is the most populous county in the state. It is bordered by Traill County to the north, Richland County to the east, Ransom County to the south, and Barnes County to the west. The county seat is Fargo, the largest city in the state.
Geography
Cass County covers an area of 1,845 square miles and is the largest county in North Dakota. It is located in the Red River Valley, which is a flat, fertile plain that is part of the Great Plains region. The Red River of the North forms the county's eastern border. The Sheyenne River flows through the county, and there are several small lakes and ponds scattered throughout the county. The terrain is mostly flat, with some rolling hills in the western part of the county. The county is mostly agricultural, with some small towns and cities scattered throughout.
Demographics
As of the 2010 census, Cass County had a population of 149,778, making it the most populous county in North Dakota. The population density was 81.2 people per square mile. The racial makeup of the county was 90.2% White, 4.2% African American, 0.7% Native American, 2.2% Asian, 0.1% Pacific Islander, 1.2% from other races, and 1.5% from two or more races. Hispanic or Latino of any race were 3.3% of the population.
The median income for a household in the county was $50,945, and the median income for a family was $63,945. The per capita income for the county was $25,945. About 6.2% of families and 9.2% of the population were below the poverty line, including 11.2% of those under age 18 and 6.2% of those age 65 or over.
Economy
Cass County is a major agricultural center, with farming and ranching being the primary economic activities. The county is home to several large farms and ranches, as well as numerous smaller operations. The county is also home to several large food processing plants, including the General Mills plant in Fargo.
The county is also home to several large manufacturing companies, including John Deere, Bobcat, and 3M. The county is also home to several large retail stores, including Walmart, Target, and Best Buy.
The county is also home to several large educational institutions, including North Dakota State University, Minnesota State University Moorhead, and Concordia College. The county is also home to several large healthcare facilities, including Sanford Health and Essentia Health.
Conclusion
Cass County, North Dakota is the most populous county in the state and is home to several large cities and towns. The county is mostly agricultural, with some manufacturing and retail businesses scattered throughout. The county is also home to several large educational and healthcare institutions. The county has a diverse population and a strong economy, making it a great place to live and work.
Common Questions
What is the Total Population of Cass County?
Total Population of Cass County is 186,328.
What is the Total Male Population of Cass County?
Total Male Population of Cass County is 94,537.
What is the Total Female Population of Cass County?
Total Female Population of Cass County is 91,791.
What is the Ratio of Males per 100 Females in Cass County?
There are 102.99 Males per 100 Females in Cass County.
What is the Ratio of Females per 100 Males in Cass County?
There are 97.10 Females per 100 Males in Cass County.
What is the Median Population Age in Cass County?
Median Population Age in Cass County is 32.7 Years.
What is the Average Family Size in Cass County
Average Family Size in Cass County is 3.0 People.
What is the Average Household Size in Cass County
Average Household Size in Cass County is 2.3 People.
What is Per Capita Income in Cass County?
Per Capita income in Cass County is $43,474.
What is the Median Family Income in Cass County?
Median Family Income in Cass County is $104,847.
What is the Median Household income in Cass County?
Median Household Income in Cass County is $73,249.
What is Income or Wage Gap in Cass County?
Income or Wage Gap in Cass County is 22.4%.
Women in Cass County earn 77.6 cents for every dollar earned by a man.
What is Family Income Deficit in Cass County?
Family Income Deficit in Cass County is $9,600.
Families that are below poverty line in Cass County earn $9,600 less on average than the poverty threshold level.
What is Inequality or Gini Index in Cass County?
Inequality or Gini Index in Cass County is 0.47.
How Large is the Labor Force in Cass County?
There are 113,159 People in the Labor Forcein in Cass County.
What is the Percentage of People in the Labor Force in Cass County?
76.0% of People are in the Labor Force in Cass County.
What is the Unemployment Rate in Cass County?
Unemployment Rate in Cass County is 2.8%.