Burleigh County, ND
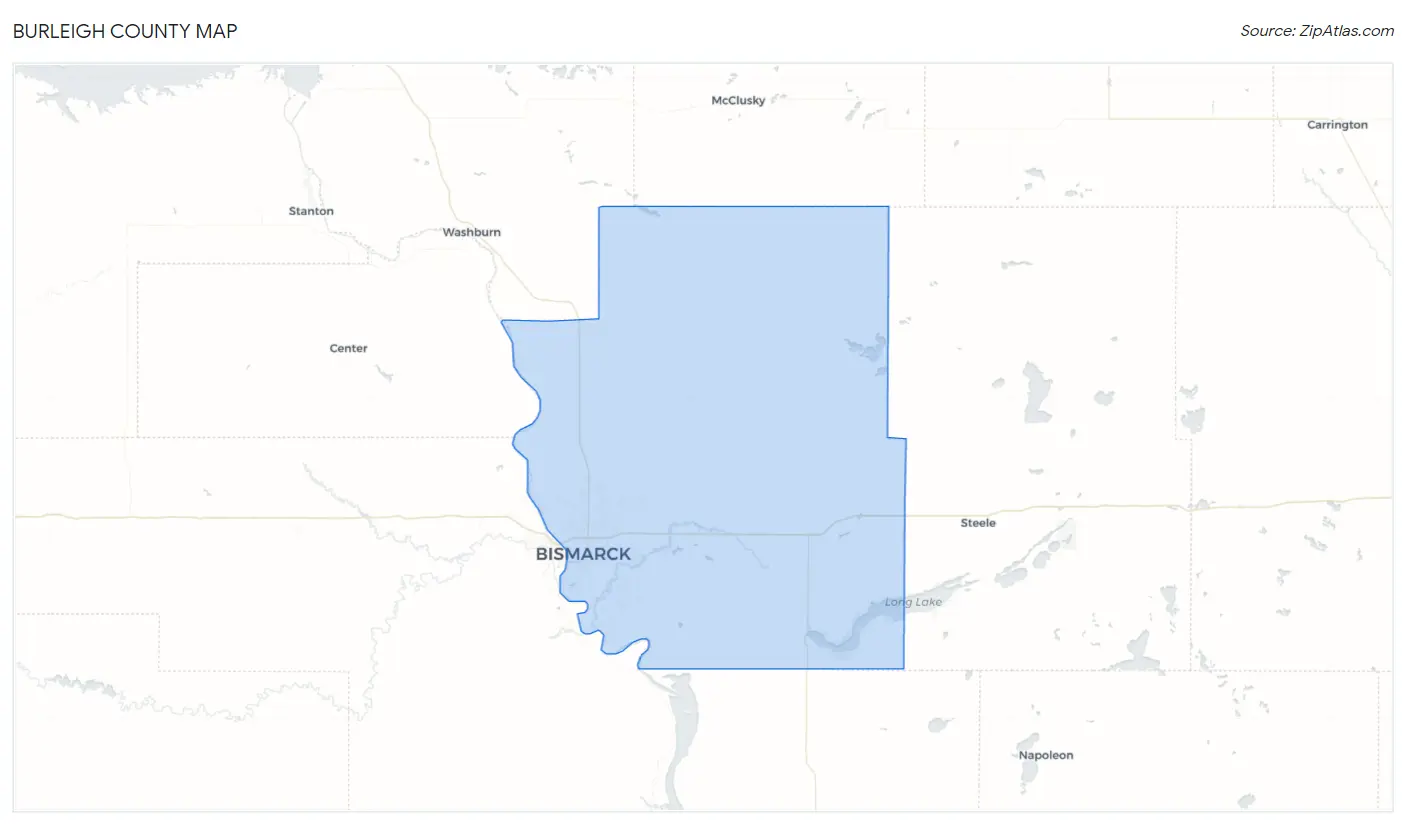
Burleigh County Map
Burleigh County Overview
98,443
TOTAL POPULATION
49,666
MALE POPULATION
48,777
FEMALE POPULATION
101.82
MALES / 100 FEMALES
98.21
FEMALES / 100 MALES
37.7
MEDIAN AGE
3.0
AVG FAMILY SIZE
2.4
AVG HOUSEHOLD SIZE
$43,615
PER CAPITA INCOME
$108,272
AVG FAMILY INCOME
$82,141
AVG HOUSEHOLD INCOME
22.0%
WAGE / INCOME GAP [ % ]
78.0¢/ $1
WAGE / INCOME GAP [ $ ]
$10,588
FAMILY INCOME DEFICIT
0.43
INEQUALITY / GINI INDEX
52,526
LABOR FORCE [ PEOPLE ]
67.1%
PERCENT IN LABOR FORCE
2.7%
UNEMPLOYMENT RATE
Burleigh County Area Codes
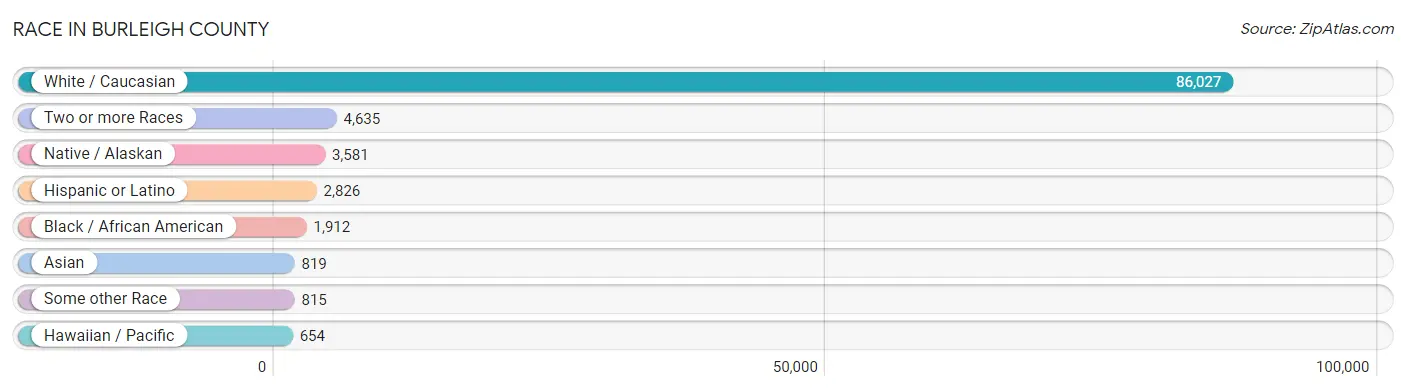
Race in Burleigh County
The most populous races in Burleigh County are White / Caucasian (86,027 | 87.4%), Two or more Races (4,635 | 4.7%), and Native / Alaskan (3,581 | 3.6%).
| Race | # Population | % Population |
| Asian | 819 | 0.8% |
| Black / African American | 1,912 | 1.9% |
| Hawaiian / Pacific | 654 | 0.7% |
| Hispanic or Latino | 2,826 | 2.9% |
| Native / Alaskan | 3,581 | 3.6% |
| White / Caucasian | 86,027 | 87.4% |
| Two or more Races | 4,635 | 4.7% |
| Some other Race | 815 | 0.8% |
| Total | 98,443 | 100.0% |
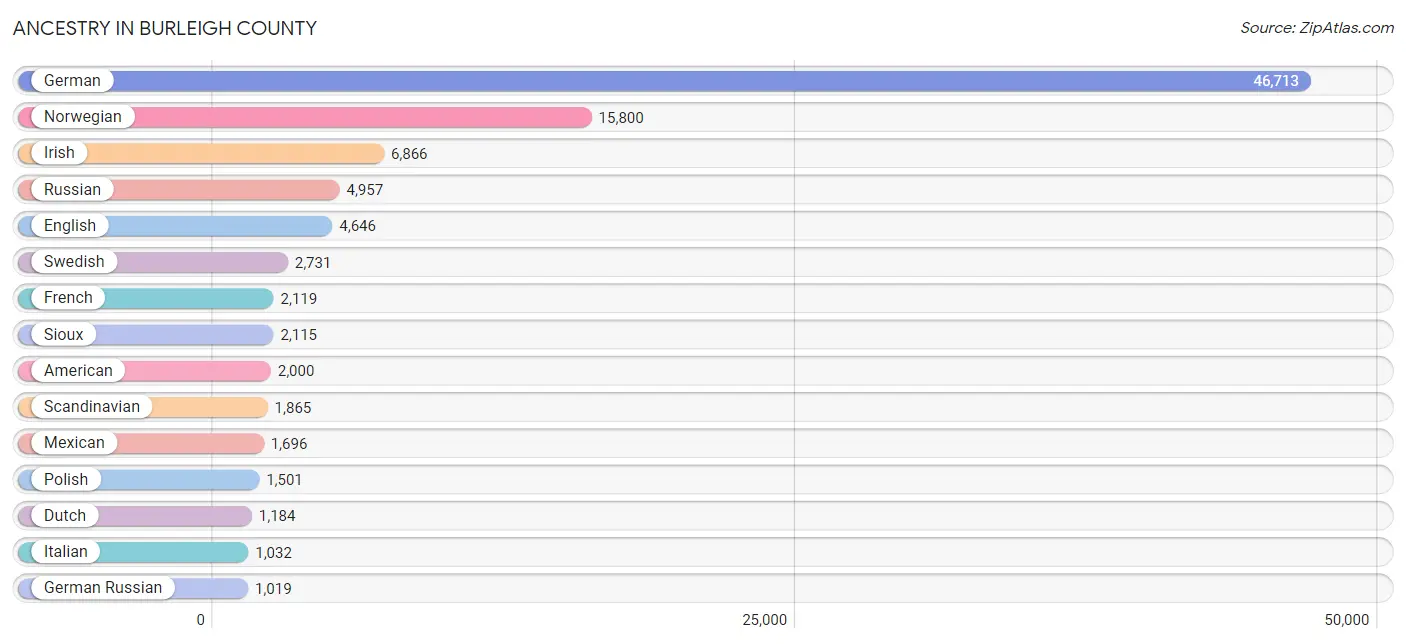
Ancestry in Burleigh County
The most populous ancestries reported in Burleigh County are German (46,713 | 47.4%), Norwegian (15,800 | 16.1%), Irish (6,866 | 7.0%), Russian (4,957 | 5.0%), and English (4,646 | 4.7%), together accounting for 80.2% of all Burleigh County residents.
| Ancestry | # Population | % Population |
| Afghan | 23 | 0.0% |
| African | 450 | 0.5% |
| Alaska Native | 2 | 0.0% |
| Albanian | 33 | 0.0% |
| Aleut | 2 | 0.0% |
| American | 2,000 | 2.0% |
| Arab | 288 | 0.3% |
| Armenian | 20 | 0.0% |
| Austrian | 131 | 0.1% |
| Barbadian | 9 | 0.0% |
| Basque | 1 | 0.0% |
| Belgian | 47 | 0.1% |
| Bhutanese | 134 | 0.1% |
| Blackfeet | 103 | 0.1% |
| British | 560 | 0.6% |
| Burmese | 62 | 0.1% |
| Canadian | 101 | 0.1% |
| Central American | 355 | 0.4% |
| Central American Indian | 4 | 0.0% |
| Cherokee | 168 | 0.2% |
| Cheyenne | 3 | 0.0% |
| Chinese | 1 | 0.0% |
| Chippewa | 659 | 0.7% |
| Choctaw | 2 | 0.0% |
| Colombian | 35 | 0.0% |
| Colville | 6 | 0.0% |
| Creek | 8 | 0.0% |
| Croatian | 138 | 0.1% |
| Crow | 69 | 0.1% |
| Cuban | 31 | 0.0% |
| Czech | 739 | 0.7% |
| Czechoslovakian | 109 | 0.1% |
| Danish | 651 | 0.7% |
| Dominican | 26 | 0.0% |
| Dutch | 1,184 | 1.2% |
| Eastern European | 72 | 0.1% |
| Ecuadorian | 20 | 0.0% |
| English | 4,646 | 4.7% |
| Ethiopian | 15 | 0.0% |
| European | 914 | 0.9% |
| Fijian | 90 | 0.1% |
| Filipino | 11 | 0.0% |
| Finnish | 356 | 0.4% |
| French | 2,119 | 2.1% |
| French American Indian | 54 | 0.1% |
| French Canadian | 766 | 0.8% |
| German | 46,713 | 47.4% |
| German Russian | 1,019 | 1.0% |
| Ghanaian | 14 | 0.0% |
| Greek | 27 | 0.0% |
| Guamanian / Chamorro | 26 | 0.0% |
| Guatemalan | 39 | 0.0% |
| Haitian | 400 | 0.4% |
| Hopi | 6 | 0.0% |
| Hungarian | 418 | 0.4% |
| Icelander | 173 | 0.2% |
| Indian (Asian) | 132 | 0.1% |
| Inupiat | 2 | 0.0% |
| Irish | 6,866 | 7.0% |
| Iroquois | 22 | 0.0% |
| Israeli | 2 | 0.0% |
| Italian | 1,032 | 1.1% |
| Jamaican | 18 | 0.0% |
| Jordanian | 15 | 0.0% |
| Kenyan | 115 | 0.1% |
| Korean | 587 | 0.6% |
| Latvian | 14 | 0.0% |
| Lebanese | 181 | 0.2% |
| Liberian | 33 | 0.0% |
| Lithuanian | 28 | 0.0% |
| Luxembourger | 3 | 0.0% |
| Mexican | 1,696 | 1.7% |
| Native Hawaiian | 11 | 0.0% |
| Navajo | 112 | 0.1% |
| Nicaraguan | 11 | 0.0% |
| Nigerian | 37 | 0.0% |
| Northern European | 100 | 0.1% |
| Norwegian | 15,800 | 16.1% |
| Pakistani | 155 | 0.2% |
| Panamanian | 159 | 0.2% |
| Pennsylvania German | 74 | 0.1% |
| Peruvian | 26 | 0.0% |
| Polish | 1,501 | 1.5% |
| Portuguese | 17 | 0.0% |
| Potawatomi | 16 | 0.0% |
| Puerto Rican | 377 | 0.4% |
| Romanian | 306 | 0.3% |
| Russian | 4,957 | 5.0% |
| Salvadoran | 146 | 0.2% |
| Samoan | 43 | 0.0% |
| Scandinavian | 1,865 | 1.9% |
| Scotch-Irish | 514 | 0.5% |
| Scottish | 846 | 0.9% |
| Serbian | 54 | 0.1% |
| Sioux | 2,115 | 2.1% |
| Slovak | 44 | 0.0% |
| Slovene | 18 | 0.0% |
| Somali | 126 | 0.1% |
| South African | 16 | 0.0% |
| South American | 81 | 0.1% |
| Spaniard | 36 | 0.0% |
| Spanish | 97 | 0.1% |
| Sri Lankan | 125 | 0.1% |
| Subsaharan African | 854 | 0.9% |
| Sudanese | 7 | 0.0% |
| Swedish | 2,731 | 2.8% |
| Swiss | 145 | 0.2% |
| Syrian | 92 | 0.1% |
| Thai | 104 | 0.1% |
| Ukrainian | 514 | 0.5% |
| Welsh | 242 | 0.3% |
| Yaqui | 3 | 0.0% |
| Yugoslavian | 37 | 0.0% | View All 113 Rows |
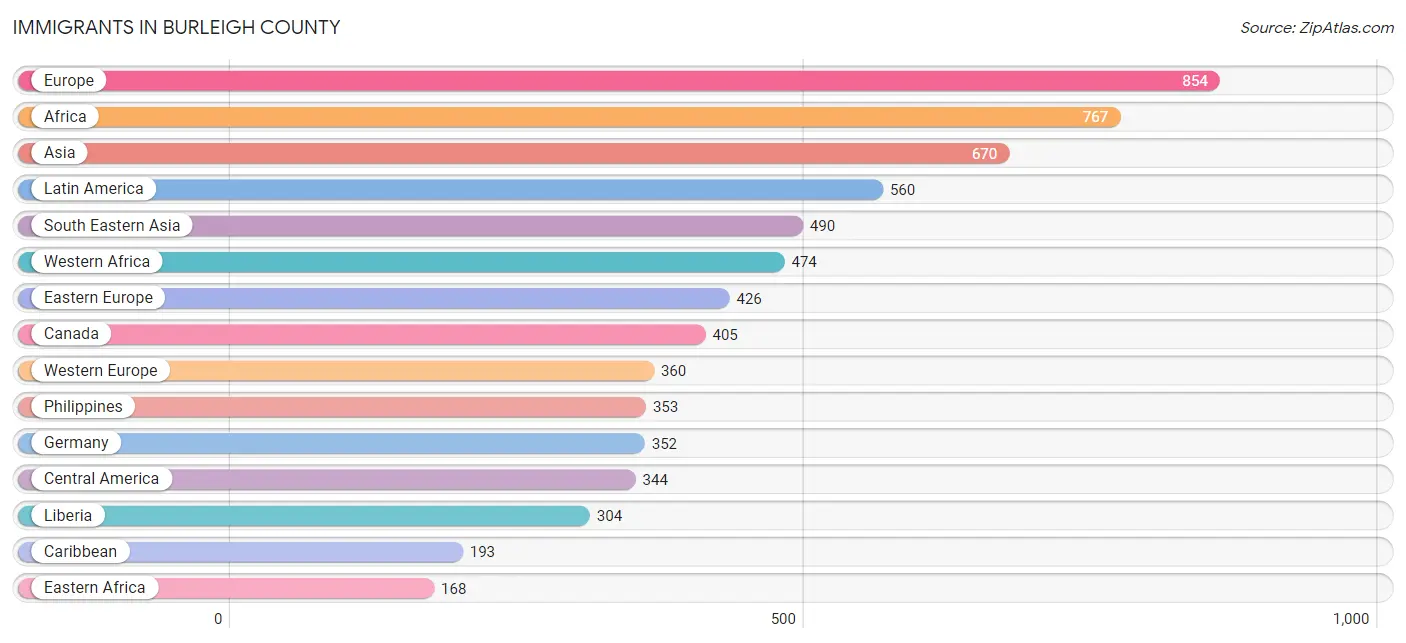
Immigrants in Burleigh County
The most numerous immigrant groups reported in Burleigh County came from Europe (854 | 0.9%), Africa (767 | 0.8%), Asia (670 | 0.7%), Latin America (560 | 0.6%), and South Eastern Asia (490 | 0.5%), together accounting for 3.4% of all Burleigh County residents.
| Immigration Origin | # Population | % Population |
| Afghanistan | 22 | 0.0% |
| Africa | 767 | 0.8% |
| Asia | 670 | 0.7% |
| Bangladesh | 3 | 0.0% |
| Barbados | 9 | 0.0% |
| Brazil | 1 | 0.0% |
| Cameroon | 30 | 0.0% |
| Canada | 405 | 0.4% |
| Caribbean | 193 | 0.2% |
| Central America | 344 | 0.4% |
| China | 69 | 0.1% |
| Colombia | 15 | 0.0% |
| Croatia | 121 | 0.1% |
| Cuba | 4 | 0.0% |
| Czechoslovakia | 10 | 0.0% |
| Dominican Republic | 13 | 0.0% |
| Eastern Africa | 168 | 0.2% |
| Eastern Asia | 105 | 0.1% |
| Eastern Europe | 426 | 0.4% |
| El Salvador | 48 | 0.1% |
| Ethiopia | 13 | 0.0% |
| Europe | 854 | 0.9% |
| Germany | 352 | 0.4% |
| Ghana | 10 | 0.0% |
| Guatemala | 45 | 0.1% |
| Haiti | 167 | 0.2% |
| Honduras | 21 | 0.0% |
| India | 31 | 0.0% |
| Japan | 9 | 0.0% |
| Kenya | 86 | 0.1% |
| Korea | 27 | 0.0% |
| Latin America | 560 | 0.6% |
| Liberia | 304 | 0.3% |
| Malaysia | 5 | 0.0% |
| Mexico | 99 | 0.1% |
| Middle Africa | 30 | 0.0% |
| Moldova | 45 | 0.1% |
| Nepal | 15 | 0.0% |
| Netherlands | 8 | 0.0% |
| Nicaragua | 2 | 0.0% |
| Nigeria | 23 | 0.0% |
| Northern Africa | 7 | 0.0% |
| Northern Europe | 44 | 0.0% |
| Oceania | 70 | 0.1% |
| Pakistan | 4 | 0.0% |
| Panama | 129 | 0.1% |
| Peru | 7 | 0.0% |
| Philippines | 353 | 0.4% |
| Romania | 81 | 0.1% |
| Russia | 60 | 0.1% |
| Serbia | 51 | 0.1% |
| Somalia | 69 | 0.1% |
| South Africa | 88 | 0.1% |
| South America | 23 | 0.0% |
| South Central Asia | 75 | 0.1% |
| South Eastern Asia | 490 | 0.5% |
| Sudan | 7 | 0.0% |
| Taiwan | 6 | 0.0% |
| Thailand | 116 | 0.1% |
| Ukraine | 48 | 0.1% |
| Vietnam | 16 | 0.0% |
| Western Africa | 474 | 0.5% |
| Western Europe | 360 | 0.4% | View All 63 Rows |
Sex and Age in Burleigh County
Sex and Age in Burleigh County
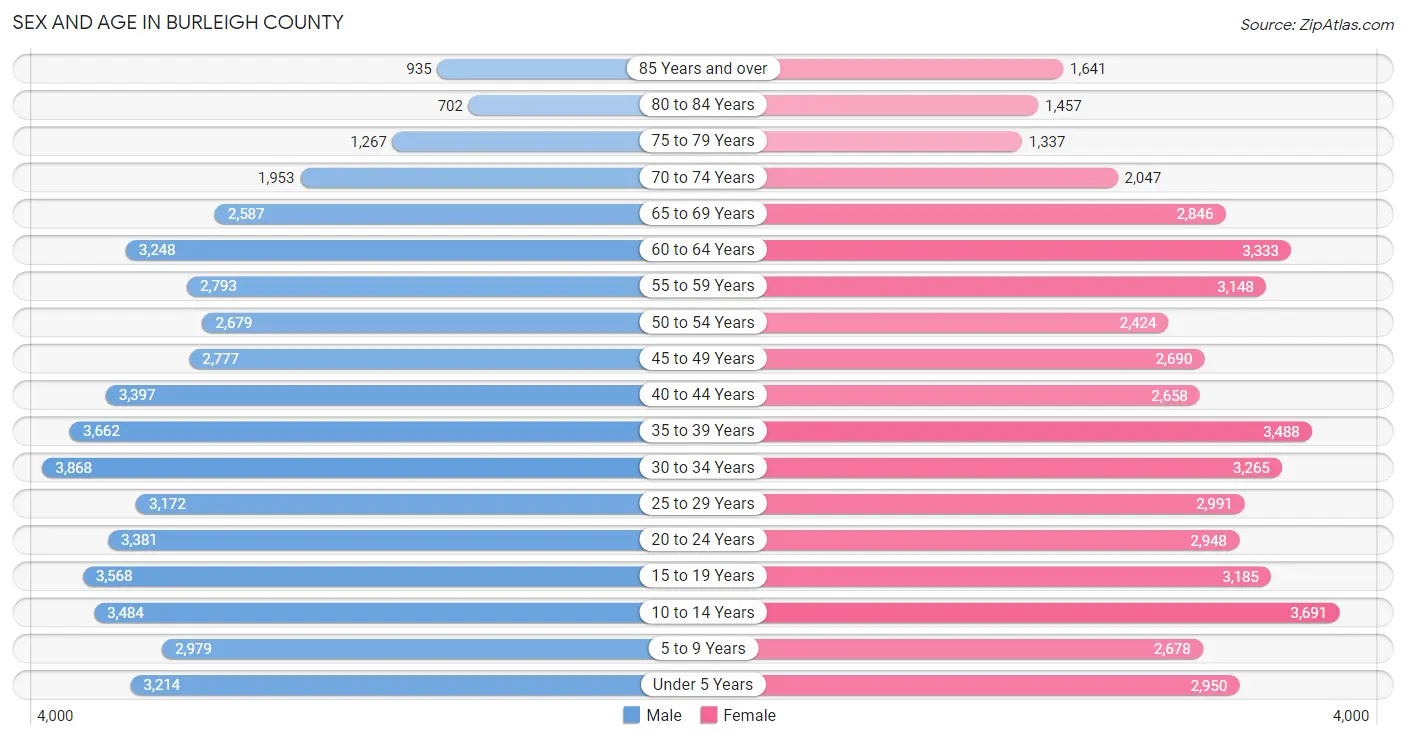
The most populous age groups in Burleigh County are 30 to 34 Years (3,868 | 7.8%) for men and 10 to 14 Years (3,691 | 7.6%) for women.
| Age Bracket | Male | Female |
| Under 5 Years | 3,214 (6.5%) | 2,950 (6.0%) |
| 5 to 9 Years | 2,979 (6.0%) | 2,678 (5.5%) |
| 10 to 14 Years | 3,484 (7.0%) | 3,691 (7.6%) |
| 15 to 19 Years | 3,568 (7.2%) | 3,185 (6.5%) |
| 20 to 24 Years | 3,381 (6.8%) | 2,948 (6.0%) |
| 25 to 29 Years | 3,172 (6.4%) | 2,991 (6.1%) |
| 30 to 34 Years | 3,868 (7.8%) | 3,265 (6.7%) |
| 35 to 39 Years | 3,662 (7.4%) | 3,488 (7.1%) |
| 40 to 44 Years | 3,397 (6.8%) | 2,658 (5.4%) |
| 45 to 49 Years | 2,777 (5.6%) | 2,690 (5.5%) |
| 50 to 54 Years | 2,679 (5.4%) | 2,424 (5.0%) |
| 55 to 59 Years | 2,793 (5.6%) | 3,148 (6.5%) |
| 60 to 64 Years | 3,248 (6.5%) | 3,333 (6.8%) |
| 65 to 69 Years | 2,587 (5.2%) | 2,846 (5.8%) |
| 70 to 74 Years | 1,953 (3.9%) | 2,047 (4.2%) |
| 75 to 79 Years | 1,267 (2.5%) | 1,337 (2.7%) |
| 80 to 84 Years | 702 (1.4%) | 1,457 (3.0%) |
| 85 Years and over | 935 (1.9%) | 1,641 (3.4%) |
| Total | 49,666 (100.0%) | 48,777 (100.0%) |
Families and Households in Burleigh County
Median Family Size in Burleigh County
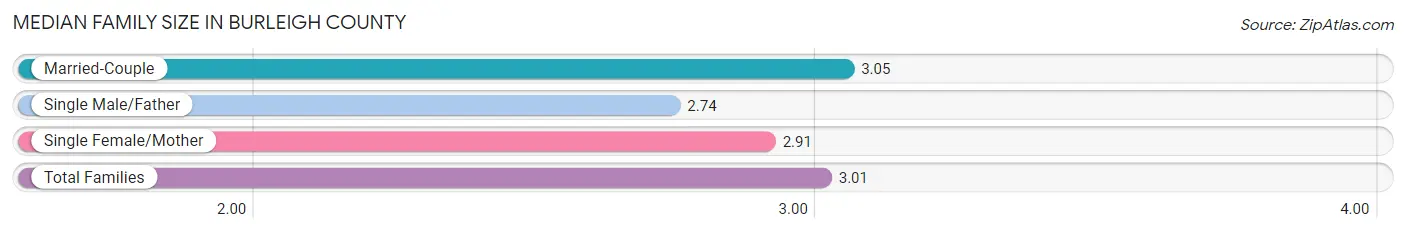
The median family size in Burleigh County is 3.01 persons per family, with married-couple families (20,244 | 81.9%) accounting for the largest median family size of 3.05 persons per family. On the other hand, single male/father families (1,572 | 6.4%) represent the smallest median family size with 2.74 persons per family.
| Family Type | # Families | Family Size |
| Married-Couple | 20,244 (81.9%) | 3.05 |
| Single Male/Father | 1,572 (6.4%) | 2.74 |
| Single Female/Mother | 2,898 (11.7%) | 2.91 |
| Total Families | 24,714 (100.0%) | 3.01 |
Median Household Size in Burleigh County
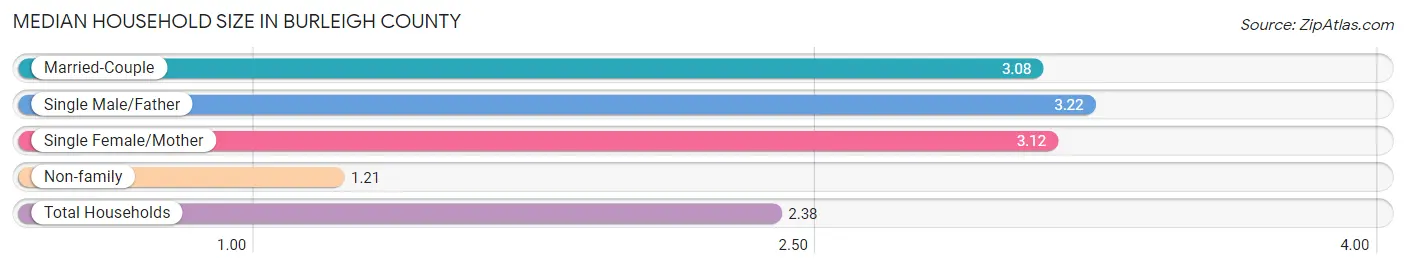
The median household size in Burleigh County is 2.38 persons per household, with single male/father households (1,572 | 3.9%) accounting for the largest median household size of 3.22 persons per household. non-family households (15,171 | 38.0%) represent the smallest median household size with 1.21 persons per household.
| Household Type | # Households | Household Size |
| Married-Couple | 20,244 (50.8%) | 3.08 |
| Single Male/Father | 1,572 (3.9%) | 3.22 |
| Single Female/Mother | 2,898 (7.3%) | 3.12 |
| Non-family | 15,171 (38.0%) | 1.21 |
| Total Households | 39,885 (100.0%) | 2.38 |
Household Size by Marriage Status in Burleigh County
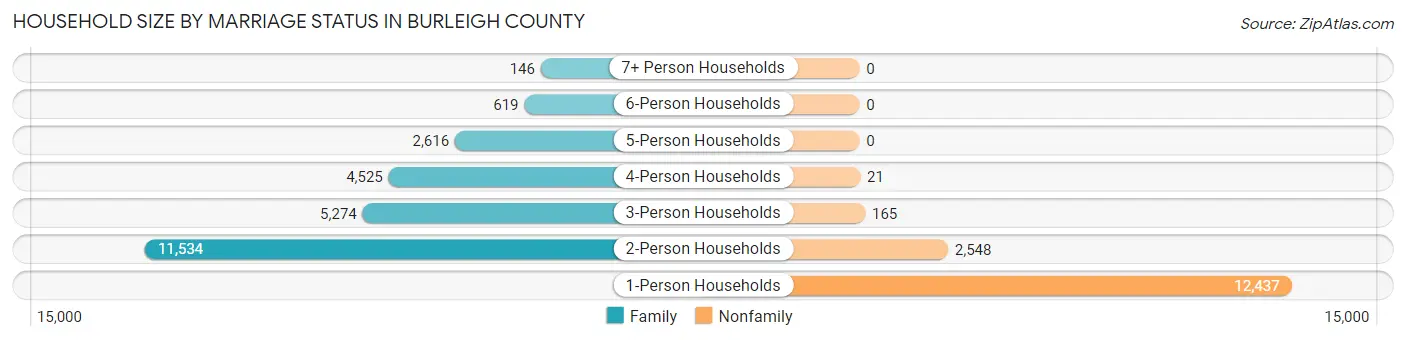
Out of a total of 39,885 households in Burleigh County, 24,714 (62.0%) are family households, while 15,171 (38.0%) are nonfamily households. The most numerous type of family households are 2-person households, comprising 11,534, and the most common type of nonfamily households are 1-person households, comprising 12,437.
| Household Size | Family Households | Nonfamily Households |
| 1-Person Households | - | 12,437 (31.2%) |
| 2-Person Households | 11,534 (28.9%) | 2,548 (6.4%) |
| 3-Person Households | 5,274 (13.2%) | 165 (0.4%) |
| 4-Person Households | 4,525 (11.4%) | 21 (0.1%) |
| 5-Person Households | 2,616 (6.6%) | 0 (0.0%) |
| 6-Person Households | 619 (1.5%) | 0 (0.0%) |
| 7+ Person Households | 146 (0.4%) | 0 (0.0%) |
| Total | 24,714 (62.0%) | 15,171 (38.0%) |
Female Fertility in Burleigh County
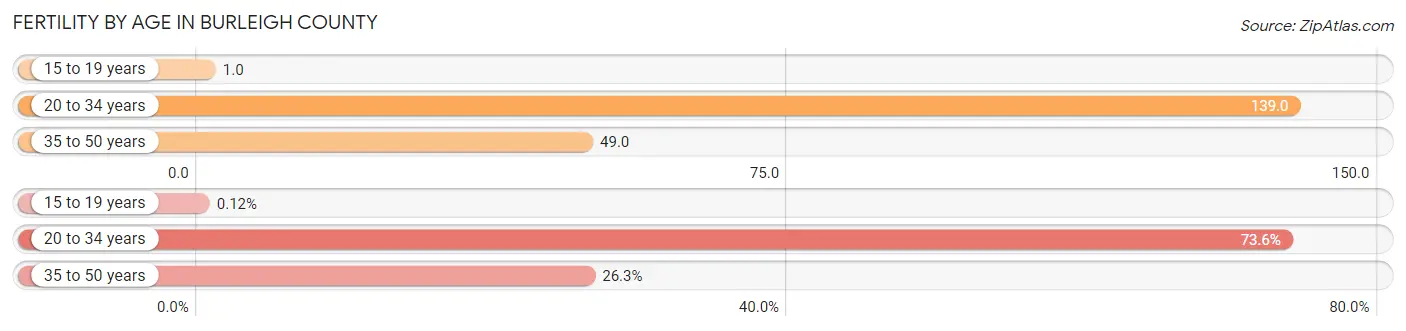
Fertility by Age in Burleigh County
Average fertility rate in Burleigh County is 80.0 births per 1,000 women. Women in the age bracket of 20 to 34 years have the highest fertility rate with 139.0 births per 1,000 women. Women in the age bracket of 20 to 34 years acount for 73.6% of all women with births.
| Age Bracket | Women with Births | Births / 1,000 Women |
| 15 to 19 years | 2 (0.1%) | 1.0 |
| 20 to 34 years | 1,280 (73.6%) | 139.0 |
| 35 to 50 years | 457 (26.3%) | 49.0 |
| Total | 1,739 (100.0%) | 80.0 |
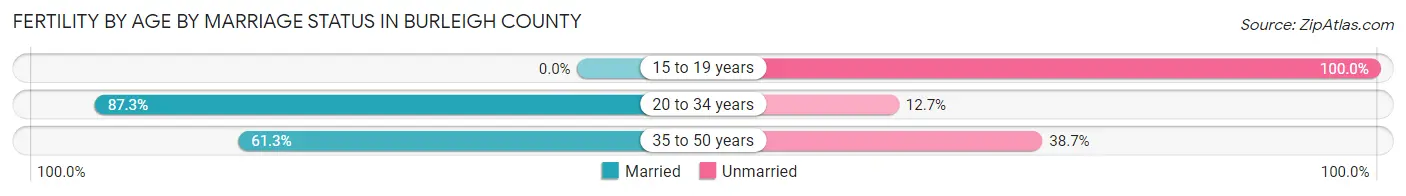
Fertility by Age by Marriage Status in Burleigh County
80.4% of women with births (1,739) in Burleigh County are married. The highest percentage of unmarried women with births falls into 15 to 19 years age bracket with 100.0% of them unmarried at the time of birth, while the lowest percentage of unmarried women with births belong to 20 to 34 years age bracket with 12.7% of them unmarried.
| Age Bracket | Married | Unmarried |
| 15 to 19 years | 0 (0.0%) | 2 (100.0%) |
| 20 to 34 years | 1,117 (87.3%) | 163 (12.7%) |
| 35 to 50 years | 280 (61.3%) | 177 (38.7%) |
| Total | 1,398 (80.4%) | 341 (19.6%) |
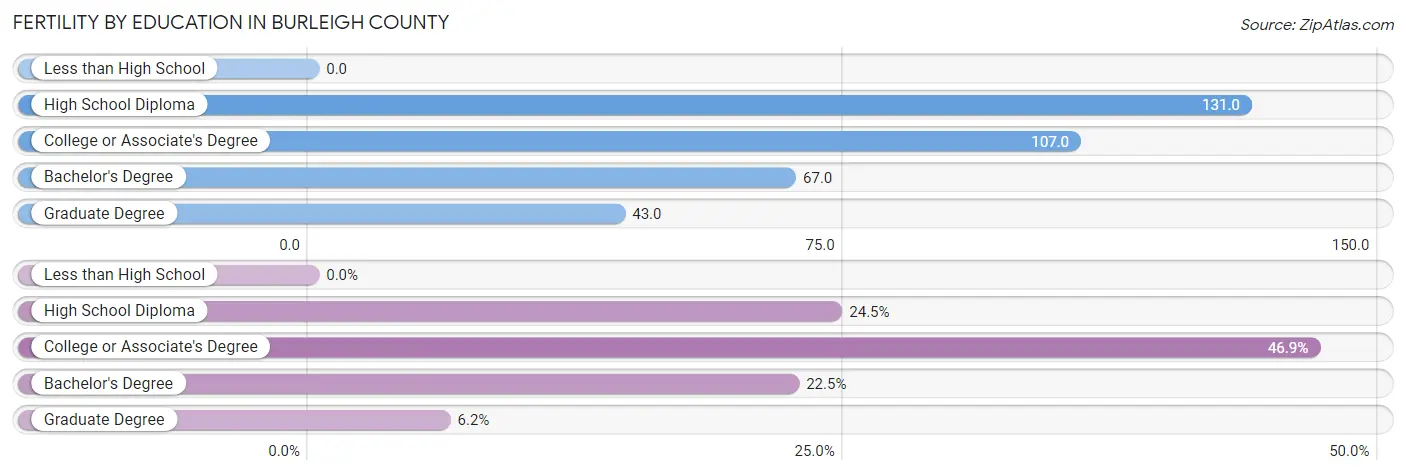
Fertility by Education in Burleigh County
| Educational Attainment | Women with Births | Births / 1,000 Women |
| Less than High School | 0 (0.0%) | 0.0 |
| High School Diploma | 426 (24.5%) | 131.0 |
| College or Associate's Degree | 815 (46.9%) | 107.0 |
| Bachelor's Degree | 391 (22.5%) | 67.0 |
| Graduate Degree | 107 (6.1%) | 43.0 |
| Total | 1,739 (100.0%) | 80.0 |
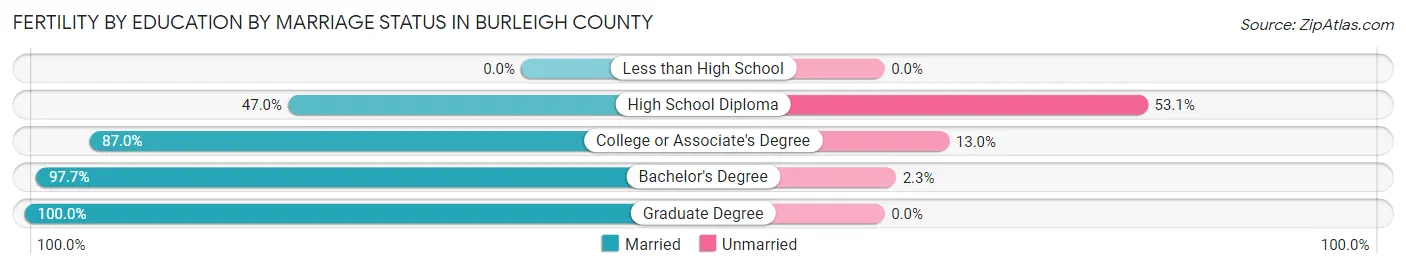
Fertility by Education by Marriage Status in Burleigh County
19.6% of women with births in Burleigh County are unmarried. Women with the educational attainment of graduate degree are most likely to be married with 100.0% of them married at childbirth, while women with the educational attainment of high school diploma are least likely to be married with 53.0% of them unmarried at childbirth.
| Educational Attainment | Married | Unmarried |
| Less than High School | 0 (0.0%) | 0 (0.0%) |
| High School Diploma | 200 (46.9%) | 226 (53.0%) |
| College or Associate's Degree | 709 (87.0%) | 106 (13.0%) |
| Bachelor's Degree | 382 (97.7%) | 9 (2.3%) |
| Graduate Degree | 107 (100.0%) | 0 (0.0%) |
| Total | 1,398 (80.4%) | 341 (19.6%) |
Income in Burleigh County
Income Overview in Burleigh County
Per Capita Income in Burleigh County is $43,615, while median incomes of families and households are $108,272 and $82,141 respectively.
| Characteristic | Number | Measure |
| Per Capita Income | 98,443 | $43,615 |
| Median Family Income | 24,714 | $108,272 |
| Mean Family Income | 24,714 | $129,182 |
| Median Household Income | 39,885 | $82,141 |
| Mean Household Income | 39,885 | $105,791 |
| Income Deficit | 24,714 | $10,588 |
| Wage / Income Gap (%) | 98,443 | 22.04% |
| Wage / Income Gap ($) | 98,443 | 77.96¢ per $1 |
| Gini / Inequality Index | 98,443 | 0.43 |
Earnings by Sex in Burleigh County
Average Earnings in Burleigh County are $47,586, $54,046 for men and $42,134 for women, a difference of 22.0%.
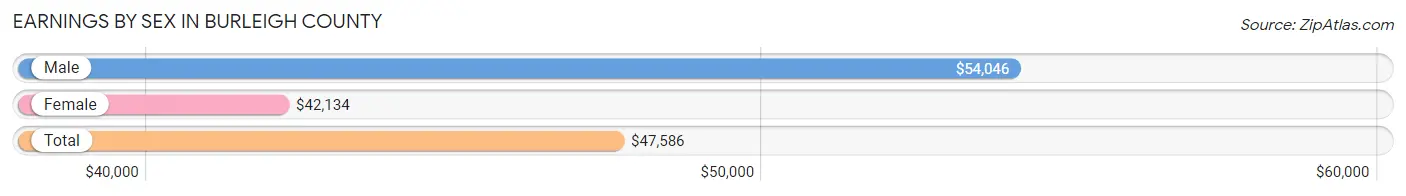
| Sex | Number | Average Earnings |
| Male | 29,839 (53.3%) | $54,046 |
| Female | 26,120 (46.7%) | $42,134 |
| Total | 55,959 (100.0%) | $47,586 |
Earnings by Sex by Income Bracket in Burleigh County
The most common earnings brackets in Burleigh County are $100,000+ for men (5,946 | 19.9%) and $55,000 to $64,999 for women (3,035 | 11.6%).
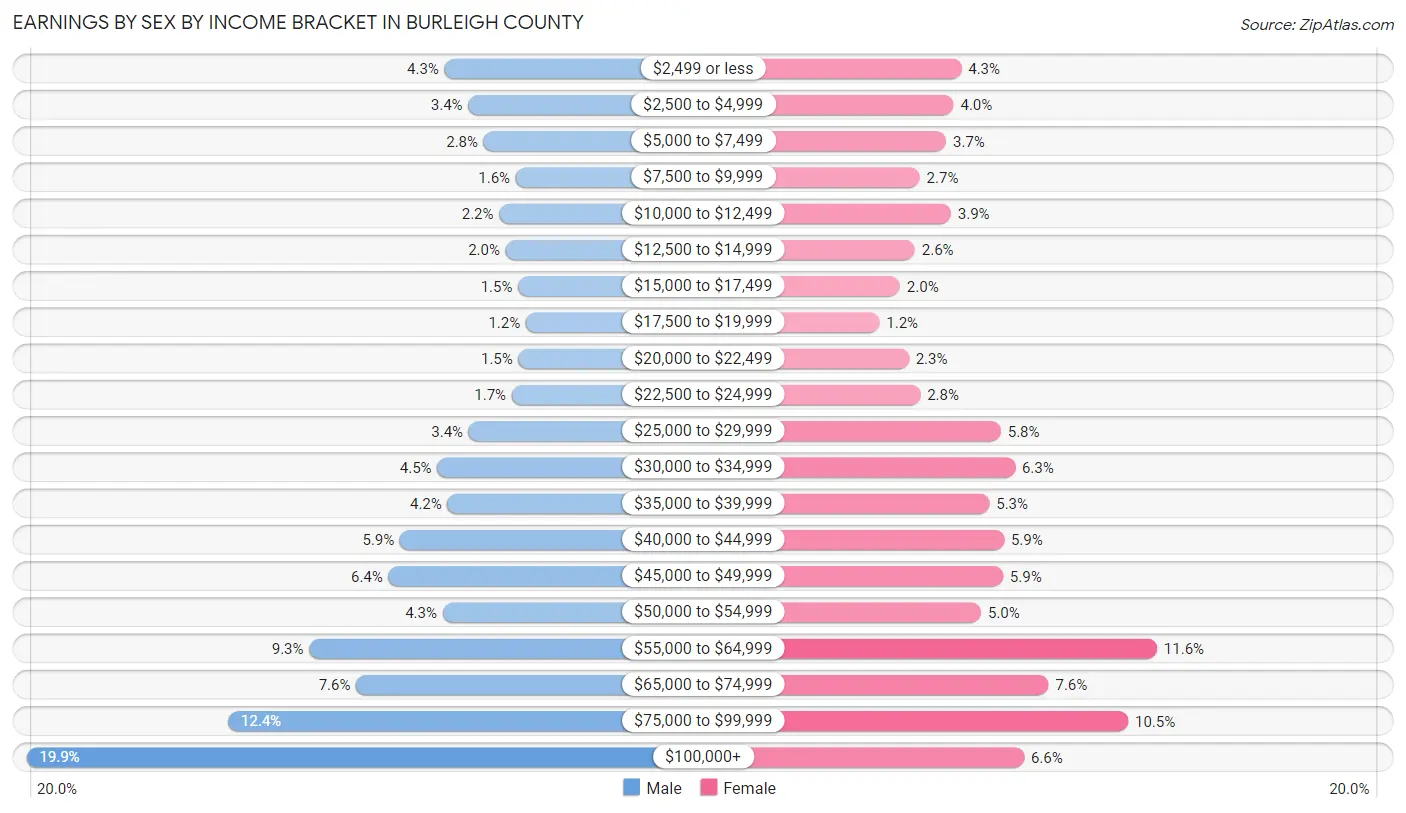
| Income | Male | Female |
| $2,499 or less | 1,272 (4.3%) | 1,120 (4.3%) |
| $2,500 to $4,999 | 1,006 (3.4%) | 1,044 (4.0%) |
| $5,000 to $7,499 | 833 (2.8%) | 972 (3.7%) |
| $7,500 to $9,999 | 473 (1.6%) | 712 (2.7%) |
| $10,000 to $12,499 | 658 (2.2%) | 1,018 (3.9%) |
| $12,500 to $14,999 | 588 (2.0%) | 666 (2.5%) |
| $15,000 to $17,499 | 447 (1.5%) | 521 (2.0%) |
| $17,500 to $19,999 | 362 (1.2%) | 319 (1.2%) |
| $20,000 to $22,499 | 445 (1.5%) | 606 (2.3%) |
| $22,500 to $24,999 | 518 (1.7%) | 719 (2.8%) |
| $25,000 to $29,999 | 1,001 (3.4%) | 1,506 (5.8%) |
| $30,000 to $34,999 | 1,353 (4.5%) | 1,645 (6.3%) |
| $35,000 to $39,999 | 1,239 (4.2%) | 1,396 (5.3%) |
| $40,000 to $44,999 | 1,769 (5.9%) | 1,539 (5.9%) |
| $45,000 to $49,999 | 1,899 (6.4%) | 1,528 (5.9%) |
| $50,000 to $54,999 | 1,293 (4.3%) | 1,313 (5.0%) |
| $55,000 to $64,999 | 2,783 (9.3%) | 3,035 (11.6%) |
| $65,000 to $74,999 | 2,260 (7.6%) | 1,975 (7.6%) |
| $75,000 to $99,999 | 3,694 (12.4%) | 2,752 (10.5%) |
| $100,000+ | 5,946 (19.9%) | 1,734 (6.6%) |
| Total | 29,839 (100.0%) | 26,120 (100.0%) |
Earnings by Sex by Educational Attainment in Burleigh County
Average earnings in Burleigh County are $60,943 for men and $48,746 for women, a difference of 20.0%. Men with an educational attainment of graduate degree enjoy the highest average annual earnings of $94,458, while those with high school diploma education earn the least with $46,050. Women with an educational attainment of graduate degree earn the most with the average annual earnings of $71,766, while those with high school diploma education have the smallest earnings of $34,231.
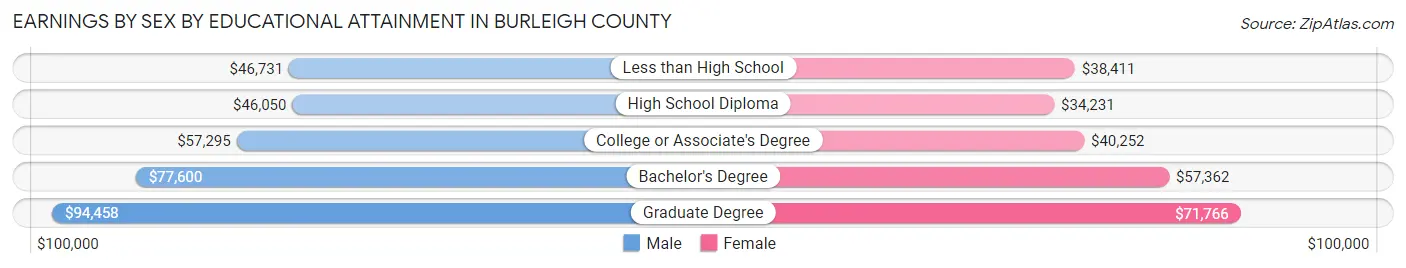
| Educational Attainment | Male Income | Female Income |
| Less than High School | $46,731 | $38,411 |
| High School Diploma | $46,050 | $34,231 |
| College or Associate's Degree | $57,295 | $40,252 |
| Bachelor's Degree | $77,600 | $57,362 |
| Graduate Degree | $94,458 | $71,766 |
| Total | $60,943 | $48,746 |
Family Income in Burleigh County
Family Income Brackets in Burleigh County
According to the Burleigh County family income data, there are 6,994 families falling into the $100,000 to $149,999 income range, which is the most common income bracket and makes up 28.3% of all families. Conversely, the less than $10,000 income bracket is the least frequent group with only 173 families (0.7%) belonging to this category.
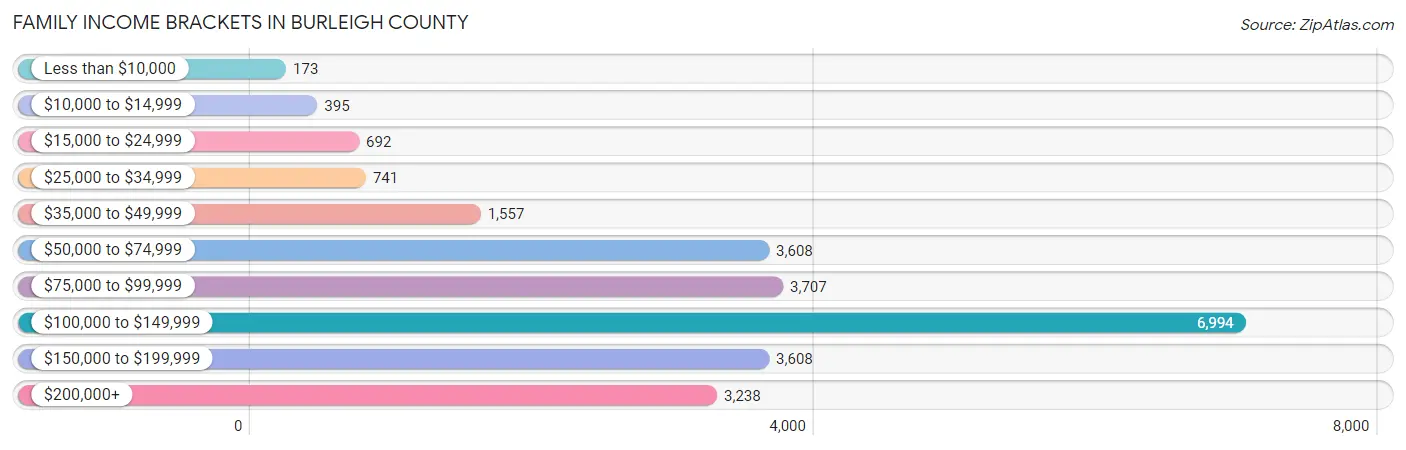
| Income Bracket | # Families | % Families |
| Less than $10,000 | 173 | 0.7% |
| $10,000 to $14,999 | 395 | 1.6% |
| $15,000 to $24,999 | 692 | 2.8% |
| $25,000 to $34,999 | 741 | 3.0% |
| $35,000 to $49,999 | 1,557 | 6.3% |
| $50,000 to $74,999 | 3,608 | 14.6% |
| $75,000 to $99,999 | 3,707 | 15.0% |
| $100,000 to $149,999 | 6,994 | 28.3% |
| $150,000 to $199,999 | 3,608 | 14.6% |
| $200,000+ | 3,238 | 13.1% |
Family Income by Famaliy Size in Burleigh County
4-person families (4,194 | 17.0%) account for the highest median family income in Burleigh County with $141,087 per family, while 2-person families (12,201 | 49.4%) have the highest median income of $47,796 per family member.
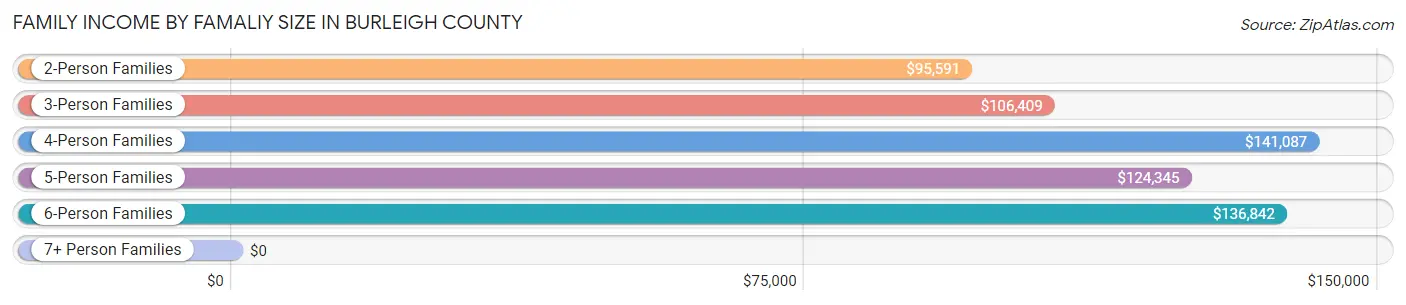
| Income Bracket | # Families | Median Income |
| 2-Person Families | 12,201 (49.4%) | $95,591 |
| 3-Person Families | 5,228 (21.1%) | $106,409 |
| 4-Person Families | 4,194 (17.0%) | $141,087 |
| 5-Person Families | 2,406 (9.7%) | $124,345 |
| 6-Person Families | 542 (2.2%) | $136,842 |
| 7+ Person Families | 143 (0.6%) | $0 |
| Total | 24,714 (100.0%) | $108,272 |
Family Income by Number of Earners in Burleigh County
The median family income in Burleigh County is $108,272, with families comprising 3+ earners (2,764) having the highest median family income of $167,647, while families with no earners (3,653) have the lowest median family income of $66,373, accounting for 11.2% and 14.8% of families, respectively.
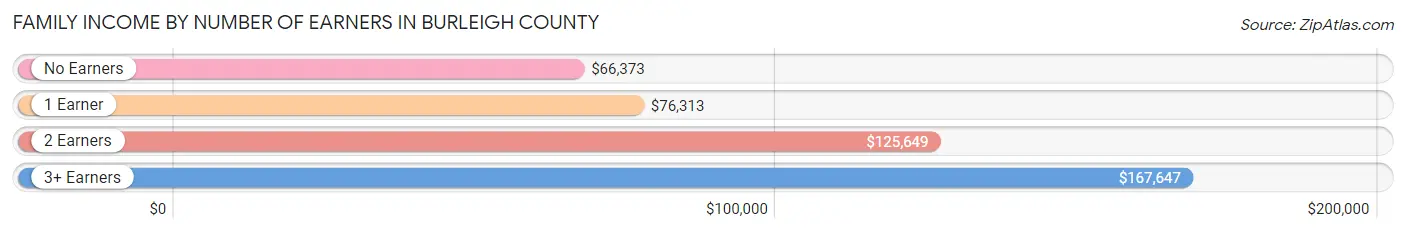
| Number of Earners | # Families | Median Income |
| No Earners | 3,653 (14.8%) | $66,373 |
| 1 Earner | 6,312 (25.5%) | $76,313 |
| 2 Earners | 11,985 (48.5%) | $125,649 |
| 3+ Earners | 2,764 (11.2%) | $167,647 |
| Total | 24,714 (100.0%) | $108,272 |
Household Income in Burleigh County
Household Income Brackets in Burleigh County
With 8,575 households falling in the category, the $100,000 to $149,999 income range is the most frequent in Burleigh County, accounting for 21.5% of all households. In contrast, only 1,276 households (3.2%) fall into the less than $10,000 income bracket, making it the least populous group.
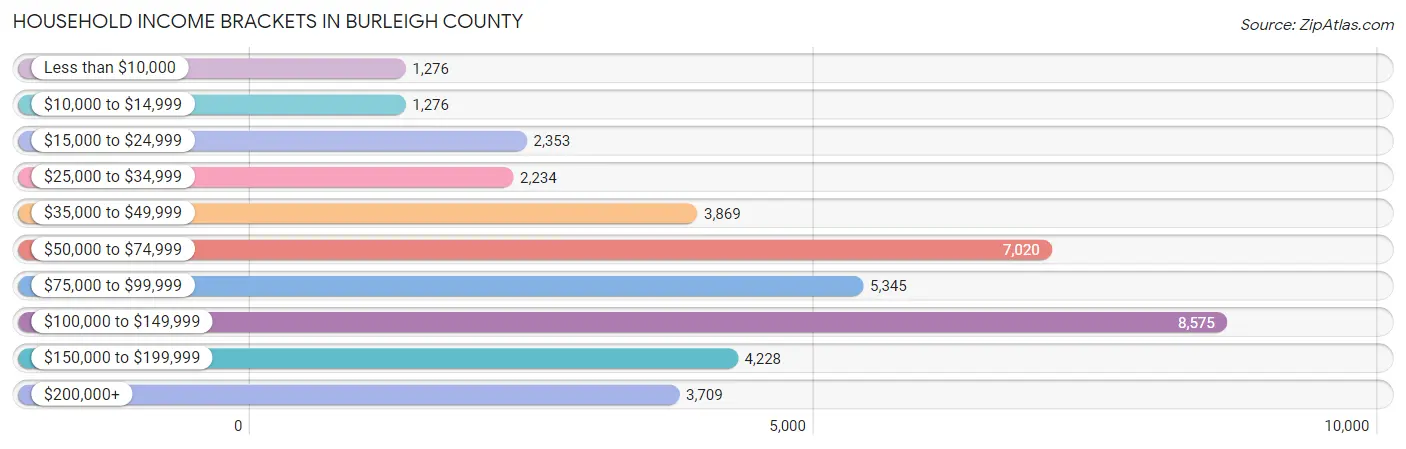
| Income Bracket | # Households | % Households |
| Less than $10,000 | 1,276 | 3.2% |
| $10,000 to $14,999 | 1,276 | 3.2% |
| $15,000 to $24,999 | 2,353 | 5.9% |
| $25,000 to $34,999 | 2,234 | 5.6% |
| $35,000 to $49,999 | 3,869 | 9.7% |
| $50,000 to $74,999 | 7,020 | 17.6% |
| $75,000 to $99,999 | 5,345 | 13.4% |
| $100,000 to $149,999 | 8,575 | 21.5% |
| $150,000 to $199,999 | 4,228 | 10.6% |
| $200,000+ | 3,709 | 9.3% |
Household Income by Householder Age in Burleigh County
The median household income in Burleigh County is $82,141, with the highest median household income of $99,643 found in the 25 to 44 years age bracket for the primary householder. A total of 13,942 households (35.0%) fall into this category. Meanwhile, the 15 to 24 years age bracket for the primary householder has the lowest median household income of $46,206, with 2,180 households (5.5%) in this group.
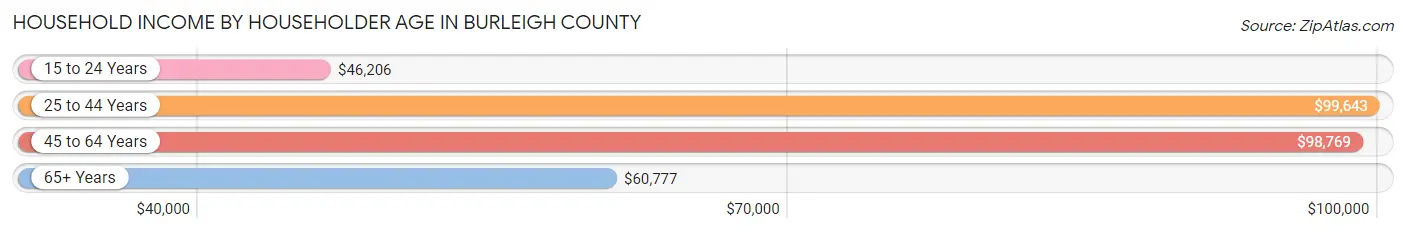
| Income Bracket | # Households | Median Income |
| 15 to 24 Years | 2,180 (5.5%) | $46,206 |
| 25 to 44 Years | 13,942 (35.0%) | $99,643 |
| 45 to 64 Years | 13,232 (33.2%) | $98,769 |
| 65+ Years | 10,531 (26.4%) | $60,777 |
| Total | 39,885 (100.0%) | $82,141 |
Poverty in Burleigh County
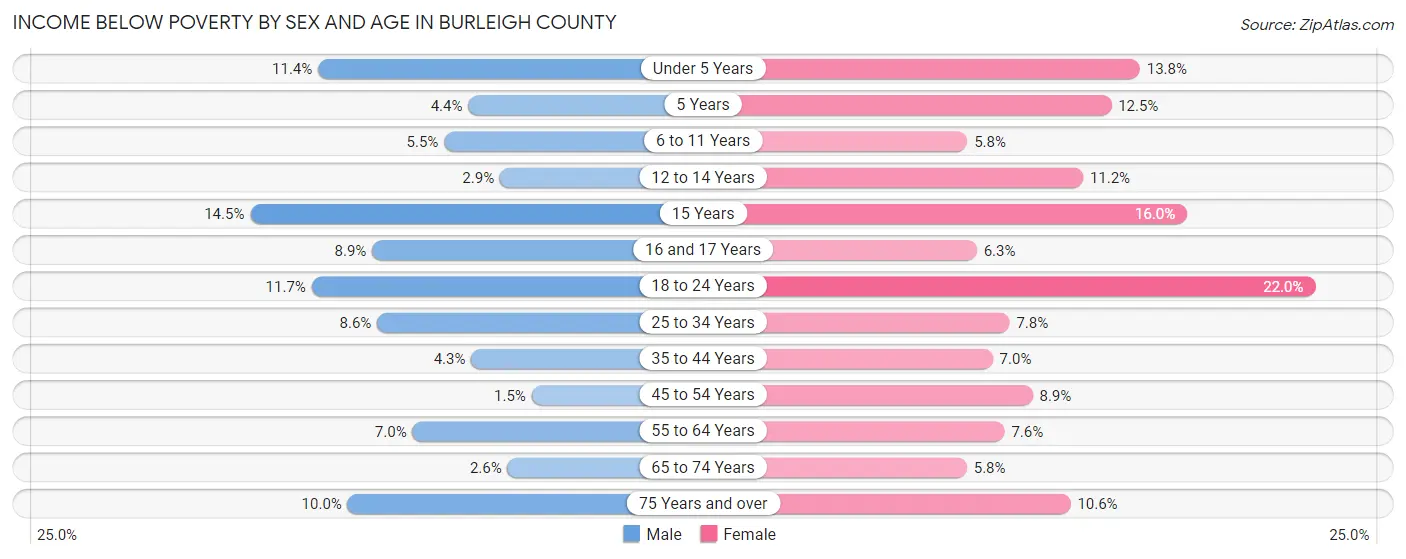
Income Below Poverty by Sex and Age in Burleigh County
With 6.5% poverty level for males and 9.4% for females among the residents of Burleigh County, 15 year old males and 18 to 24 year old females are the most vulnerable to poverty, with 67 males (14.5%) and 809 females (22.0%) in their respective age groups living below the poverty level.
| Age Bracket | Male | Female |
| Under 5 Years | 358 (11.4%) | 384 (13.8%) |
| 5 Years | 25 (4.4%) | 81 (12.5%) |
| 6 to 11 Years | 212 (5.5%) | 208 (5.8%) |
| 12 to 14 Years | 57 (2.9%) | 238 (11.2%) |
| 15 Years | 67 (14.5%) | 112 (16.0%) |
| 16 and 17 Years | 148 (8.9%) | 67 (6.3%) |
| 18 to 24 Years | 466 (11.7%) | 809 (22.0%) |
| 25 to 34 Years | 572 (8.6%) | 485 (7.8%) |
| 35 to 44 Years | 291 (4.3%) | 428 (7.0%) |
| 45 to 54 Years | 78 (1.5%) | 451 (8.8%) |
| 55 to 64 Years | 417 (7.0%) | 488 (7.5%) |
| 65 to 74 Years | 117 (2.6%) | 282 (5.8%) |
| 75 Years and over | 273 (10.0%) | 412 (10.6%) |
| Total | 3,081 (6.5%) | 4,445 (9.4%) |
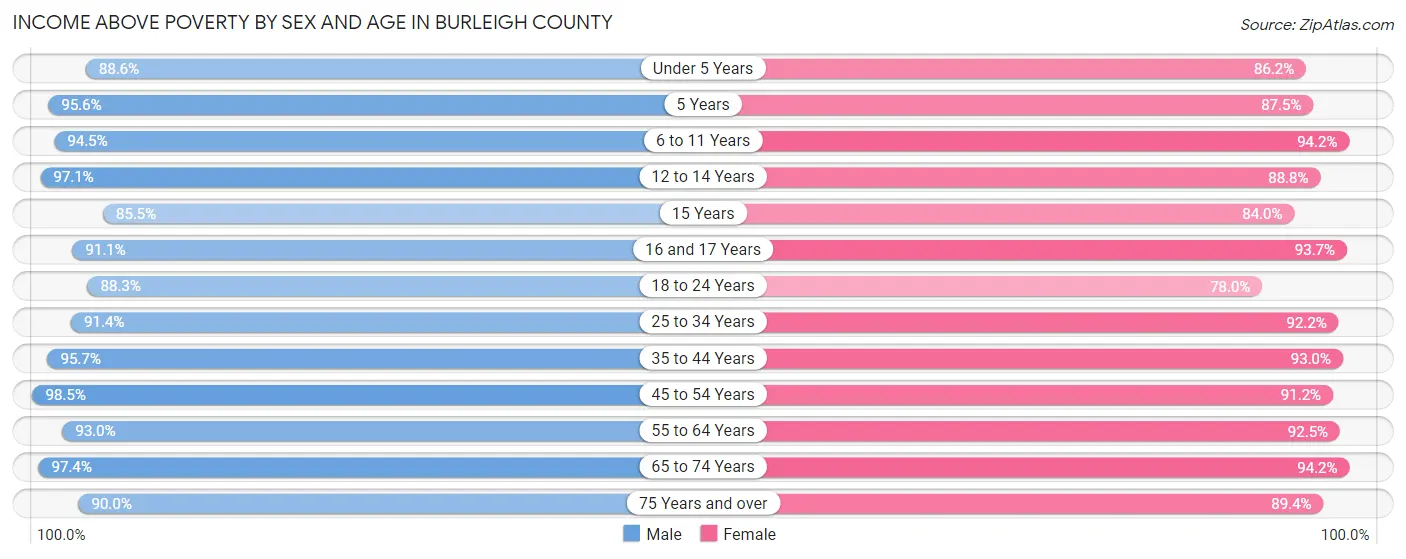
Income Above Poverty by Sex and Age in Burleigh County
According to the poverty statistics in Burleigh County, males aged 45 to 54 years and females aged 65 to 74 years are the age groups that are most secure financially, with 98.5% of males and 94.2% of females in these age groups living above the poverty line.
| Age Bracket | Male | Female |
| Under 5 Years | 2,787 (88.6%) | 2,393 (86.2%) |
| 5 Years | 542 (95.6%) | 567 (87.5%) |
| 6 to 11 Years | 3,622 (94.5%) | 3,367 (94.2%) |
| 12 to 14 Years | 1,882 (97.1%) | 1,889 (88.8%) |
| 15 Years | 394 (85.5%) | 587 (84.0%) |
| 16 and 17 Years | 1,520 (91.1%) | 1,003 (93.7%) |
| 18 to 24 Years | 3,524 (88.3%) | 2,873 (78.0%) |
| 25 to 34 Years | 6,047 (91.4%) | 5,746 (92.2%) |
| 35 to 44 Years | 6,518 (95.7%) | 5,689 (93.0%) |
| 45 to 54 Years | 5,243 (98.5%) | 4,643 (91.1%) |
| 55 to 64 Years | 5,538 (93.0%) | 5,974 (92.4%) |
| 65 to 74 Years | 4,393 (97.4%) | 4,576 (94.2%) |
| 75 Years and over | 2,455 (90.0%) | 3,472 (89.4%) |
| Total | 44,465 (93.5%) | 42,779 (90.6%) |
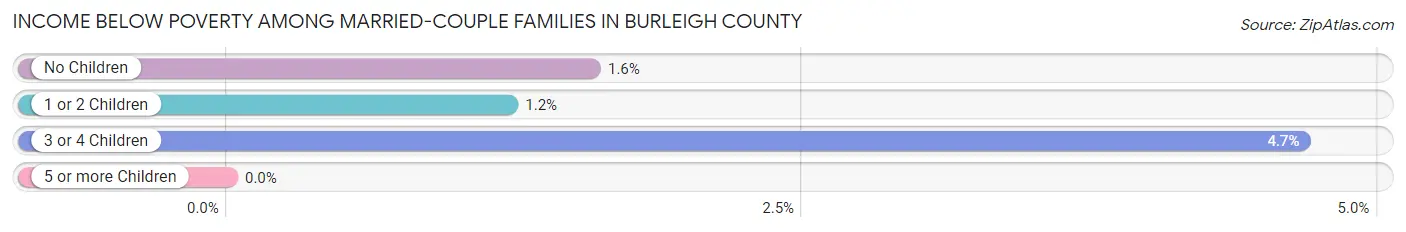
Income Below Poverty Among Married-Couple Families in Burleigh County
The poverty statistics for married-couple families in Burleigh County show that 1.8% or 364 of the total 20,244 families live below the poverty line. Families with 3 or 4 children have the highest poverty rate of 4.7%, comprising of 103 families. On the other hand, families with 5 or more children have the lowest poverty rate of 0.0%, which includes 0 families.
| Children | Above Poverty | Below Poverty |
| No Children | 11,247 (98.4%) | 181 (1.6%) |
| 1 or 2 Children | 6,470 (98.8%) | 80 (1.2%) |
| 3 or 4 Children | 2,102 (95.3%) | 103 (4.7%) |
| 5 or more Children | 61 (100.0%) | 0 (0.0%) |
| Total | 19,880 (98.2%) | 364 (1.8%) |
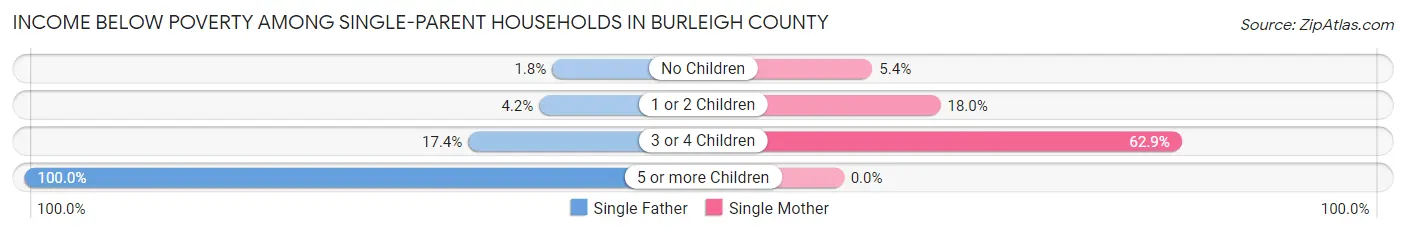
Income Below Poverty Among Single-Parent Households in Burleigh County
According to the poverty data in Burleigh County, 4.6% or 73 single-father households and 21.9% or 635 single-mother households are living below the poverty line. Among single-father households, those with 5 or more children have the highest poverty rate, with 3 households (100.0%) experiencing poverty. Likewise, among single-mother households, those with 3 or 4 children have the highest poverty rate, with 287 households (62.9%) falling below the poverty line.
| Children | Single Father | Single Mother |
| No Children | 10 (1.8%) | 39 (5.3%) |
| 1 or 2 Children | 36 (4.2%) | 309 (18.0%) |
| 3 or 4 Children | 24 (17.4%) | 287 (62.9%) |
| 5 or more Children | 3 (100.0%) | 0 (0.0%) |
| Total | 73 (4.6%) | 635 (21.9%) |
Income Below Poverty Among Married-Couple vs Single-Parent Households in Burleigh County
The poverty data for Burleigh County shows that 364 of the married-couple family households (1.8%) and 708 of the single-parent households (15.8%) are living below the poverty level. Within the married-couple family households, those with 3 or 4 children have the highest poverty rate, with 103 households (4.7%) falling below the poverty line. Among the single-parent households, those with 5 or more children have the highest poverty rate, with 3 household (100.0%) living below poverty.
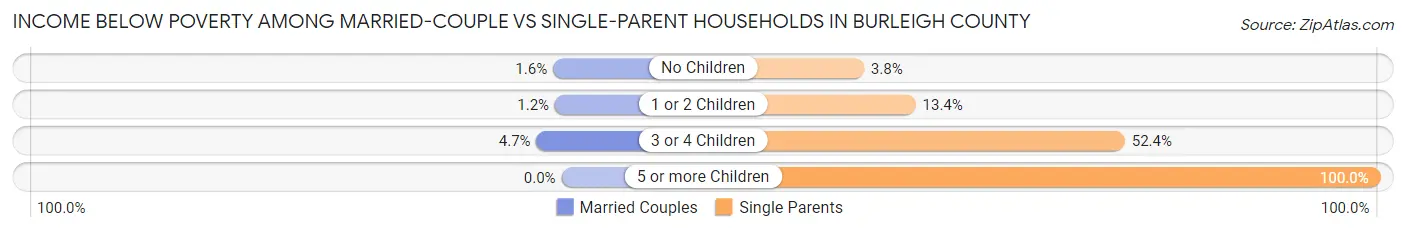
| Children | Married-Couple Families | Single-Parent Households |
| No Children | 181 (1.6%) | 49 (3.8%) |
| 1 or 2 Children | 80 (1.2%) | 345 (13.4%) |
| 3 or 4 Children | 103 (4.7%) | 311 (52.4%) |
| 5 or more Children | 0 (0.0%) | 3 (100.0%) |
| Total | 364 (1.8%) | 708 (15.8%) |
Employment Characteristics in Burleigh County
Employment by Class of Employer in Burleigh County
Among the 50,478 employed individuals in Burleigh County, private company employees (29,155 | 57.8%), not-for-profit organizations (6,615 | 13.1%), and state government employees (4,510 | 8.9%) make up the most common classes of employment.
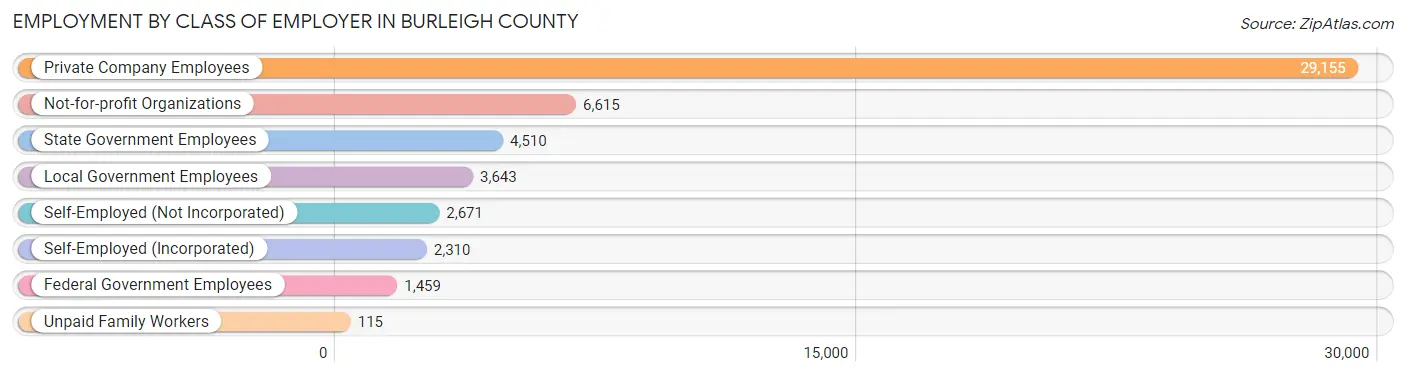
| Employer Class | # Employees | % Employees |
| Private Company Employees | 29,155 | 57.8% |
| Self-Employed (Incorporated) | 2,310 | 4.6% |
| Self-Employed (Not Incorporated) | 2,671 | 5.3% |
| Not-for-profit Organizations | 6,615 | 13.1% |
| Local Government Employees | 3,643 | 7.2% |
| State Government Employees | 4,510 | 8.9% |
| Federal Government Employees | 1,459 | 2.9% |
| Unpaid Family Workers | 115 | 0.2% |
| Total | 50,478 | 100.0% |
Employment Status by Age in Burleigh County
According to the labor force statistics for Burleigh County, out of the total population over 16 years of age (78,280), 67.1% or 52,526 individuals are in the labor force, with 2.7% or 1,418 of them unemployed. The age group with the highest labor force participation rate is 35 to 44 years, with 89.7% or 11,845 individuals in the labor force. Within the labor force, the 20 to 24 years age range has the highest percentage of unemployed individuals, with 9.9% or 520 of them being unemployed.
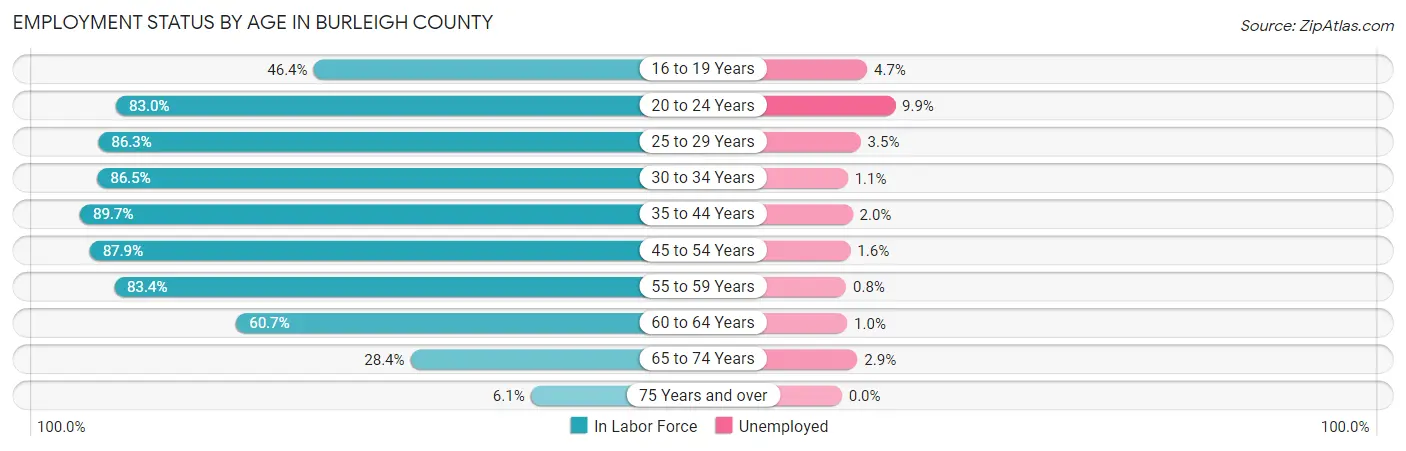
| Age Bracket | In Labor Force | Unemployed |
| 16 to 19 Years | 2,592 (46.4%) | 122 (4.7%) |
| 20 to 24 Years | 5,253 (83.0%) | 520 (9.9%) |
| 25 to 29 Years | 5,319 (86.3%) | 186 (3.5%) |
| 30 to 34 Years | 6,170 (86.5%) | 68 (1.1%) |
| 35 to 44 Years | 11,845 (89.7%) | 237 (2.0%) |
| 45 to 54 Years | 9,291 (87.9%) | 149 (1.6%) |
| 55 to 59 Years | 4,955 (83.4%) | 40 (0.8%) |
| 60 to 64 Years | 3,995 (60.7%) | 40 (1.0%) |
| 65 to 74 Years | 2,679 (28.4%) | 78 (2.9%) |
| 75 Years and over | 448 (6.1%) | 0 (0.0%) |
| Total | 52,526 (67.1%) | 1,418 (2.7%) |
Employment Status by Educational Attainment in Burleigh County
According to labor force statistics for Burleigh County, 83.8% of individuals (41,559) out of the total population between 25 and 64 years of age (49,593) are in the labor force, with 1.7% or 707 of them being unemployed. The group with the highest labor force participation rate are those with the educational attainment of bachelor's degree or higher, with 91.7% or 18,080 individuals in the labor force. Within the labor force, individuals with less than high school education have the highest percentage of unemployment, with 4.2% or 54 of them being unemployed.
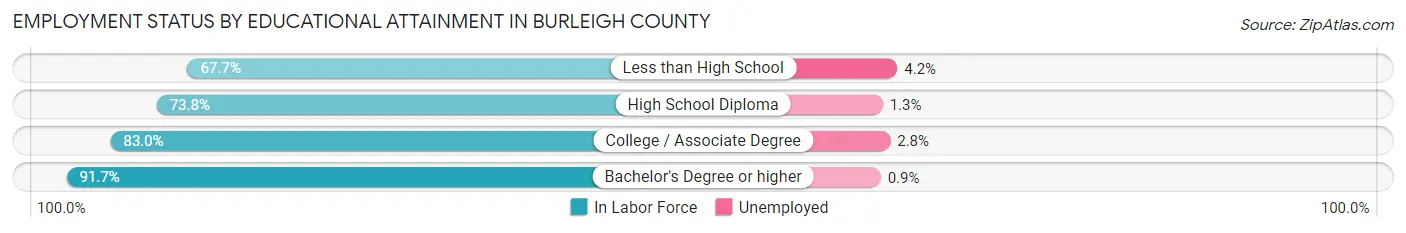
| Educational Attainment | In Labor Force | Unemployed |
| Less than High School | 1,294 (67.7%) | 80 (4.2%) |
| High School Diploma | 8,074 (73.8%) | 142 (1.3%) |
| College / Associate Degree | 14,131 (83.0%) | 477 (2.8%) |
| Bachelor's Degree or higher | 18,080 (91.7%) | 177 (0.9%) |
| Total | 41,559 (83.8%) | 843 (1.7%) |
Employment Occupations by Sex in Burleigh County
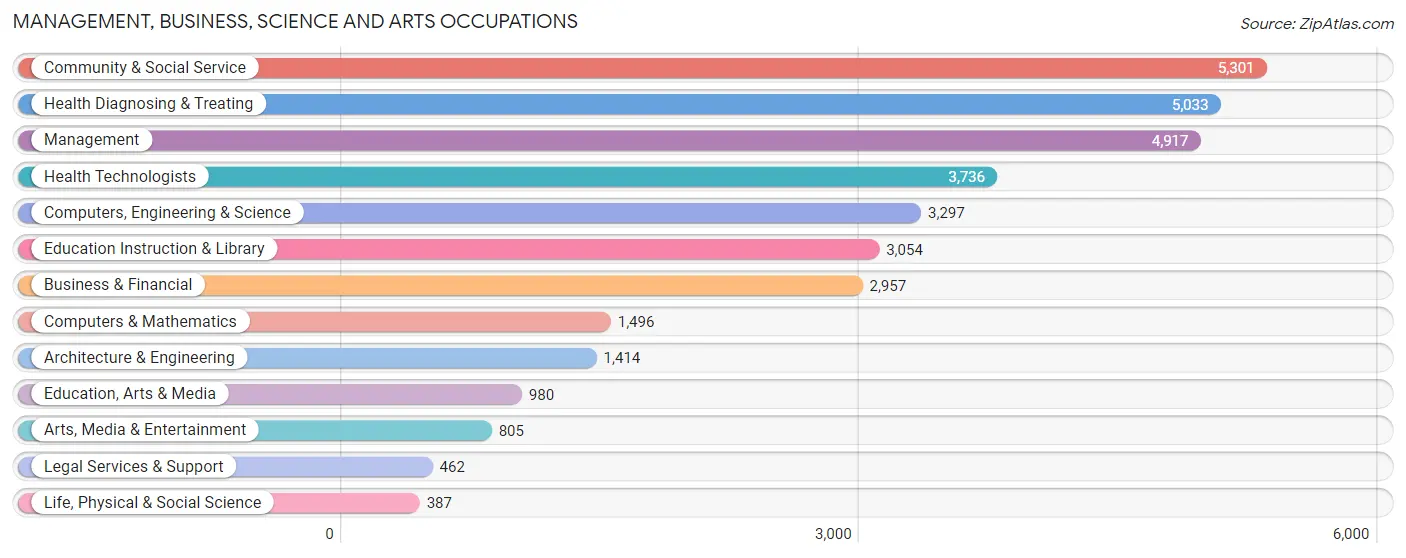
Management, Business, Science and Arts Occupations
The most common Management, Business, Science and Arts occupations in Burleigh County are Community & Social Service (5,301 | 10.4%), Health Diagnosing & Treating (5,033 | 9.9%), Management (4,917 | 9.7%), Health Technologists (3,736 | 7.3%), and Computers, Engineering & Science (3,297 | 6.5%).
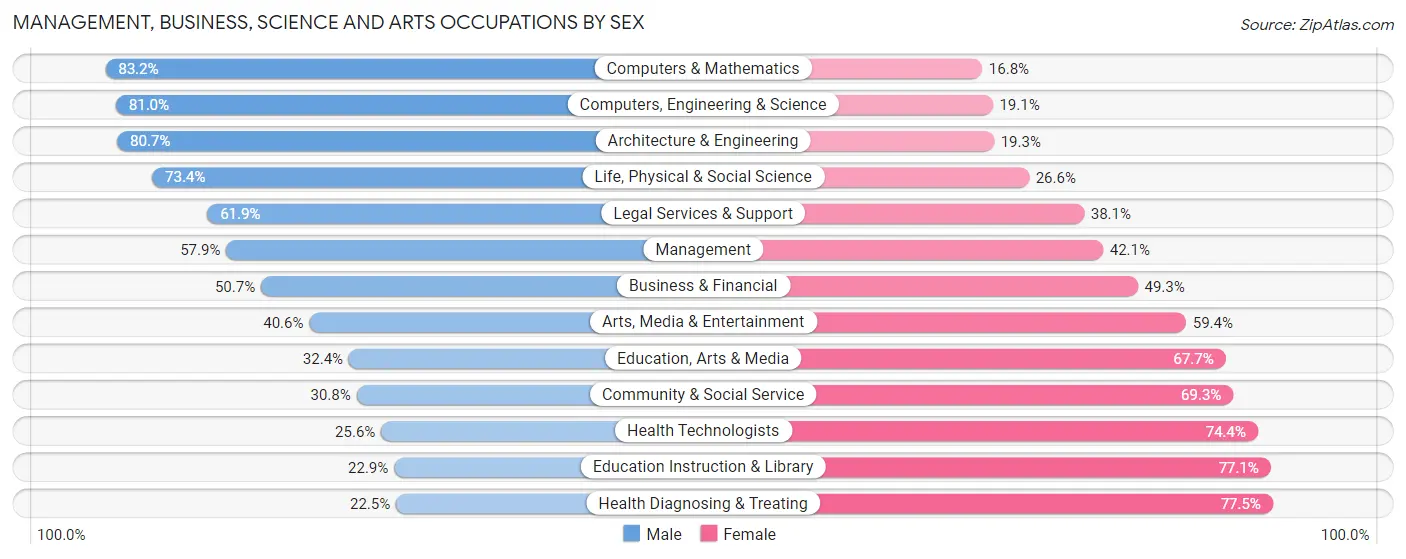
Management, Business, Science and Arts Occupations by Sex
Within the Management, Business, Science and Arts occupations in Burleigh County, the most male-oriented occupations are Computers & Mathematics (83.2%), Computers, Engineering & Science (80.9%), and Architecture & Engineering (80.7%), while the most female-oriented occupations are Health Diagnosing & Treating (77.5%), Education Instruction & Library (77.1%), and Health Technologists (74.4%).
| Occupation | Male | Female |
| Management | 2,849 (57.9%) | 2,068 (42.1%) |
| Business & Financial | 1,499 (50.7%) | 1,458 (49.3%) |
| Computers, Engineering & Science | 2,669 (80.9%) | 628 (19.1%) |
| Computers & Mathematics | 1,244 (83.2%) | 252 (16.8%) |
| Architecture & Engineering | 1,141 (80.7%) | 273 (19.3%) |
| Life, Physical & Social Science | 284 (73.4%) | 103 (26.6%) |
| Community & Social Service | 1,630 (30.7%) | 3,671 (69.3%) |
| Education, Arts & Media | 317 (32.4%) | 663 (67.6%) |
| Legal Services & Support | 286 (61.9%) | 176 (38.1%) |
| Education Instruction & Library | 700 (22.9%) | 2,354 (77.1%) |
| Arts, Media & Entertainment | 327 (40.6%) | 478 (59.4%) |
| Health Diagnosing & Treating | 1,133 (22.5%) | 3,900 (77.5%) |
| Health Technologists | 957 (25.6%) | 2,779 (74.4%) |
| Total (Category) | 9,780 (45.5%) | 11,725 (54.5%) |
| Total (Overall) | 26,994 (53.0%) | 23,971 (47.0%) |
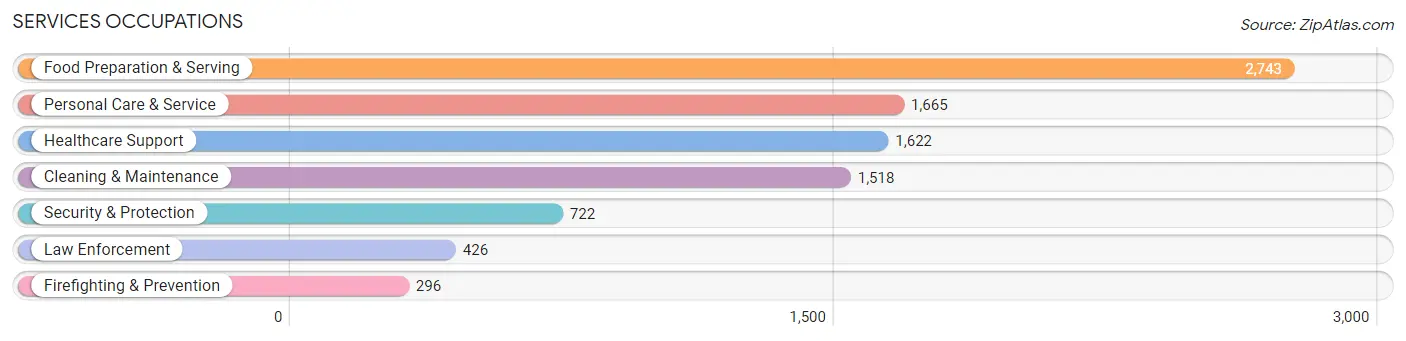
Services Occupations
The most common Services occupations in Burleigh County are Food Preparation & Serving (2,743 | 5.4%), Personal Care & Service (1,665 | 3.3%), Healthcare Support (1,622 | 3.2%), Cleaning & Maintenance (1,518 | 3.0%), and Security & Protection (722 | 1.4%).
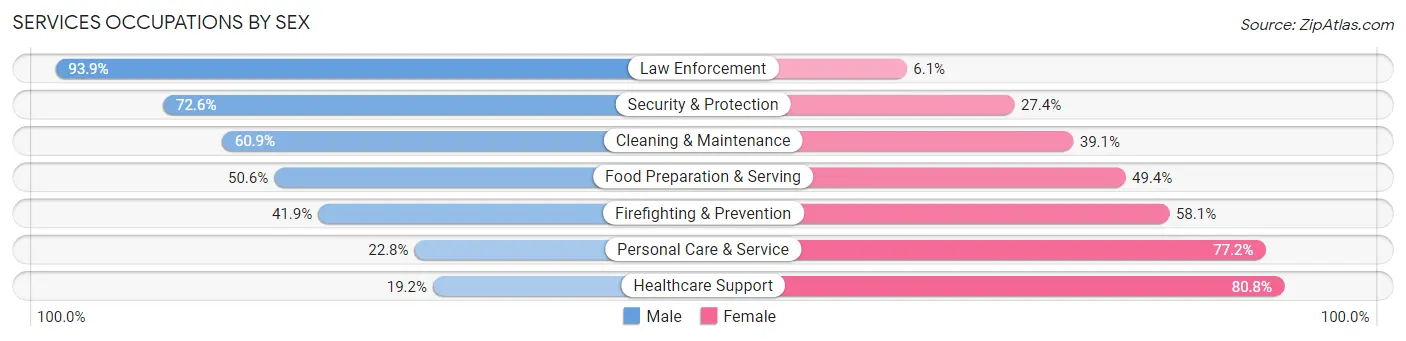
Services Occupations by Sex
Within the Services occupations in Burleigh County, the most male-oriented occupations are Law Enforcement (93.9%), Security & Protection (72.6%), and Cleaning & Maintenance (60.9%), while the most female-oriented occupations are Healthcare Support (80.8%), Personal Care & Service (77.2%), and Firefighting & Prevention (58.1%).
| Occupation | Male | Female |
| Healthcare Support | 311 (19.2%) | 1,311 (80.8%) |
| Security & Protection | 524 (72.6%) | 198 (27.4%) |
| Firefighting & Prevention | 124 (41.9%) | 172 (58.1%) |
| Law Enforcement | 400 (93.9%) | 26 (6.1%) |
| Food Preparation & Serving | 1,388 (50.6%) | 1,355 (49.4%) |
| Cleaning & Maintenance | 925 (60.9%) | 593 (39.1%) |
| Personal Care & Service | 380 (22.8%) | 1,285 (77.2%) |
| Total (Category) | 3,528 (42.7%) | 4,742 (57.3%) |
| Total (Overall) | 26,994 (53.0%) | 23,971 (47.0%) |
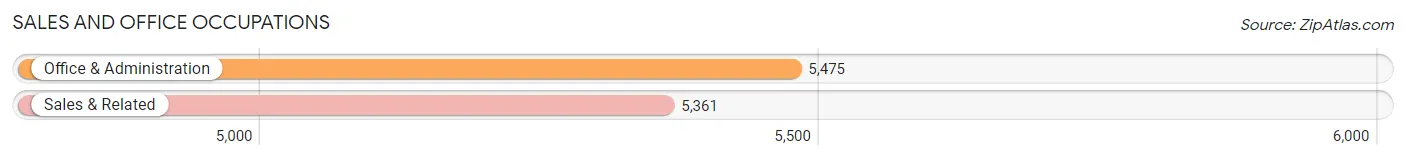
Sales and Office Occupations
The most common Sales and Office occupations in Burleigh County are Office & Administration (5,475 | 10.7%), and Sales & Related (5,361 | 10.5%).
Sales and Office Occupations by Sex
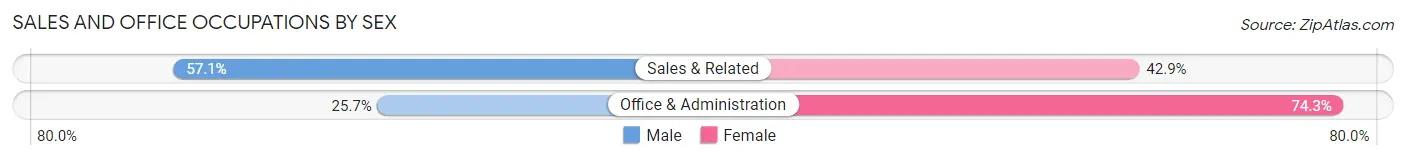
| Occupation | Male | Female |
| Sales & Related | 3,061 (57.1%) | 2,300 (42.9%) |
| Office & Administration | 1,406 (25.7%) | 4,069 (74.3%) |
| Total (Category) | 4,467 (41.2%) | 6,369 (58.8%) |
| Total (Overall) | 26,994 (53.0%) | 23,971 (47.0%) |
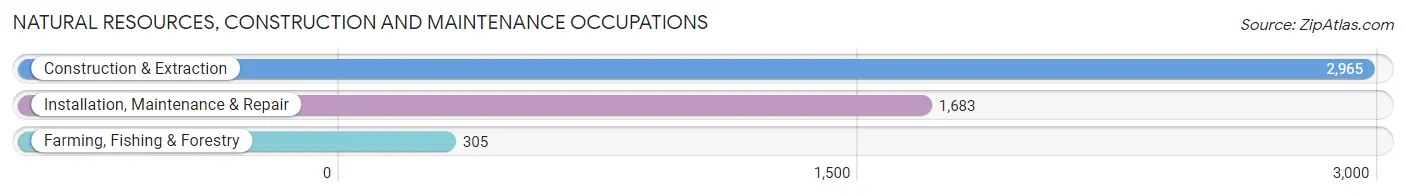
Natural Resources, Construction and Maintenance Occupations
The most common Natural Resources, Construction and Maintenance occupations in Burleigh County are Construction & Extraction (2,965 | 5.8%), Installation, Maintenance & Repair (1,683 | 3.3%), and Farming, Fishing & Forestry (305 | 0.6%).
Natural Resources, Construction and Maintenance Occupations by Sex
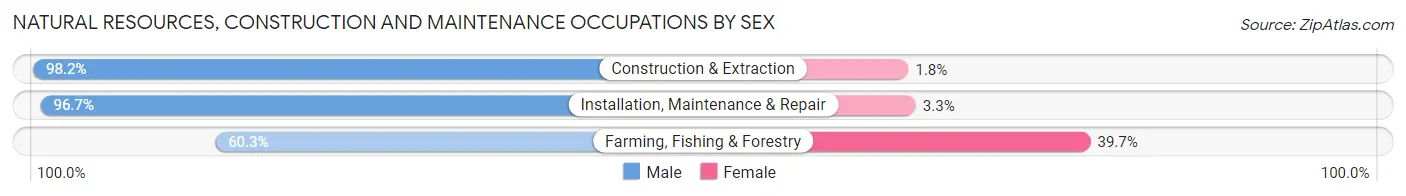
| Occupation | Male | Female |
| Farming, Fishing & Forestry | 184 (60.3%) | 121 (39.7%) |
| Construction & Extraction | 2,912 (98.2%) | 53 (1.8%) |
| Installation, Maintenance & Repair | 1,627 (96.7%) | 56 (3.3%) |
| Total (Category) | 4,723 (95.4%) | 230 (4.6%) |
| Total (Overall) | 26,994 (53.0%) | 23,971 (47.0%) |
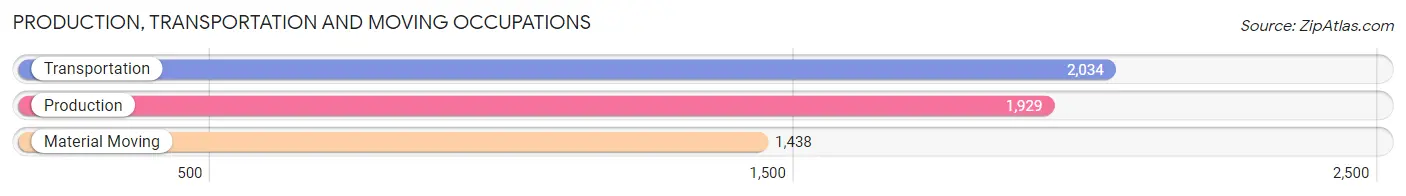
Production, Transportation and Moving Occupations
The most common Production, Transportation and Moving occupations in Burleigh County are Transportation (2,034 | 4.0%), Production (1,929 | 3.8%), and Material Moving (1,438 | 2.8%).
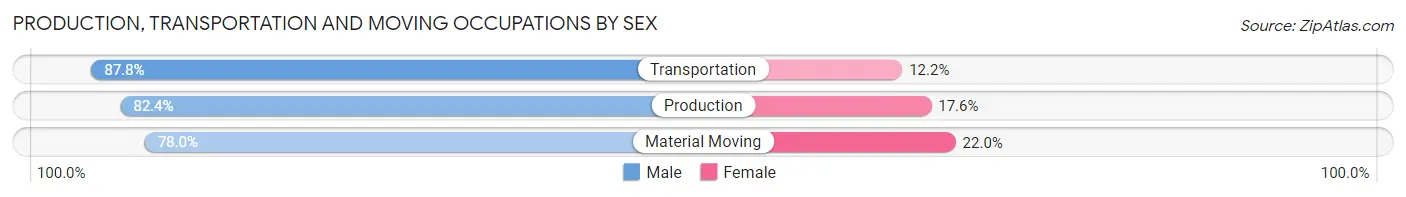
Production, Transportation and Moving Occupations by Sex
| Occupation | Male | Female |
| Production | 1,590 (82.4%) | 339 (17.6%) |
| Transportation | 1,785 (87.8%) | 249 (12.2%) |
| Material Moving | 1,121 (78.0%) | 317 (22.0%) |
| Total (Category) | 4,496 (83.2%) | 905 (16.8%) |
| Total (Overall) | 26,994 (53.0%) | 23,971 (47.0%) |
Employment Industries by Sex in Burleigh County
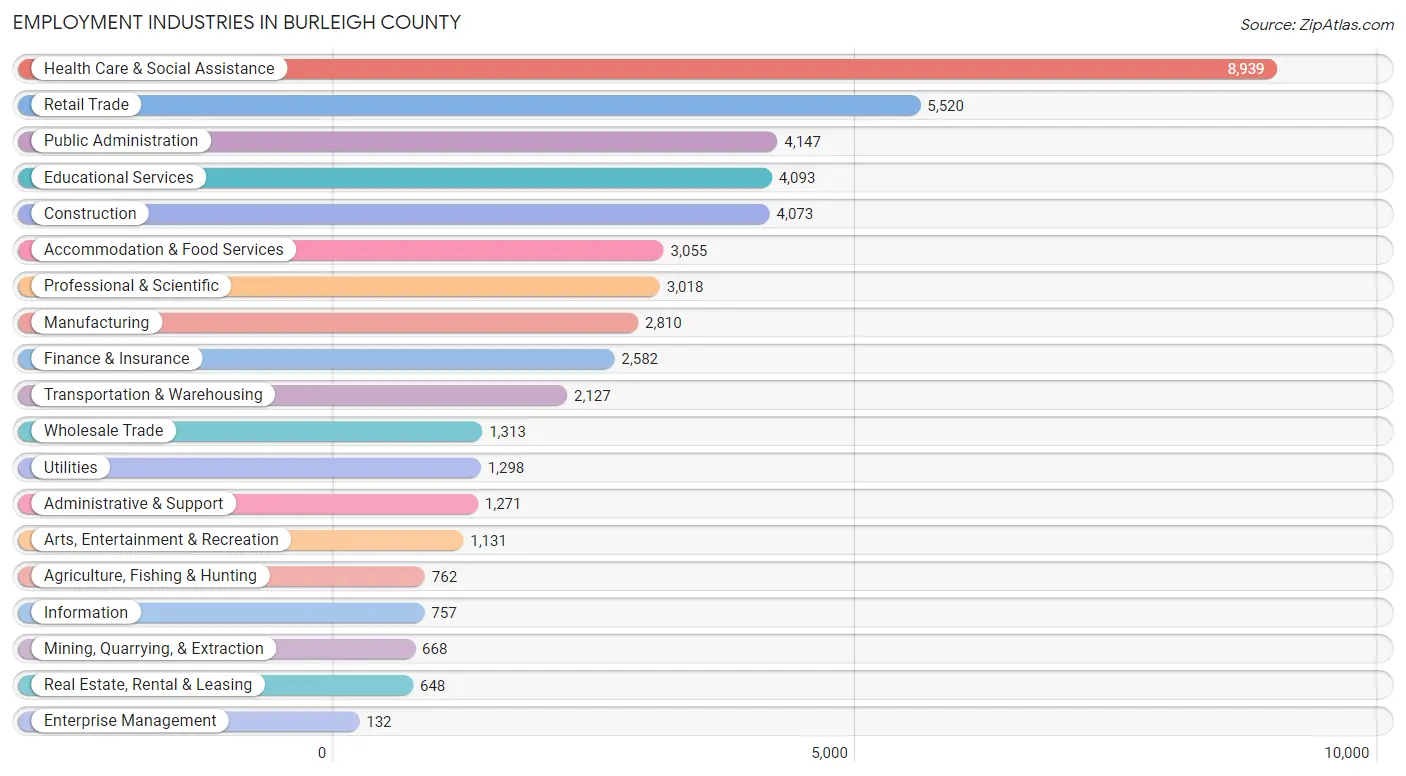
Employment Industries in Burleigh County
The major employment industries in Burleigh County include Health Care & Social Assistance (8,939 | 17.5%), Retail Trade (5,520 | 10.8%), Public Administration (4,147 | 8.1%), Educational Services (4,093 | 8.0%), and Construction (4,073 | 8.0%).
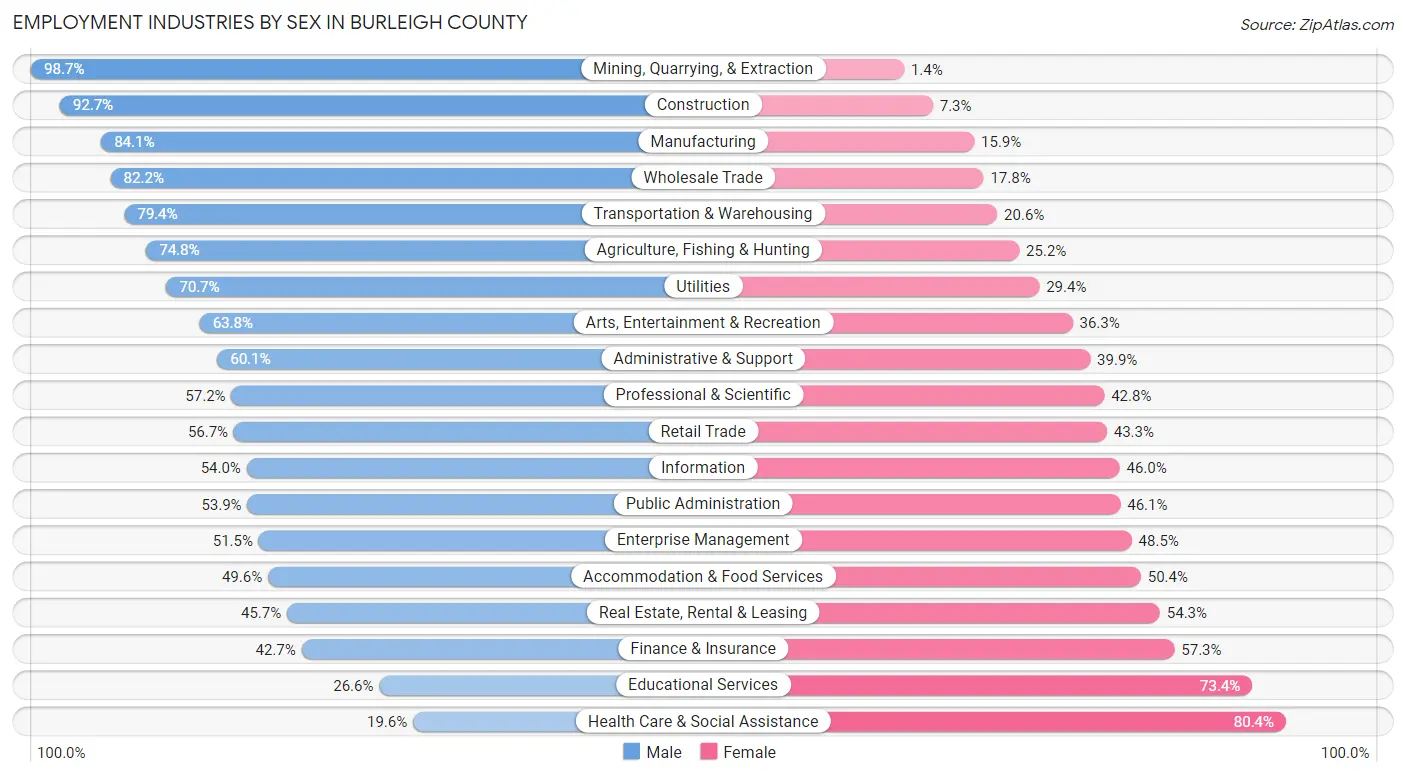
Employment Industries by Sex in Burleigh County
The Burleigh County industries that see more men than women are Mining, Quarrying, & Extraction (98.7%), Construction (92.7%), and Manufacturing (84.1%), whereas the industries that tend to have a higher number of women are Health Care & Social Assistance (80.4%), Educational Services (73.4%), and Finance & Insurance (57.3%).
| Industry | Male | Female |
| Agriculture, Fishing & Hunting | 570 (74.8%) | 192 (25.2%) |
| Mining, Quarrying, & Extraction | 659 (98.7%) | 9 (1.3%) |
| Construction | 3,775 (92.7%) | 298 (7.3%) |
| Manufacturing | 2,364 (84.1%) | 446 (15.9%) |
| Wholesale Trade | 1,079 (82.2%) | 234 (17.8%) |
| Retail Trade | 3,128 (56.7%) | 2,392 (43.3%) |
| Transportation & Warehousing | 1,688 (79.4%) | 439 (20.6%) |
| Utilities | 917 (70.7%) | 381 (29.3%) |
| Information | 409 (54.0%) | 348 (46.0%) |
| Finance & Insurance | 1,102 (42.7%) | 1,480 (57.3%) |
| Real Estate, Rental & Leasing | 296 (45.7%) | 352 (54.3%) |
| Professional & Scientific | 1,726 (57.2%) | 1,292 (42.8%) |
| Enterprise Management | 68 (51.5%) | 64 (48.5%) |
| Administrative & Support | 764 (60.1%) | 507 (39.9%) |
| Educational Services | 1,088 (26.6%) | 3,005 (73.4%) |
| Health Care & Social Assistance | 1,752 (19.6%) | 7,187 (80.4%) |
| Arts, Entertainment & Recreation | 721 (63.7%) | 410 (36.2%) |
| Accommodation & Food Services | 1,516 (49.6%) | 1,539 (50.4%) |
| Public Administration | 2,234 (53.9%) | 1,913 (46.1%) |
| Total | 26,994 (53.0%) | 23,971 (47.0%) |
Education in Burleigh County
School Enrollment in Burleigh County
The most common levels of schooling among the 23,217 students in Burleigh County are middle school (5,632 | 24.3%), high school (4,663 | 20.1%), and college / undergraduate (4,659 | 20.1%).
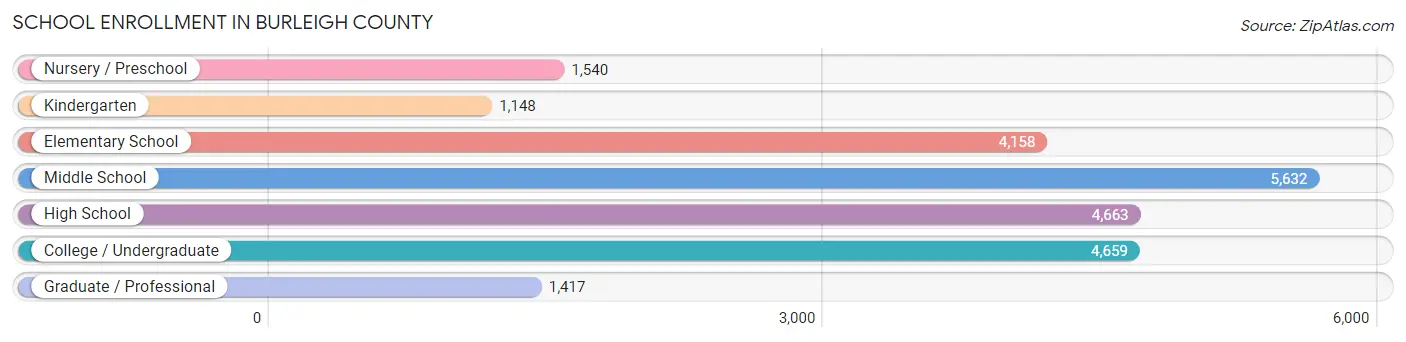
| School Level | # Students | % Students |
| Nursery / Preschool | 1,540 | 6.6% |
| Kindergarten | 1,148 | 4.9% |
| Elementary School | 4,158 | 17.9% |
| Middle School | 5,632 | 24.3% |
| High School | 4,663 | 20.1% |
| College / Undergraduate | 4,659 | 20.1% |
| Graduate / Professional | 1,417 | 6.1% |
| Total | 23,217 | 100.0% |
School Enrollment by Age by Funding Source in Burleigh County
Out of a total of 23,217 students who are enrolled in schools in Burleigh County, 5,061 (21.8%) attend a private institution, while the remaining 18,156 (78.2%) are enrolled in public schools. The age group of 3 to 4 year olds has the highest likelihood of being enrolled in private schools, with 466 (45.9% in the age bracket) enrolled. Conversely, the age group of 10 to 14 year olds has the lowest likelihood of being enrolled in a private school, with 6,046 (89.5% in the age bracket) attending a public institution.
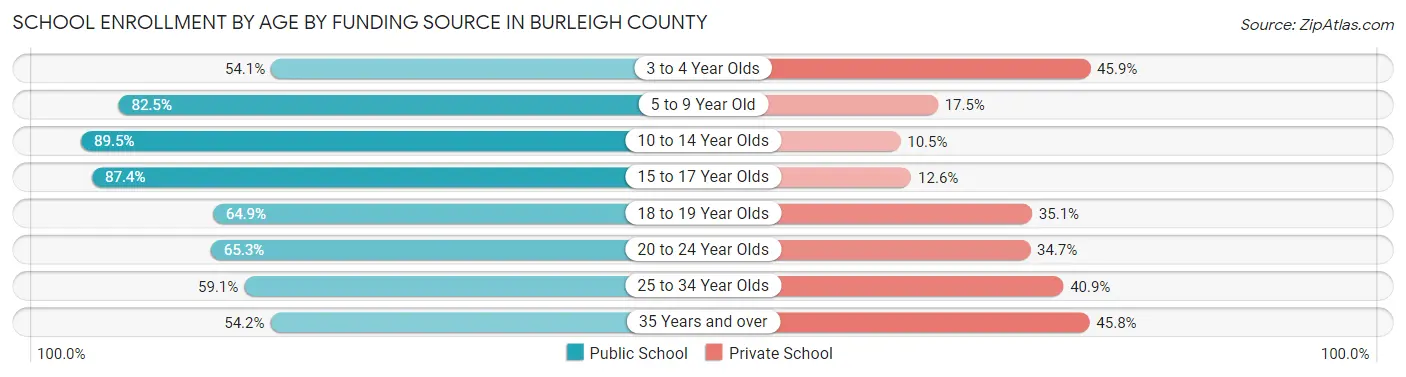
| Age Bracket | Public School | Private School |
| 3 to 4 Year Olds | 549 (54.1%) | 466 (45.9%) |
| 5 to 9 Year Old | 4,076 (82.5%) | 865 (17.5%) |
| 10 to 14 Year Olds | 6,046 (89.5%) | 712 (10.5%) |
| 15 to 17 Year Olds | 3,276 (87.4%) | 471 (12.6%) |
| 18 to 19 Year Olds | 1,445 (64.9%) | 780 (35.1%) |
| 20 to 24 Year Olds | 1,554 (65.3%) | 826 (34.7%) |
| 25 to 34 Year Olds | 587 (59.1%) | 406 (40.9%) |
| 35 Years and over | 628 (54.2%) | 530 (45.8%) |
| Total | 18,156 (78.2%) | 5,061 (21.8%) |
Educational Attainment by Field of Study in Burleigh County
Business (5,454 | 20.0%), education (4,459 | 16.4%), science & technology (4,390 | 16.1%), arts & humanities (2,231 | 8.2%), and engineering (1,876 | 6.9%) are the most common fields of study among 27,239 individuals in Burleigh County who have obtained a bachelor's degree or higher.
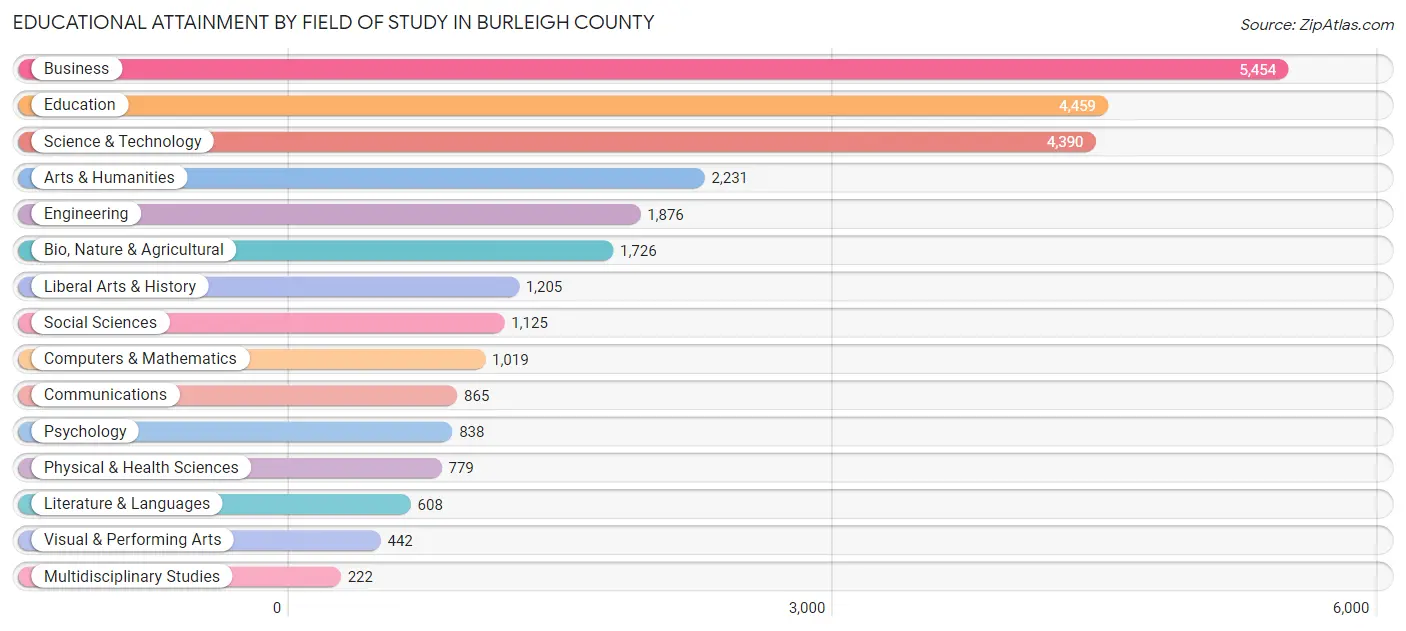
| Field of Study | # Graduates | % Graduates |
| Computers & Mathematics | 1,019 | 3.7% |
| Bio, Nature & Agricultural | 1,726 | 6.3% |
| Physical & Health Sciences | 779 | 2.9% |
| Psychology | 838 | 3.1% |
| Social Sciences | 1,125 | 4.1% |
| Engineering | 1,876 | 6.9% |
| Multidisciplinary Studies | 222 | 0.8% |
| Science & Technology | 4,390 | 16.1% |
| Business | 5,454 | 20.0% |
| Education | 4,459 | 16.4% |
| Literature & Languages | 608 | 2.2% |
| Liberal Arts & History | 1,205 | 4.4% |
| Visual & Performing Arts | 442 | 1.6% |
| Communications | 865 | 3.2% |
| Arts & Humanities | 2,231 | 8.2% |
| Total | 27,239 | 100.0% |
Transportation & Commute in Burleigh County
Vehicle Availability by Sex in Burleigh County
The most prevalent vehicle ownership categories in Burleigh County are males with 2 vehicles (10,869, accounting for 41.0%) and females with 2 vehicles (9,369, making up 46.9%).
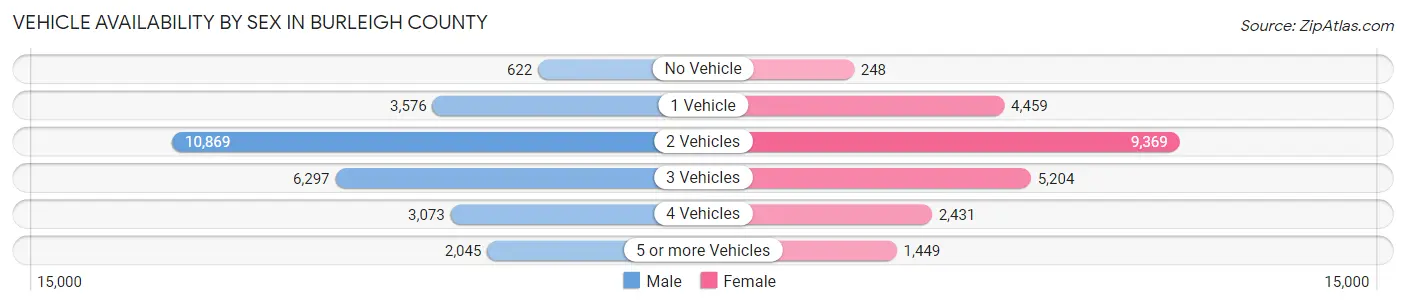
| Vehicles Available | Male | Female |
| No Vehicle | 622 (2.4%) | 248 (1.1%) |
| 1 Vehicle | 3,576 (13.5%) | 4,459 (19.3%) |
| 2 Vehicles | 10,869 (41.0%) | 9,369 (40.5%) |
| 3 Vehicles | 6,297 (23.8%) | 5,204 (22.5%) |
| 4 Vehicles | 3,073 (11.6%) | 2,431 (10.5%) |
| 5 or more Vehicles | 2,045 (7.7%) | 1,449 (6.3%) |
| Total | 26,482 (100.0%) | 23,160 (100.0%) |
Commute Time in Burleigh County
The most frequently occuring commute durations in Burleigh County are 10 to 14 minutes (12,889 commuters, 27.4%), 15 to 19 minutes (11,301 commuters, 24.0%), and 5 to 9 minutes (7,941 commuters, 16.9%).
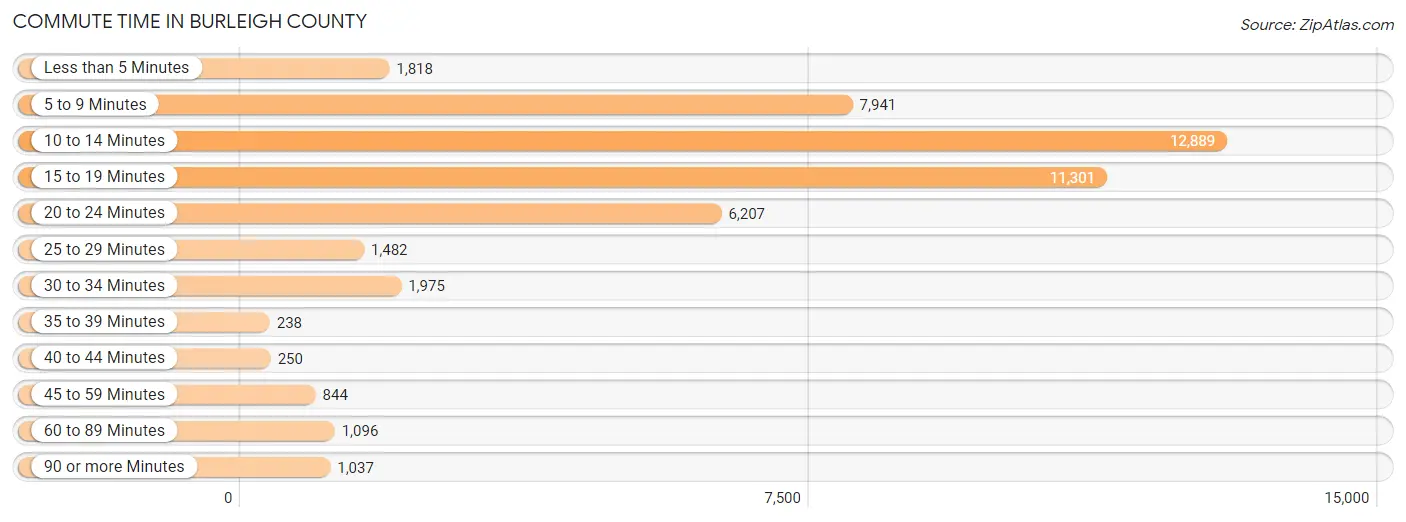
| Commute Time | # Commuters | % Commuters |
| Less than 5 Minutes | 1,818 | 3.9% |
| 5 to 9 Minutes | 7,941 | 16.9% |
| 10 to 14 Minutes | 12,889 | 27.4% |
| 15 to 19 Minutes | 11,301 | 24.0% |
| 20 to 24 Minutes | 6,207 | 13.2% |
| 25 to 29 Minutes | 1,482 | 3.2% |
| 30 to 34 Minutes | 1,975 | 4.2% |
| 35 to 39 Minutes | 238 | 0.5% |
| 40 to 44 Minutes | 250 | 0.5% |
| 45 to 59 Minutes | 844 | 1.8% |
| 60 to 89 Minutes | 1,096 | 2.3% |
| 90 or more Minutes | 1,037 | 2.2% |
Commute Time by Sex in Burleigh County
The most common commute times in Burleigh County are 10 to 14 minutes (7,142 commuters, 28.3%) for males and 10 to 14 minutes (5,747 commuters, 26.3%) for females.
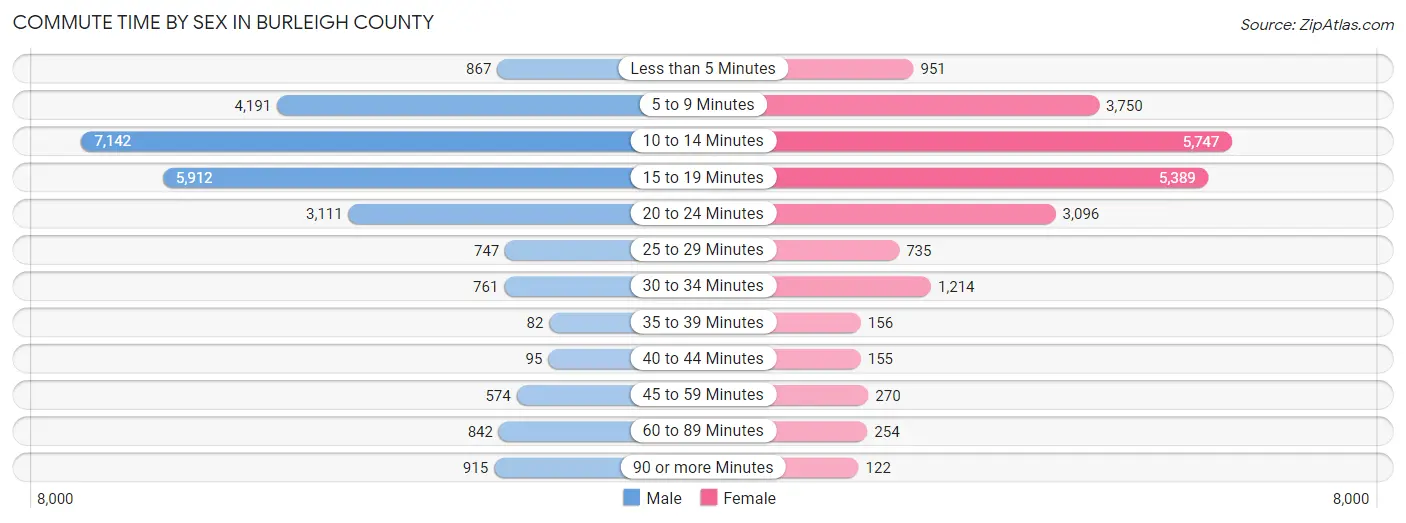
| Commute Time | Male | Female |
| Less than 5 Minutes | 867 (3.4%) | 951 (4.3%) |
| 5 to 9 Minutes | 4,191 (16.6%) | 3,750 (17.2%) |
| 10 to 14 Minutes | 7,142 (28.3%) | 5,747 (26.3%) |
| 15 to 19 Minutes | 5,912 (23.4%) | 5,389 (24.7%) |
| 20 to 24 Minutes | 3,111 (12.3%) | 3,096 (14.2%) |
| 25 to 29 Minutes | 747 (3.0%) | 735 (3.4%) |
| 30 to 34 Minutes | 761 (3.0%) | 1,214 (5.6%) |
| 35 to 39 Minutes | 82 (0.3%) | 156 (0.7%) |
| 40 to 44 Minutes | 95 (0.4%) | 155 (0.7%) |
| 45 to 59 Minutes | 574 (2.3%) | 270 (1.2%) |
| 60 to 89 Minutes | 842 (3.3%) | 254 (1.2%) |
| 90 or more Minutes | 915 (3.6%) | 122 (0.6%) |
Time of Departure to Work by Sex in Burleigh County
The most frequent times of departure to work in Burleigh County are 7:30 AM to 7:59 AM (5,088, 20.2%) for males and 7:30 AM to 7:59 AM (5,159, 23.6%) for females.
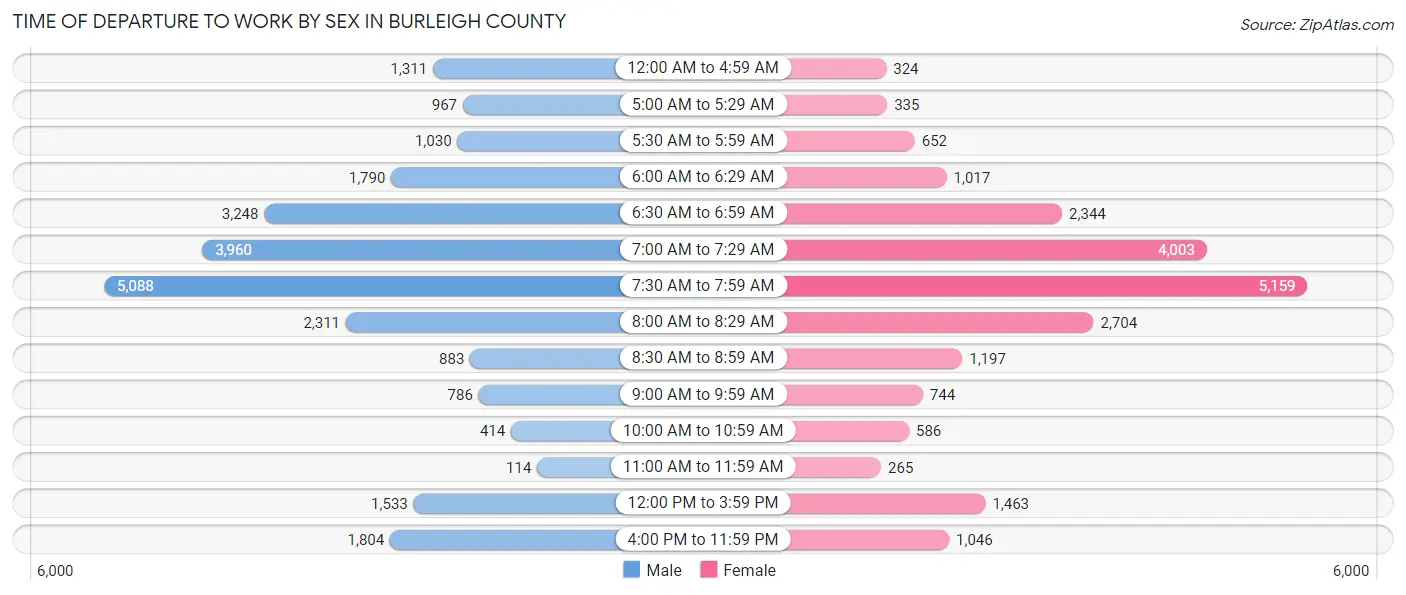
| Time of Departure | Male | Female |
| 12:00 AM to 4:59 AM | 1,311 (5.2%) | 324 (1.5%) |
| 5:00 AM to 5:29 AM | 967 (3.8%) | 335 (1.5%) |
| 5:30 AM to 5:59 AM | 1,030 (4.1%) | 652 (3.0%) |
| 6:00 AM to 6:29 AM | 1,790 (7.1%) | 1,017 (4.7%) |
| 6:30 AM to 6:59 AM | 3,248 (12.9%) | 2,344 (10.7%) |
| 7:00 AM to 7:29 AM | 3,960 (15.7%) | 4,003 (18.3%) |
| 7:30 AM to 7:59 AM | 5,088 (20.2%) | 5,159 (23.6%) |
| 8:00 AM to 8:29 AM | 2,311 (9.2%) | 2,704 (12.4%) |
| 8:30 AM to 8:59 AM | 883 (3.5%) | 1,197 (5.5%) |
| 9:00 AM to 9:59 AM | 786 (3.1%) | 744 (3.4%) |
| 10:00 AM to 10:59 AM | 414 (1.6%) | 586 (2.7%) |
| 11:00 AM to 11:59 AM | 114 (0.4%) | 265 (1.2%) |
| 12:00 PM to 3:59 PM | 1,533 (6.1%) | 1,463 (6.7%) |
| 4:00 PM to 11:59 PM | 1,804 (7.1%) | 1,046 (4.8%) |
| Total | 25,239 (100.0%) | 21,839 (100.0%) |
Housing Occupancy in Burleigh County
Occupancy by Ownership in Burleigh County
Of the total 39,885 dwellings in Burleigh County, owner-occupied units account for 28,486 (71.4%), while renter-occupied units make up 11,399 (28.6%).
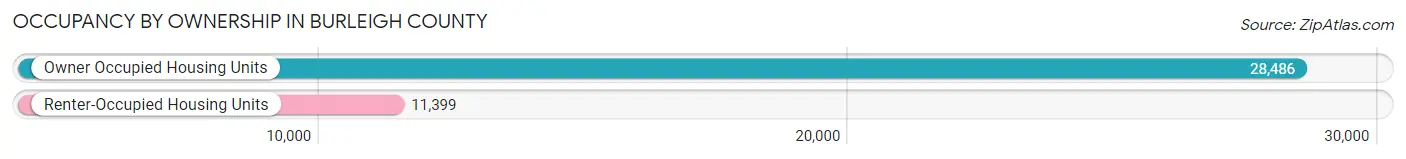
| Occupancy | # Housing Units | % Housing Units |
| Owner Occupied Housing Units | 28,486 | 71.4% |
| Renter-Occupied Housing Units | 11,399 | 28.6% |
| Total Occupied Housing Units | 39,885 | 100.0% |
Occupancy by Household Size in Burleigh County
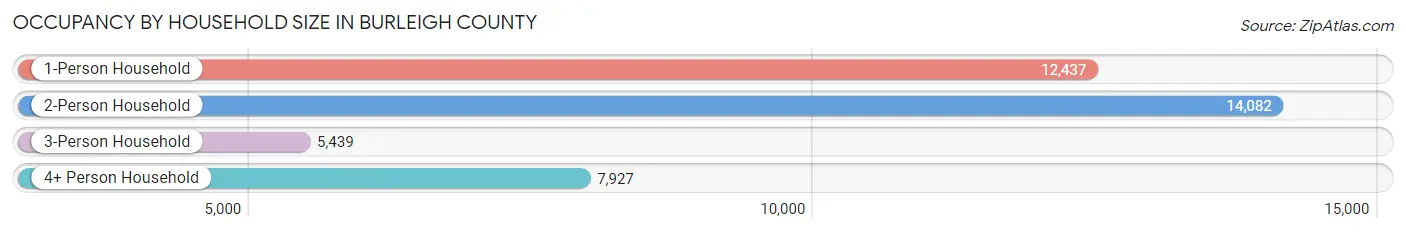
| Household Size | # Housing Units | % Housing Units |
| 1-Person Household | 12,437 | 31.2% |
| 2-Person Household | 14,082 | 35.3% |
| 3-Person Household | 5,439 | 13.6% |
| 4+ Person Household | 7,927 | 19.9% |
| Total Housing Units | 39,885 | 100.0% |
Occupancy by Ownership by Household Size in Burleigh County
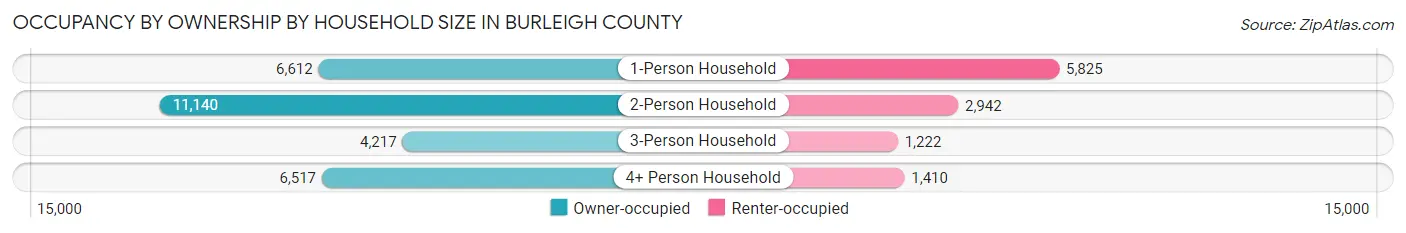
| Household Size | Owner-occupied | Renter-occupied |
| 1-Person Household | 6,612 (53.2%) | 5,825 (46.8%) |
| 2-Person Household | 11,140 (79.1%) | 2,942 (20.9%) |
| 3-Person Household | 4,217 (77.5%) | 1,222 (22.5%) |
| 4+ Person Household | 6,517 (82.2%) | 1,410 (17.8%) |
| Total Housing Units | 28,486 (71.4%) | 11,399 (28.6%) |
Occupancy by Educational Attainment in Burleigh County
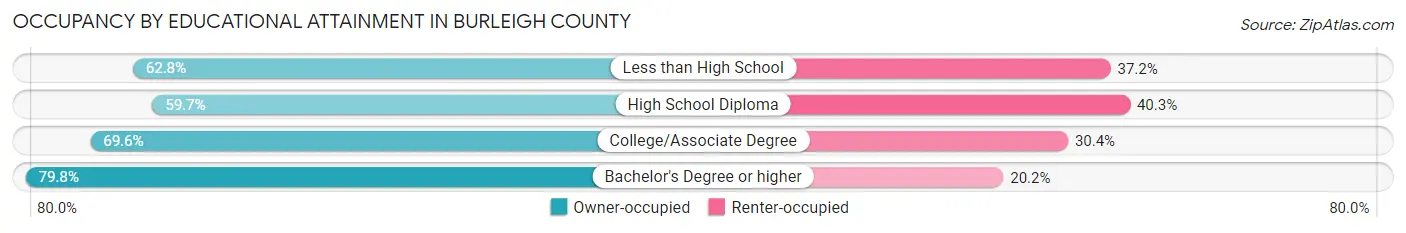
| Household Size | Owner-occupied | Renter-occupied |
| Less than High School | 943 (62.8%) | 558 (37.2%) |
| High School Diploma | 4,928 (59.7%) | 3,321 (40.3%) |
| College/Associate Degree | 9,798 (69.6%) | 4,284 (30.4%) |
| Bachelor's Degree or higher | 12,817 (79.8%) | 3,236 (20.2%) |
Occupancy by Age of Householder in Burleigh County
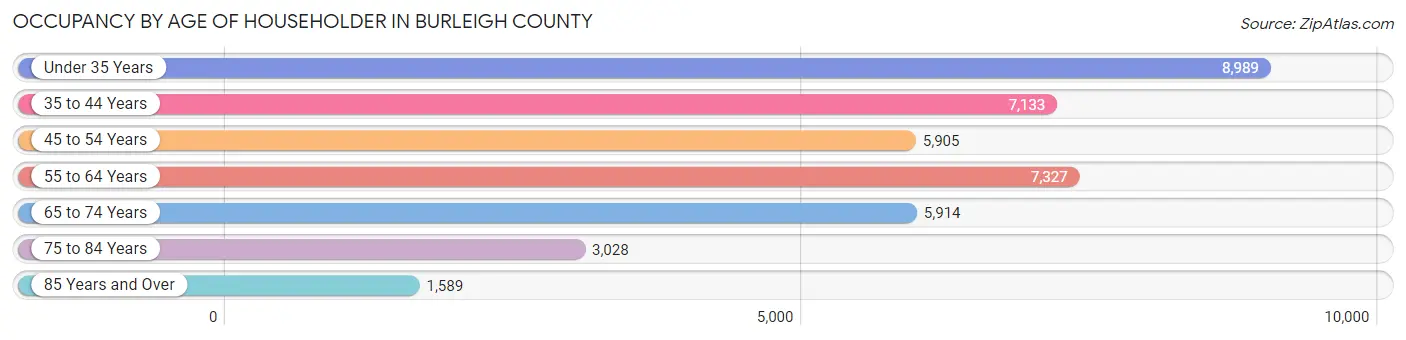
| Age Bracket | # Households | % Households |
| Under 35 Years | 8,989 | 22.5% |
| 35 to 44 Years | 7,133 | 17.9% |
| 45 to 54 Years | 5,905 | 14.8% |
| 55 to 64 Years | 7,327 | 18.4% |
| 65 to 74 Years | 5,914 | 14.8% |
| 75 to 84 Years | 3,028 | 7.6% |
| 85 Years and Over | 1,589 | 4.0% |
| Total | 39,885 | 100.0% |
Housing Finances in Burleigh County
Median Income by Occupancy in Burleigh County
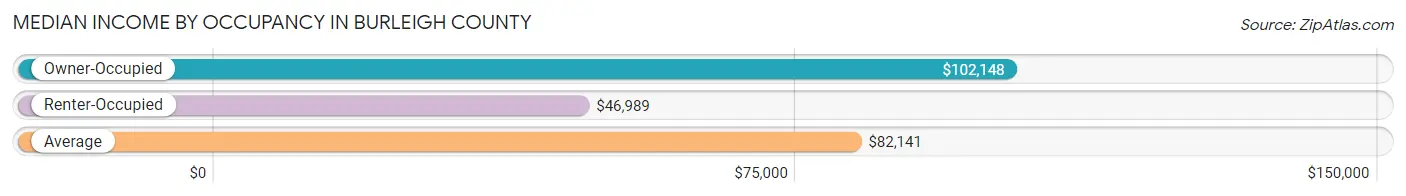
| Occupancy Type | # Households | Median Income |
| Owner-Occupied | 28,486 (71.4%) | $102,148 |
| Renter-Occupied | 11,399 (28.6%) | $46,989 |
| Average | 39,885 (100.0%) | $82,141 |
Occupancy by Householder Income Bracket in Burleigh County
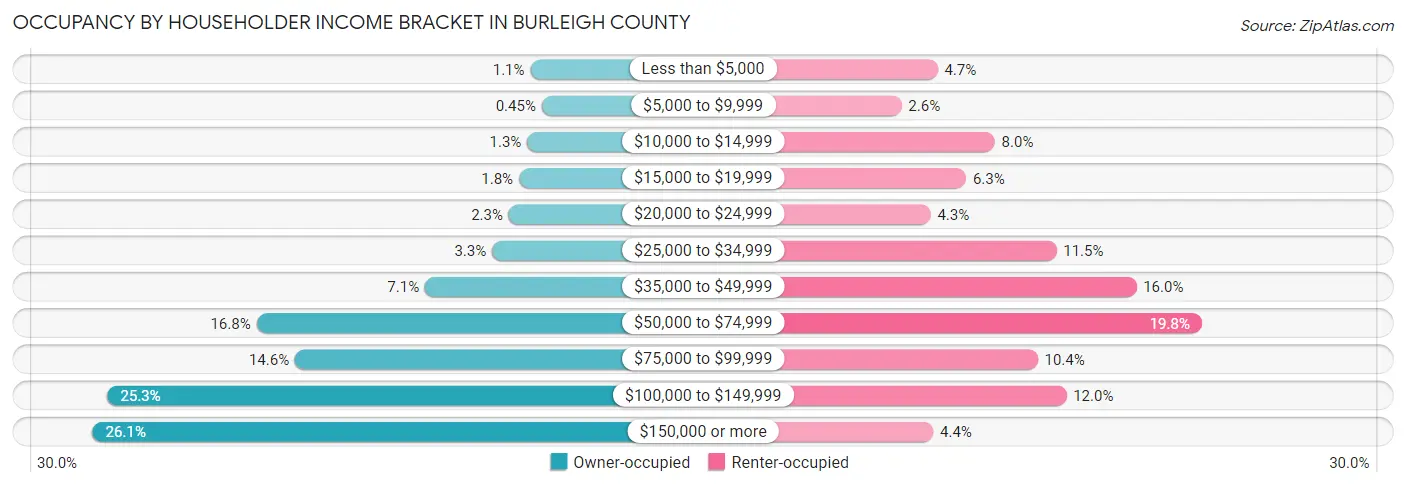
| Income Bracket | Owner-occupied | Renter-occupied |
| Less than $5,000 | 313 (1.1%) | 533 (4.7%) |
| $5,000 to $9,999 | 128 (0.4%) | 299 (2.6%) |
| $10,000 to $14,999 | 365 (1.3%) | 906 (8.0%) |
| $15,000 to $19,999 | 498 (1.8%) | 719 (6.3%) |
| $20,000 to $24,999 | 664 (2.3%) | 488 (4.3%) |
| $25,000 to $34,999 | 936 (3.3%) | 1,308 (11.5%) |
| $35,000 to $49,999 | 2,027 (7.1%) | 1,828 (16.0%) |
| $50,000 to $74,999 | 4,772 (16.8%) | 2,255 (19.8%) |
| $75,000 to $99,999 | 4,144 (14.5%) | 1,186 (10.4%) |
| $100,000 to $149,999 | 7,198 (25.3%) | 1,372 (12.0%) |
| $150,000 or more | 7,441 (26.1%) | 505 (4.4%) |
| Total | 28,486 (100.0%) | 11,399 (100.0%) |
Monthly Housing Cost Tiers in Burleigh County
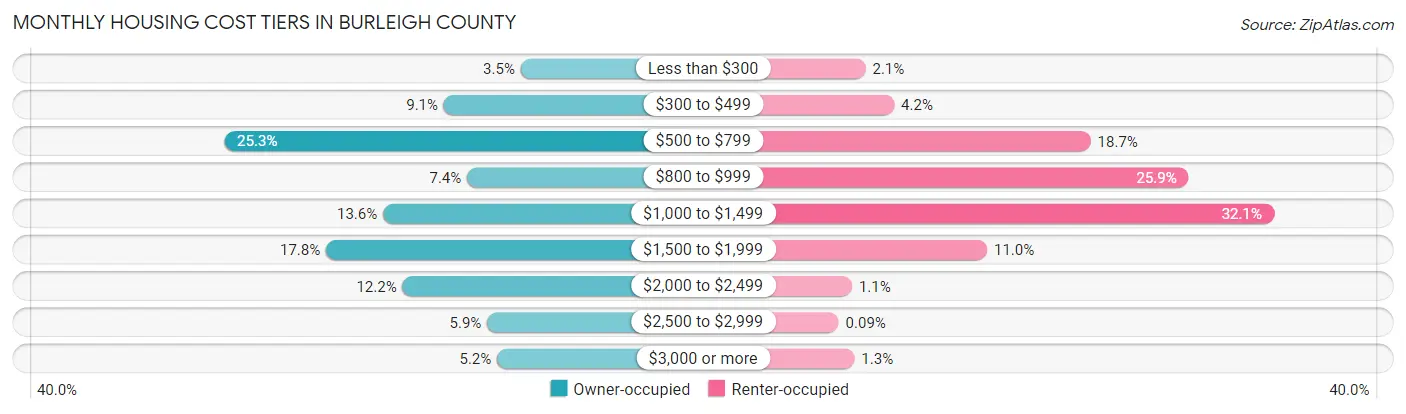
| Monthly Cost | Owner-occupied | Renter-occupied |
| Less than $300 | 985 (3.5%) | 236 (2.1%) |
| $300 to $499 | 2,597 (9.1%) | 477 (4.2%) |
| $500 to $799 | 7,210 (25.3%) | 2,126 (18.6%) |
| $800 to $999 | 2,110 (7.4%) | 2,948 (25.9%) |
| $1,000 to $1,499 | 3,874 (13.6%) | 3,663 (32.1%) |
| $1,500 to $1,999 | 5,070 (17.8%) | 1,256 (11.0%) |
| $2,000 to $2,499 | 3,468 (12.2%) | 122 (1.1%) |
| $2,500 to $2,999 | 1,690 (5.9%) | 10 (0.1%) |
| $3,000 or more | 1,482 (5.2%) | 143 (1.3%) |
| Total | 28,486 (100.0%) | 11,399 (100.0%) |
Physical Housing Characteristics in Burleigh County
Housing Structures in Burleigh County
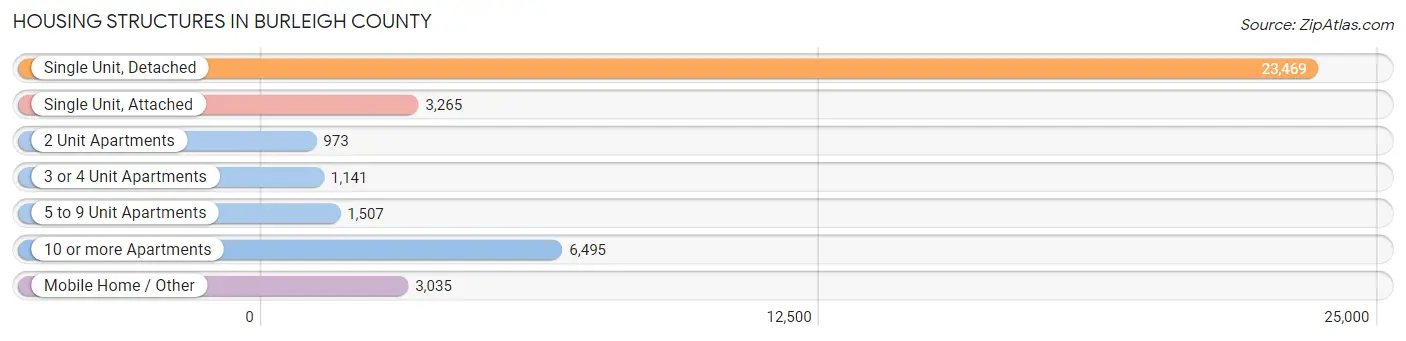
| Structure Type | # Housing Units | % Housing Units |
| Single Unit, Detached | 23,469 | 58.8% |
| Single Unit, Attached | 3,265 | 8.2% |
| 2 Unit Apartments | 973 | 2.4% |
| 3 or 4 Unit Apartments | 1,141 | 2.9% |
| 5 to 9 Unit Apartments | 1,507 | 3.8% |
| 10 or more Apartments | 6,495 | 16.3% |
| Mobile Home / Other | 3,035 | 7.6% |
| Total | 39,885 | 100.0% |
Housing Structures by Occupancy in Burleigh County
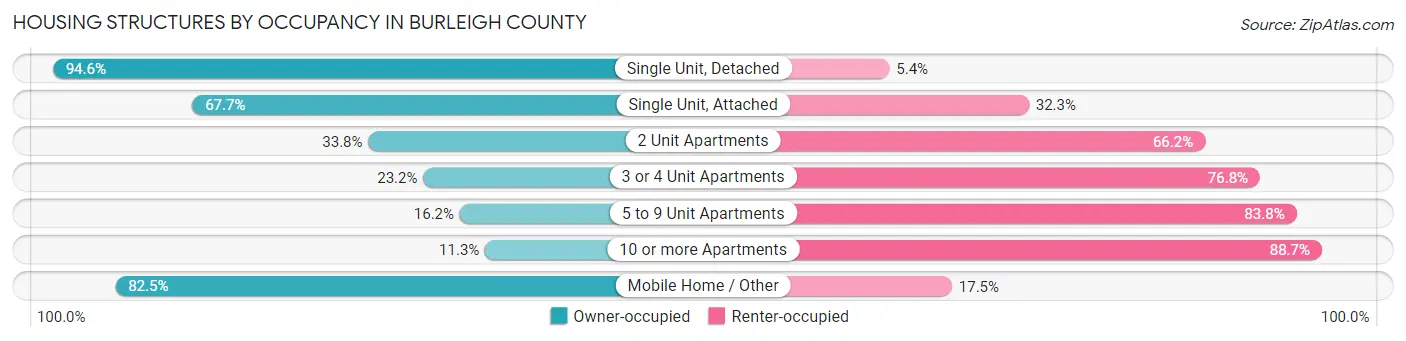
| Structure Type | Owner-occupied | Renter-occupied |
| Single Unit, Detached | 22,197 (94.6%) | 1,272 (5.4%) |
| Single Unit, Attached | 2,211 (67.7%) | 1,054 (32.3%) |
| 2 Unit Apartments | 329 (33.8%) | 644 (66.2%) |
| 3 or 4 Unit Apartments | 265 (23.2%) | 876 (76.8%) |
| 5 to 9 Unit Apartments | 244 (16.2%) | 1,263 (83.8%) |
| 10 or more Apartments | 735 (11.3%) | 5,760 (88.7%) |
| Mobile Home / Other | 2,505 (82.5%) | 530 (17.5%) |
| Total | 28,486 (71.4%) | 11,399 (28.6%) |
Housing Structures by Number of Rooms in Burleigh County
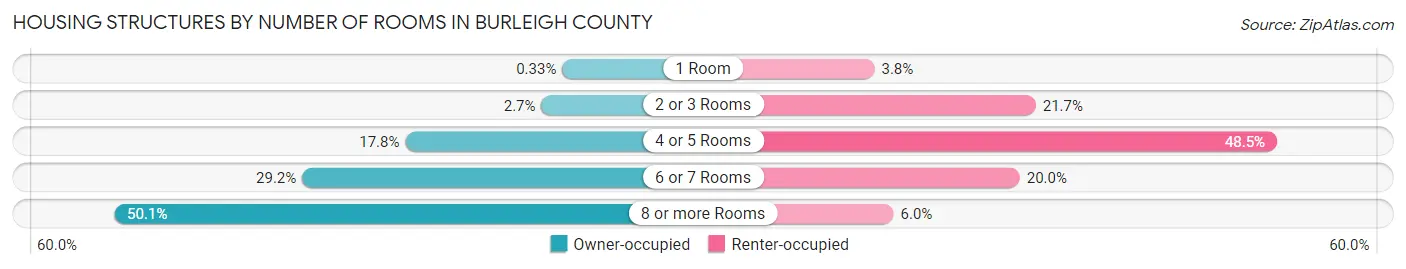
| Number of Rooms | Owner-occupied | Renter-occupied |
| 1 Room | 94 (0.3%) | 438 (3.8%) |
| 2 or 3 Rooms | 754 (2.6%) | 2,478 (21.7%) |
| 4 or 5 Rooms | 5,057 (17.7%) | 5,529 (48.5%) |
| 6 or 7 Rooms | 8,317 (29.2%) | 2,275 (20.0%) |
| 8 or more Rooms | 14,264 (50.1%) | 679 (6.0%) |
| Total | 28,486 (100.0%) | 11,399 (100.0%) |
Housing Structure by Heating Type in Burleigh County
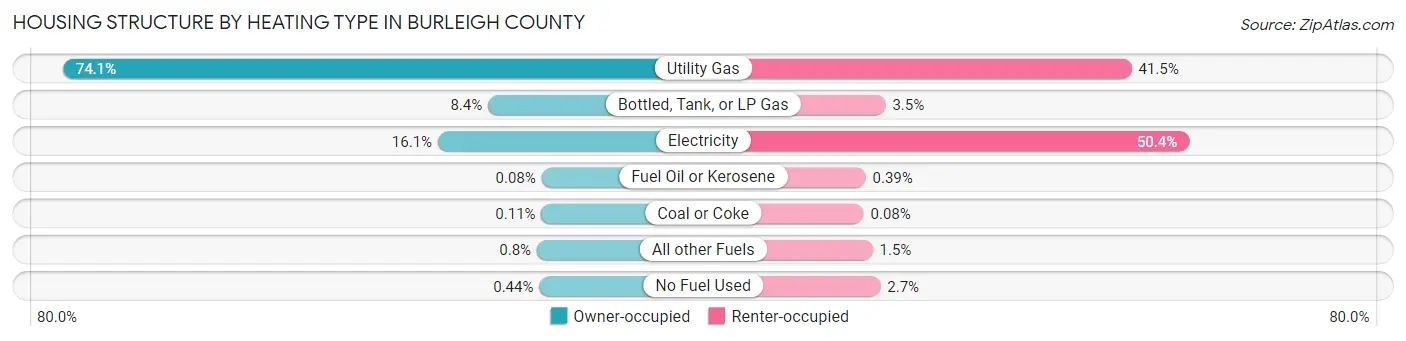
| Heating Type | Owner-occupied | Renter-occupied |
| Utility Gas | 21,106 (74.1%) | 4,732 (41.5%) |
| Bottled, Tank, or LP Gas | 2,382 (8.4%) | 396 (3.5%) |
| Electricity | 4,588 (16.1%) | 5,743 (50.4%) |
| Fuel Oil or Kerosene | 24 (0.1%) | 45 (0.4%) |
| Coal or Coke | 31 (0.1%) | 9 (0.1%) |
| All other Fuels | 229 (0.8%) | 169 (1.5%) |
| No Fuel Used | 126 (0.4%) | 305 (2.7%) |
| Total | 28,486 (100.0%) | 11,399 (100.0%) |
Household Vehicle Usage in Burleigh County
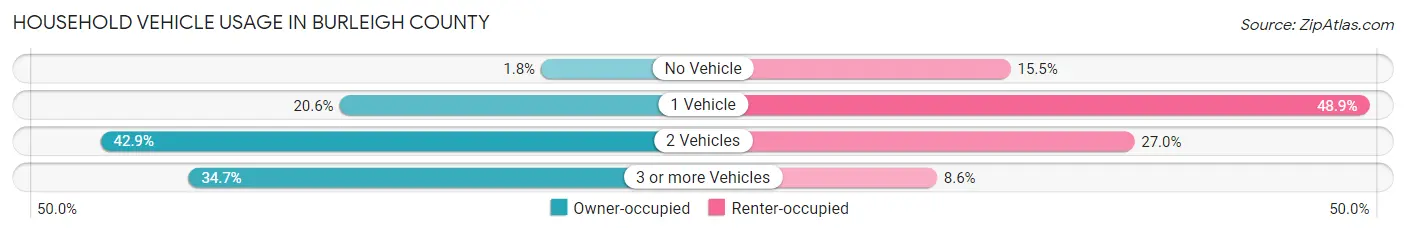
| Vehicles per Household | Owner-occupied | Renter-occupied |
| No Vehicle | 512 (1.8%) | 1,763 (15.5%) |
| 1 Vehicle | 5,870 (20.6%) | 5,579 (48.9%) |
| 2 Vehicles | 12,220 (42.9%) | 3,079 (27.0%) |
| 3 or more Vehicles | 9,884 (34.7%) | 978 (8.6%) |
| Total | 28,486 (100.0%) | 11,399 (100.0%) |
Real Estate & Mortgages in Burleigh County
Real Estate and Mortgage Overview in Burleigh County
| Characteristic | Without Mortgage | With Mortgage |
| Housing Units | 12,101 | 16,385 |
| Median Property Value | $277,900 | $323,600 |
| Median Household Income | $79,022 | $4,833 |
| Monthly Housing Costs | $589 | $1,422 |
| Real Estate Taxes | $2,468 | $360 |
Property Value by Mortgage Status in Burleigh County
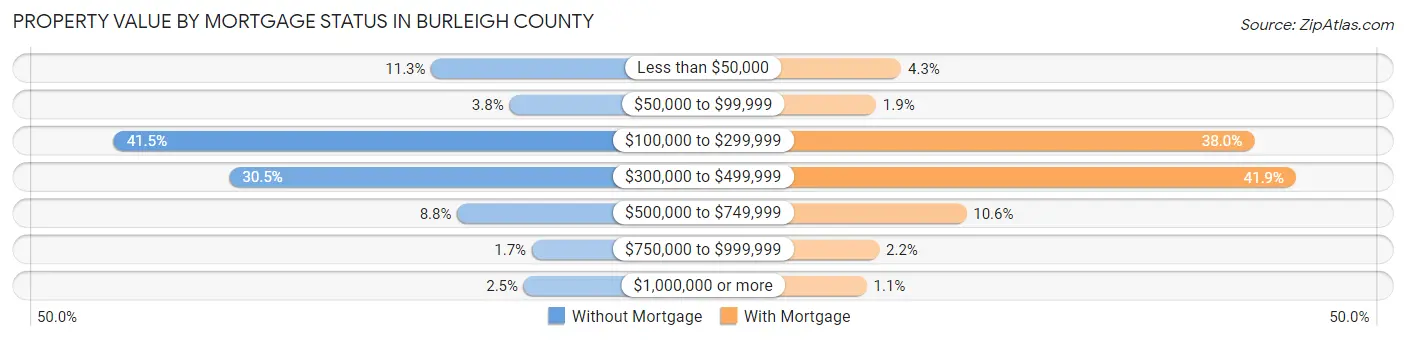
| Property Value | Without Mortgage | With Mortgage |
| Less than $50,000 | 1,362 (11.3%) | 711 (4.3%) |
| $50,000 to $99,999 | 462 (3.8%) | 318 (1.9%) |
| $100,000 to $299,999 | 5,023 (41.5%) | 6,218 (38.0%) |
| $300,000 to $499,999 | 3,690 (30.5%) | 6,871 (41.9%) |
| $500,000 to $749,999 | 1,064 (8.8%) | 1,728 (10.5%) |
| $750,000 to $999,999 | 203 (1.7%) | 367 (2.2%) |
| $1,000,000 or more | 297 (2.5%) | 172 (1.1%) |
| Total | 12,101 (100.0%) | 16,385 (100.0%) |
Household Income by Mortgage Status in Burleigh County
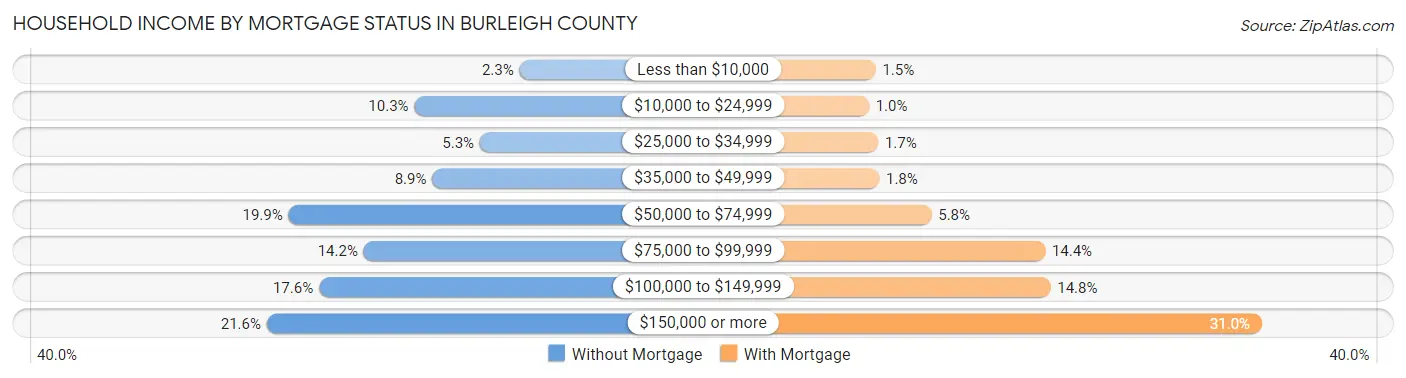
| Household Income | Without Mortgage | With Mortgage |
| Less than $10,000 | 277 (2.3%) | 249 (1.5%) |
| $10,000 to $24,999 | 1,246 (10.3%) | 164 (1.0%) |
| $25,000 to $34,999 | 642 (5.3%) | 281 (1.7%) |
| $35,000 to $49,999 | 1,082 (8.9%) | 294 (1.8%) |
| $50,000 to $74,999 | 2,407 (19.9%) | 945 (5.8%) |
| $75,000 to $99,999 | 1,713 (14.2%) | 2,365 (14.4%) |
| $100,000 to $149,999 | 2,126 (17.6%) | 2,431 (14.8%) |
| $150,000 or more | 2,608 (21.5%) | 5,072 (31.0%) |
| Total | 12,101 (100.0%) | 16,385 (100.0%) |
Property Value to Household Income Ratio in Burleigh County
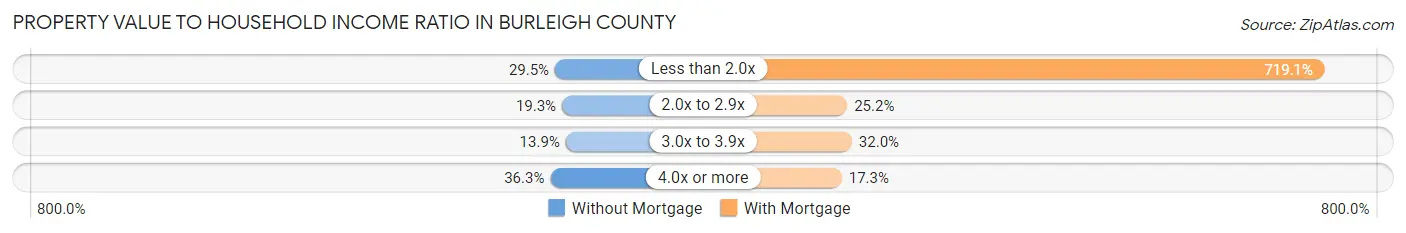
| Value-to-Income Ratio | Without Mortgage | With Mortgage |
| Less than 2.0x | 3,564 (29.4%) | 117,816 (719.1%) |
| 2.0x to 2.9x | 2,336 (19.3%) | 4,122 (25.2%) |
| 3.0x to 3.9x | 1,684 (13.9%) | 5,239 (32.0%) |
| 4.0x or more | 4,398 (36.3%) | 2,832 (17.3%) |
| Total | 12,101 (100.0%) | 16,385 (100.0%) |
Real Estate Taxes by Mortgage Status in Burleigh County
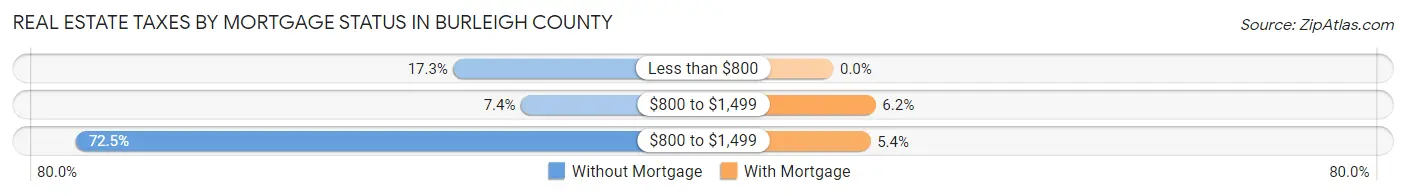
| Property Taxes | Without Mortgage | With Mortgage |
| Less than $800 | 2,093 (17.3%) | 0 (0.0%) |
| $800 to $1,499 | 898 (7.4%) | 1,015 (6.2%) |
| $800 to $1,499 | 8,776 (72.5%) | 889 (5.4%) |
| Total | 12,101 (100.0%) | 16,385 (100.0%) |
Health & Disability in Burleigh County
Health Insurance Coverage by Age in Burleigh County
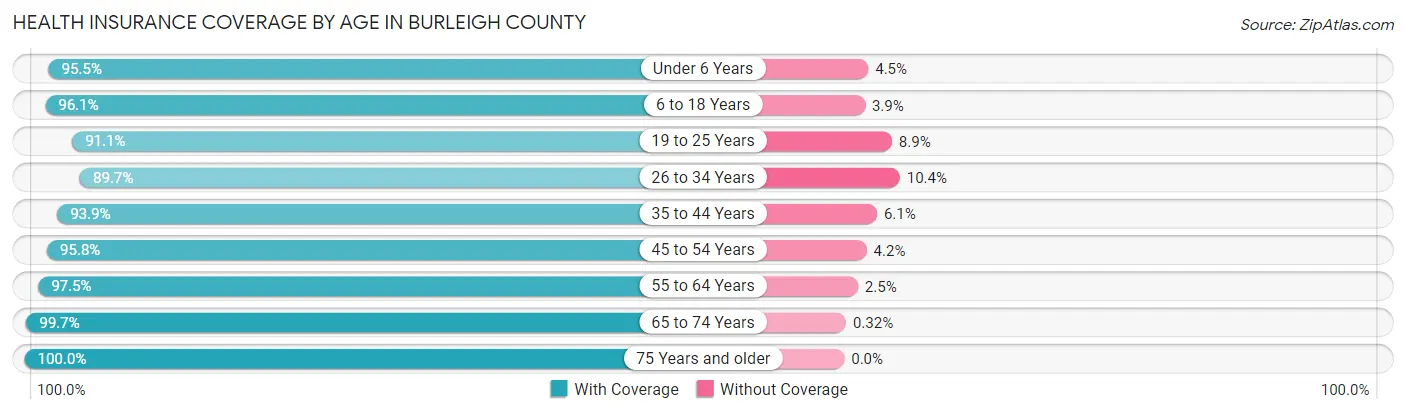
| Age Bracket | With Coverage | Without Coverage |
| Under 6 Years | 7,048 (95.5%) | 330 (4.5%) |
| 6 to 18 Years | 16,148 (96.1%) | 648 (3.9%) |
| 19 to 25 Years | 8,177 (91.1%) | 797 (8.9%) |
| 26 to 34 Years | 10,415 (89.6%) | 1,203 (10.3%) |
| 35 to 44 Years | 12,104 (93.9%) | 785 (6.1%) |
| 45 to 54 Years | 9,979 (95.8%) | 434 (4.2%) |
| 55 to 64 Years | 12,047 (97.5%) | 314 (2.5%) |
| 65 to 74 Years | 9,338 (99.7%) | 30 (0.3%) |
| 75 Years and older | 6,612 (100.0%) | 0 (0.0%) |
| Total | 91,868 (95.3%) | 4,541 (4.7%) |
Health Insurance Coverage by Citizenship Status in Burleigh County
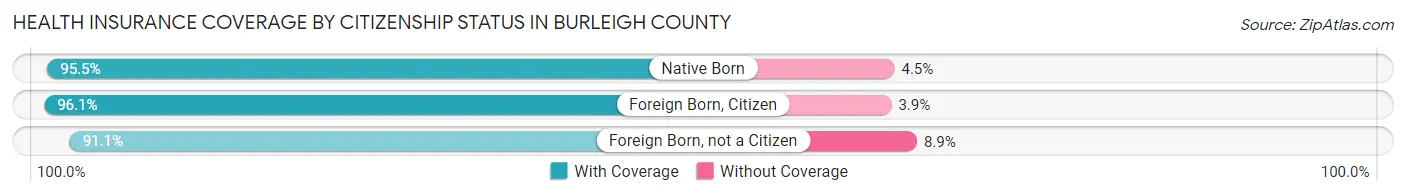
| Citizenship Status | With Coverage | Without Coverage |
| Native Born | 7,048 (95.5%) | 330 (4.5%) |
| Foreign Born, Citizen | 16,148 (96.1%) | 648 (3.9%) |
| Foreign Born, not a Citizen | 8,177 (91.1%) | 797 (8.9%) |
Health Insurance Coverage by Household Income in Burleigh County
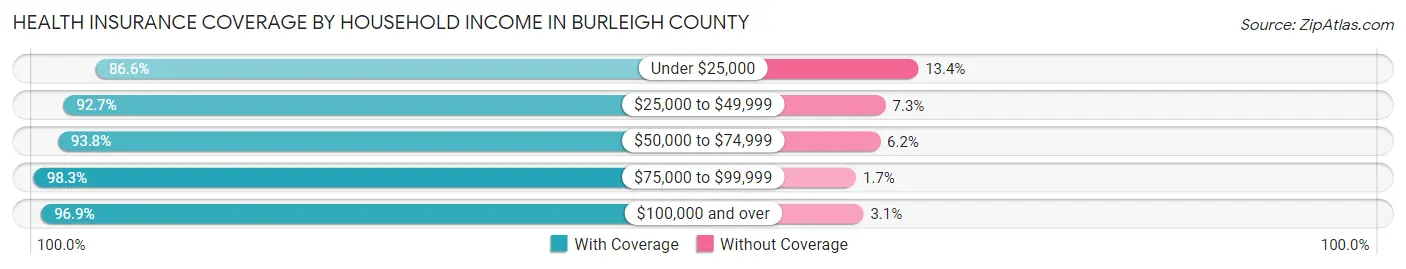
| Household Income | With Coverage | Without Coverage |
| Under $25,000 | 5,918 (86.6%) | 914 (13.4%) |
| $25,000 to $49,999 | 9,710 (92.7%) | 761 (7.3%) |
| $50,000 to $74,999 | 13,245 (93.8%) | 882 (6.2%) |
| $75,000 to $99,999 | 12,509 (98.3%) | 221 (1.7%) |
| $100,000 and over | 48,938 (96.9%) | 1,574 (3.1%) |
Public vs Private Health Insurance Coverage by Age in Burleigh County
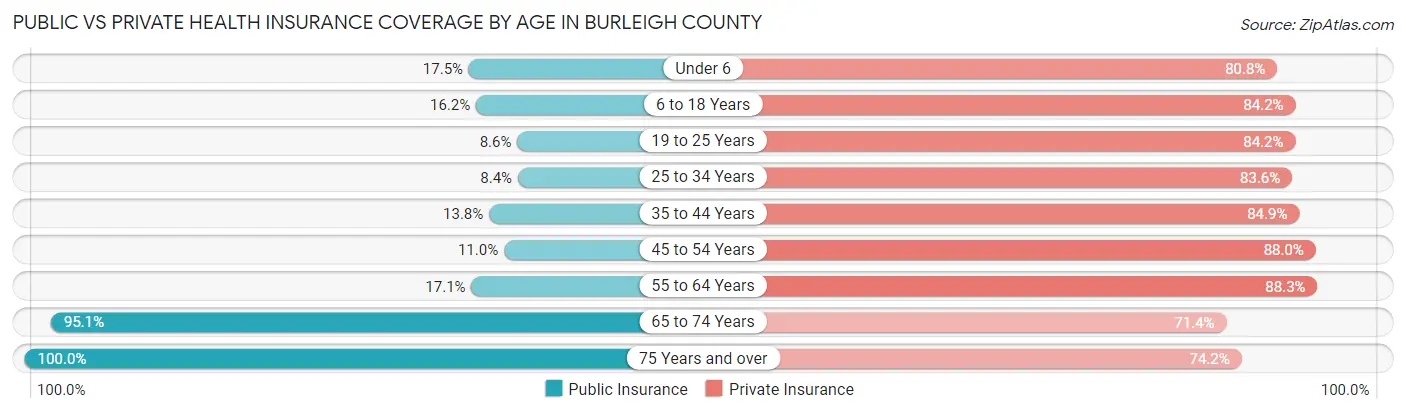
| Age Bracket | Public Insurance | Private Insurance |
| Under 6 | 1,293 (17.5%) | 5,962 (80.8%) |
| 6 to 18 Years | 2,720 (16.2%) | 14,142 (84.2%) |
| 19 to 25 Years | 767 (8.6%) | 7,554 (84.2%) |
| 25 to 34 Years | 979 (8.4%) | 9,710 (83.6%) |
| 35 to 44 Years | 1,776 (13.8%) | 10,943 (84.9%) |
| 45 to 54 Years | 1,148 (11.0%) | 9,159 (88.0%) |
| 55 to 64 Years | 2,110 (17.1%) | 10,911 (88.3%) |
| 65 to 74 Years | 8,912 (95.1%) | 6,687 (71.4%) |
| 75 Years and over | 6,612 (100.0%) | 4,906 (74.2%) |
| Total | 26,317 (27.3%) | 79,974 (83.0%) |
Disability Status by Sex by Age in Burleigh County
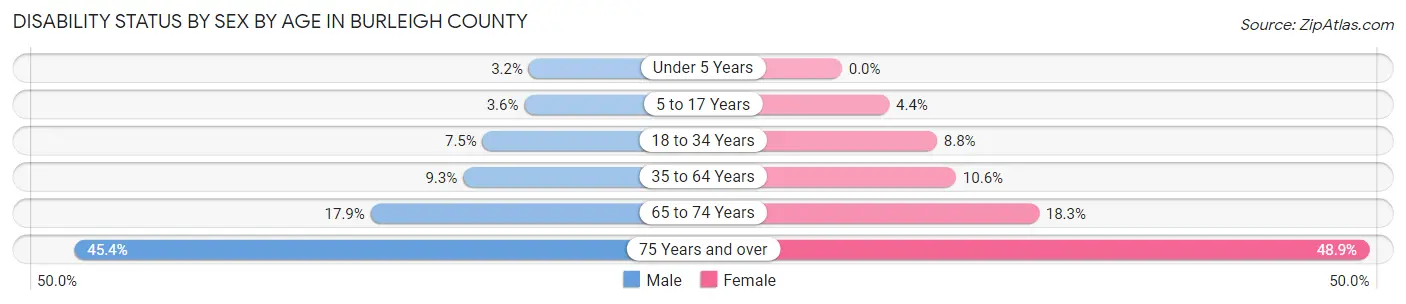
| Age Bracket | Male | Female |
| Under 5 Years | 103 (3.2%) | 0 (0.0%) |
| 5 to 17 Years | 311 (3.6%) | 357 (4.4%) |
| 18 to 34 Years | 847 (7.5%) | 934 (8.8%) |
| 35 to 64 Years | 1,677 (9.3%) | 1,870 (10.6%) |
| 65 to 74 Years | 807 (17.9%) | 888 (18.3%) |
| 75 Years and over | 1,238 (45.4%) | 1,900 (48.9%) |
Disability Class by Sex by Age in Burleigh County
Disability Class: Hearing Difficulty
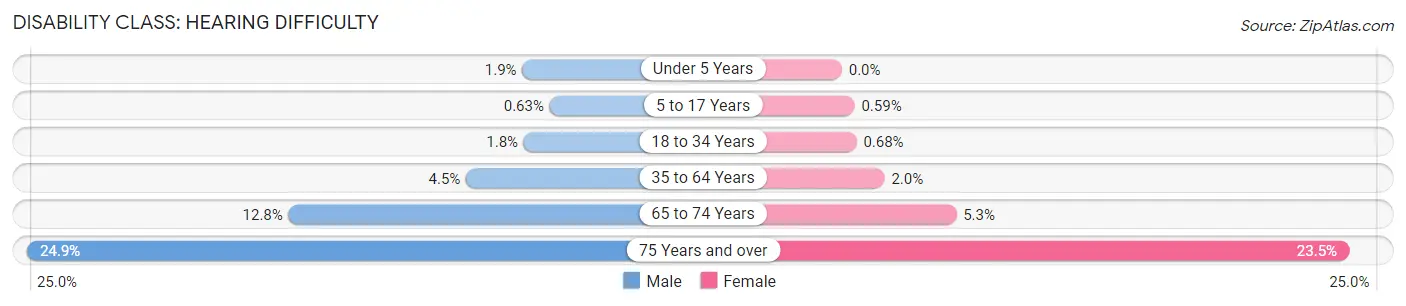
| Age Bracket | Male | Female |
| Under 5 Years | 61 (1.9%) | 0 (0.0%) |
| 5 to 17 Years | 54 (0.6%) | 48 (0.6%) |
| 18 to 34 Years | 207 (1.8%) | 72 (0.7%) |
| 35 to 64 Years | 813 (4.5%) | 349 (2.0%) |
| 65 to 74 Years | 575 (12.8%) | 258 (5.3%) |
| 75 Years and over | 679 (24.9%) | 914 (23.5%) |
Disability Class: Vision Difficulty
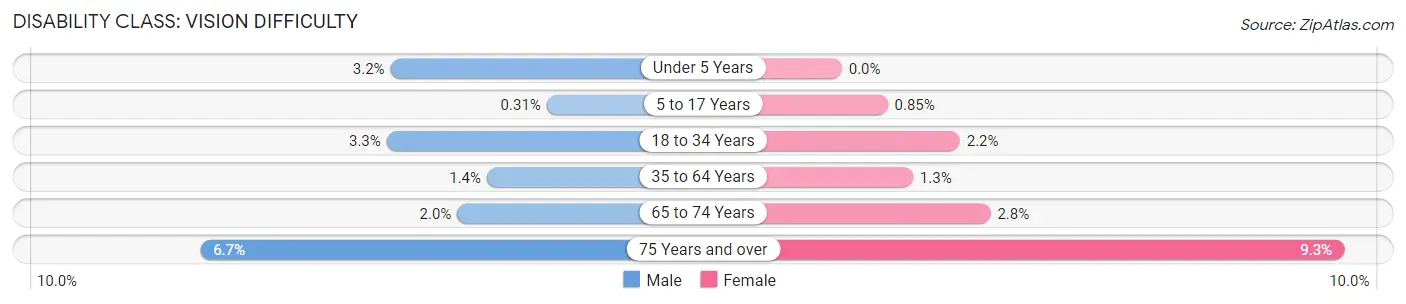
| Age Bracket | Male | Female |
| Under 5 Years | 103 (3.2%) | 0 (0.0%) |
| 5 to 17 Years | 27 (0.3%) | 69 (0.9%) |
| 18 to 34 Years | 371 (3.3%) | 232 (2.2%) |
| 35 to 64 Years | 256 (1.4%) | 233 (1.3%) |
| 65 to 74 Years | 89 (2.0%) | 134 (2.8%) |
| 75 Years and over | 184 (6.7%) | 362 (9.3%) |
Disability Class: Cognitive Difficulty
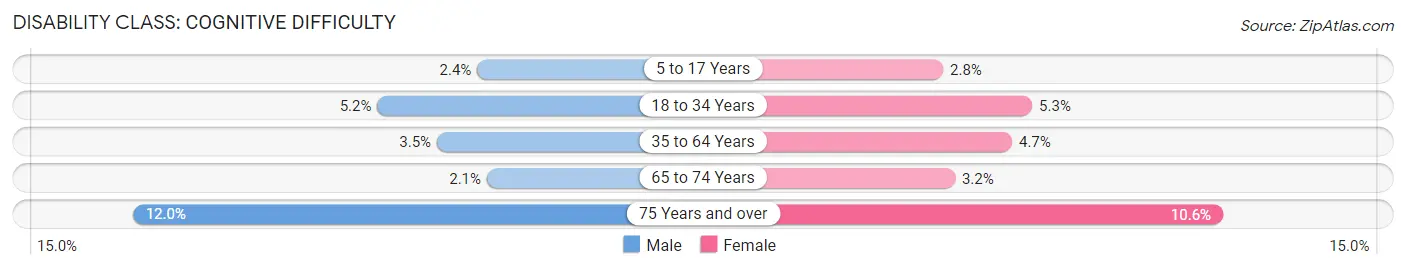
| Age Bracket | Male | Female |
| 5 to 17 Years | 206 (2.4%) | 229 (2.8%) |
| 18 to 34 Years | 586 (5.2%) | 561 (5.3%) |
| 35 to 64 Years | 634 (3.5%) | 836 (4.7%) |
| 65 to 74 Years | 96 (2.1%) | 153 (3.2%) |
| 75 Years and over | 327 (12.0%) | 412 (10.6%) |
Disability Class: Ambulatory Difficulty
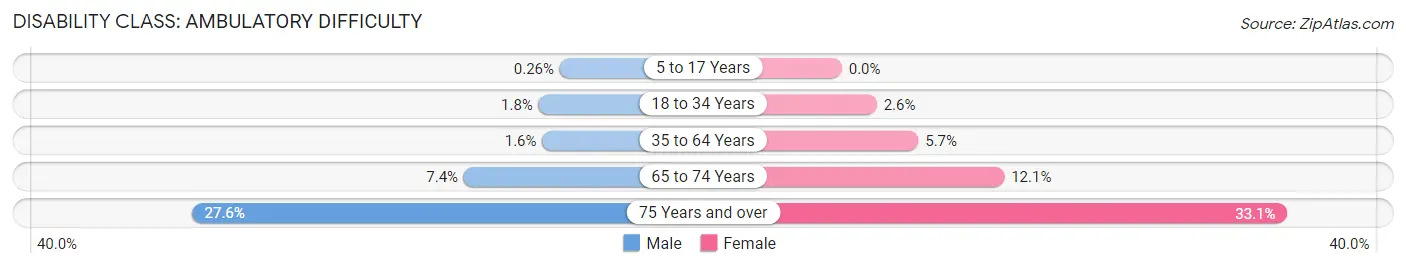
| Age Bracket | Male | Female |
| 5 to 17 Years | 22 (0.3%) | 0 (0.0%) |
| 18 to 34 Years | 207 (1.8%) | 274 (2.6%) |
| 35 to 64 Years | 281 (1.6%) | 1,003 (5.7%) |
| 65 to 74 Years | 333 (7.4%) | 586 (12.1%) |
| 75 Years and over | 753 (27.6%) | 1,285 (33.1%) |
Disability Class: Self-Care Difficulty
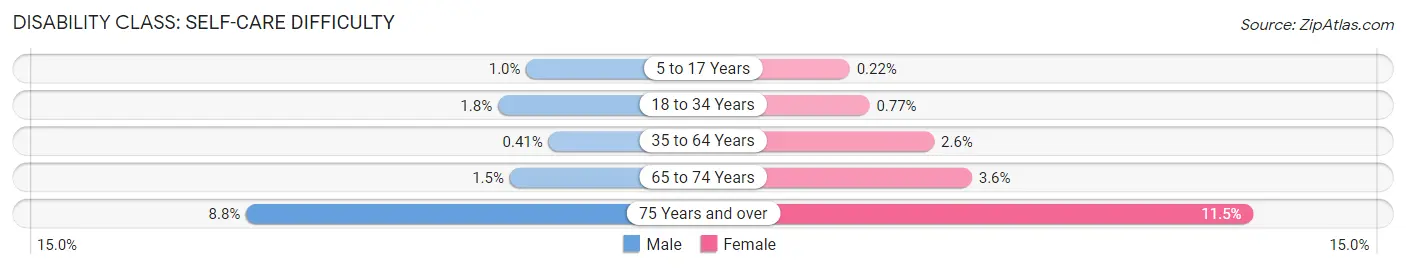
| Age Bracket | Male | Female |
| 5 to 17 Years | 88 (1.0%) | 18 (0.2%) |
| 18 to 34 Years | 206 (1.8%) | 81 (0.8%) |
| 35 to 64 Years | 73 (0.4%) | 453 (2.6%) |
| 65 to 74 Years | 67 (1.5%) | 176 (3.6%) |
| 75 Years and over | 241 (8.8%) | 445 (11.5%) |
Technology Access in Burleigh County
Computing Device Access in Burleigh County
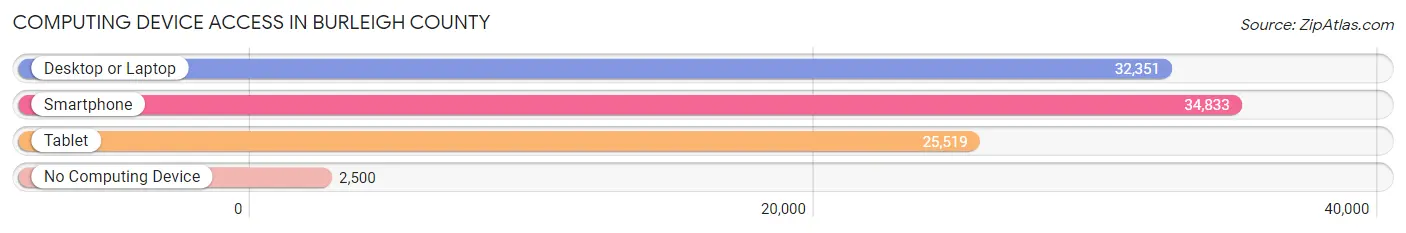
| Device Type | # Households | % Households |
| Desktop or Laptop | 32,351 | 81.1% |
| Smartphone | 34,833 | 87.3% |
| Tablet | 25,519 | 64.0% |
| No Computing Device | 2,500 | 6.3% |
| Total | 39,885 | 100.0% |
Internet Access in Burleigh County
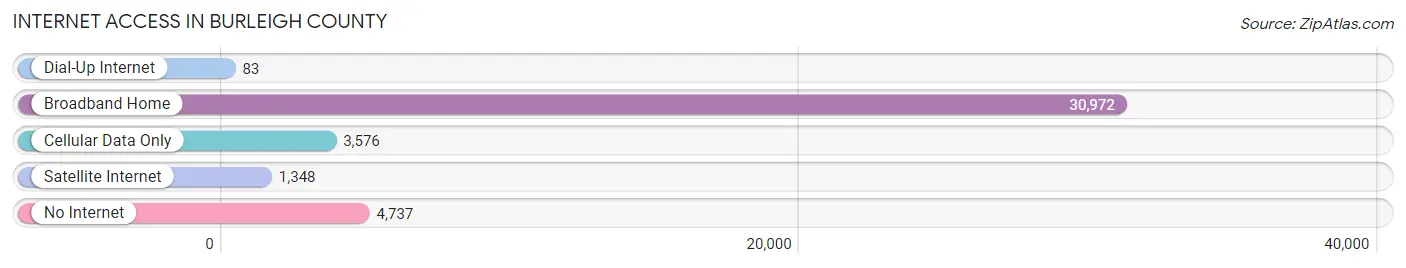
| Internet Type | # Households | % Households |
| Dial-Up Internet | 83 | 0.2% |
| Broadband Home | 30,972 | 77.6% |
| Cellular Data Only | 3,576 | 9.0% |
| Satellite Internet | 1,348 | 3.4% |
| No Internet | 4,737 | 11.9% |
| Total | 39,885 | 100.0% |
Burleigh County Summary
Burleigh County is located in the U.S. state of North Dakota. It is the second most populous county in the state, with a population of approximately 90,000 people as of the 2020 census. The county seat is Bismarck, the state capital. Burleigh County is part of the Bismarck, ND Metropolitan Statistical Area.
History
Burleigh County was established in 1873, when the Dakota Territory was divided into counties. It was named after James Burleigh, a prominent early settler in the area. The county was originally much larger than it is today, encompassing much of what is now Morton County. In 1883, Morton County was created from the western portion of Burleigh County.
The county was largely rural until the early 20th century, when the city of Bismarck began to grow rapidly. The city became the county seat in 1911, and has since become the largest city in the state.
Geography
Burleigh County is located in the central part of North Dakota, in the heart of the Great Plains. It is bordered by Morton County to the west, Emmons County to the south, and McLean County to the east. The county is mostly flat, with rolling hills in the western part. The Missouri River forms the northern border of the county.
The county has a total area of 1,845 square miles, of which 1,837 square miles is land and 8 square miles is water. The county is home to several lakes, including Lake Tschida, Lake Audubon, and Lake Sakakawea.
Economy
Burleigh County has a diverse economy, with a mix of agriculture, manufacturing, and services. The county is home to several large employers, including Sanford Health, MDU Resources, and the state government.
Agriculture is an important part of the county's economy. The county is home to several large farms, and is a major producer of wheat, corn, and soybeans.
Manufacturing is also an important part of the county's economy. The county is home to several large factories, including a John Deere plant and a Tyson Foods plant.
Demographics
As of the 2020 census, Burleigh County had a population of 90,000 people. The racial makeup of the county was 90.2% White, 4.2% Native American, 2.2% Asian, 1.2% Black, and 2.2% from other races. The median household income was $60,000, and the median home value was $200,000.
The county is home to several large cities, including Bismarck, the state capital, and Mandan, the county seat. The county also has several smaller towns, including Lincoln, Baldwin, and Sterling.
Conclusion
Burleigh County is a large and diverse county in North Dakota. It is home to several large cities, including Bismarck and Mandan, and is a major producer of wheat, corn, and soybeans. The county has a diverse economy, with a mix of agriculture, manufacturing, and services. The county has a population of 90,000 people, and the median household income is $60,000.
Common Questions
What is the Total Population of Burleigh County?
Total Population of Burleigh County is 98,443.
What is the Total Male Population of Burleigh County?
Total Male Population of Burleigh County is 49,666.
What is the Total Female Population of Burleigh County?
Total Female Population of Burleigh County is 48,777.
What is the Ratio of Males per 100 Females in Burleigh County?
There are 101.82 Males per 100 Females in Burleigh County.
What is the Ratio of Females per 100 Males in Burleigh County?
There are 98.21 Females per 100 Males in Burleigh County.
What is the Median Population Age in Burleigh County?
Median Population Age in Burleigh County is 37.7 Years.
What is the Average Family Size in Burleigh County
Average Family Size in Burleigh County is 3.0 People.
What is the Average Household Size in Burleigh County
Average Household Size in Burleigh County is 2.4 People.
What is Per Capita Income in Burleigh County?
Per Capita income in Burleigh County is $43,615.
What is the Median Family Income in Burleigh County?
Median Family Income in Burleigh County is $108,272.
What is the Median Household income in Burleigh County?
Median Household Income in Burleigh County is $82,141.
What is Income or Wage Gap in Burleigh County?
Income or Wage Gap in Burleigh County is 22.0%.
Women in Burleigh County earn 78.0 cents for every dollar earned by a man.
What is Family Income Deficit in Burleigh County?
Family Income Deficit in Burleigh County is $10,588.
Families that are below poverty line in Burleigh County earn $10,588 less on average than the poverty threshold level.
What is Inequality or Gini Index in Burleigh County?
Inequality or Gini Index in Burleigh County is 0.43.
How Large is the Labor Force in Burleigh County?
There are 52,526 People in the Labor Forcein in Burleigh County.
What is the Percentage of People in the Labor Force in Burleigh County?
67.1% of People are in the Labor Force in Burleigh County.
What is the Unemployment Rate in Burleigh County?
Unemployment Rate in Burleigh County is 2.7%.