Burke County, ND
Burke County Map
Burke County Overview
2,184
TOTAL POPULATION
1,146
MALE POPULATION
1,038
FEMALE POPULATION
110.40
MALES / 100 FEMALES
90.58
FEMALES / 100 MALES
44.8
MEDIAN AGE
3.0
AVG FAMILY SIZE
2.3
AVG HOUSEHOLD SIZE
$50,714
PER CAPITA INCOME
$111,552
AVG FAMILY INCOME
$94,583
AVG HOUSEHOLD INCOME
31.7%
WAGE / INCOME GAP [ % ]
68.3¢/ $1
WAGE / INCOME GAP [ $ ]
0.43
INEQUALITY / GINI INDEX
1,077
LABOR FORCE [ PEOPLE ]
63.8%
PERCENT IN LABOR FORCE
2.0%
UNEMPLOYMENT RATE
Burke County Area Codes
Race in Burke County
The most populous races in Burke County are White / Caucasian (2,031 | 93.0%), Asian (56 | 2.6%), and Two or more Races (52 | 2.4%).

| Race | # Population | % Population |
| Asian | 56 | 2.6% |
| Black / African American | 15 | 0.7% |
| Hawaiian / Pacific | 0 | 0.0% |
| Hispanic or Latino | 23 | 1.1% |
| Native / Alaskan | 12 | 0.5% |
| White / Caucasian | 2,031 | 93.0% |
| Two or more Races | 52 | 2.4% |
| Some other Race | 18 | 0.8% |
| Total | 2,184 | 100.0% |
Ancestry in Burke County
The most populous ancestries reported in Burke County are Norwegian (808 | 37.0%), German (482 | 22.1%), Irish (182 | 8.3%), Swedish (175 | 8.0%), and English (145 | 6.6%), together accounting for 82.1% of all Burke County residents.

| Ancestry | # Population | % Population |
| Alaska Native | 6 | 0.3% |
| American | 52 | 2.4% |
| Austrian | 1 | 0.1% |
| Bangladeshi | 13 | 0.6% |
| Belgian | 2 | 0.1% |
| Bhutanese | 2 | 0.1% |
| British | 6 | 0.3% |
| Canadian | 2 | 0.1% |
| Central American | 13 | 0.6% |
| Cherokee | 6 | 0.3% |
| Chinese | 4 | 0.2% |
| Chippewa | 6 | 0.3% |
| Czech | 22 | 1.0% |
| Danish | 114 | 5.2% |
| Dutch | 12 | 0.5% |
| Eastern European | 3 | 0.1% |
| English | 145 | 6.6% |
| European | 4 | 0.2% |
| Finnish | 17 | 0.8% |
| French | 36 | 1.7% |
| French Canadian | 13 | 0.6% |
| German | 482 | 22.1% |
| Honduran | 13 | 0.6% |
| Hungarian | 6 | 0.3% |
| Irish | 182 | 8.3% |
| Italian | 27 | 1.2% |
| Korean | 19 | 0.9% |
| Luxembourger | 5 | 0.2% |
| Malaysian | 14 | 0.6% |
| Menominee | 6 | 0.3% |
| Mexican | 5 | 0.2% |
| Nigerian | 14 | 0.6% |
| Norwegian | 808 | 37.0% |
| Polish | 26 | 1.2% |
| Portuguese | 1 | 0.1% |
| Russian | 10 | 0.5% |
| Scandinavian | 19 | 0.9% |
| Scotch-Irish | 9 | 0.4% |
| Scottish | 18 | 0.8% |
| Sioux | 6 | 0.3% |
| Slovak | 1 | 0.1% |
| Sri Lankan | 18 | 0.8% |
| Subsaharan African | 14 | 0.6% |
| Swedish | 175 | 8.0% |
| Swiss | 3 | 0.1% |
| Ukrainian | 2 | 0.1% |
| Welsh | 5 | 0.2% | View All 47 Rows |
Immigrants in Burke County
The most numerous immigrant groups reported in Burke County came from Asia (35 | 1.6%), Canada (35 | 1.6%), South Eastern Asia (29 | 1.3%), Latin America (20 | 0.9%), and Philippines (19 | 0.9%), together accounting for 6.3% of all Burke County residents.

| Immigration Origin | # Population | % Population |
| Asia | 35 | 1.6% |
| Canada | 35 | 1.6% |
| Central America | 15 | 0.7% |
| Eastern Asia | 6 | 0.3% |
| Honduras | 15 | 0.7% |
| Japan | 6 | 0.3% |
| Latin America | 20 | 0.9% |
| Philippines | 19 | 0.9% |
| South America | 5 | 0.2% |
| South Eastern Asia | 29 | 1.3% |
| Vietnam | 10 | 0.5% | View All 11 Rows |
Sex and Age in Burke County
Sex and Age in Burke County
The most populous age groups in Burke County are 10 to 14 Years (145 | 12.7%) for men and 60 to 64 Years (130 | 12.5%) for women.

| Age Bracket | Male | Female |
| Under 5 Years | 90 (7.9%) | 33 (3.2%) |
| 5 to 9 Years | 36 (3.1%) | 89 (8.6%) |
| 10 to 14 Years | 145 (12.7%) | 58 (5.6%) |
| 15 to 19 Years | 84 (7.3%) | 42 (4.1%) |
| 20 to 24 Years | 38 (3.3%) | 24 (2.3%) |
| 25 to 29 Years | 63 (5.5%) | 50 (4.8%) |
| 30 to 34 Years | 60 (5.2%) | 66 (6.4%) |
| 35 to 39 Years | 44 (3.8%) | 66 (6.4%) |
| 40 to 44 Years | 64 (5.6%) | 43 (4.1%) |
| 45 to 49 Years | 44 (3.8%) | 64 (6.2%) |
| 50 to 54 Years | 77 (6.7%) | 64 (6.2%) |
| 55 to 59 Years | 88 (7.7%) | 43 (4.1%) |
| 60 to 64 Years | 112 (9.8%) | 130 (12.5%) |
| 65 to 69 Years | 60 (5.2%) | 90 (8.7%) |
| 70 to 74 Years | 60 (5.2%) | 70 (6.7%) |
| 75 to 79 Years | 44 (3.8%) | 38 (3.7%) |
| 80 to 84 Years | 19 (1.7%) | 30 (2.9%) |
| 85 Years and over | 18 (1.6%) | 38 (3.7%) |
| Total | 1,146 (100.0%) | 1,038 (100.0%) |
Families and Households in Burke County
Median Family Size in Burke County
The median family size in Burke County is 2.96 persons per family, with single female/mother families (35 | 5.8%) accounting for the largest median family size of 3.6 persons per family. On the other hand, single male/father families (17 | 2.8%) represent the smallest median family size with 2.82 persons per family.

| Family Type | # Families | Family Size |
| Married-Couple | 550 (91.4%) | 2.92 |
| Single Male/Father | 17 (2.8%) | 2.82 |
| Single Female/Mother | 35 (5.8%) | 3.60 |
| Total Families | 602 (100.0%) | 2.96 |
Median Household Size in Burke County
The median household size in Burke County is 2.29 persons per household, with single female/mother households (35 | 3.7%) accounting for the largest median household size of 3.86 persons per household. non-family households (348 | 36.6%) represent the smallest median household size with 1.07 persons per household.

| Household Type | # Households | Household Size |
| Married-Couple | 550 (57.9%) | 2.94 |
| Single Male/Father | 17 (1.8%) | 3.35 |
| Single Female/Mother | 35 (3.7%) | 3.86 |
| Non-family | 348 (36.6%) | 1.07 |
| Total Households | 950 (100.0%) | 2.29 |
Household Size by Marriage Status in Burke County
Out of a total of 950 households in Burke County, 602 (63.4%) are family households, while 348 (36.6%) are nonfamily households. The most numerous type of family households are 2-person households, comprising 377, and the most common type of nonfamily households are 1-person households, comprising 327.

| Household Size | Family Households | Nonfamily Households |
| 1-Person Households | - | 327 (34.4%) |
| 2-Person Households | 377 (39.7%) | 21 (2.2%) |
| 3-Person Households | 76 (8.0%) | 0 (0.0%) |
| 4-Person Households | 84 (8.8%) | 0 (0.0%) |
| 5-Person Households | 32 (3.4%) | 0 (0.0%) |
| 6-Person Households | 33 (3.5%) | 0 (0.0%) |
| 7+ Person Households | 0 (0.0%) | 0 (0.0%) |
| Total | 602 (63.4%) | 348 (36.6%) |
Female Fertility in Burke County
Fertility by Age in Burke County
Average fertility rate in Burke County is 80.0 births per 1,000 women. Women in the age bracket of 20 to 34 years have the highest fertility rate with 200.0 births per 1,000 women. Women in the age bracket of 20 to 34 years acount for 96.6% of all women with births.

| Age Bracket | Women with Births | Births / 1,000 Women |
| 15 to 19 years | 0 (0.0%) | 0.0 |
| 20 to 34 years | 28 (96.6%) | 200.0 |
| 35 to 50 years | 1 (3.5%) | 6.0 |
| Total | 29 (100.0%) | 80.0 |
Fertility by Age by Marriage Status in Burke County
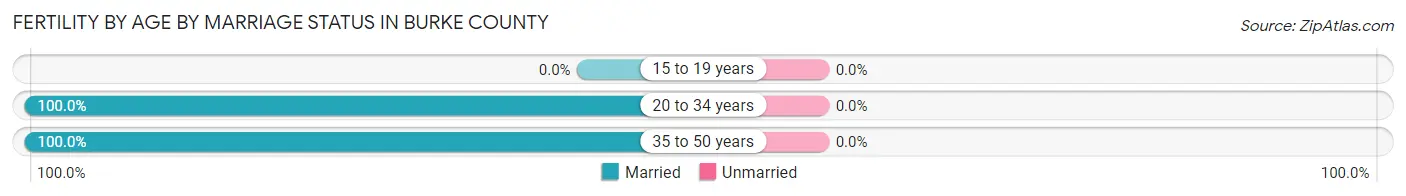
| Age Bracket | Married | Unmarried |
| 15 to 19 years | 0 (0.0%) | 0 (0.0%) |
| 20 to 34 years | 28 (100.0%) | 0 (0.0%) |
| 35 to 50 years | 1 (100.0%) | 0 (0.0%) |
| Total | 29 (100.0%) | 0 (0.0%) |
Fertility by Education in Burke County

| Educational Attainment | Women with Births | Births / 1,000 Women |
| Less than High School | 0 (0.0%) | 0.0 |
| High School Diploma | 10 (34.5%) | 141.0 |
| College or Associate's Degree | 2 (6.9%) | 22.0 |
| Bachelor's Degree | 16 (55.2%) | 136.0 |
| Graduate Degree | 1 (3.5%) | 59.0 |
| Total | 29 (100.0%) | 80.0 |
Fertility by Education by Marriage Status in Burke County

| Educational Attainment | Married | Unmarried |
| Less than High School | 0 (0.0%) | 0 (0.0%) |
| High School Diploma | 10 (100.0%) | 0 (0.0%) |
| College or Associate's Degree | 2 (100.0%) | 0 (0.0%) |
| Bachelor's Degree | 16 (100.0%) | 0 (0.0%) |
| Graduate Degree | 1 (100.0%) | 0 (0.0%) |
| Total | 29 (100.0%) | 0 (0.0%) |
Income in Burke County
Income Overview in Burke County
Per Capita Income in Burke County is $50,714, while median incomes of families and households are $111,552 and $94,583 respectively.
| Characteristic | Number | Measure |
| Per Capita Income | 2,184 | $50,714 |
| Median Family Income | 602 | $111,552 |
| Mean Family Income | 602 | $141,115 |
| Median Household Income | 950 | $94,583 |
| Mean Household Income | 950 | $119,789 |
| Income Deficit | 602 | $0 |
| Wage / Income Gap (%) | 2,184 | 31.74% |
| Wage / Income Gap ($) | 2,184 | 68.26¢ per $1 |
| Gini / Inequality Index | 2,184 | 0.43 |
Earnings by Sex in Burke County
Average Earnings in Burke County are $54,125, $67,684 for men and $46,204 for women, a difference of 31.7%.

| Sex | Number | Average Earnings |
| Male | 647 (54.6%) | $67,684 |
| Female | 538 (45.4%) | $46,204 |
| Total | 1,185 (100.0%) | $54,125 |
Earnings by Sex by Income Bracket in Burke County
The most common earnings brackets in Burke County are $100,000+ for men (196 | 30.3%) and $75,000 to $99,999 for women (71 | 13.2%).
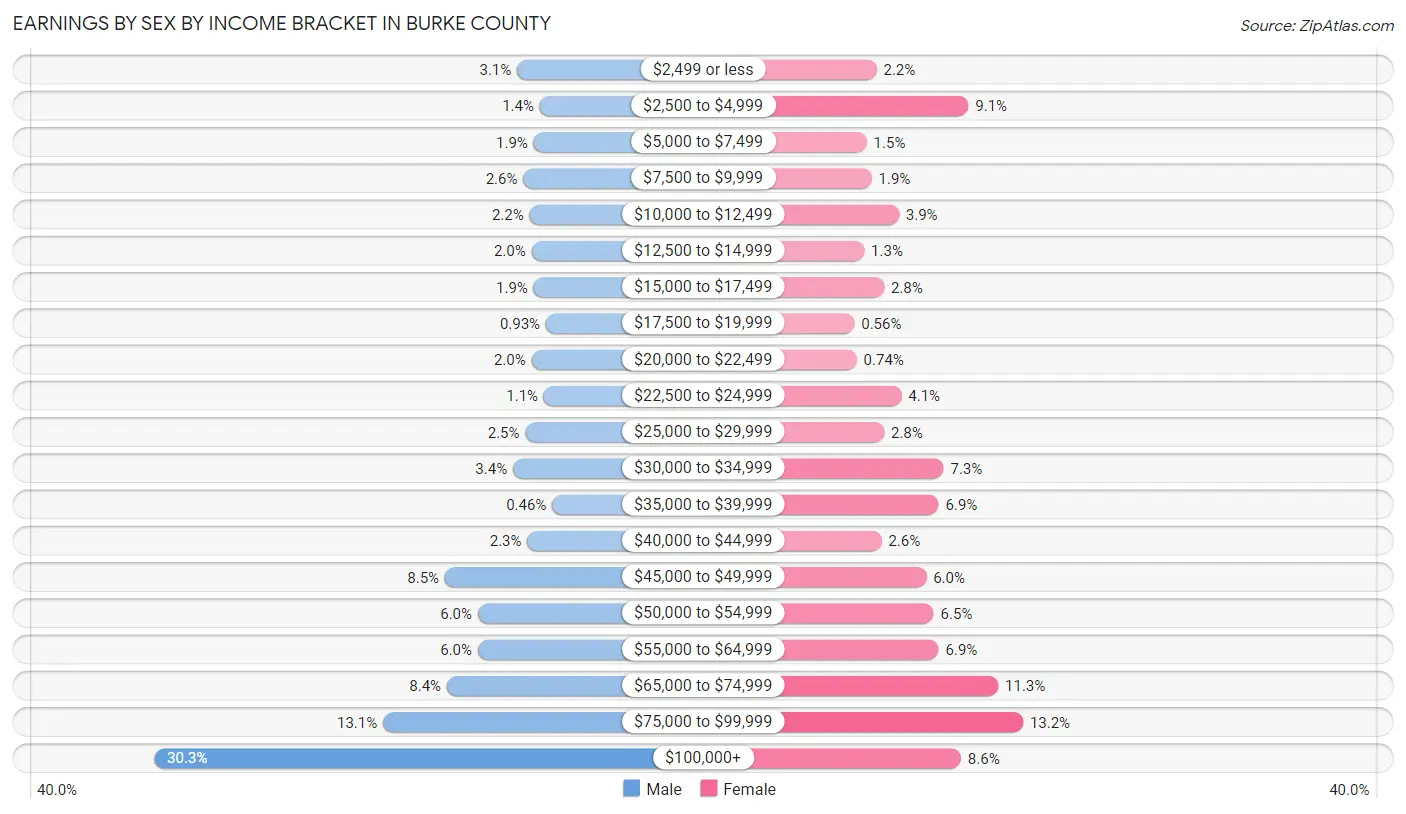
| Income | Male | Female |
| $2,499 or less | 20 (3.1%) | 12 (2.2%) |
| $2,500 to $4,999 | 9 (1.4%) | 49 (9.1%) |
| $5,000 to $7,499 | 12 (1.8%) | 8 (1.5%) |
| $7,500 to $9,999 | 17 (2.6%) | 10 (1.9%) |
| $10,000 to $12,499 | 14 (2.2%) | 21 (3.9%) |
| $12,500 to $14,999 | 13 (2.0%) | 7 (1.3%) |
| $15,000 to $17,499 | 12 (1.8%) | 15 (2.8%) |
| $17,500 to $19,999 | 6 (0.9%) | 3 (0.6%) |
| $20,000 to $22,499 | 13 (2.0%) | 4 (0.7%) |
| $22,500 to $24,999 | 7 (1.1%) | 22 (4.1%) |
| $25,000 to $29,999 | 16 (2.5%) | 15 (2.8%) |
| $30,000 to $34,999 | 22 (3.4%) | 39 (7.2%) |
| $35,000 to $39,999 | 3 (0.5%) | 37 (6.9%) |
| $40,000 to $44,999 | 15 (2.3%) | 14 (2.6%) |
| $45,000 to $49,999 | 55 (8.5%) | 32 (5.9%) |
| $50,000 to $54,999 | 39 (6.0%) | 35 (6.5%) |
| $55,000 to $64,999 | 39 (6.0%) | 37 (6.9%) |
| $65,000 to $74,999 | 54 (8.4%) | 61 (11.3%) |
| $75,000 to $99,999 | 85 (13.1%) | 71 (13.2%) |
| $100,000+ | 196 (30.3%) | 46 (8.6%) |
| Total | 647 (100.0%) | 538 (100.0%) |
Earnings by Sex by Educational Attainment in Burke County
Average earnings in Burke County are $68,603 for men and $49,250 for women, a difference of 28.2%. Men with an educational attainment of bachelor's degree enjoy the highest average annual earnings of $87,083, while those with graduate degree education earn the least with $52,083. Women with an educational attainment of less than high school earn the most with the average annual earnings of $80,313, while those with high school diploma education have the smallest earnings of $32,500.

| Educational Attainment | Male Income | Female Income |
| Less than High School | $78,750 | $80,313 |
| High School Diploma | $70,313 | $32,500 |
| College or Associate's Degree | $68,125 | $55,750 |
| Bachelor's Degree | $87,083 | $56,750 |
| Graduate Degree | $52,083 | $51,500 |
| Total | $68,603 | $49,250 |
Family Income in Burke County
Family Income Brackets in Burke County
According to the Burke County family income data, there are 163 families falling into the $100,000 to $149,999 income range, which is the most common income bracket and makes up 27.1% of all families.

| Income Bracket | # Families | % Families |
| Less than $10,000 | 0 | 0.0% |
| $10,000 to $14,999 | 1 | 0.2% |
| $15,000 to $24,999 | 16 | 2.7% |
| $25,000 to $34,999 | 25 | 4.2% |
| $35,000 to $49,999 | 39 | 6.5% |
| $50,000 to $74,999 | 64 | 10.6% |
| $75,000 to $99,999 | 97 | 16.1% |
| $100,000 to $149,999 | 163 | 27.1% |
| $150,000 to $199,999 | 70 | 11.6% |
| $200,000+ | 127 | 21.1% |
Family Income by Famaliy Size in Burke County
6-person families (30 | 5.0%) account for the highest median family income in Burke County with $148,750 per family, while 2-person families (384 | 63.8%) have the highest median income of $55,000 per family member.

| Income Bracket | # Families | Median Income |
| 2-Person Families | 384 (63.8%) | $110,000 |
| 3-Person Families | 73 (12.1%) | $120,938 |
| 4-Person Families | 84 (14.0%) | $132,500 |
| 5-Person Families | 31 (5.1%) | $83,125 |
| 6-Person Families | 30 (5.0%) | $148,750 |
| 7+ Person Families | 0 (0.0%) | $0 |
| Total | 602 (100.0%) | $111,552 |
Family Income by Number of Earners in Burke County
The median family income in Burke County is $111,552, with families comprising 3+ earners (36) having the highest median family income of $150,556, while families with no earners (59) have the lowest median family income of $67,083, accounting for 6.0% and 9.8% of families, respectively.

| Number of Earners | # Families | Median Income |
| No Earners | 59 (9.8%) | $67,083 |
| 1 Earner | 200 (33.2%) | $96,250 |
| 2 Earners | 307 (51.0%) | $142,083 |
| 3+ Earners | 36 (6.0%) | $150,556 |
| Total | 602 (100.0%) | $111,552 |
Household Income in Burke County
Household Income Brackets in Burke County
With 214 households falling in the category, the $100,000 to $149,999 income range is the most frequent in Burke County, accounting for 22.5% of all households. In contrast, only 18 households (1.9%) fall into the $10,000 to $14,999 income bracket, making it the least populous group.
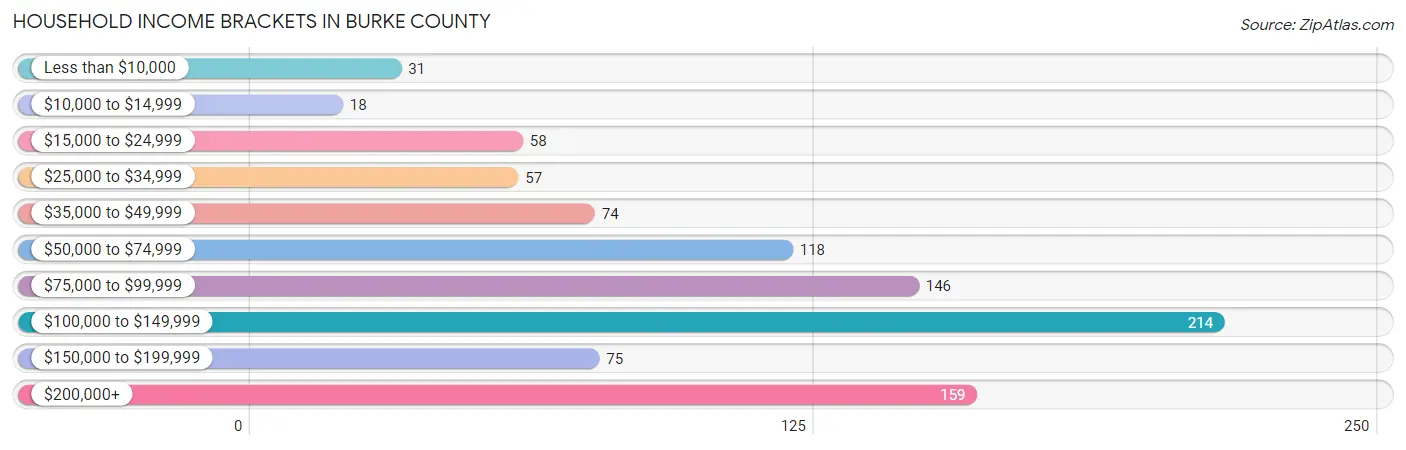
| Income Bracket | # Households | % Households |
| Less than $10,000 | 31 | 3.3% |
| $10,000 to $14,999 | 18 | 1.9% |
| $15,000 to $24,999 | 58 | 6.1% |
| $25,000 to $34,999 | 57 | 6.0% |
| $35,000 to $49,999 | 74 | 7.8% |
| $50,000 to $74,999 | 118 | 12.4% |
| $75,000 to $99,999 | 146 | 15.4% |
| $100,000 to $149,999 | 214 | 22.5% |
| $150,000 to $199,999 | 75 | 7.9% |
| $200,000+ | 159 | 16.7% |
Household Income by Householder Age in Burke County
The median household income in Burke County is $94,583, with the highest median household income of $118,438 found in the 45 to 64 years age bracket for the primary householder. A total of 379 households (39.9%) fall into this category. Meanwhile, the 65+ years age bracket for the primary householder has the lowest median household income of $71,985, with 313 households (33.0%) in this group.

| Income Bracket | # Households | Median Income |
| 15 to 24 Years | 21 (2.2%) | $82,813 |
| 25 to 44 Years | 237 (24.9%) | $95,972 |
| 45 to 64 Years | 379 (39.9%) | $118,438 |
| 65+ Years | 313 (33.0%) | $71,985 |
| Total | 950 (100.0%) | $94,583 |
Poverty in Burke County
Income Below Poverty by Sex and Age in Burke County
With 6.2% poverty level for males and 6.9% for females among the residents of Burke County, 5 year old males and 15 year old females are the most vulnerable to poverty, with 5 males (71.4%) and 7 females (70.0%) in their respective age groups living below the poverty level.

| Age Bracket | Male | Female |
| Under 5 Years | 5 (5.6%) | 0 (0.0%) |
| 5 Years | 5 (71.4%) | 0 (0.0%) |
| 6 to 11 Years | 5 (7.0%) | 4 (4.0%) |
| 12 to 14 Years | 21 (21.2%) | 1 (2.9%) |
| 15 Years | 4 (11.4%) | 7 (70.0%) |
| 16 and 17 Years | 0 (0.0%) | 0 (0.0%) |
| 18 to 24 Years | 1 (1.5%) | 3 (9.4%) |
| 25 to 34 Years | 1 (0.8%) | 0 (0.0%) |
| 35 to 44 Years | 1 (0.9%) | 8 (7.3%) |
| 45 to 54 Years | 7 (5.8%) | 4 (3.1%) |
| 55 to 64 Years | 17 (8.5%) | 25 (14.4%) |
| 65 to 74 Years | 1 (0.8%) | 5 (3.1%) |
| 75 Years and over | 3 (3.7%) | 14 (13.2%) |
| Total | 71 (6.2%) | 71 (6.9%) |
Income Above Poverty by Sex and Age in Burke County
According to the poverty statistics in Burke County, males aged 16 and 17 years and females aged under 5 years are the age groups that are most secure financially, with 100.0% of males and 100.0% of females in these age groups living above the poverty line.

| Age Bracket | Male | Female |
| Under 5 Years | 85 (94.4%) | 33 (100.0%) |
| 5 Years | 2 (28.6%) | 9 (100.0%) |
| 6 to 11 Years | 66 (93.0%) | 97 (96.0%) |
| 12 to 14 Years | 78 (78.8%) | 33 (97.1%) |
| 15 Years | 31 (88.6%) | 3 (30.0%) |
| 16 and 17 Years | 20 (100.0%) | 24 (100.0%) |
| 18 to 24 Years | 66 (98.5%) | 29 (90.6%) |
| 25 to 34 Years | 122 (99.2%) | 116 (100.0%) |
| 35 to 44 Years | 107 (99.1%) | 101 (92.7%) |
| 45 to 54 Years | 114 (94.2%) | 124 (96.9%) |
| 55 to 64 Years | 183 (91.5%) | 148 (85.6%) |
| 65 to 74 Years | 119 (99.2%) | 155 (96.9%) |
| 75 Years and over | 78 (96.3%) | 92 (86.8%) |
| Total | 1,071 (93.8%) | 964 (93.1%) |
Income Below Poverty Among Married-Couple Families in Burke County
The poverty statistics for married-couple families in Burke County show that 1.8% or 10 of the total 550 families live below the poverty line. Families with no children have the highest poverty rate of 2.6%, comprising of 10 families. On the other hand, families with 1 or 2 children have the lowest poverty rate of 0.0%, which includes 0 families.
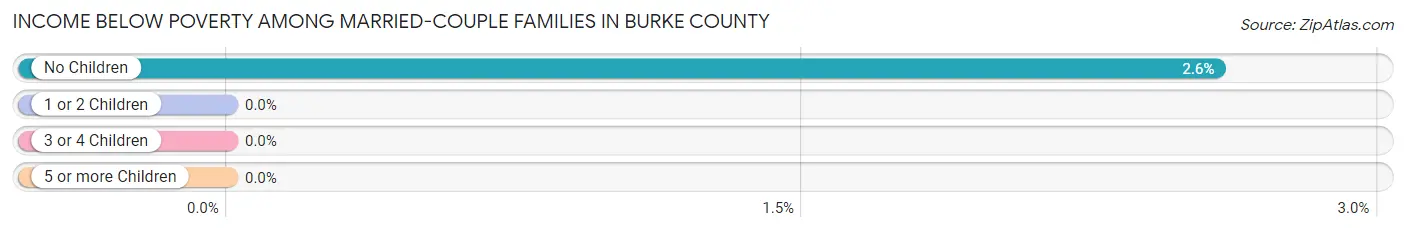
| Children | Above Poverty | Below Poverty |
| No Children | 377 (97.4%) | 10 (2.6%) |
| 1 or 2 Children | 109 (100.0%) | 0 (0.0%) |
| 3 or 4 Children | 54 (100.0%) | 0 (0.0%) |
| 5 or more Children | 0 (0.0%) | 0 (0.0%) |
| Total | 540 (98.2%) | 10 (1.8%) |
Income Below Poverty Among Single-Parent Households in Burke County

| Children | Single Father | Single Mother |
| No Children | 0 (0.0%) | 0 (0.0%) |
| 1 or 2 Children | 0 (0.0%) | 1 (16.7%) |
| 3 or 4 Children | 0 (0.0%) | 3 (100.0%) |
| 5 or more Children | 0 (0.0%) | 3 (100.0%) |
| Total | 0 (0.0%) | 7 (20.0%) |
Income Below Poverty Among Married-Couple vs Single-Parent Households in Burke County
The poverty data for Burke County shows that 10 of the married-couple family households (1.8%) and 7 of the single-parent households (13.5%) are living below the poverty level. Within the married-couple family households, those with no children have the highest poverty rate, with 10 households (2.6%) falling below the poverty line. Among the single-parent households, those with 5 or more children have the highest poverty rate, with 3 household (100.0%) living below poverty.

| Children | Married-Couple Families | Single-Parent Households |
| No Children | 10 (2.6%) | 0 (0.0%) |
| 1 or 2 Children | 0 (0.0%) | 1 (10.0%) |
| 3 or 4 Children | 0 (0.0%) | 3 (75.0%) |
| 5 or more Children | 0 (0.0%) | 3 (100.0%) |
| Total | 10 (1.8%) | 7 (13.5%) |
Employment Characteristics in Burke County
Employment by Class of Employer in Burke County
Among the 1,039 employed individuals in Burke County, private company employees (457 | 44.0%), self-employed (not incorporated) (157 | 15.1%), and federal government employees (124 | 11.9%) make up the most common classes of employment.

| Employer Class | # Employees | % Employees |
| Private Company Employees | 457 | 44.0% |
| Self-Employed (Incorporated) | 49 | 4.7% |
| Self-Employed (Not Incorporated) | 157 | 15.1% |
| Not-for-profit Organizations | 123 | 11.8% |
| Local Government Employees | 117 | 11.3% |
| State Government Employees | 12 | 1.1% |
| Federal Government Employees | 124 | 11.9% |
| Unpaid Family Workers | 0 | 0.0% |
| Total | 1,039 | 100.0% |
Employment Status by Age in Burke County
According to the labor force statistics for Burke County, out of the total population over 16 years of age (1,688), 63.8% or 1,077 individuals are in the labor force, with 2.0% or 22 of them unemployed. The age group with the highest labor force participation rate is 35 to 44 years, with 89.9% or 195 individuals in the labor force. Within the labor force, the 45 to 54 years age range has the highest percentage of unemployed individuals, with 7.3% or 14 of them being unemployed.

| Age Bracket | In Labor Force | Unemployed |
| 16 to 19 Years | 11 (13.6%) | 0 (0.0%) |
| 20 to 24 Years | 40 (64.5%) | 0 (0.0%) |
| 25 to 29 Years | 93 (82.3%) | 0 (0.0%) |
| 30 to 34 Years | 110 (87.3%) | 0 (0.0%) |
| 35 to 44 Years | 195 (89.9%) | 5 (2.6%) |
| 45 to 54 Years | 192 (77.1%) | 14 (7.3%) |
| 55 to 59 Years | 108 (82.4%) | 2 (1.9%) |
| 60 to 64 Years | 183 (75.6%) | 1 (0.5%) |
| 65 to 74 Years | 109 (38.9%) | 0 (0.0%) |
| 75 Years and over | 36 (19.3%) | 0 (0.0%) |
| Total | 1,077 (63.8%) | 22 (2.0%) |
Employment Status by Educational Attainment in Burke County
According to labor force statistics for Burke County, 81.7% of individuals (881) out of the total population between 25 and 64 years of age (1,078) are in the labor force, with 2.5% or 22 of them being unemployed. The group with the highest labor force participation rate are those with the educational attainment of bachelor's degree or higher, with 91.4% or 245 individuals in the labor force. Within the labor force, individuals with less than high school education have the highest percentage of unemployment, with 29.3% or 12 of them being unemployed.

| Educational Attainment | In Labor Force | Unemployed |
| Less than High School | 41 (54.7%) | 22 (29.3%) |
| High School Diploma | 227 (77.2%) | 1 (0.4%) |
| College / Associate Degree | 368 (83.4%) | 11 (2.4%) |
| Bachelor's Degree or higher | 245 (91.4%) | 0 (0.0%) |
| Total | 881 (81.7%) | 27 (2.5%) |
Employment Occupations by Sex in Burke County
Management, Business, Science and Arts Occupations
The most common Management, Business, Science and Arts occupations in Burke County are Management (241 | 22.9%), Health Diagnosing & Treating (77 | 7.3%), Community & Social Service (68 | 6.5%), Health Technologists (67 | 6.4%), and Education Instruction & Library (55 | 5.2%).
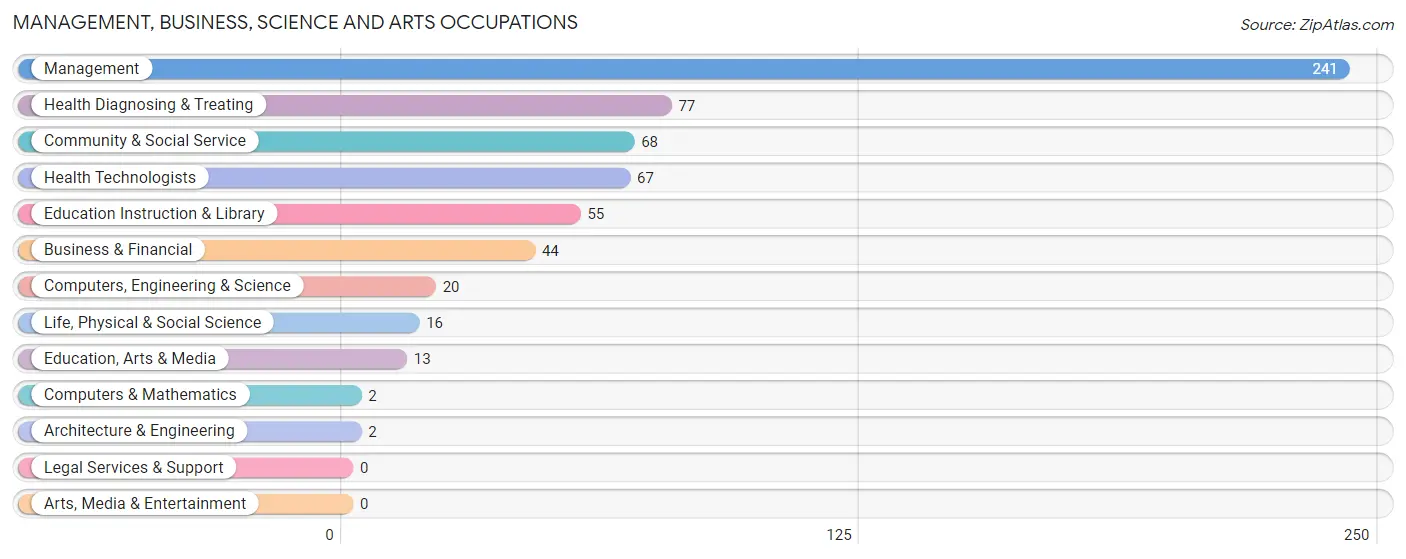
Management, Business, Science and Arts Occupations by Sex
Within the Management, Business, Science and Arts occupations in Burke County, the most male-oriented occupations are Computers & Mathematics (100.0%), Architecture & Engineering (100.0%), and Management (76.8%), while the most female-oriented occupations are Health Diagnosing & Treating (100.0%), Health Technologists (100.0%), and Education, Arts & Media (92.3%).

| Occupation | Male | Female |
| Management | 185 (76.8%) | 56 (23.2%) |
| Business & Financial | 18 (40.9%) | 26 (59.1%) |
| Computers, Engineering & Science | 6 (30.0%) | 14 (70.0%) |
| Computers & Mathematics | 2 (100.0%) | 0 (0.0%) |
| Architecture & Engineering | 2 (100.0%) | 0 (0.0%) |
| Life, Physical & Social Science | 2 (12.5%) | 14 (87.5%) |
| Community & Social Service | 6 (8.8%) | 62 (91.2%) |
| Education, Arts & Media | 1 (7.7%) | 12 (92.3%) |
| Legal Services & Support | 0 (0.0%) | 0 (0.0%) |
| Education Instruction & Library | 5 (9.1%) | 50 (90.9%) |
| Arts, Media & Entertainment | 0 (0.0%) | 0 (0.0%) |
| Health Diagnosing & Treating | 0 (0.0%) | 77 (100.0%) |
| Health Technologists | 0 (0.0%) | 67 (100.0%) |
| Total (Category) | 215 (47.8%) | 235 (52.2%) |
| Total (Overall) | 570 (54.1%) | 484 (45.9%) |
Services Occupations
The most common Services occupations in Burke County are Security & Protection (68 | 6.5%), Law Enforcement (59 | 5.6%), Food Preparation & Serving (42 | 4.0%), Healthcare Support (37 | 3.5%), and Cleaning & Maintenance (32 | 3.0%).

Services Occupations by Sex
Within the Services occupations in Burke County, the most male-oriented occupations are Firefighting & Prevention (100.0%), Security & Protection (60.3%), and Law Enforcement (54.2%), while the most female-oriented occupations are Healthcare Support (100.0%), Personal Care & Service (100.0%), and Cleaning & Maintenance (56.2%).

| Occupation | Male | Female |
| Healthcare Support | 0 (0.0%) | 37 (100.0%) |
| Security & Protection | 41 (60.3%) | 27 (39.7%) |
| Firefighting & Prevention | 9 (100.0%) | 0 (0.0%) |
| Law Enforcement | 32 (54.2%) | 27 (45.8%) |
| Food Preparation & Serving | 20 (47.6%) | 22 (52.4%) |
| Cleaning & Maintenance | 14 (43.8%) | 18 (56.2%) |
| Personal Care & Service | 0 (0.0%) | 16 (100.0%) |
| Total (Category) | 75 (38.5%) | 120 (61.5%) |
| Total (Overall) | 570 (54.1%) | 484 (45.9%) |
Sales and Office Occupations
The most common Sales and Office occupations in Burke County are Office & Administration (104 | 9.9%), and Sales & Related (51 | 4.8%).

Sales and Office Occupations by Sex

| Occupation | Male | Female |
| Sales & Related | 32 (62.7%) | 19 (37.2%) |
| Office & Administration | 14 (13.5%) | 90 (86.5%) |
| Total (Category) | 46 (29.7%) | 109 (70.3%) |
| Total (Overall) | 570 (54.1%) | 484 (45.9%) |
Natural Resources, Construction and Maintenance Occupations
The most common Natural Resources, Construction and Maintenance occupations in Burke County are Construction & Extraction (84 | 8.0%), Installation, Maintenance & Repair (23 | 2.2%), and Farming, Fishing & Forestry (10 | 0.9%).

Natural Resources, Construction and Maintenance Occupations by Sex

| Occupation | Male | Female |
| Farming, Fishing & Forestry | 10 (100.0%) | 0 (0.0%) |
| Construction & Extraction | 84 (100.0%) | 0 (0.0%) |
| Installation, Maintenance & Repair | 23 (100.0%) | 0 (0.0%) |
| Total (Category) | 117 (100.0%) | 0 (0.0%) |
| Total (Overall) | 570 (54.1%) | 484 (45.9%) |
Production, Transportation and Moving Occupations
The most common Production, Transportation and Moving occupations in Burke County are Transportation (71 | 6.7%), Production (36 | 3.4%), and Material Moving (30 | 2.9%).

Production, Transportation and Moving Occupations by Sex

| Occupation | Male | Female |
| Production | 24 (66.7%) | 12 (33.3%) |
| Transportation | 66 (93.0%) | 5 (7.0%) |
| Material Moving | 27 (90.0%) | 3 (10.0%) |
| Total (Category) | 117 (85.4%) | 20 (14.6%) |
| Total (Overall) | 570 (54.1%) | 484 (45.9%) |
Employment Industries by Sex in Burke County
Employment Industries in Burke County
The major employment industries in Burke County include Agriculture, Fishing & Hunting (174 | 16.5%), Public Administration (145 | 13.8%), Mining, Quarrying, & Extraction (107 | 10.2%), Construction (100 | 9.5%), and Health Care & Social Assistance (97 | 9.2%).
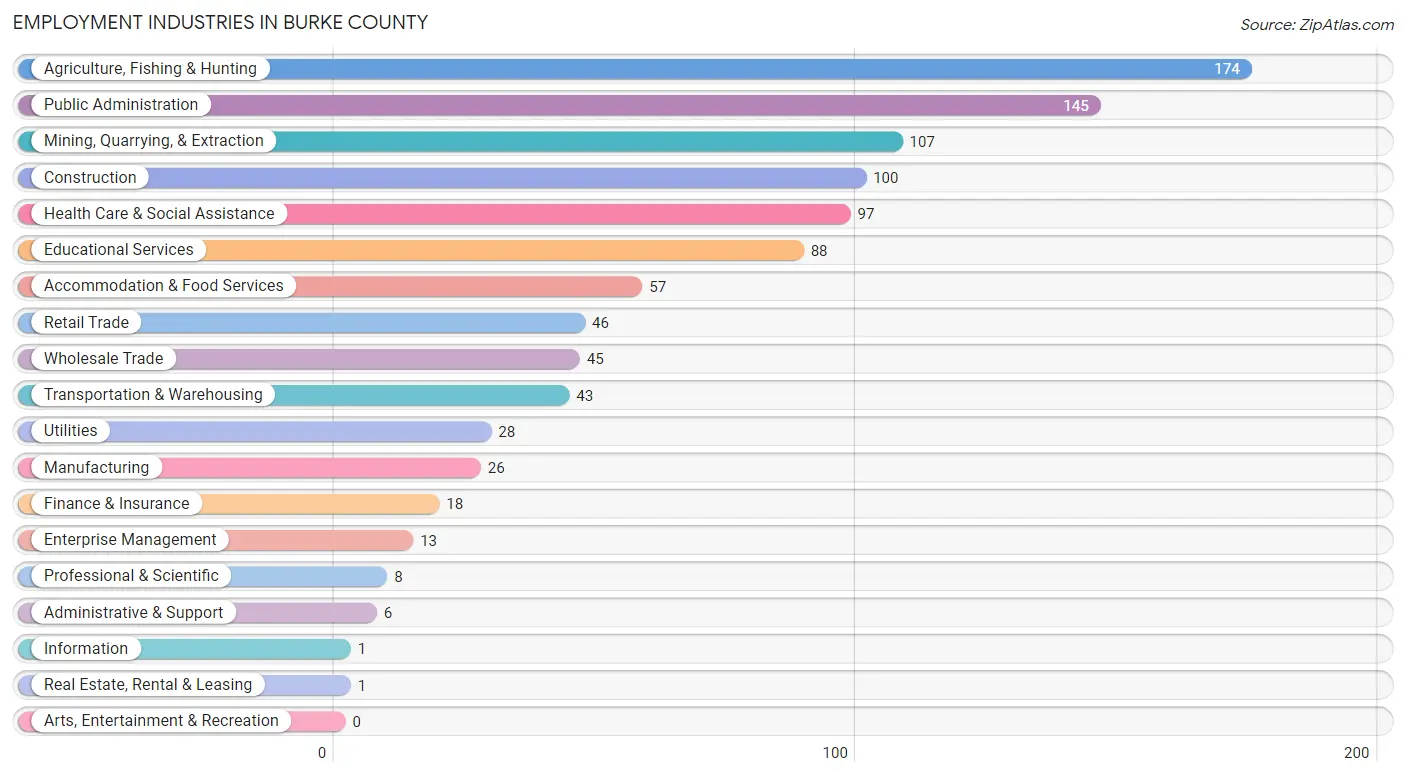
Employment Industries by Sex in Burke County
The Burke County industries that see more men than women are Real Estate, Rental & Leasing (100.0%), Enterprise Management (100.0%), and Wholesale Trade (97.8%), whereas the industries that tend to have a higher number of women are Information (100.0%), Health Care & Social Assistance (99.0%), and Professional & Scientific (87.5%).

| Industry | Male | Female |
| Agriculture, Fishing & Hunting | 160 (91.9%) | 14 (8.1%) |
| Mining, Quarrying, & Extraction | 78 (72.9%) | 29 (27.1%) |
| Construction | 84 (84.0%) | 16 (16.0%) |
| Manufacturing | 9 (34.6%) | 17 (65.4%) |
| Wholesale Trade | 44 (97.8%) | 1 (2.2%) |
| Retail Trade | 18 (39.1%) | 28 (60.9%) |
| Transportation & Warehousing | 31 (72.1%) | 12 (27.9%) |
| Utilities | 7 (25.0%) | 21 (75.0%) |
| Information | 0 (0.0%) | 1 (100.0%) |
| Finance & Insurance | 3 (16.7%) | 15 (83.3%) |
| Real Estate, Rental & Leasing | 1 (100.0%) | 0 (0.0%) |
| Professional & Scientific | 1 (12.5%) | 7 (87.5%) |
| Enterprise Management | 13 (100.0%) | 0 (0.0%) |
| Administrative & Support | 3 (50.0%) | 3 (50.0%) |
| Educational Services | 16 (18.2%) | 72 (81.8%) |
| Health Care & Social Assistance | 1 (1.0%) | 96 (99.0%) |
| Arts, Entertainment & Recreation | 0 (0.0%) | 0 (0.0%) |
| Accommodation & Food Services | 20 (35.1%) | 37 (64.9%) |
| Public Administration | 73 (50.3%) | 72 (49.7%) |
| Total | 570 (54.1%) | 484 (45.9%) |
Education in Burke County
School Enrollment in Burke County
The most common levels of schooling among the 503 students in Burke County are middle school (164 | 32.6%), high school (136 | 27.0%), and elementary school (127 | 25.3%).

| School Level | # Students | % Students |
| Nursery / Preschool | 12 | 2.4% |
| Kindergarten | 25 | 5.0% |
| Elementary School | 127 | 25.3% |
| Middle School | 164 | 32.6% |
| High School | 136 | 27.0% |
| College / Undergraduate | 34 | 6.8% |
| Graduate / Professional | 5 | 1.0% |
| Total | 503 | 100.0% |
School Enrollment by Age by Funding Source in Burke County
Out of a total of 503 students who are enrolled in schools in Burke County, 14 (2.8%) attend a private institution, while the remaining 489 (97.2%) are enrolled in public schools. The age group of 20 to 24 year olds has the highest likelihood of being enrolled in private schools, with 3 (18.8% in the age bracket) enrolled. Conversely, the age group of 5 to 9 year old has the lowest likelihood of being enrolled in a private school, with 125 (100.0% in the age bracket) attending a public institution.

| Age Bracket | Public School | Private School |
| 3 to 4 Year Olds | 9 (90.0%) | 1 (10.0%) |
| 5 to 9 Year Old | 125 (100.0%) | 0 (0.0%) |
| 10 to 14 Year Olds | 193 (95.1%) | 10 (4.9%) |
| 15 to 17 Year Olds | 89 (100.0%) | 0 (0.0%) |
| 18 to 19 Year Olds | 32 (100.0%) | 0 (0.0%) |
| 20 to 24 Year Olds | 13 (81.2%) | 3 (18.8%) |
| 25 to 34 Year Olds | 11 (100.0%) | 0 (0.0%) |
| 35 Years and over | 17 (100.0%) | 0 (0.0%) |
| Total | 489 (97.2%) | 14 (2.8%) |
Educational Attainment by Field of Study in Burke County
Education (132 | 32.3%), bio, nature & agricultural (76 | 18.6%), arts & humanities (51 | 12.5%), business (50 | 12.2%), and science & technology (41 | 10.0%) are the most common fields of study among 409 individuals in Burke County who have obtained a bachelor's degree or higher.

| Field of Study | # Graduates | % Graduates |
| Computers & Mathematics | 17 | 4.2% |
| Bio, Nature & Agricultural | 76 | 18.6% |
| Physical & Health Sciences | 4 | 1.0% |
| Psychology | 7 | 1.7% |
| Social Sciences | 1 | 0.2% |
| Engineering | 18 | 4.4% |
| Multidisciplinary Studies | 1 | 0.2% |
| Science & Technology | 41 | 10.0% |
| Business | 50 | 12.2% |
| Education | 132 | 32.3% |
| Literature & Languages | 2 | 0.5% |
| Liberal Arts & History | 4 | 1.0% |
| Visual & Performing Arts | 1 | 0.2% |
| Communications | 4 | 1.0% |
| Arts & Humanities | 51 | 12.5% |
| Total | 409 | 100.0% |
Transportation & Commute in Burke County
Vehicle Availability by Sex in Burke County
The most prevalent vehicle ownership categories in Burke County are males with 3 vehicles (170, accounting for 30.5%) and females with 3 vehicles (178, making up 35.3%).

| Vehicles Available | Male | Female |
| No Vehicle | 1 (0.2%) | 0 (0.0%) |
| 1 Vehicle | 87 (15.6%) | 67 (13.9%) |
| 2 Vehicles | 136 (24.4%) | 85 (17.7%) |
| 3 Vehicles | 170 (30.5%) | 178 (37.0%) |
| 4 Vehicles | 94 (16.9%) | 98 (20.4%) |
| 5 or more Vehicles | 70 (12.5%) | 53 (11.0%) |
| Total | 558 (100.0%) | 481 (100.0%) |
Commute Time in Burke County
The most frequently occuring commute durations in Burke County are less than 5 minutes (167 commuters, 17.8%), 30 to 34 minutes (162 commuters, 17.3%), and 5 to 9 minutes (136 commuters, 14.5%).

| Commute Time | # Commuters | % Commuters |
| Less than 5 Minutes | 167 | 17.8% |
| 5 to 9 Minutes | 136 | 14.5% |
| 10 to 14 Minutes | 72 | 7.7% |
| 15 to 19 Minutes | 84 | 9.0% |
| 20 to 24 Minutes | 94 | 10.0% |
| 25 to 29 Minutes | 26 | 2.8% |
| 30 to 34 Minutes | 162 | 17.3% |
| 35 to 39 Minutes | 37 | 4.0% |
| 40 to 44 Minutes | 29 | 3.1% |
| 45 to 59 Minutes | 25 | 2.7% |
| 60 to 89 Minutes | 55 | 5.9% |
| 90 or more Minutes | 49 | 5.2% |
Commute Time by Sex in Burke County
The most common commute times in Burke County are less than 5 minutes (108 commuters, 20.9%) for males and 30 to 34 minutes (98 commuters, 23.3%) for females.

| Commute Time | Male | Female |
| Less than 5 Minutes | 108 (20.9%) | 59 (14.1%) |
| 5 to 9 Minutes | 73 (14.1%) | 63 (15.0%) |
| 10 to 14 Minutes | 35 (6.8%) | 37 (8.8%) |
| 15 to 19 Minutes | 38 (7.4%) | 46 (11.0%) |
| 20 to 24 Minutes | 52 (10.1%) | 42 (10.0%) |
| 25 to 29 Minutes | 13 (2.5%) | 13 (3.1%) |
| 30 to 34 Minutes | 64 (12.4%) | 98 (23.3%) |
| 35 to 39 Minutes | 23 (4.5%) | 14 (3.3%) |
| 40 to 44 Minutes | 20 (3.9%) | 9 (2.1%) |
| 45 to 59 Minutes | 20 (3.9%) | 5 (1.2%) |
| 60 to 89 Minutes | 33 (6.4%) | 22 (5.2%) |
| 90 or more Minutes | 37 (7.2%) | 12 (2.9%) |
Time of Departure to Work by Sex in Burke County
The most frequent times of departure to work in Burke County are 7:00 AM to 7:29 AM (94, 18.2%) for males and 7:00 AM to 7:29 AM (131, 31.2%) for females.

| Time of Departure | Male | Female |
| 12:00 AM to 4:59 AM | 5 (1.0%) | 20 (4.8%) |
| 5:00 AM to 5:29 AM | 37 (7.2%) | 0 (0.0%) |
| 5:30 AM to 5:59 AM | 10 (1.9%) | 2 (0.5%) |
| 6:00 AM to 6:29 AM | 75 (14.5%) | 13 (3.1%) |
| 6:30 AM to 6:59 AM | 59 (11.4%) | 22 (5.2%) |
| 7:00 AM to 7:29 AM | 94 (18.2%) | 131 (31.2%) |
| 7:30 AM to 7:59 AM | 76 (14.7%) | 104 (24.8%) |
| 8:00 AM to 8:29 AM | 89 (17.2%) | 49 (11.7%) |
| 8:30 AM to 8:59 AM | 12 (2.3%) | 14 (3.3%) |
| 9:00 AM to 9:59 AM | 11 (2.1%) | 11 (2.6%) |
| 10:00 AM to 10:59 AM | 8 (1.5%) | 4 (0.9%) |
| 11:00 AM to 11:59 AM | 0 (0.0%) | 0 (0.0%) |
| 12:00 PM to 3:59 PM | 22 (4.3%) | 16 (3.8%) |
| 4:00 PM to 11:59 PM | 18 (3.5%) | 34 (8.1%) |
| Total | 516 (100.0%) | 420 (100.0%) |
Housing Occupancy in Burke County
Occupancy by Ownership in Burke County
Of the total 950 dwellings in Burke County, owner-occupied units account for 782 (82.3%), while renter-occupied units make up 168 (17.7%).

| Occupancy | # Housing Units | % Housing Units |
| Owner Occupied Housing Units | 782 | 82.3% |
| Renter-Occupied Housing Units | 168 | 17.7% |
| Total Occupied Housing Units | 950 | 100.0% |
Occupancy by Household Size in Burke County
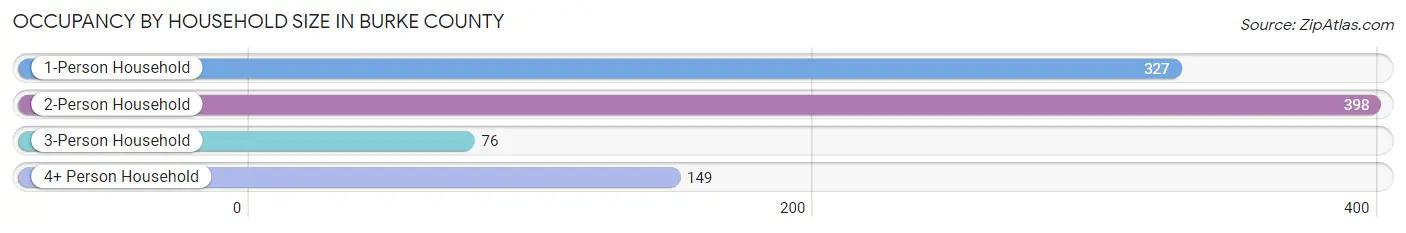
| Household Size | # Housing Units | % Housing Units |
| 1-Person Household | 327 | 34.4% |
| 2-Person Household | 398 | 41.9% |
| 3-Person Household | 76 | 8.0% |
| 4+ Person Household | 149 | 15.7% |
| Total Housing Units | 950 | 100.0% |
Occupancy by Ownership by Household Size in Burke County
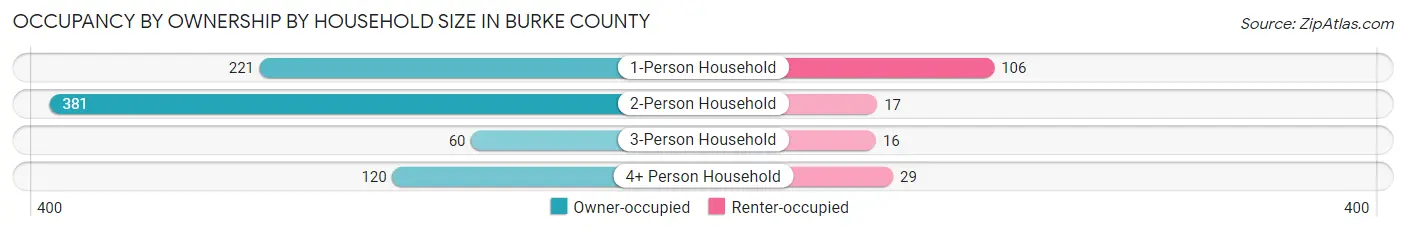
| Household Size | Owner-occupied | Renter-occupied |
| 1-Person Household | 221 (67.6%) | 106 (32.4%) |
| 2-Person Household | 381 (95.7%) | 17 (4.3%) |
| 3-Person Household | 60 (78.9%) | 16 (21.0%) |
| 4+ Person Household | 120 (80.5%) | 29 (19.5%) |
| Total Housing Units | 782 (82.3%) | 168 (17.7%) |
Occupancy by Educational Attainment in Burke County
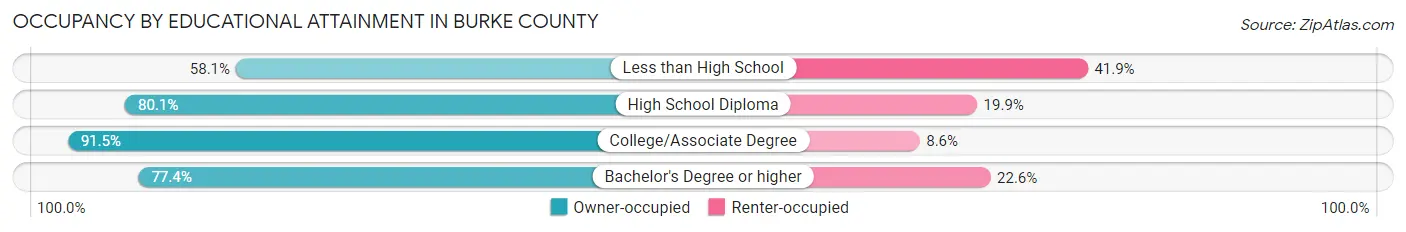
| Household Size | Owner-occupied | Renter-occupied |
| Less than High School | 43 (58.1%) | 31 (41.9%) |
| High School Diploma | 201 (80.1%) | 50 (19.9%) |
| College/Associate Degree | 353 (91.4%) | 33 (8.6%) |
| Bachelor's Degree or higher | 185 (77.4%) | 54 (22.6%) |
Occupancy by Age of Householder in Burke County

| Age Bracket | # Households | % Households |
| Under 35 Years | 161 | 17.0% |
| 35 to 44 Years | 97 | 10.2% |
| 45 to 54 Years | 124 | 13.1% |
| 55 to 64 Years | 255 | 26.8% |
| 65 to 74 Years | 186 | 19.6% |
| 75 to 84 Years | 90 | 9.5% |
| 85 Years and Over | 37 | 3.9% |
| Total | 950 | 100.0% |
Housing Finances in Burke County
Median Income by Occupancy in Burke County

| Occupancy Type | # Households | Median Income |
| Owner-Occupied | 782 (82.3%) | $102,632 |
| Renter-Occupied | 168 (17.7%) | $60,000 |
| Average | 950 (100.0%) | $94,583 |
Occupancy by Householder Income Bracket in Burke County

| Income Bracket | Owner-occupied | Renter-occupied |
| Less than $5,000 | 17 (2.2%) | 0 (0.0%) |
| $5,000 to $9,999 | 10 (1.3%) | 4 (2.4%) |
| $10,000 to $14,999 | 10 (1.3%) | 8 (4.8%) |
| $15,000 to $19,999 | 25 (3.2%) | 6 (3.6%) |
| $20,000 to $24,999 | 18 (2.3%) | 9 (5.4%) |
| $25,000 to $34,999 | 34 (4.3%) | 23 (13.7%) |
| $35,000 to $49,999 | 61 (7.8%) | 13 (7.7%) |
| $50,000 to $74,999 | 87 (11.1%) | 31 (18.4%) |
| $75,000 to $99,999 | 115 (14.7%) | 31 (18.4%) |
| $100,000 to $149,999 | 181 (23.2%) | 33 (19.6%) |
| $150,000 or more | 224 (28.6%) | 10 (5.9%) |
| Total | 782 (100.0%) | 168 (100.0%) |
Monthly Housing Cost Tiers in Burke County

| Monthly Cost | Owner-occupied | Renter-occupied |
| Less than $300 | 78 (10.0%) | 4 (2.4%) |
| $300 to $499 | 186 (23.8%) | 20 (11.9%) |
| $500 to $799 | 187 (23.9%) | 70 (41.7%) |
| $800 to $999 | 134 (17.1%) | 14 (8.3%) |
| $1,000 to $1,499 | 122 (15.6%) | 19 (11.3%) |
| $1,500 to $1,999 | 61 (7.8%) | 6 (3.6%) |
| $2,000 to $2,499 | 10 (1.3%) | 0 (0.0%) |
| $2,500 to $2,999 | 3 (0.4%) | 0 (0.0%) |
| $3,000 or more | 1 (0.1%) | 0 (0.0%) |
| Total | 782 (100.0%) | 168 (100.0%) |
Physical Housing Characteristics in Burke County
Housing Structures in Burke County

| Structure Type | # Housing Units | % Housing Units |
| Single Unit, Detached | 798 | 84.0% |
| Single Unit, Attached | 8 | 0.8% |
| 2 Unit Apartments | 0 | 0.0% |
| 3 or 4 Unit Apartments | 17 | 1.8% |
| 5 to 9 Unit Apartments | 18 | 1.9% |
| 10 or more Apartments | 39 | 4.1% |
| Mobile Home / Other | 70 | 7.4% |
| Total | 950 | 100.0% |
Housing Structures by Occupancy in Burke County

| Structure Type | Owner-occupied | Renter-occupied |
| Single Unit, Detached | 717 (89.8%) | 81 (10.2%) |
| Single Unit, Attached | 8 (100.0%) | 0 (0.0%) |
| 2 Unit Apartments | 0 (0.0%) | 0 (0.0%) |
| 3 or 4 Unit Apartments | 0 (0.0%) | 17 (100.0%) |
| 5 to 9 Unit Apartments | 0 (0.0%) | 18 (100.0%) |
| 10 or more Apartments | 0 (0.0%) | 39 (100.0%) |
| Mobile Home / Other | 57 (81.4%) | 13 (18.6%) |
| Total | 782 (82.3%) | 168 (17.7%) |
Housing Structures by Number of Rooms in Burke County

| Number of Rooms | Owner-occupied | Renter-occupied |
| 1 Room | 2 (0.3%) | 0 (0.0%) |
| 2 or 3 Rooms | 29 (3.7%) | 36 (21.4%) |
| 4 or 5 Rooms | 142 (18.2%) | 84 (50.0%) |
| 6 or 7 Rooms | 275 (35.2%) | 25 (14.9%) |
| 8 or more Rooms | 334 (42.7%) | 23 (13.7%) |
| Total | 782 (100.0%) | 168 (100.0%) |
Housing Structure by Heating Type in Burke County

| Heating Type | Owner-occupied | Renter-occupied |
| Utility Gas | 99 (12.7%) | 32 (19.1%) |
| Bottled, Tank, or LP Gas | 351 (44.9%) | 35 (20.8%) |
| Electricity | 303 (38.8%) | 96 (57.1%) |
| Fuel Oil or Kerosene | 18 (2.3%) | 2 (1.2%) |
| Coal or Coke | 7 (0.9%) | 0 (0.0%) |
| All other Fuels | 4 (0.5%) | 3 (1.8%) |
| No Fuel Used | 0 (0.0%) | 0 (0.0%) |
| Total | 782 (100.0%) | 168 (100.0%) |
Household Vehicle Usage in Burke County

| Vehicles per Household | Owner-occupied | Renter-occupied |
| No Vehicle | 6 (0.8%) | 6 (3.6%) |
| 1 Vehicle | 112 (14.3%) | 96 (57.1%) |
| 2 Vehicles | 225 (28.8%) | 40 (23.8%) |
| 3 or more Vehicles | 439 (56.1%) | 26 (15.5%) |
| Total | 782 (100.0%) | 168 (100.0%) |
Real Estate & Mortgages in Burke County
Real Estate and Mortgage Overview in Burke County
| Characteristic | Without Mortgage | With Mortgage |
| Housing Units | 574 | 208 |
| Median Property Value | $137,500 | $130,300 |
| Median Household Income | $100,192 | $67 |
| Monthly Housing Costs | $527 | $1 |
| Real Estate Taxes | $1,034 | $8 |
Property Value by Mortgage Status in Burke County

| Property Value | Without Mortgage | With Mortgage |
| Less than $50,000 | 81 (14.1%) | 11 (5.3%) |
| $50,000 to $99,999 | 159 (27.7%) | 68 (32.7%) |
| $100,000 to $299,999 | 261 (45.5%) | 94 (45.2%) |
| $300,000 to $499,999 | 40 (7.0%) | 27 (13.0%) |
| $500,000 to $749,999 | 22 (3.8%) | 3 (1.4%) |
| $750,000 to $999,999 | 0 (0.0%) | 0 (0.0%) |
| $1,000,000 or more | 11 (1.9%) | 5 (2.4%) |
| Total | 574 (100.0%) | 208 (100.0%) |
Household Income by Mortgage Status in Burke County

| Household Income | Without Mortgage | With Mortgage |
| Less than $10,000 | 27 (4.7%) | 3 (1.4%) |
| $10,000 to $24,999 | 51 (8.9%) | 0 (0.0%) |
| $25,000 to $34,999 | 19 (3.3%) | 2 (1.0%) |
| $35,000 to $49,999 | 46 (8.0%) | 15 (7.2%) |
| $50,000 to $74,999 | 69 (12.0%) | 15 (7.2%) |
| $75,000 to $99,999 | 74 (12.9%) | 18 (8.6%) |
| $100,000 to $149,999 | 131 (22.8%) | 41 (19.7%) |
| $150,000 or more | 157 (27.4%) | 50 (24.0%) |
| Total | 574 (100.0%) | 208 (100.0%) |
Property Value to Household Income Ratio in Burke County

| Value-to-Income Ratio | Without Mortgage | With Mortgage |
| Less than 2.0x | 360 (62.7%) | 121,429 (58,379.3%) |
| 2.0x to 2.9x | 61 (10.6%) | 153 (73.6%) |
| 3.0x to 3.9x | 50 (8.7%) | 21 (10.1%) |
| 4.0x or more | 95 (16.6%) | 9 (4.3%) |
| Total | 574 (100.0%) | 208 (100.0%) |
Real Estate Taxes by Mortgage Status in Burke County

| Property Taxes | Without Mortgage | With Mortgage |
| Less than $800 | 200 (34.8%) | 0 (0.0%) |
| $800 to $1,499 | 222 (38.7%) | 65 (31.2%) |
| $800 to $1,499 | 103 (17.9%) | 103 (49.5%) |
| Total | 574 (100.0%) | 208 (100.0%) |
Health & Disability in Burke County
Health Insurance Coverage by Age in Burke County

| Age Bracket | With Coverage | Without Coverage |
| Under 6 Years | 139 (100.0%) | 0 (0.0%) |
| 6 to 18 Years | 420 (96.3%) | 16 (3.7%) |
| 19 to 25 Years | 80 (98.8%) | 1 (1.2%) |
| 26 to 34 Years | 193 (86.9%) | 29 (13.1%) |
| 35 to 44 Years | 207 (95.8%) | 9 (4.2%) |
| 45 to 54 Years | 246 (98.8%) | 3 (1.2%) |
| 55 to 64 Years | 349 (93.6%) | 24 (6.4%) |
| 65 to 74 Years | 280 (100.0%) | 0 (0.0%) |
| 75 Years and older | 187 (100.0%) | 0 (0.0%) |
| Total | 2,101 (96.2%) | 82 (3.8%) |
Health Insurance Coverage by Citizenship Status in Burke County

| Citizenship Status | With Coverage | Without Coverage |
| Native Born | 139 (100.0%) | 0 (0.0%) |
| Foreign Born, Citizen | 420 (96.3%) | 16 (3.7%) |
| Foreign Born, not a Citizen | 80 (98.8%) | 1 (1.2%) |
Health Insurance Coverage by Household Income in Burke County

| Household Income | With Coverage | Without Coverage |
| Under $25,000 | 128 (97.0%) | 4 (3.0%) |
| $25,000 to $49,999 | 222 (83.8%) | 43 (16.2%) |
| $50,000 to $74,999 | 219 (96.9%) | 7 (3.1%) |
| $75,000 to $99,999 | 339 (96.9%) | 11 (3.1%) |
| $100,000 and over | 1,190 (98.8%) | 15 (1.2%) |
Public vs Private Health Insurance Coverage by Age in Burke County

| Age Bracket | Public Insurance | Private Insurance |
| Under 6 | 15 (10.8%) | 130 (93.5%) |
| 6 to 18 Years | 38 (8.7%) | 393 (90.1%) |
| 19 to 25 Years | 3 (3.7%) | 77 (95.1%) |
| 25 to 34 Years | 5 (2.2%) | 188 (84.7%) |
| 35 to 44 Years | 26 (12.0%) | 194 (89.8%) |
| 45 to 54 Years | 10 (4.0%) | 237 (95.2%) |
| 55 to 64 Years | 32 (8.6%) | 325 (87.1%) |
| 65 to 74 Years | 258 (92.1%) | 220 (78.6%) |
| 75 Years and over | 187 (100.0%) | 153 (81.8%) |
| Total | 574 (26.3%) | 1,917 (87.8%) |
Disability Status by Sex by Age in Burke County

| Age Bracket | Male | Female |
| Under 5 Years | 0 (0.0%) | 0 (0.0%) |
| 5 to 17 Years | 8 (3.4%) | 9 (5.0%) |
| 18 to 34 Years | 11 (5.8%) | 11 (7.4%) |
| 35 to 64 Years | 28 (6.5%) | 60 (14.7%) |
| 65 to 74 Years | 30 (25.0%) | 34 (21.2%) |
| 75 Years and over | 44 (54.3%) | 32 (30.2%) |
Disability Class by Sex by Age in Burke County
Disability Class: Hearing Difficulty

| Age Bracket | Male | Female |
| Under 5 Years | 0 (0.0%) | 0 (0.0%) |
| 5 to 17 Years | 0 (0.0%) | 0 (0.0%) |
| 18 to 34 Years | 2 (1.1%) | 0 (0.0%) |
| 35 to 64 Years | 8 (1.9%) | 25 (6.1%) |
| 65 to 74 Years | 24 (20.0%) | 22 (13.8%) |
| 75 Years and over | 41 (50.6%) | 10 (9.4%) |
Disability Class: Vision Difficulty

| Age Bracket | Male | Female |
| Under 5 Years | 0 (0.0%) | 0 (0.0%) |
| 5 to 17 Years | 0 (0.0%) | 0 (0.0%) |
| 18 to 34 Years | 0 (0.0%) | 0 (0.0%) |
| 35 to 64 Years | 0 (0.0%) | 17 (4.2%) |
| 65 to 74 Years | 3 (2.5%) | 0 (0.0%) |
| 75 Years and over | 11 (13.6%) | 3 (2.8%) |
Disability Class: Cognitive Difficulty

| Age Bracket | Male | Female |
| 5 to 17 Years | 8 (3.4%) | 9 (5.0%) |
| 18 to 34 Years | 0 (0.0%) | 8 (5.4%) |
| 35 to 64 Years | 3 (0.7%) | 27 (6.6%) |
| 65 to 74 Years | 7 (5.8%) | 5 (3.1%) |
| 75 Years and over | 5 (6.2%) | 5 (4.7%) |
Disability Class: Ambulatory Difficulty

| Age Bracket | Male | Female |
| 5 to 17 Years | 0 (0.0%) | 0 (0.0%) |
| 18 to 34 Years | 9 (4.7%) | 0 (0.0%) |
| 35 to 64 Years | 9 (2.1%) | 13 (3.2%) |
| 65 to 74 Years | 12 (10.0%) | 11 (6.9%) |
| 75 Years and over | 5 (6.2%) | 20 (18.9%) |
Disability Class: Self-Care Difficulty

| Age Bracket | Male | Female |
| 5 to 17 Years | 0 (0.0%) | 3 (1.7%) |
| 18 to 34 Years | 0 (0.0%) | 0 (0.0%) |
| 35 to 64 Years | 2 (0.5%) | 0 (0.0%) |
| 65 to 74 Years | 0 (0.0%) | 2 (1.3%) |
| 75 Years and over | 5 (6.2%) | 1 (0.9%) |
Technology Access in Burke County
Computing Device Access in Burke County

| Device Type | # Households | % Households |
| Desktop or Laptop | 766 | 80.6% |
| Smartphone | 845 | 88.9% |
| Tablet | 622 | 65.5% |
| No Computing Device | 51 | 5.4% |
| Total | 950 | 100.0% |
Internet Access in Burke County

| Internet Type | # Households | % Households |
| Dial-Up Internet | 0 | 0.0% |
| Broadband Home | 724 | 76.2% |
| Cellular Data Only | 89 | 9.4% |
| Satellite Internet | 105 | 11.1% |
| No Internet | 107 | 11.3% |
| Total | 950 | 100.0% |
Burke County Summary
Burke County is located in the northwestern corner of North Dakota, and is bordered by Canada to the north, Mountrail County to the east, Williams County to the south, and Divide County to the west. The county seat is Bowbells, and the county was named after John Burke, the first governor of North Dakota. Burke County covers an area of 1,845 square miles, and has a population of 1,945 people, according to the 2010 census.
Geography
Burke County is located in the northwestern corner of North Dakota, and is bordered by Canada to the north, Mountrail County to the east, Williams County to the south, and Divide County to the west. The county is located in the Missouri Plateau region of the Great Plains, and is characterized by rolling hills and flat plains. The county is drained by the Souris River, which flows through the county from north to south. The county is also home to several small lakes, including Lake Metigoshe, Lake Sakakawea, and Lake Audubon.
History
Burke County was established in 1885, and was named after John Burke, the first governor of North Dakota. The county was originally inhabited by the Mandan, Hidatsa, and Arikara tribes, and was later settled by European immigrants in the late 19th century. The county was primarily an agricultural area, and the main crops grown were wheat, oats, barley, and flax. The county also had a thriving livestock industry, and was home to several small towns and villages.
Economy
Burke County is primarily an agricultural area, and the main crops grown are wheat, oats, barley, and flax. The county also has a thriving livestock industry, and is home to several small towns and villages. The county is also home to several oil and gas fields, and is a major producer of crude oil and natural gas. The county is also home to several manufacturing companies, including a paper mill, a furniture factory, and a plastics plant.
Demographics
According to the 2010 census, Burke County had a population of 1,945 people. The racial makeup of the county was 97.3% White, 0.3% African American, 0.2% Native American, 0.2% Asian, 0.1% Pacific Islander, 0.7% from other races, and 1.2% from two or more races. The median household income was $41,944, and the median family income was $50,000. The per capita income was $20,845. The unemployment rate was 4.2%.
Conclusion
Burke County is located in the northwestern corner of North Dakota, and is bordered by Canada to the north, Mountrail County to the east, Williams County to the south, and Divide County to the west. The county was established in 1885, and was named after John Burke, the first governor of North Dakota. Burke County is primarily an agricultural area, and the main crops grown are wheat, oats, barley, and flax. The county also has a thriving livestock industry, and is home to several small towns and villages. According to the 2010 census, Burke County had a population of 1,945 people. The median household income was $41,944, and the median family income was $50,000. The per capita income was $20,845. The unemployment rate was 4.2%.
Common Questions
What is the Total Population of Burke County?
Total Population of Burke County is 2,184.
What is the Total Male Population of Burke County?
Total Male Population of Burke County is 1,146.
What is the Total Female Population of Burke County?
Total Female Population of Burke County is 1,038.
What is the Ratio of Males per 100 Females in Burke County?
There are 110.40 Males per 100 Females in Burke County.
What is the Ratio of Females per 100 Males in Burke County?
There are 90.58 Females per 100 Males in Burke County.
What is the Median Population Age in Burke County?
Median Population Age in Burke County is 44.8 Years.
What is the Average Family Size in Burke County
Average Family Size in Burke County is 3.0 People.
What is the Average Household Size in Burke County
Average Household Size in Burke County is 2.3 People.
What is Per Capita Income in Burke County?
Per Capita income in Burke County is $50,714.
What is the Median Family Income in Burke County?
Median Family Income in Burke County is $111,552.
What is the Median Household income in Burke County?
Median Household Income in Burke County is $94,583.
What is Income or Wage Gap in Burke County?
Income or Wage Gap in Burke County is 31.7%.
Women in Burke County earn 68.3 cents for every dollar earned by a man.
What is Inequality or Gini Index in Burke County?
Inequality or Gini Index in Burke County is 0.43.
How Large is the Labor Force in Burke County?
There are 1,077 People in the Labor Forcein in Burke County.
What is the Percentage of People in the Labor Force in Burke County?
63.8% of People are in the Labor Force in Burke County.
What is the Unemployment Rate in Burke County?
Unemployment Rate in Burke County is 2.0%.