Bottineau County, ND
Bottineau County Map
Bottineau County Overview
6,411
TOTAL POPULATION
3,358
MALE POPULATION
3,053
FEMALE POPULATION
109.99
MALES / 100 FEMALES
90.92
FEMALES / 100 MALES
44.3
MEDIAN AGE
3.1
AVG FAMILY SIZE
2.3
AVG HOUSEHOLD SIZE
$45,506
PER CAPITA INCOME
$101,422
AVG FAMILY INCOME
$80,113
AVG HOUSEHOLD INCOME
43.3%
WAGE / INCOME GAP [ % ]
56.7¢/ $1
WAGE / INCOME GAP [ $ ]
0.47
INEQUALITY / GINI INDEX
3,181
LABOR FORCE [ PEOPLE ]
61.0%
PERCENT IN LABOR FORCE
3.5%
UNEMPLOYMENT RATE
Bottineau County Area Codes
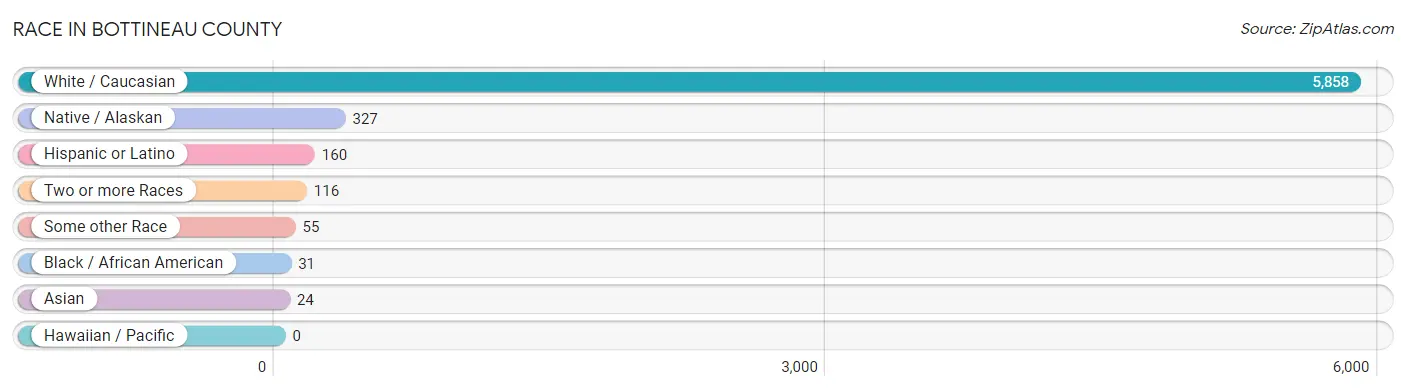
Race in Bottineau County
The most populous races in Bottineau County are White / Caucasian (5,858 | 91.4%), Native / Alaskan (327 | 5.1%), and Hispanic or Latino (160 | 2.5%).
| Race | # Population | % Population |
| Asian | 24 | 0.4% |
| Black / African American | 31 | 0.5% |
| Hawaiian / Pacific | 0 | 0.0% |
| Hispanic or Latino | 160 | 2.5% |
| Native / Alaskan | 327 | 5.1% |
| White / Caucasian | 5,858 | 91.4% |
| Two or more Races | 116 | 1.8% |
| Some other Race | 55 | 0.9% |
| Total | 6,411 | 100.0% |
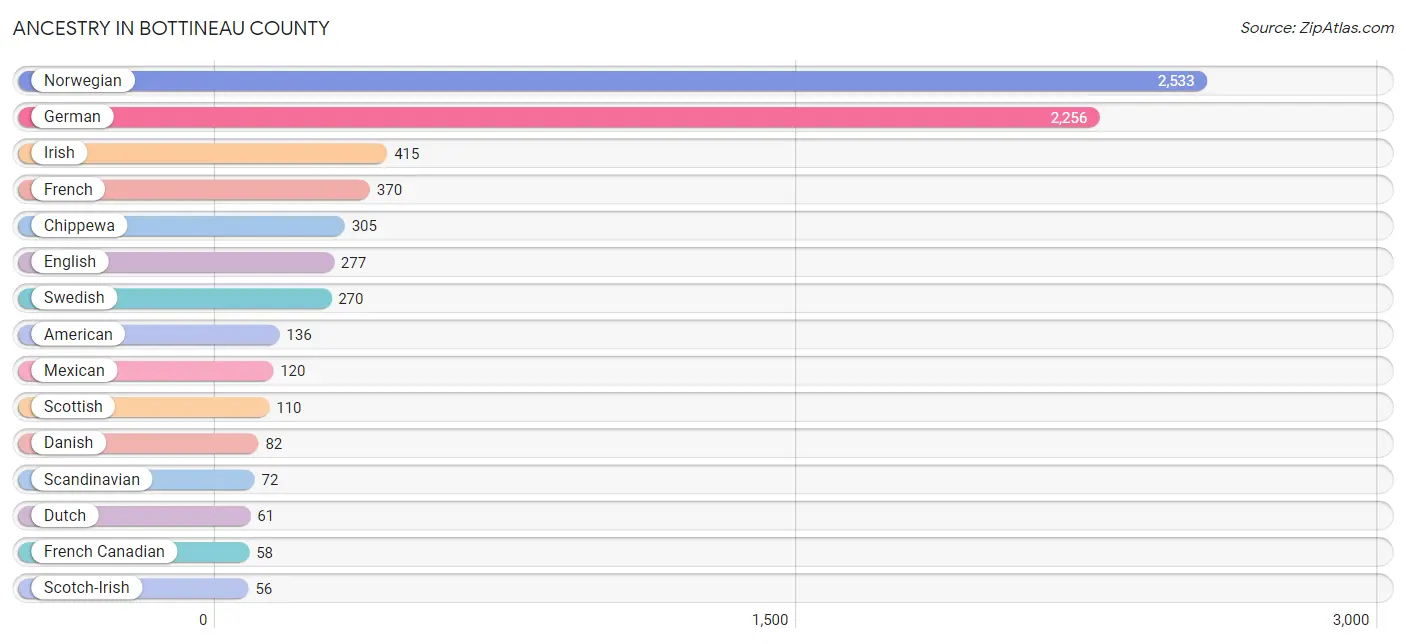
Ancestry in Bottineau County
The most populous ancestries reported in Bottineau County are Norwegian (2,533 | 39.5%), German (2,256 | 35.2%), Irish (415 | 6.5%), French (370 | 5.8%), and Chippewa (305 | 4.8%), together accounting for 91.7% of all Bottineau County residents.
| Ancestry | # Population | % Population |
| Afghan | 3 | 0.1% |
| American | 136 | 2.1% |
| Arab | 9 | 0.1% |
| Australian | 1 | 0.0% |
| Austrian | 3 | 0.1% |
| Belgian | 5 | 0.1% |
| Bhutanese | 9 | 0.1% |
| British | 12 | 0.2% |
| Canadian | 41 | 0.6% |
| Central American | 6 | 0.1% |
| Cherokee | 1 | 0.0% |
| Chilean | 2 | 0.0% |
| Chippewa | 305 | 4.8% |
| Czech | 55 | 0.9% |
| Czechoslovakian | 7 | 0.1% |
| Danish | 82 | 1.3% |
| Dutch | 61 | 0.9% |
| Eastern European | 7 | 0.1% |
| English | 277 | 4.3% |
| European | 20 | 0.3% |
| Finnish | 54 | 0.8% |
| French | 370 | 5.8% |
| French Canadian | 58 | 0.9% |
| German | 2,256 | 35.2% |
| German Russian | 10 | 0.2% |
| Greek | 11 | 0.2% |
| Guatemalan | 1 | 0.0% |
| Icelander | 50 | 0.8% |
| Indian (Asian) | 1 | 0.0% |
| Irish | 415 | 6.5% |
| Italian | 55 | 0.9% |
| Jamaican | 5 | 0.1% |
| Korean | 21 | 0.3% |
| Latvian | 5 | 0.1% |
| Lithuanian | 15 | 0.2% |
| Mexican | 120 | 1.9% |
| Nicaraguan | 5 | 0.1% |
| Northern European | 2 | 0.0% |
| Norwegian | 2,533 | 39.5% |
| Polish | 36 | 0.6% |
| Puerto Rican | 7 | 0.1% |
| Russian | 50 | 0.8% |
| Scandinavian | 72 | 1.1% |
| Scotch-Irish | 56 | 0.9% |
| Scottish | 110 | 1.7% |
| Sioux | 19 | 0.3% |
| Slavic | 2 | 0.0% |
| Slovene | 17 | 0.3% |
| South American | 2 | 0.0% |
| Spaniard | 7 | 0.1% |
| Spanish | 12 | 0.2% |
| Swedish | 270 | 4.2% |
| Swiss | 21 | 0.3% |
| Ukrainian | 16 | 0.3% |
| Welsh | 7 | 0.1% |
| West Indian | 2 | 0.0% | View All 56 Rows |
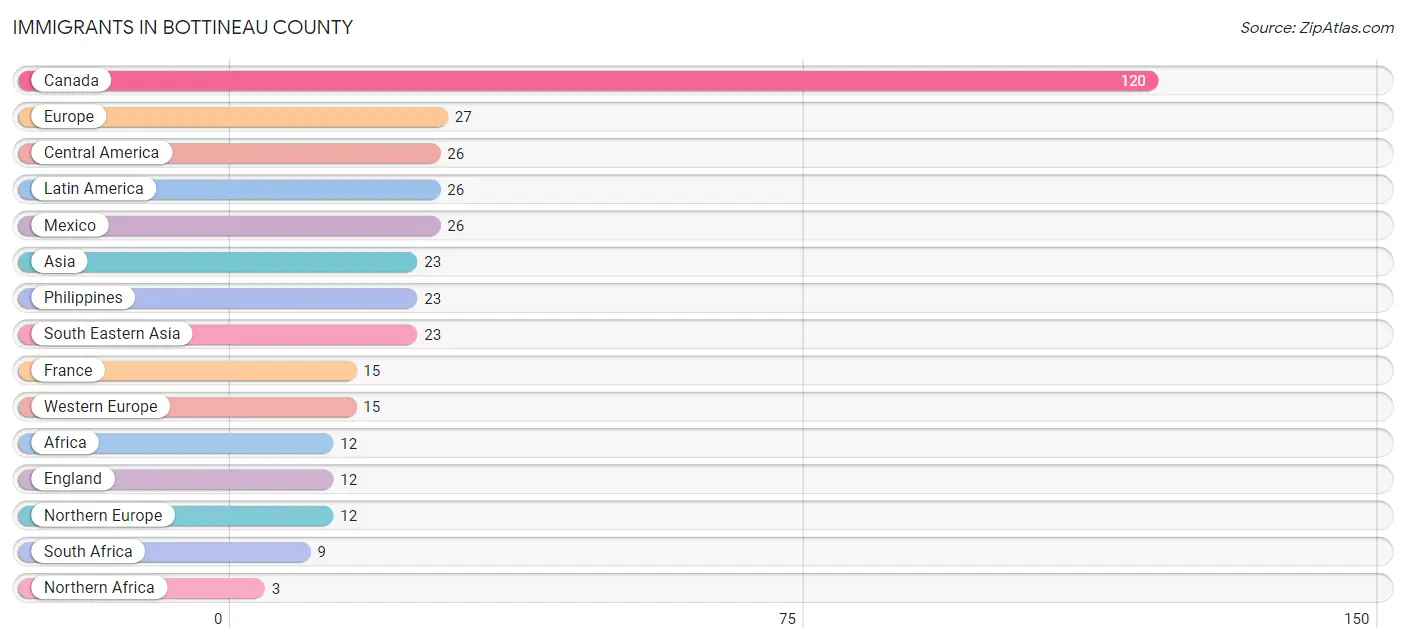
Immigrants in Bottineau County
The most numerous immigrant groups reported in Bottineau County came from Canada (120 | 1.9%), Europe (27 | 0.4%), Central America (26 | 0.4%), Latin America (26 | 0.4%), and Mexico (26 | 0.4%), together accounting for 3.5% of all Bottineau County residents.
| Immigration Origin | # Population | % Population |
| Africa | 12 | 0.2% |
| Asia | 23 | 0.4% |
| Canada | 120 | 1.9% |
| Central America | 26 | 0.4% |
| England | 12 | 0.2% |
| Europe | 27 | 0.4% |
| France | 15 | 0.2% |
| Latin America | 26 | 0.4% |
| Mexico | 26 | 0.4% |
| Northern Africa | 3 | 0.1% |
| Northern Europe | 12 | 0.2% |
| Oceania | 1 | 0.0% |
| Philippines | 23 | 0.4% |
| South Africa | 9 | 0.1% |
| South Eastern Asia | 23 | 0.4% |
| Western Europe | 15 | 0.2% | View All 16 Rows |
Sex and Age in Bottineau County
Sex and Age in Bottineau County
The most populous age groups in Bottineau County are 55 to 59 Years (311 | 9.3%) for men and 65 to 69 Years (270 | 8.8%) for women.
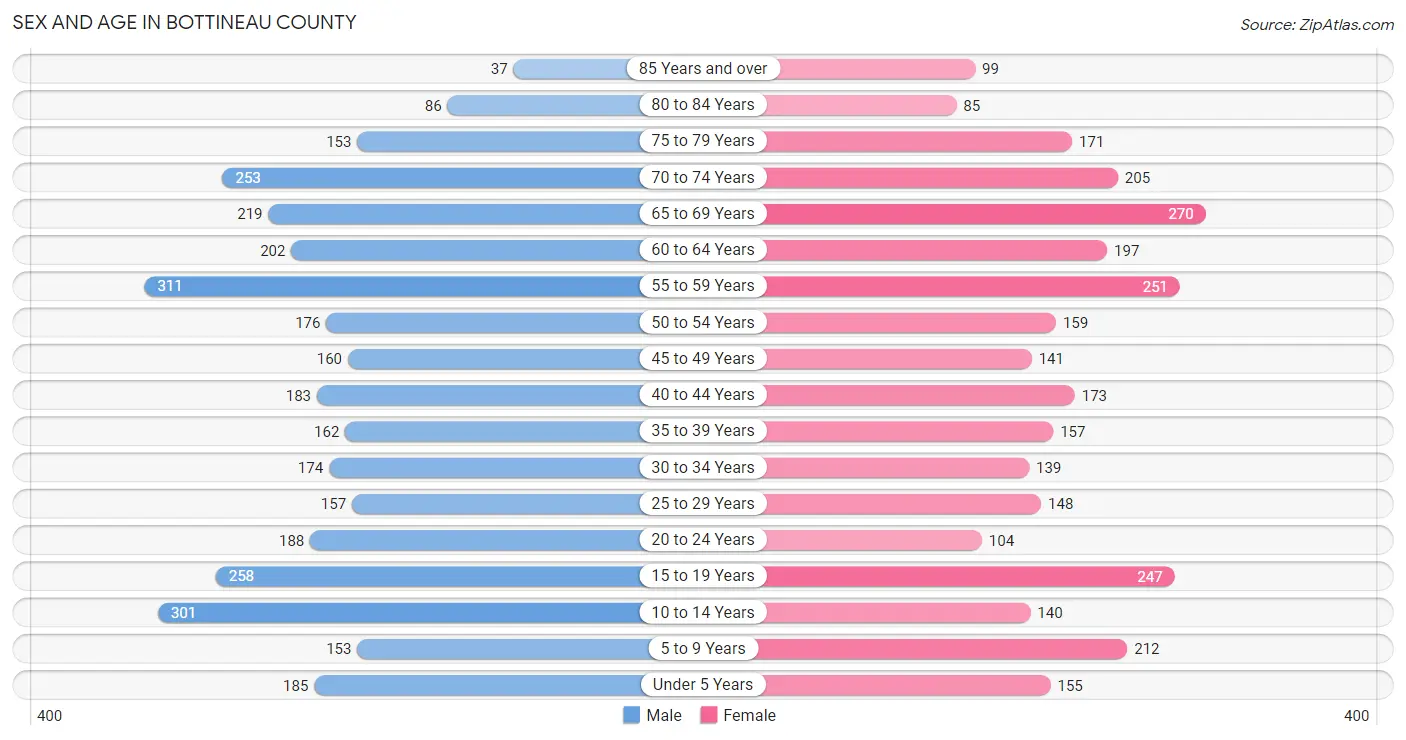
| Age Bracket | Male | Female |
| Under 5 Years | 185 (5.5%) | 155 (5.1%) |
| 5 to 9 Years | 153 (4.6%) | 212 (6.9%) |
| 10 to 14 Years | 301 (9.0%) | 140 (4.6%) |
| 15 to 19 Years | 258 (7.7%) | 247 (8.1%) |
| 20 to 24 Years | 188 (5.6%) | 104 (3.4%) |
| 25 to 29 Years | 157 (4.7%) | 148 (4.9%) |
| 30 to 34 Years | 174 (5.2%) | 139 (4.5%) |
| 35 to 39 Years | 162 (4.8%) | 157 (5.1%) |
| 40 to 44 Years | 183 (5.4%) | 173 (5.7%) |
| 45 to 49 Years | 160 (4.8%) | 141 (4.6%) |
| 50 to 54 Years | 176 (5.2%) | 159 (5.2%) |
| 55 to 59 Years | 311 (9.3%) | 251 (8.2%) |
| 60 to 64 Years | 202 (6.0%) | 197 (6.5%) |
| 65 to 69 Years | 219 (6.5%) | 270 (8.8%) |
| 70 to 74 Years | 253 (7.5%) | 205 (6.7%) |
| 75 to 79 Years | 153 (4.6%) | 171 (5.6%) |
| 80 to 84 Years | 86 (2.6%) | 85 (2.8%) |
| 85 Years and over | 37 (1.1%) | 99 (3.2%) |
| Total | 3,358 (100.0%) | 3,053 (100.0%) |
Families and Households in Bottineau County
Median Family Size in Bottineau County
The median family size in Bottineau County is 3.06 persons per family, with single female/mother families (141 | 8.8%) accounting for the largest median family size of 4.11 persons per family. On the other hand, married-couple families (1,388 | 87.0%) represent the smallest median family size with 2.92 persons per family.
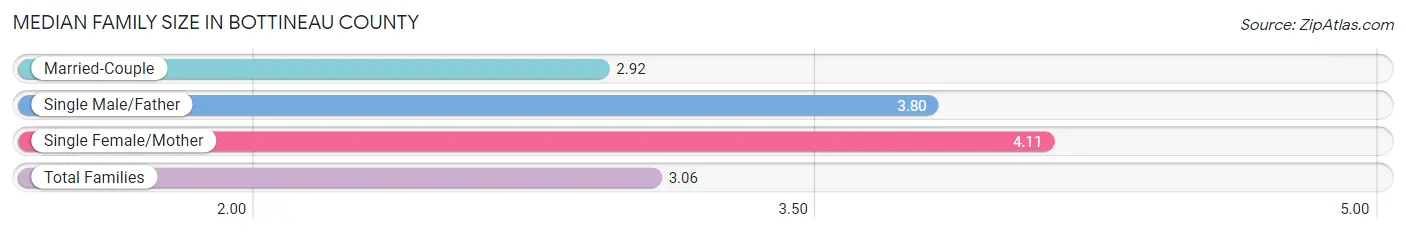
| Family Type | # Families | Family Size |
| Married-Couple | 1,388 (87.0%) | 2.92 |
| Single Male/Father | 66 (4.1%) | 3.80 |
| Single Female/Mother | 141 (8.8%) | 4.11 |
| Total Families | 1,595 (100.0%) | 3.06 |
Median Household Size in Bottineau County
The median household size in Bottineau County is 2.34 persons per household, with single female/mother households (141 | 5.4%) accounting for the largest median household size of 4.37 persons per household. non-family households (1,018 | 39.0%) represent the smallest median household size with 1.17 persons per household.
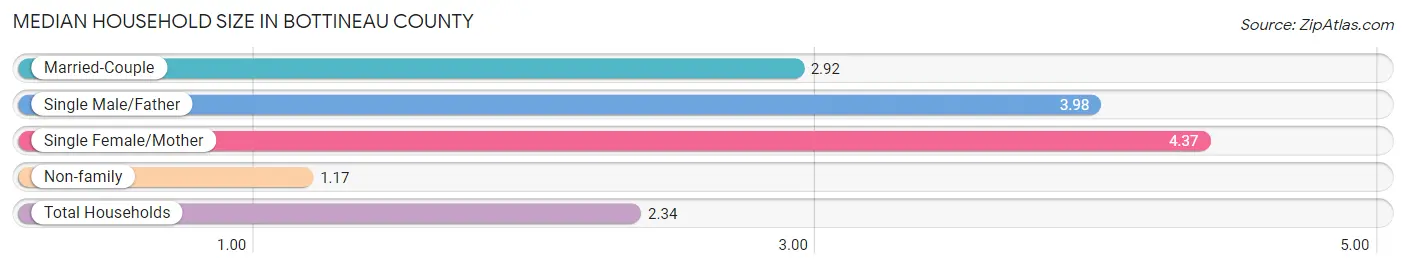
| Household Type | # Households | Household Size |
| Married-Couple | 1,388 (53.1%) | 2.92 |
| Single Male/Father | 66 (2.5%) | 3.98 |
| Single Female/Mother | 141 (5.4%) | 4.37 |
| Non-family | 1,018 (39.0%) | 1.17 |
| Total Households | 2,613 (100.0%) | 2.34 |
Household Size by Marriage Status in Bottineau County
Out of a total of 2,613 households in Bottineau County, 1,595 (61.0%) are family households, while 1,018 (39.0%) are nonfamily households. The most numerous type of family households are 2-person households, comprising 938, and the most common type of nonfamily households are 1-person households, comprising 904.
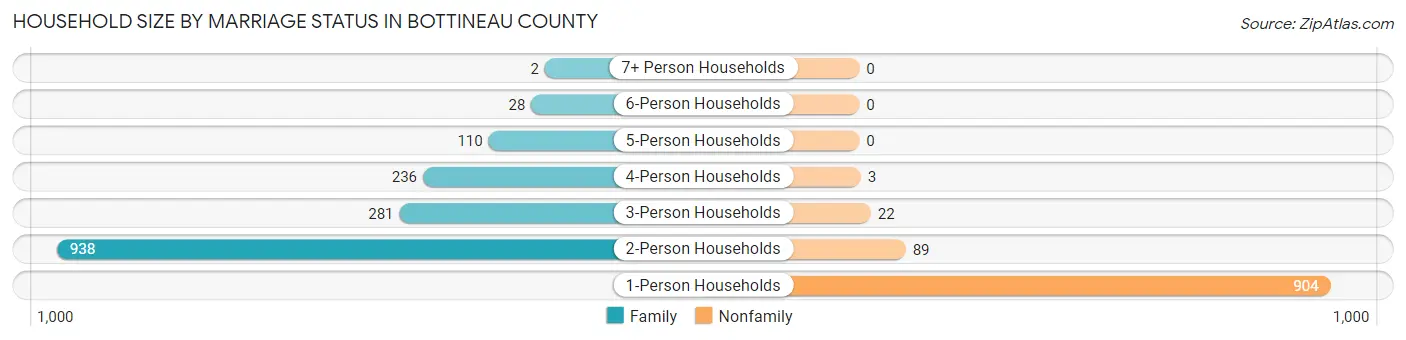
| Household Size | Family Households | Nonfamily Households |
| 1-Person Households | - | 904 (34.6%) |
| 2-Person Households | 938 (35.9%) | 89 (3.4%) |
| 3-Person Households | 281 (10.7%) | 22 (0.8%) |
| 4-Person Households | 236 (9.0%) | 3 (0.1%) |
| 5-Person Households | 110 (4.2%) | 0 (0.0%) |
| 6-Person Households | 28 (1.1%) | 0 (0.0%) |
| 7+ Person Households | 2 (0.1%) | 0 (0.0%) |
| Total | 1,595 (61.0%) | 1,018 (39.0%) |
Female Fertility in Bottineau County
Fertility by Age in Bottineau County
Average fertility rate in Bottineau County is 65.0 births per 1,000 women. Women in the age bracket of 20 to 34 years have the highest fertility rate with 115.0 births per 1,000 women. Women in the age bracket of 20 to 34 years acount for 61.6% of all women with births.
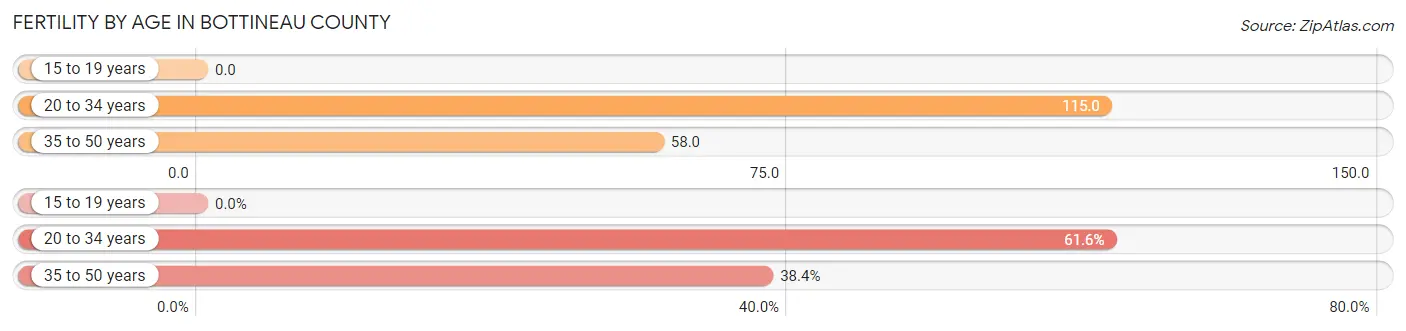
| Age Bracket | Women with Births | Births / 1,000 Women |
| 15 to 19 years | 0 (0.0%) | 0.0 |
| 20 to 34 years | 45 (61.6%) | 115.0 |
| 35 to 50 years | 28 (38.4%) | 58.0 |
| Total | 73 (100.0%) | 65.0 |
Fertility by Age by Marriage Status in Bottineau County
68.5% of women with births (73) in Bottineau County are married. The highest percentage of unmarried women with births falls into 20 to 34 years age bracket with 51.1% of them unmarried at the time of birth, while the lowest percentage of unmarried women with births belong to 35 to 50 years age bracket with 0.0% of them unmarried.
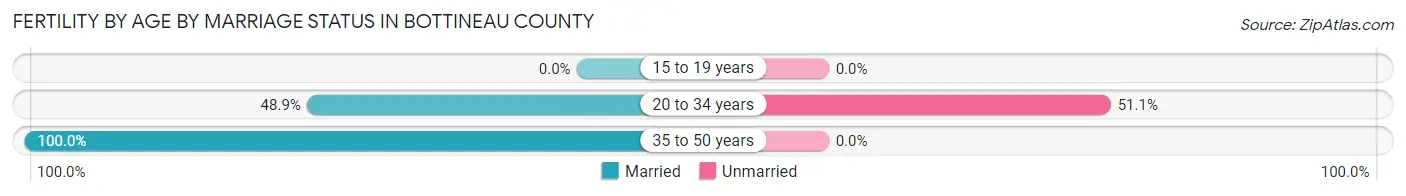
| Age Bracket | Married | Unmarried |
| 15 to 19 years | 0 (0.0%) | 0 (0.0%) |
| 20 to 34 years | 22 (48.9%) | 23 (51.1%) |
| 35 to 50 years | 28 (100.0%) | 0 (0.0%) |
| Total | 50 (68.5%) | 23 (31.5%) |
Fertility by Education in Bottineau County
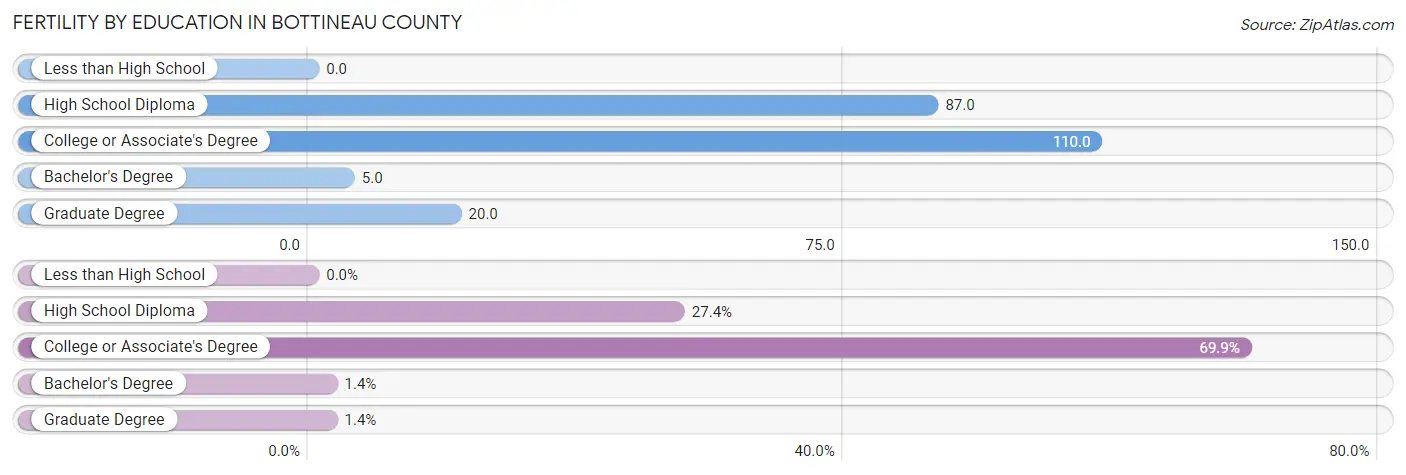
| Educational Attainment | Women with Births | Births / 1,000 Women |
| Less than High School | 0 (0.0%) | 0.0 |
| High School Diploma | 20 (27.4%) | 87.0 |
| College or Associate's Degree | 51 (69.9%) | 110.0 |
| Bachelor's Degree | 1 (1.4%) | 5.0 |
| Graduate Degree | 1 (1.4%) | 20.0 |
| Total | 73 (100.0%) | 65.0 |
Fertility by Education by Marriage Status in Bottineau County
31.5% of women with births in Bottineau County are unmarried. Women with the educational attainment of bachelor's degree are most likely to be married with 100.0% of them married at childbirth, while women with the educational attainment of college or associate's degree are least likely to be married with 43.1% of them unmarried at childbirth.
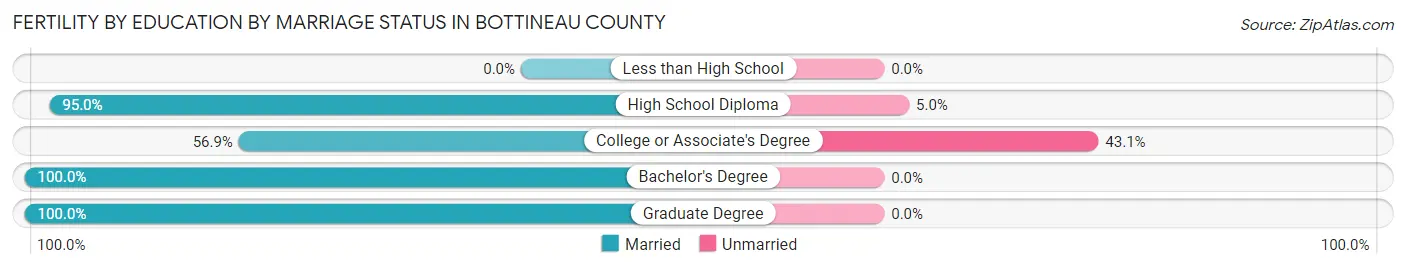
| Educational Attainment | Married | Unmarried |
| Less than High School | 0 (0.0%) | 0 (0.0%) |
| High School Diploma | 19 (95.0%) | 1 (5.0%) |
| College or Associate's Degree | 29 (56.9%) | 22 (43.1%) |
| Bachelor's Degree | 1 (100.0%) | 0 (0.0%) |
| Graduate Degree | 1 (100.0%) | 0 (0.0%) |
| Total | 50 (68.5%) | 23 (31.5%) |
Income in Bottineau County
Income Overview in Bottineau County
Per Capita Income in Bottineau County is $45,506, while median incomes of families and households are $101,422 and $80,113 respectively.
| Characteristic | Number | Measure |
| Per Capita Income | 6,411 | $45,506 |
| Median Family Income | 1,595 | $101,422 |
| Mean Family Income | 1,595 | $132,869 |
| Median Household Income | 2,613 | $80,113 |
| Mean Household Income | 2,613 | $104,957 |
| Income Deficit | 1,595 | $0 |
| Wage / Income Gap (%) | 6,411 | 43.29% |
| Wage / Income Gap ($) | 6,411 | 56.71¢ per $1 |
| Gini / Inequality Index | 6,411 | 0.47 |
Earnings by Sex in Bottineau County
Average Earnings in Bottineau County are $41,888, $55,925 for men and $31,715 for women, a difference of 43.3%.
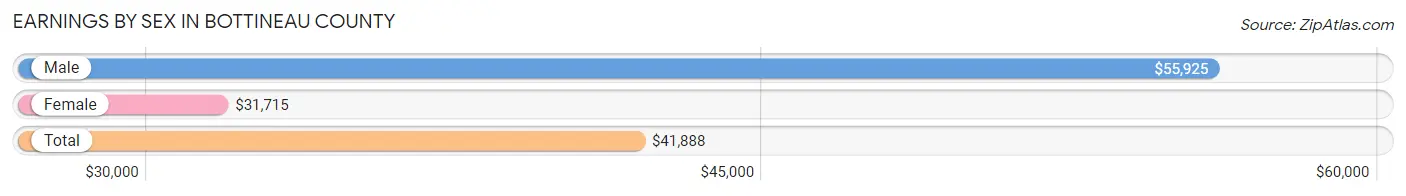
| Sex | Number | Average Earnings |
| Male | 2,021 (57.0%) | $55,925 |
| Female | 1,523 (43.0%) | $31,715 |
| Total | 3,544 (100.0%) | $41,888 |
Earnings by Sex by Income Bracket in Bottineau County
The most common earnings brackets in Bottineau County are $100,000+ for men (395 | 19.5%) and $55,000 to $64,999 for women (155 | 10.2%).
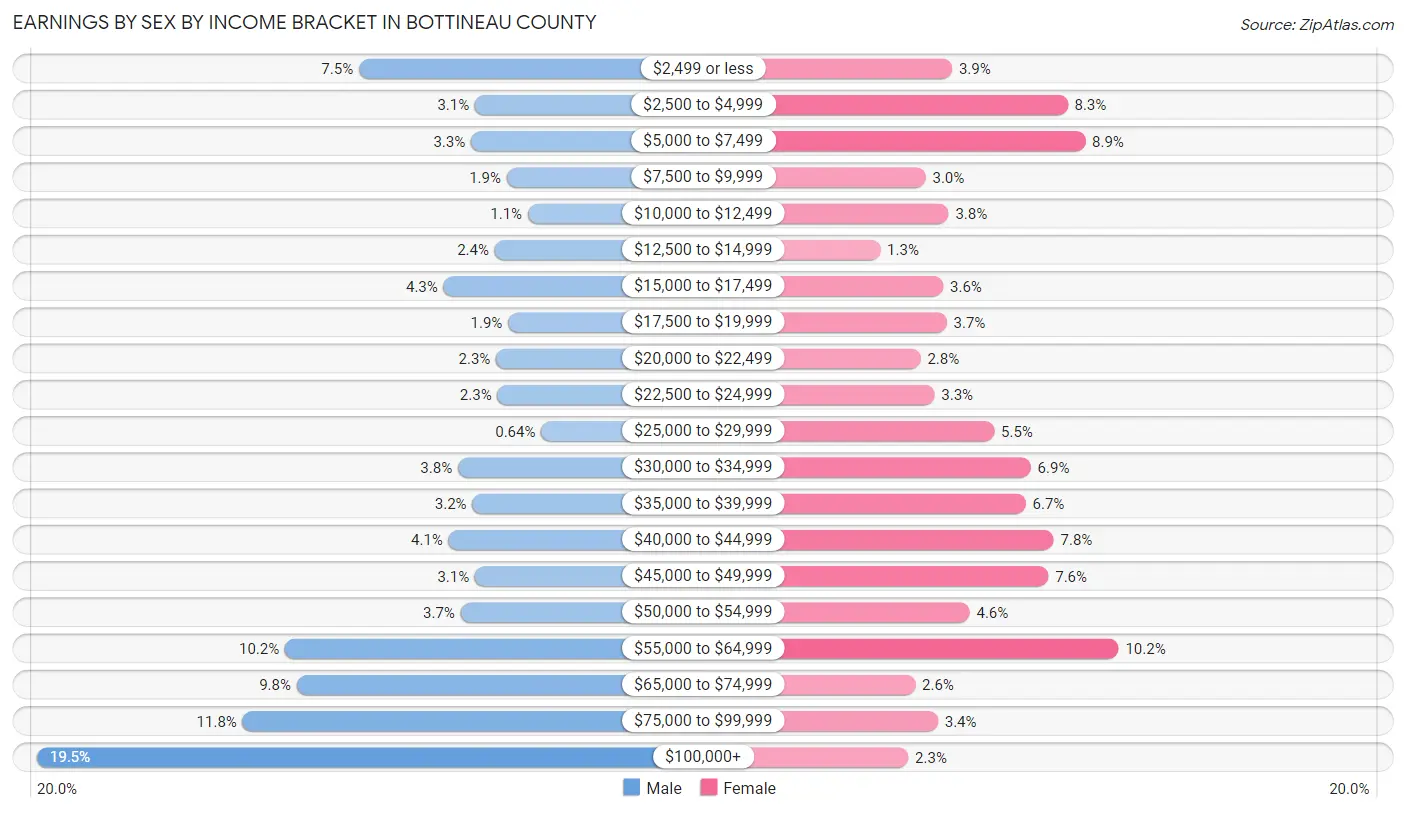
| Income | Male | Female |
| $2,499 or less | 151 (7.5%) | 60 (3.9%) |
| $2,500 to $4,999 | 63 (3.1%) | 126 (8.3%) |
| $5,000 to $7,499 | 66 (3.3%) | 136 (8.9%) |
| $7,500 to $9,999 | 39 (1.9%) | 45 (2.9%) |
| $10,000 to $12,499 | 23 (1.1%) | 58 (3.8%) |
| $12,500 to $14,999 | 48 (2.4%) | 19 (1.3%) |
| $15,000 to $17,499 | 87 (4.3%) | 55 (3.6%) |
| $17,500 to $19,999 | 38 (1.9%) | 57 (3.7%) |
| $20,000 to $22,499 | 47 (2.3%) | 42 (2.8%) |
| $22,500 to $24,999 | 46 (2.3%) | 50 (3.3%) |
| $25,000 to $29,999 | 13 (0.6%) | 84 (5.5%) |
| $30,000 to $34,999 | 76 (3.8%) | 105 (6.9%) |
| $35,000 to $39,999 | 65 (3.2%) | 102 (6.7%) |
| $40,000 to $44,999 | 83 (4.1%) | 118 (7.7%) |
| $45,000 to $49,999 | 63 (3.1%) | 115 (7.5%) |
| $50,000 to $54,999 | 74 (3.7%) | 70 (4.6%) |
| $55,000 to $64,999 | 207 (10.2%) | 155 (10.2%) |
| $65,000 to $74,999 | 198 (9.8%) | 39 (2.6%) |
| $75,000 to $99,999 | 239 (11.8%) | 52 (3.4%) |
| $100,000+ | 395 (19.5%) | 35 (2.3%) |
| Total | 2,021 (100.0%) | 1,523 (100.0%) |
Earnings by Sex by Educational Attainment in Bottineau County
Average earnings in Bottineau County are $63,013 for men and $36,085 for women, a difference of 42.7%. Men with an educational attainment of graduate degree enjoy the highest average annual earnings of $109,205, while those with less than high school education earn the least with $41,458. Women with an educational attainment of bachelor's degree earn the most with the average annual earnings of $49,596, while those with high school diploma education have the smallest earnings of $25,313.
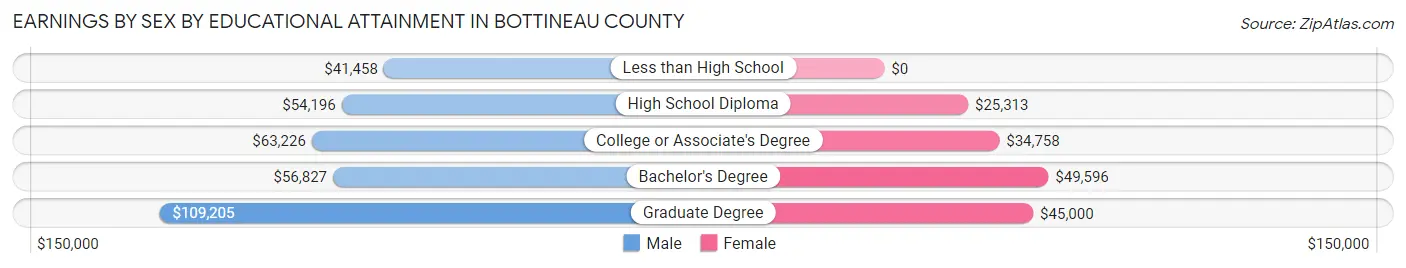
| Educational Attainment | Male Income | Female Income |
| Less than High School | $41,458 | $0 |
| High School Diploma | $54,196 | $25,313 |
| College or Associate's Degree | $63,226 | $34,758 |
| Bachelor's Degree | $56,827 | $49,596 |
| Graduate Degree | $109,205 | $45,000 |
| Total | $63,013 | $36,085 |
Family Income in Bottineau County
Family Income Brackets in Bottineau County
According to the Bottineau County family income data, there are 431 families falling into the $100,000 to $149,999 income range, which is the most common income bracket and makes up 27.0% of all families. Conversely, the $10,000 to $14,999 income bracket is the least frequent group with only 14 families (0.9%) belonging to this category.
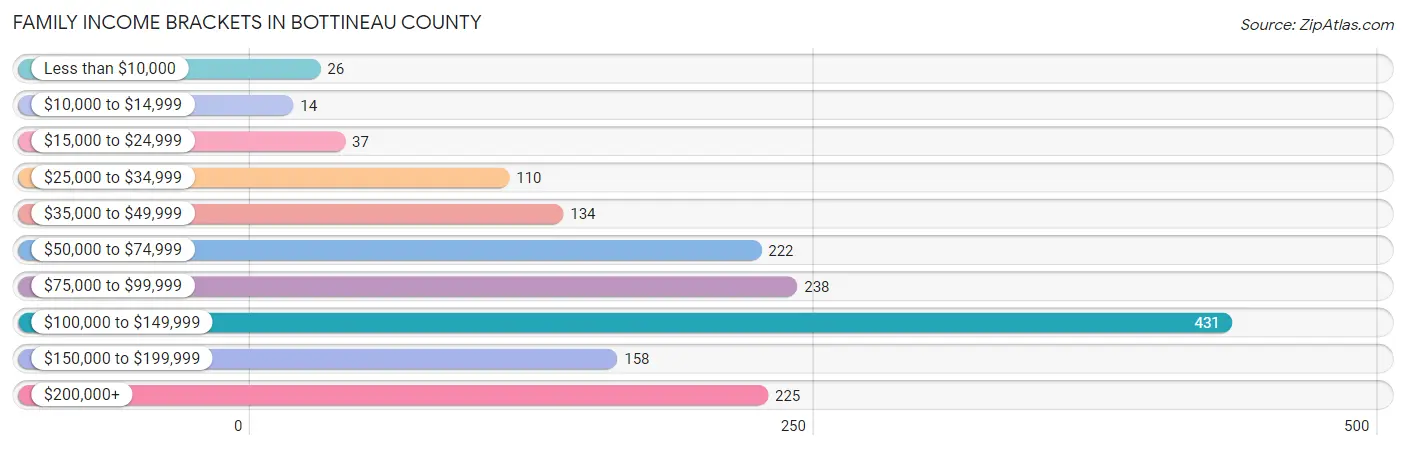
| Income Bracket | # Families | % Families |
| Less than $10,000 | 26 | 1.6% |
| $10,000 to $14,999 | 14 | 0.9% |
| $15,000 to $24,999 | 37 | 2.3% |
| $25,000 to $34,999 | 110 | 6.9% |
| $35,000 to $49,999 | 134 | 8.4% |
| $50,000 to $74,999 | 222 | 13.9% |
| $75,000 to $99,999 | 238 | 14.9% |
| $100,000 to $149,999 | 431 | 27.0% |
| $150,000 to $199,999 | 158 | 9.9% |
| $200,000+ | 225 | 14.1% |
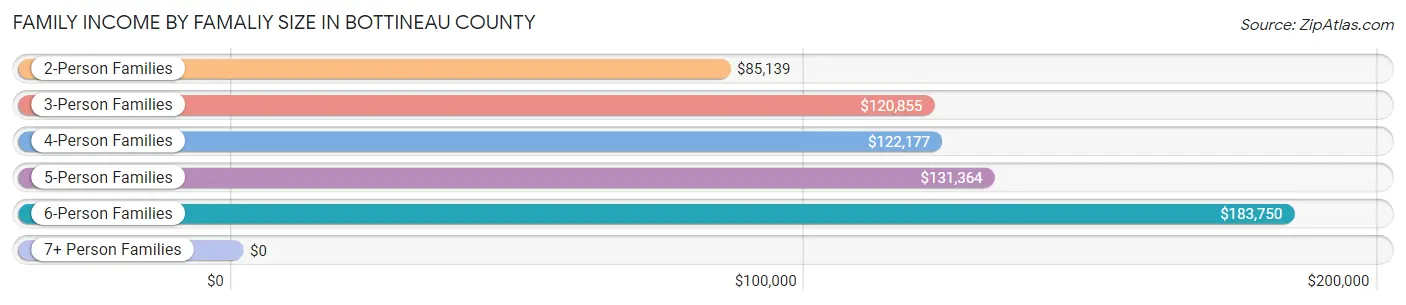
Family Income by Famaliy Size in Bottineau County
6-person families (26 | 1.6%) account for the highest median family income in Bottineau County with $183,750 per family, while 2-person families (961 | 60.3%) have the highest median income of $42,570 per family member.
| Income Bracket | # Families | Median Income |
| 2-Person Families | 961 (60.3%) | $85,139 |
| 3-Person Families | 268 (16.8%) | $120,855 |
| 4-Person Families | 232 (14.5%) | $122,177 |
| 5-Person Families | 106 (6.7%) | $131,364 |
| 6-Person Families | 26 (1.6%) | $183,750 |
| 7+ Person Families | 2 (0.1%) | $0 |
| Total | 1,595 (100.0%) | $101,422 |
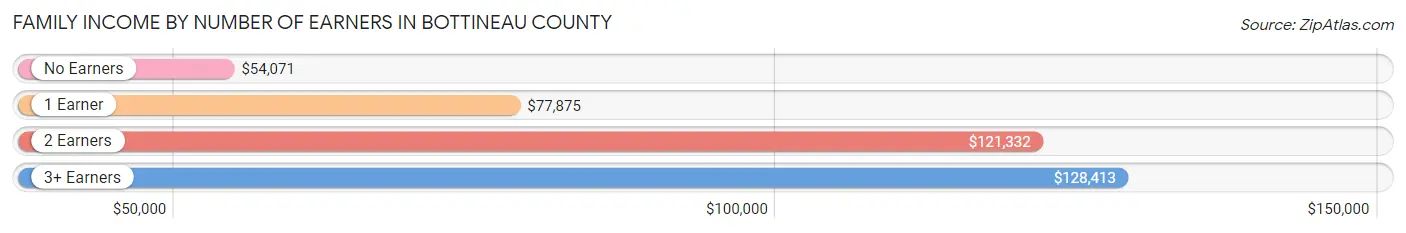
Family Income by Number of Earners in Bottineau County
The median family income in Bottineau County is $101,422, with families comprising 3+ earners (143) having the highest median family income of $128,413, while families with no earners (326) have the lowest median family income of $54,071, accounting for 9.0% and 20.4% of families, respectively.
| Number of Earners | # Families | Median Income |
| No Earners | 326 (20.4%) | $54,071 |
| 1 Earner | 363 (22.8%) | $77,875 |
| 2 Earners | 763 (47.8%) | $121,332 |
| 3+ Earners | 143 (9.0%) | $128,413 |
| Total | 1,595 (100.0%) | $101,422 |
Household Income in Bottineau County
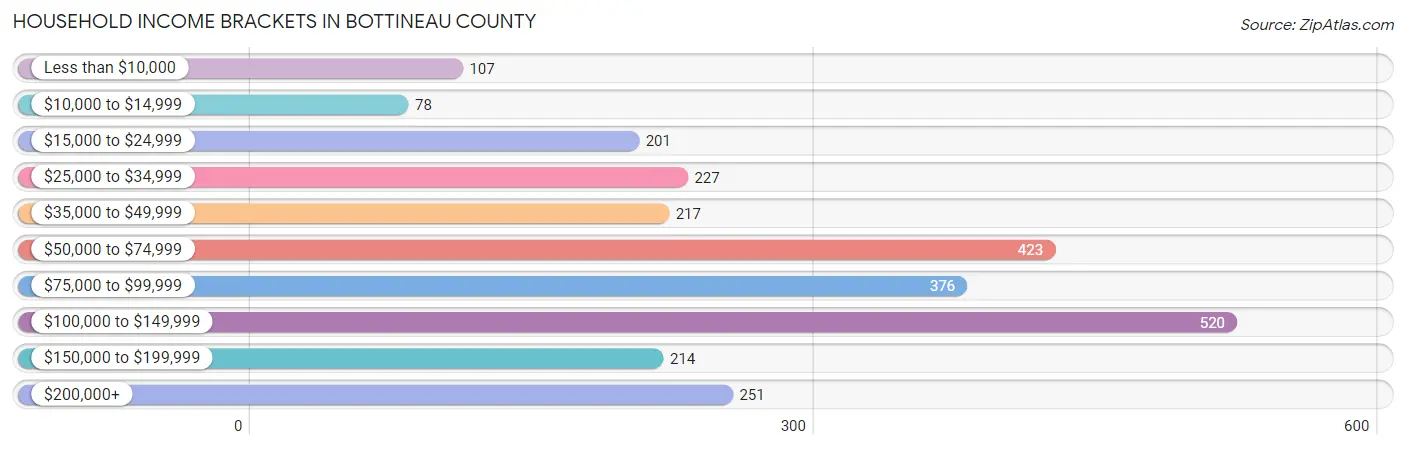
Household Income Brackets in Bottineau County
With 520 households falling in the category, the $100,000 to $149,999 income range is the most frequent in Bottineau County, accounting for 19.9% of all households. In contrast, only 78 households (3.0%) fall into the $10,000 to $14,999 income bracket, making it the least populous group.
| Income Bracket | # Households | % Households |
| Less than $10,000 | 107 | 4.1% |
| $10,000 to $14,999 | 78 | 3.0% |
| $15,000 to $24,999 | 201 | 7.7% |
| $25,000 to $34,999 | 227 | 8.7% |
| $35,000 to $49,999 | 217 | 8.3% |
| $50,000 to $74,999 | 423 | 16.2% |
| $75,000 to $99,999 | 376 | 14.4% |
| $100,000 to $149,999 | 520 | 19.9% |
| $150,000 to $199,999 | 214 | 8.2% |
| $200,000+ | 251 | 9.6% |
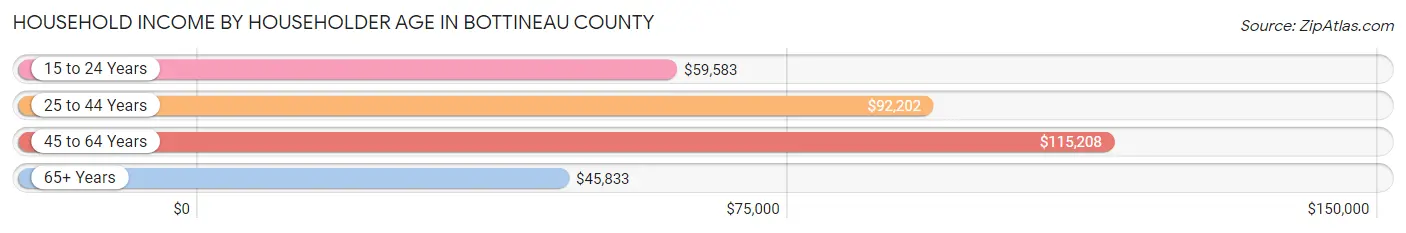
Household Income by Householder Age in Bottineau County
The median household income in Bottineau County is $80,113, with the highest median household income of $115,208 found in the 45 to 64 years age bracket for the primary householder. A total of 865 households (33.1%) fall into this category. Meanwhile, the 65+ years age bracket for the primary householder has the lowest median household income of $45,833, with 976 households (37.3%) in this group.
| Income Bracket | # Households | Median Income |
| 15 to 24 Years | 45 (1.7%) | $59,583 |
| 25 to 44 Years | 727 (27.8%) | $92,202 |
| 45 to 64 Years | 865 (33.1%) | $115,208 |
| 65+ Years | 976 (37.3%) | $45,833 |
| Total | 2,613 (100.0%) | $80,113 |
Poverty in Bottineau County
Income Below Poverty by Sex and Age in Bottineau County
With 7.4% poverty level for males and 9.0% for females among the residents of Bottineau County, 6 to 11 year old males and 18 to 24 year old females are the most vulnerable to poverty, with 36 males (19.8%) and 77 females (45.3%) in their respective age groups living below the poverty level.
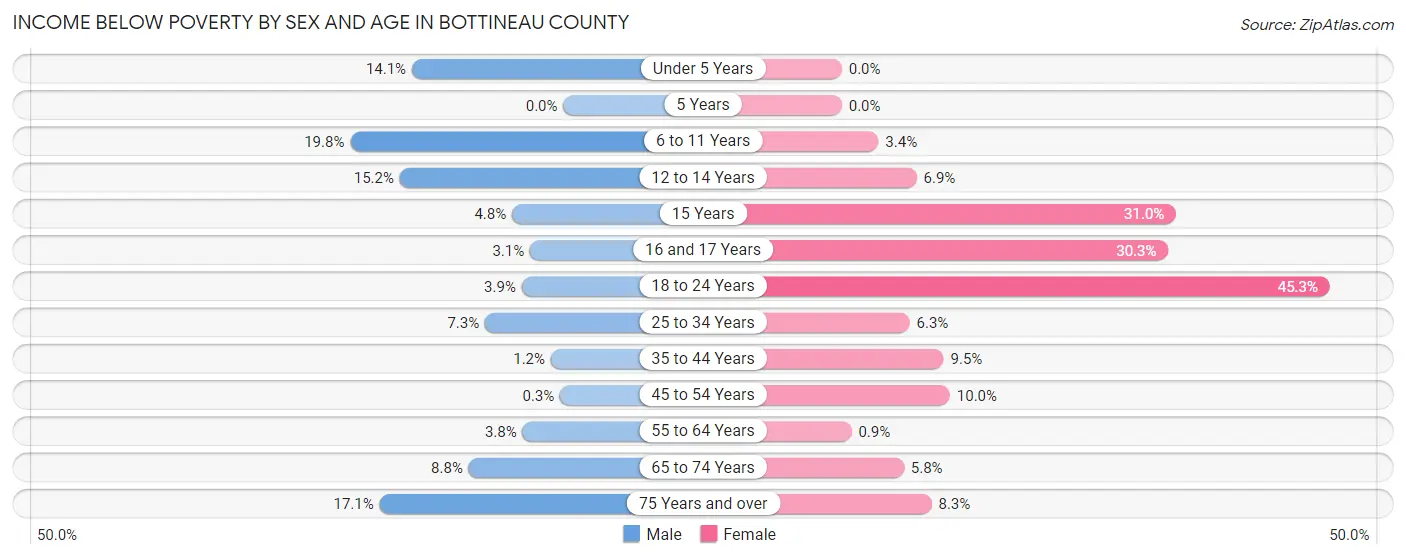
| Age Bracket | Male | Female |
| Under 5 Years | 26 (14.1%) | 0 (0.0%) |
| 5 Years | 0 (0.0%) | 0 (0.0%) |
| 6 to 11 Years | 36 (19.8%) | 8 (3.4%) |
| 12 to 14 Years | 29 (15.2%) | 5 (6.9%) |
| 15 Years | 1 (4.8%) | 9 (31.0%) |
| 16 and 17 Years | 3 (3.1%) | 30 (30.3%) |
| 18 to 24 Years | 8 (3.9%) | 77 (45.3%) |
| 25 to 34 Years | 24 (7.3%) | 18 (6.3%) |
| 35 to 44 Years | 4 (1.2%) | 31 (9.5%) |
| 45 to 54 Years | 1 (0.3%) | 30 (10.0%) |
| 55 to 64 Years | 19 (3.8%) | 4 (0.9%) |
| 65 to 74 Years | 41 (8.8%) | 27 (5.8%) |
| 75 Years and over | 43 (17.1%) | 25 (8.3%) |
| Total | 235 (7.4%) | 264 (9.0%) |
Income Above Poverty by Sex and Age in Bottineau County
According to the poverty statistics in Bottineau County, males aged 5 years and females aged under 5 years are the age groups that are most secure financially, with 100.0% of males and 100.0% of females in these age groups living above the poverty line.
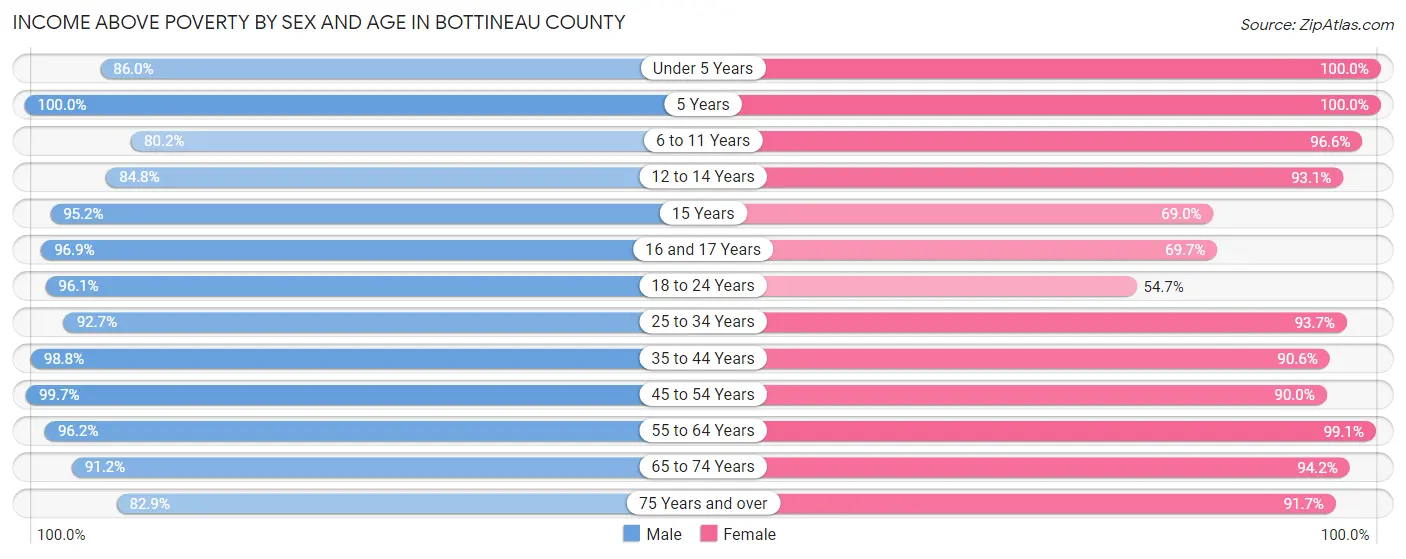
| Age Bracket | Male | Female |
| Under 5 Years | 159 (86.0%) | 155 (100.0%) |
| 5 Years | 50 (100.0%) | 42 (100.0%) |
| 6 to 11 Years | 146 (80.2%) | 227 (96.6%) |
| 12 to 14 Years | 162 (84.8%) | 67 (93.1%) |
| 15 Years | 20 (95.2%) | 20 (69.0%) |
| 16 and 17 Years | 94 (96.9%) | 69 (69.7%) |
| 18 to 24 Years | 199 (96.1%) | 93 (54.7%) |
| 25 to 34 Years | 306 (92.7%) | 268 (93.7%) |
| 35 to 44 Years | 340 (98.8%) | 297 (90.5%) |
| 45 to 54 Years | 331 (99.7%) | 269 (90.0%) |
| 55 to 64 Years | 482 (96.2%) | 442 (99.1%) |
| 65 to 74 Years | 426 (91.2%) | 442 (94.2%) |
| 75 Years and over | 209 (82.9%) | 275 (91.7%) |
| Total | 2,924 (92.6%) | 2,666 (91.0%) |
Income Below Poverty Among Married-Couple Families in Bottineau County
The poverty statistics for married-couple families in Bottineau County show that 0.4% or 6 of the total 1,388 families live below the poverty line. Families with 3 or 4 children have the highest poverty rate of 4.2%, comprising of 4 families. On the other hand, families with 1 or 2 children have the lowest poverty rate of 0.0%, which includes 0 families.
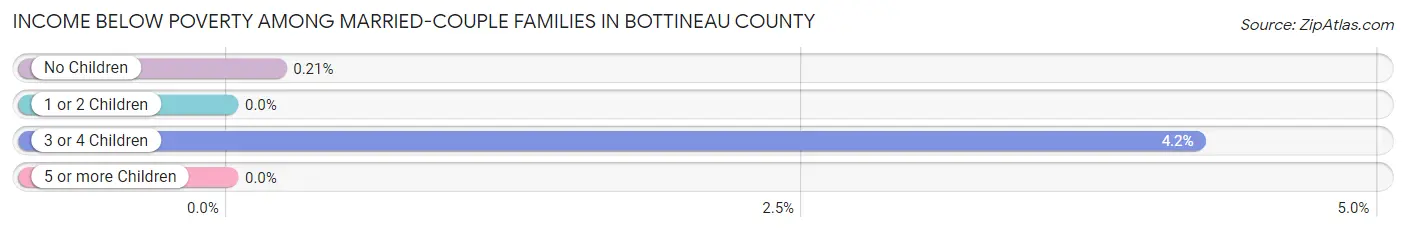
| Children | Above Poverty | Below Poverty |
| No Children | 952 (99.8%) | 2 (0.2%) |
| 1 or 2 Children | 337 (100.0%) | 0 (0.0%) |
| 3 or 4 Children | 91 (95.8%) | 4 (4.2%) |
| 5 or more Children | 2 (100.0%) | 0 (0.0%) |
| Total | 1,382 (99.6%) | 6 (0.4%) |
Income Below Poverty Among Single-Parent Households in Bottineau County
According to the poverty data in Bottineau County, 12.1% or 8 single-father households and 31.2% or 44 single-mother households are living below the poverty line. Among single-father households, those with 3 or 4 children have the highest poverty rate, with 1 households (33.3%) experiencing poverty. Likewise, among single-mother households, those with 3 or 4 children have the highest poverty rate, with 7 households (100.0%) falling below the poverty line.
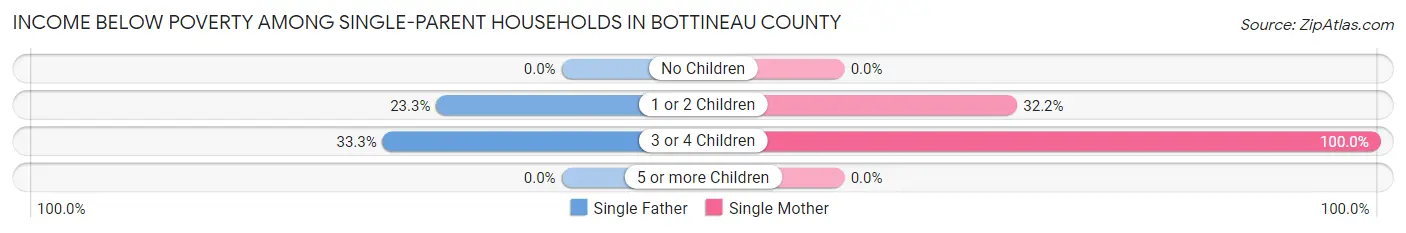
| Children | Single Father | Single Mother |
| No Children | 0 (0.0%) | 0 (0.0%) |
| 1 or 2 Children | 7 (23.3%) | 37 (32.2%) |
| 3 or 4 Children | 1 (33.3%) | 7 (100.0%) |
| 5 or more Children | 0 (0.0%) | 0 (0.0%) |
| Total | 8 (12.1%) | 44 (31.2%) |
Income Below Poverty Among Married-Couple vs Single-Parent Households in Bottineau County
The poverty data for Bottineau County shows that 6 of the married-couple family households (0.4%) and 52 of the single-parent households (25.1%) are living below the poverty level. Within the married-couple family households, those with 3 or 4 children have the highest poverty rate, with 4 households (4.2%) falling below the poverty line. Among the single-parent households, those with 3 or 4 children have the highest poverty rate, with 8 household (80.0%) living below poverty.
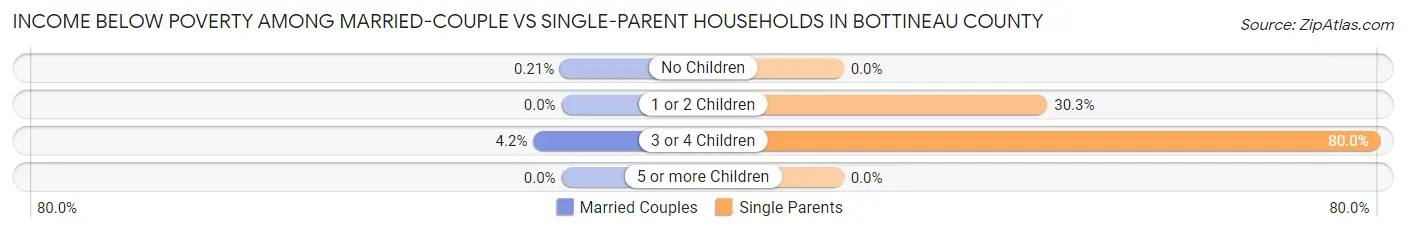
| Children | Married-Couple Families | Single-Parent Households |
| No Children | 2 (0.2%) | 0 (0.0%) |
| 1 or 2 Children | 0 (0.0%) | 44 (30.3%) |
| 3 or 4 Children | 4 (4.2%) | 8 (80.0%) |
| 5 or more Children | 0 (0.0%) | 0 (0.0%) |
| Total | 6 (0.4%) | 52 (25.1%) |
Employment Characteristics in Bottineau County
Employment by Class of Employer in Bottineau County
Among the 2,976 employed individuals in Bottineau County, private company employees (1,481 | 49.8%), self-employed (not incorporated) (449 | 15.1%), and local government employees (267 | 9.0%) make up the most common classes of employment.
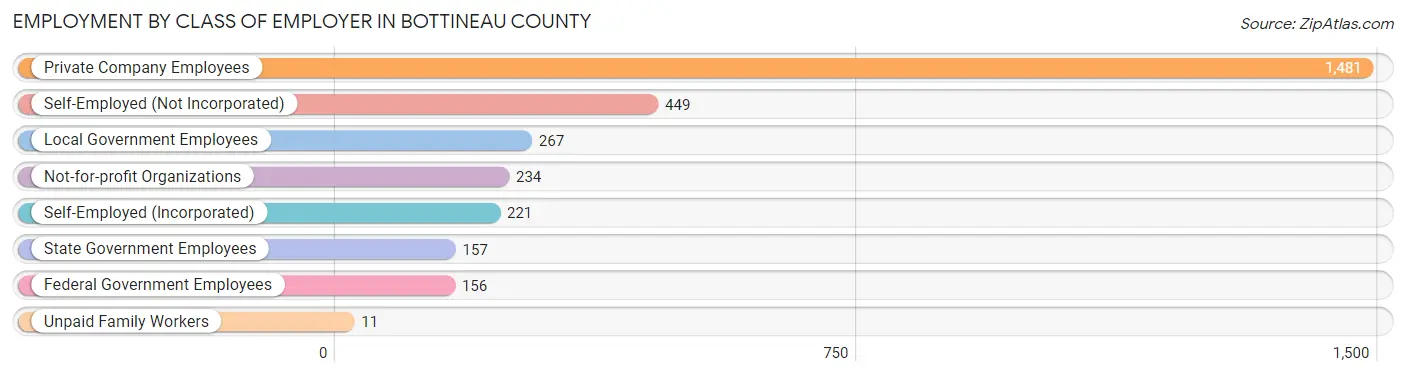
| Employer Class | # Employees | % Employees |
| Private Company Employees | 1,481 | 49.8% |
| Self-Employed (Incorporated) | 221 | 7.4% |
| Self-Employed (Not Incorporated) | 449 | 15.1% |
| Not-for-profit Organizations | 234 | 7.9% |
| Local Government Employees | 267 | 9.0% |
| State Government Employees | 157 | 5.3% |
| Federal Government Employees | 156 | 5.2% |
| Unpaid Family Workers | 11 | 0.4% |
| Total | 2,976 | 100.0% |
Employment Status by Age in Bottineau County
According to the labor force statistics for Bottineau County, out of the total population over 16 years of age (5,215), 61.0% or 3,181 individuals are in the labor force, with 3.5% or 111 of them unemployed. The age group with the highest labor force participation rate is 45 to 54 years, with 91.8% or 584 individuals in the labor force. Within the labor force, the 16 to 19 years age range has the highest percentage of unemployed individuals, with 9.6% or 20 of them being unemployed.
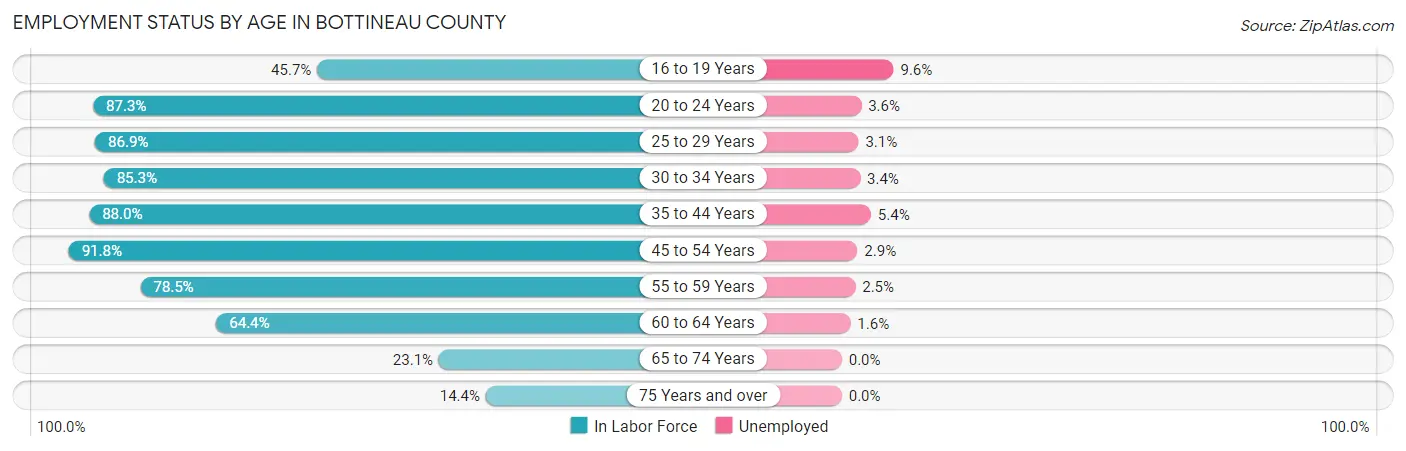
| Age Bracket | In Labor Force | Unemployed |
| 16 to 19 Years | 208 (45.7%) | 20 (9.6%) |
| 20 to 24 Years | 255 (87.3%) | 9 (3.6%) |
| 25 to 29 Years | 265 (86.9%) | 8 (3.1%) |
| 30 to 34 Years | 267 (85.3%) | 9 (3.4%) |
| 35 to 44 Years | 594 (88.0%) | 32 (5.4%) |
| 45 to 54 Years | 584 (91.8%) | 17 (2.9%) |
| 55 to 59 Years | 441 (78.5%) | 11 (2.5%) |
| 60 to 64 Years | 257 (64.4%) | 4 (1.6%) |
| 65 to 74 Years | 219 (23.1%) | 0 (0.0%) |
| 75 Years and over | 91 (14.4%) | 0 (0.0%) |
| Total | 3,181 (61.0%) | 111 (3.5%) |
Employment Status by Educational Attainment in Bottineau County
According to labor force statistics for Bottineau County, 83.3% of individuals (2,407) out of the total population between 25 and 64 years of age (2,890) are in the labor force, with 3.4% or 82 of them being unemployed. The group with the highest labor force participation rate are those with the educational attainment of college / associate degree, with 87.4% or 1,009 individuals in the labor force. Within the labor force, individuals with high school diploma education have the highest percentage of unemployment, with 11.3% or 75 of them being unemployed.
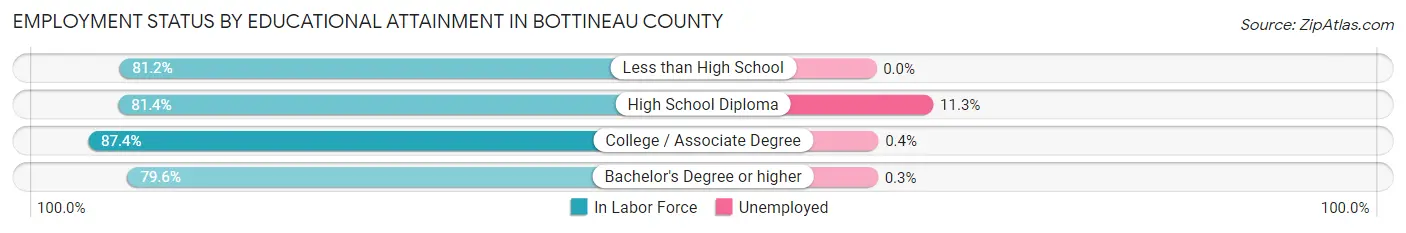
| Educational Attainment | In Labor Force | Unemployed |
| Less than High School | 121 (81.2%) | 0 (0.0%) |
| High School Diploma | 667 (81.4%) | 93 (11.3%) |
| College / Associate Degree | 1,009 (87.4%) | 5 (0.4%) |
| Bachelor's Degree or higher | 611 (79.6%) | 2 (0.3%) |
| Total | 2,407 (83.3%) | 98 (3.4%) |
Employment Occupations by Sex in Bottineau County
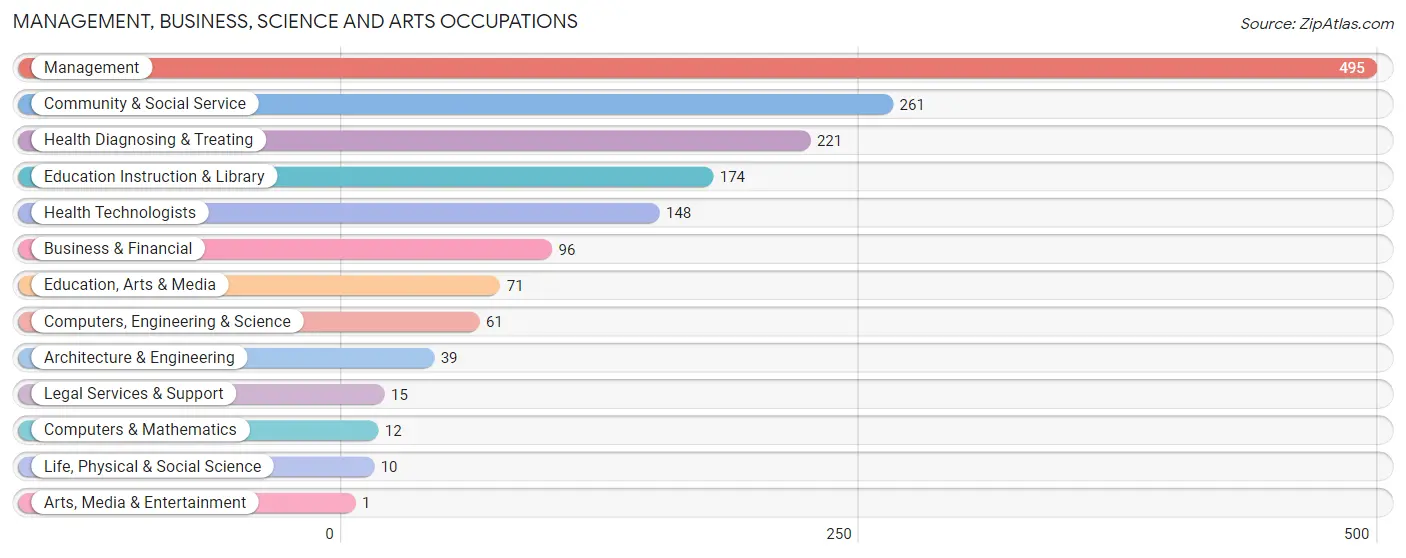
Management, Business, Science and Arts Occupations
The most common Management, Business, Science and Arts occupations in Bottineau County are Management (495 | 16.2%), Community & Social Service (261 | 8.6%), Health Diagnosing & Treating (221 | 7.2%), Education Instruction & Library (174 | 5.7%), and Health Technologists (148 | 4.9%).
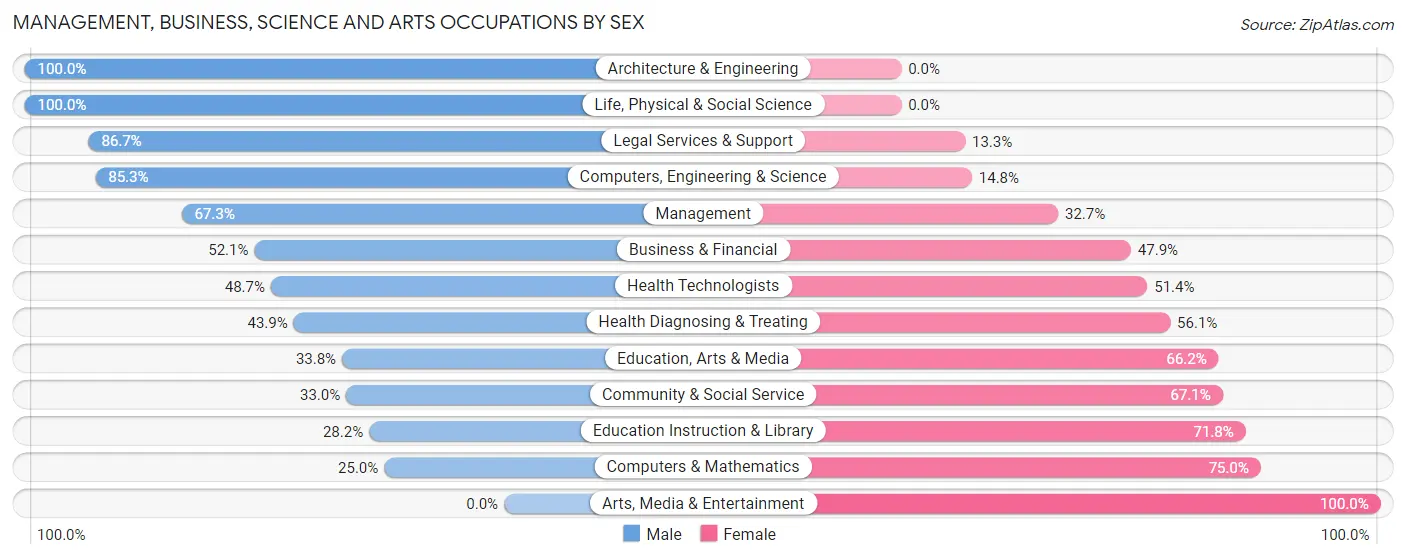
Management, Business, Science and Arts Occupations by Sex
Within the Management, Business, Science and Arts occupations in Bottineau County, the most male-oriented occupations are Architecture & Engineering (100.0%), Life, Physical & Social Science (100.0%), and Legal Services & Support (86.7%), while the most female-oriented occupations are Arts, Media & Entertainment (100.0%), Computers & Mathematics (75.0%), and Education Instruction & Library (71.8%).
| Occupation | Male | Female |
| Management | 333 (67.3%) | 162 (32.7%) |
| Business & Financial | 50 (52.1%) | 46 (47.9%) |
| Computers, Engineering & Science | 52 (85.3%) | 9 (14.7%) |
| Computers & Mathematics | 3 (25.0%) | 9 (75.0%) |
| Architecture & Engineering | 39 (100.0%) | 0 (0.0%) |
| Life, Physical & Social Science | 10 (100.0%) | 0 (0.0%) |
| Community & Social Service | 86 (33.0%) | 175 (67.0%) |
| Education, Arts & Media | 24 (33.8%) | 47 (66.2%) |
| Legal Services & Support | 13 (86.7%) | 2 (13.3%) |
| Education Instruction & Library | 49 (28.2%) | 125 (71.8%) |
| Arts, Media & Entertainment | 0 (0.0%) | 1 (100.0%) |
| Health Diagnosing & Treating | 97 (43.9%) | 124 (56.1%) |
| Health Technologists | 72 (48.6%) | 76 (51.3%) |
| Total (Category) | 618 (54.5%) | 516 (45.5%) |
| Total (Overall) | 1,740 (57.0%) | 1,311 (43.0%) |
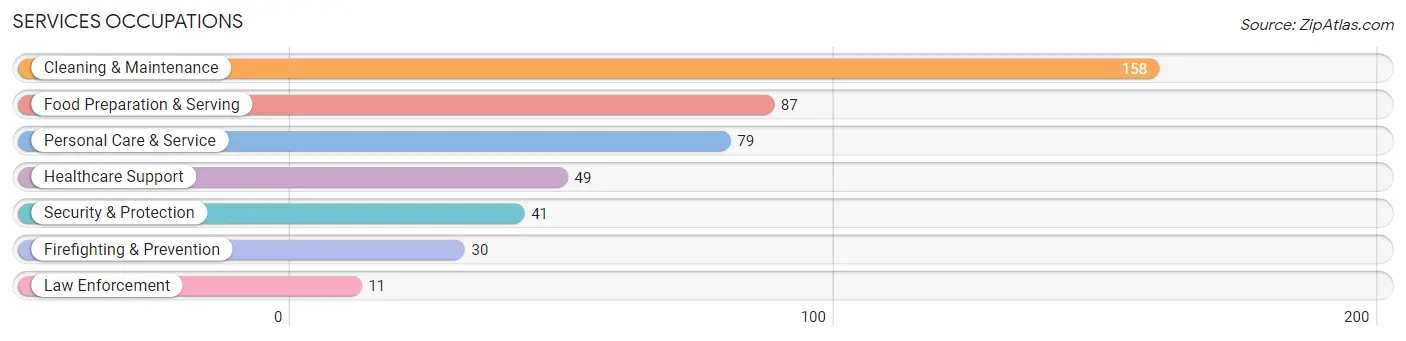
Services Occupations
The most common Services occupations in Bottineau County are Cleaning & Maintenance (158 | 5.2%), Food Preparation & Serving (87 | 2.9%), Personal Care & Service (79 | 2.6%), Healthcare Support (49 | 1.6%), and Security & Protection (41 | 1.3%).
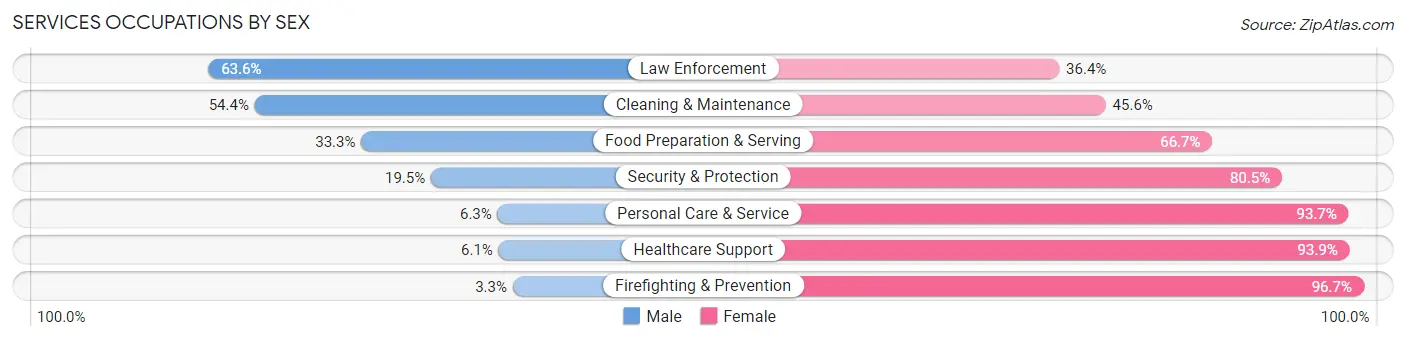
Services Occupations by Sex
Within the Services occupations in Bottineau County, the most male-oriented occupations are Law Enforcement (63.6%), Cleaning & Maintenance (54.4%), and Food Preparation & Serving (33.3%), while the most female-oriented occupations are Firefighting & Prevention (96.7%), Healthcare Support (93.9%), and Personal Care & Service (93.7%).
| Occupation | Male | Female |
| Healthcare Support | 3 (6.1%) | 46 (93.9%) |
| Security & Protection | 8 (19.5%) | 33 (80.5%) |
| Firefighting & Prevention | 1 (3.3%) | 29 (96.7%) |
| Law Enforcement | 7 (63.6%) | 4 (36.4%) |
| Food Preparation & Serving | 29 (33.3%) | 58 (66.7%) |
| Cleaning & Maintenance | 86 (54.4%) | 72 (45.6%) |
| Personal Care & Service | 5 (6.3%) | 74 (93.7%) |
| Total (Category) | 131 (31.6%) | 283 (68.4%) |
| Total (Overall) | 1,740 (57.0%) | 1,311 (43.0%) |
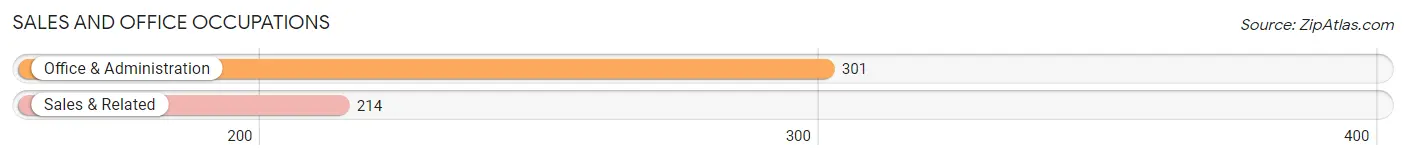
Sales and Office Occupations
The most common Sales and Office occupations in Bottineau County are Office & Administration (301 | 9.9%), and Sales & Related (214 | 7.0%).
Sales and Office Occupations by Sex
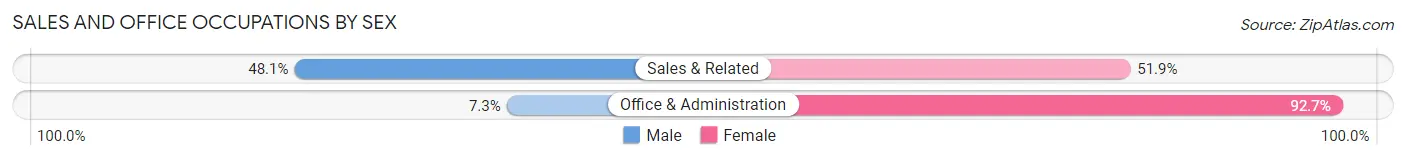
| Occupation | Male | Female |
| Sales & Related | 103 (48.1%) | 111 (51.9%) |
| Office & Administration | 22 (7.3%) | 279 (92.7%) |
| Total (Category) | 125 (24.3%) | 390 (75.7%) |
| Total (Overall) | 1,740 (57.0%) | 1,311 (43.0%) |
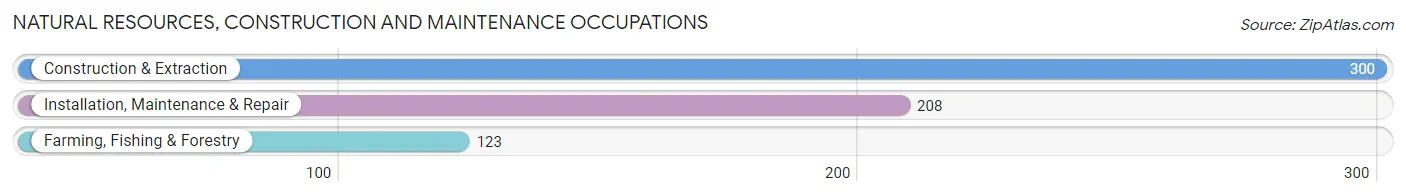
Natural Resources, Construction and Maintenance Occupations
The most common Natural Resources, Construction and Maintenance occupations in Bottineau County are Construction & Extraction (300 | 9.8%), Installation, Maintenance & Repair (208 | 6.8%), and Farming, Fishing & Forestry (123 | 4.0%).
Natural Resources, Construction and Maintenance Occupations by Sex
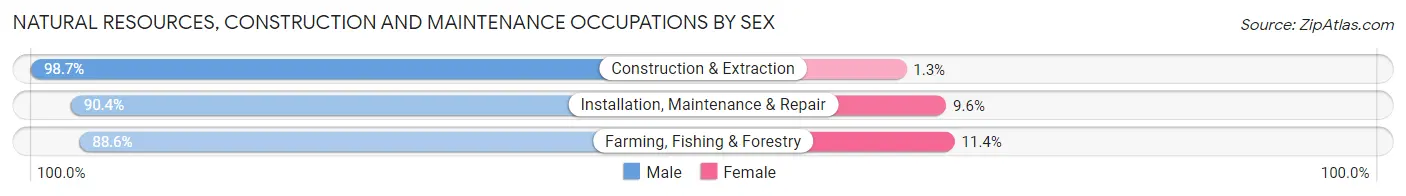
| Occupation | Male | Female |
| Farming, Fishing & Forestry | 109 (88.6%) | 14 (11.4%) |
| Construction & Extraction | 296 (98.7%) | 4 (1.3%) |
| Installation, Maintenance & Repair | 188 (90.4%) | 20 (9.6%) |
| Total (Category) | 593 (94.0%) | 38 (6.0%) |
| Total (Overall) | 1,740 (57.0%) | 1,311 (43.0%) |
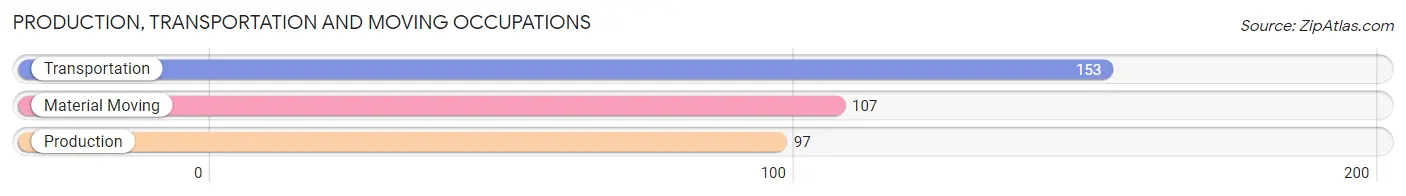
Production, Transportation and Moving Occupations
The most common Production, Transportation and Moving occupations in Bottineau County are Transportation (153 | 5.0%), Material Moving (107 | 3.5%), and Production (97 | 3.2%).
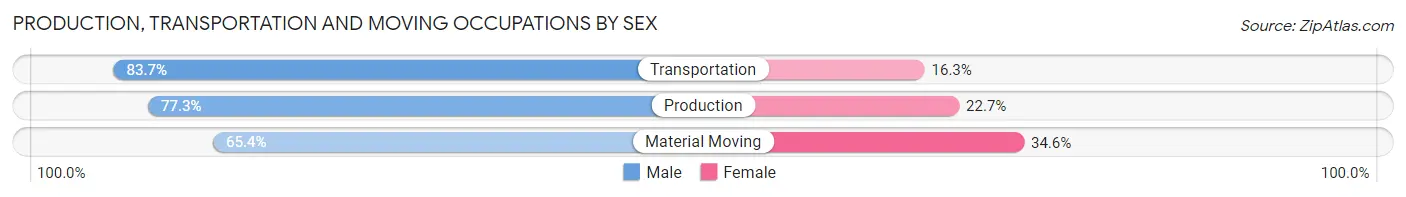
Production, Transportation and Moving Occupations by Sex
| Occupation | Male | Female |
| Production | 75 (77.3%) | 22 (22.7%) |
| Transportation | 128 (83.7%) | 25 (16.3%) |
| Material Moving | 70 (65.4%) | 37 (34.6%) |
| Total (Category) | 273 (76.5%) | 84 (23.5%) |
| Total (Overall) | 1,740 (57.0%) | 1,311 (43.0%) |
Employment Industries by Sex in Bottineau County
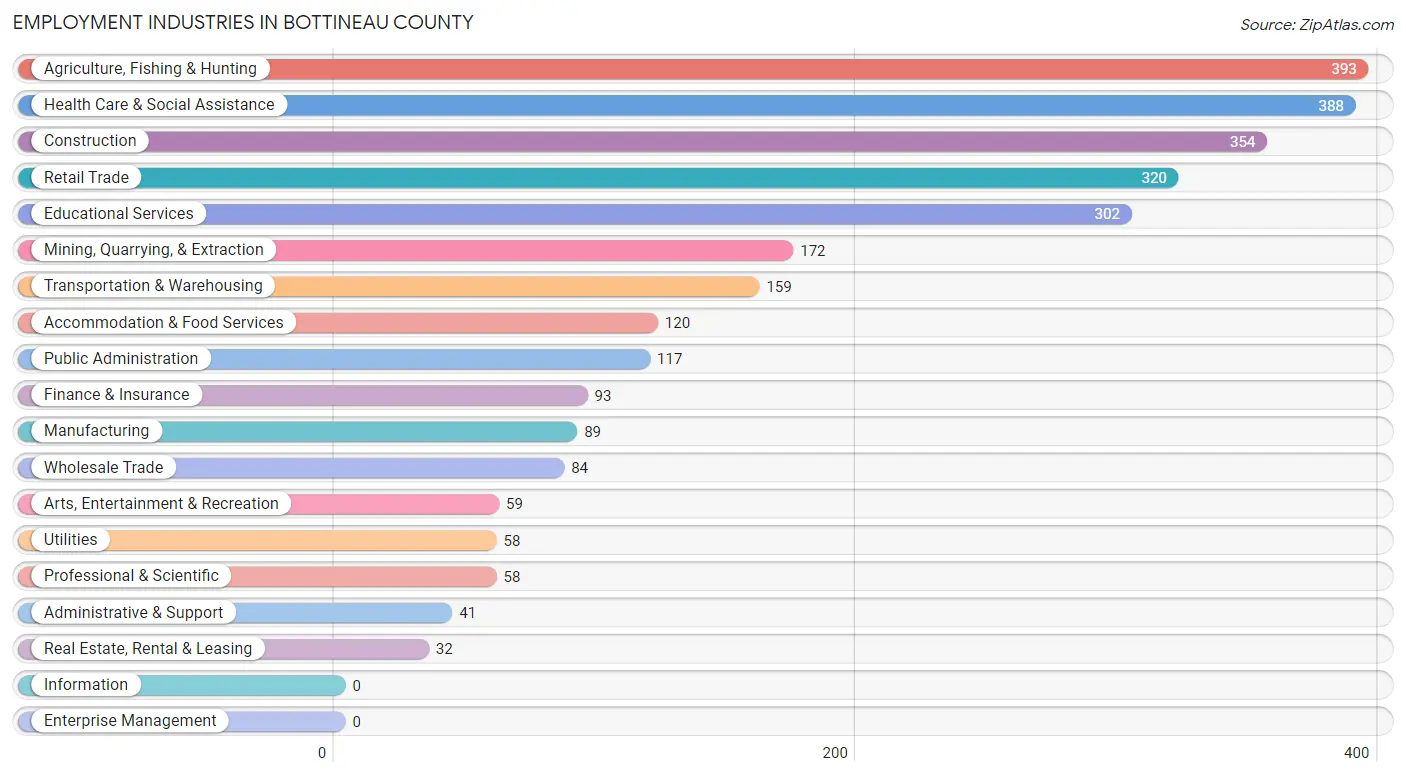
Employment Industries in Bottineau County
The major employment industries in Bottineau County include Agriculture, Fishing & Hunting (393 | 12.9%), Health Care & Social Assistance (388 | 12.7%), Construction (354 | 11.6%), Retail Trade (320 | 10.5%), and Educational Services (302 | 9.9%).
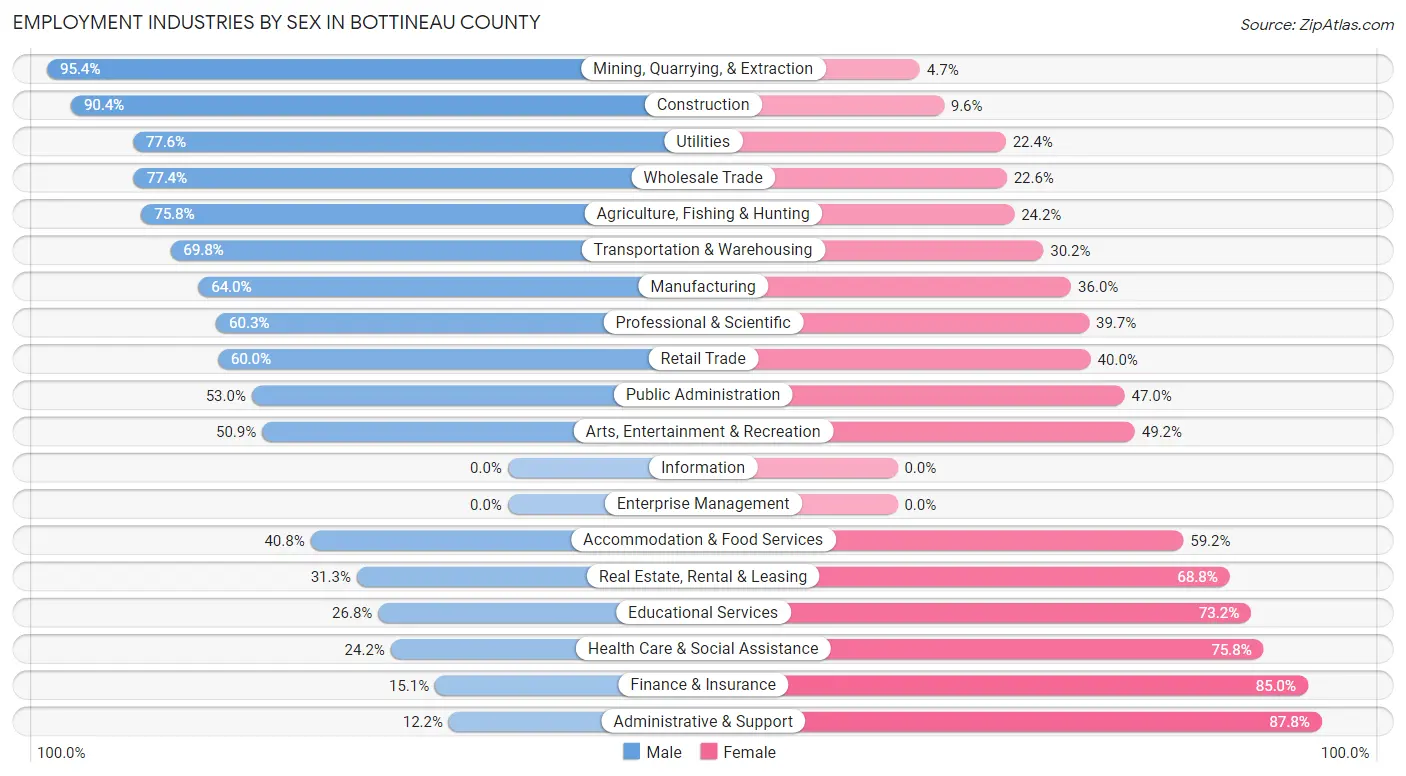
Employment Industries by Sex in Bottineau County
The Bottineau County industries that see more men than women are Mining, Quarrying, & Extraction (95.4%), Construction (90.4%), and Utilities (77.6%), whereas the industries that tend to have a higher number of women are Administrative & Support (87.8%), Finance & Insurance (85.0%), and Health Care & Social Assistance (75.8%).
| Industry | Male | Female |
| Agriculture, Fishing & Hunting | 298 (75.8%) | 95 (24.2%) |
| Mining, Quarrying, & Extraction | 164 (95.4%) | 8 (4.6%) |
| Construction | 320 (90.4%) | 34 (9.6%) |
| Manufacturing | 57 (64.0%) | 32 (36.0%) |
| Wholesale Trade | 65 (77.4%) | 19 (22.6%) |
| Retail Trade | 192 (60.0%) | 128 (40.0%) |
| Transportation & Warehousing | 111 (69.8%) | 48 (30.2%) |
| Utilities | 45 (77.6%) | 13 (22.4%) |
| Information | 0 (0.0%) | 0 (0.0%) |
| Finance & Insurance | 14 (15.0%) | 79 (85.0%) |
| Real Estate, Rental & Leasing | 10 (31.2%) | 22 (68.8%) |
| Professional & Scientific | 35 (60.3%) | 23 (39.7%) |
| Enterprise Management | 0 (0.0%) | 0 (0.0%) |
| Administrative & Support | 5 (12.2%) | 36 (87.8%) |
| Educational Services | 81 (26.8%) | 221 (73.2%) |
| Health Care & Social Assistance | 94 (24.2%) | 294 (75.8%) |
| Arts, Entertainment & Recreation | 30 (50.8%) | 29 (49.1%) |
| Accommodation & Food Services | 49 (40.8%) | 71 (59.2%) |
| Public Administration | 62 (53.0%) | 55 (47.0%) |
| Total | 1,740 (57.0%) | 1,311 (43.0%) |
Education in Bottineau County
School Enrollment in Bottineau County
The most common levels of schooling among the 1,484 students in Bottineau County are middle school (346 | 23.3%), elementary school (325 | 21.9%), and high school (324 | 21.8%).
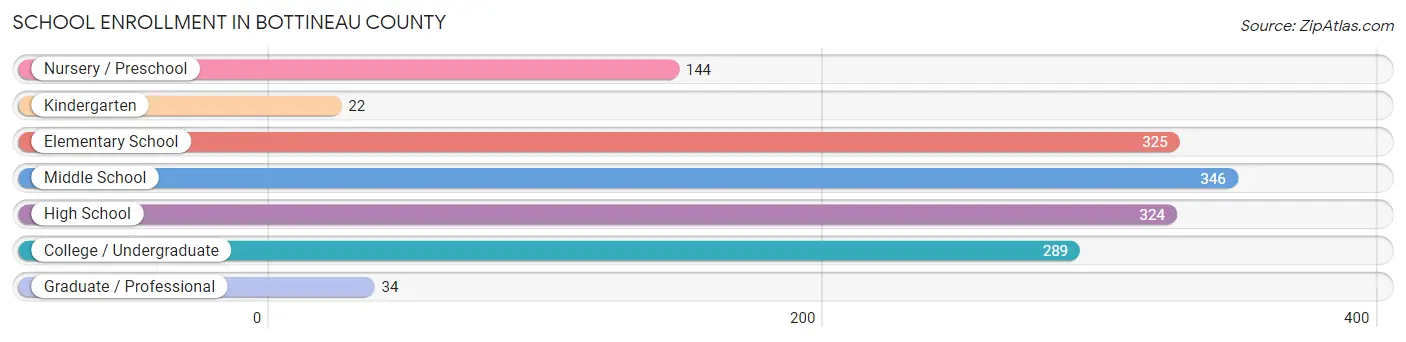
| School Level | # Students | % Students |
| Nursery / Preschool | 144 | 9.7% |
| Kindergarten | 22 | 1.5% |
| Elementary School | 325 | 21.9% |
| Middle School | 346 | 23.3% |
| High School | 324 | 21.8% |
| College / Undergraduate | 289 | 19.5% |
| Graduate / Professional | 34 | 2.3% |
| Total | 1,484 | 100.0% |
School Enrollment by Age by Funding Source in Bottineau County
Out of a total of 1,484 students who are enrolled in schools in Bottineau County, 105 (7.1%) attend a private institution, while the remaining 1,379 (92.9%) are enrolled in public schools. The age group of 25 to 34 year olds has the highest likelihood of being enrolled in private schools, with 1 (16.7% in the age bracket) enrolled. Conversely, the age group of 3 to 4 year olds has the lowest likelihood of being enrolled in a private school, with 65 (100.0% in the age bracket) attending a public institution.
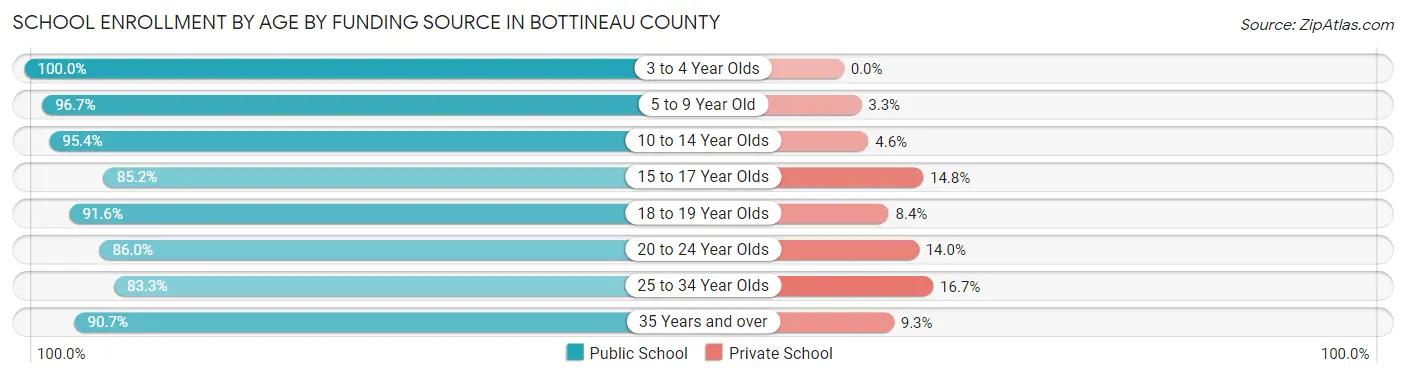
| Age Bracket | Public School | Private School |
| 3 to 4 Year Olds | 65 (100.0%) | 0 (0.0%) |
| 5 to 9 Year Old | 353 (96.7%) | 12 (3.3%) |
| 10 to 14 Year Olds | 415 (95.4%) | 20 (4.6%) |
| 15 to 17 Year Olds | 196 (85.2%) | 34 (14.8%) |
| 18 to 19 Year Olds | 197 (91.6%) | 18 (8.4%) |
| 20 to 24 Year Olds | 80 (86.0%) | 13 (14.0%) |
| 25 to 34 Year Olds | 5 (83.3%) | 1 (16.7%) |
| 35 Years and over | 68 (90.7%) | 7 (9.3%) |
| Total | 1,379 (92.9%) | 105 (7.1%) |
Educational Attainment by Field of Study in Bottineau County
Education (292 | 23.3%), science & technology (238 | 19.0%), business (182 | 14.5%), bio, nature & agricultural (145 | 11.6%), and arts & humanities (96 | 7.7%) are the most common fields of study among 1,251 individuals in Bottineau County who have obtained a bachelor's degree or higher.
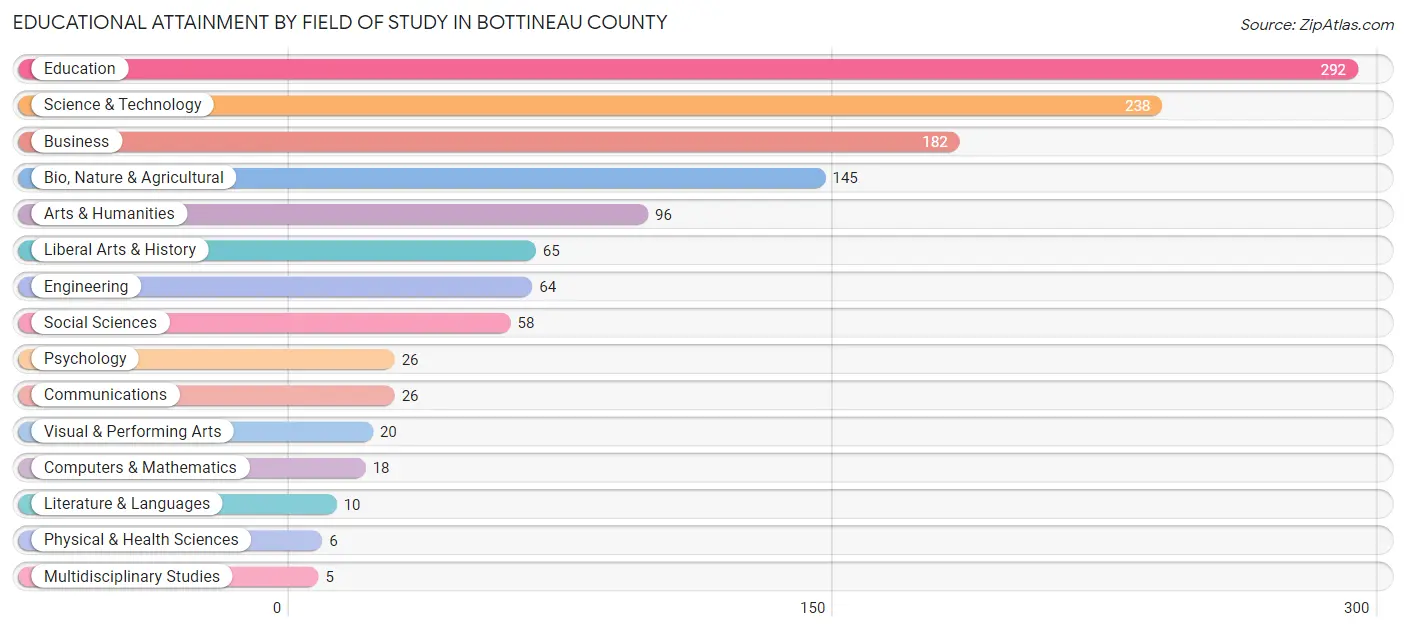
| Field of Study | # Graduates | % Graduates |
| Computers & Mathematics | 18 | 1.4% |
| Bio, Nature & Agricultural | 145 | 11.6% |
| Physical & Health Sciences | 6 | 0.5% |
| Psychology | 26 | 2.1% |
| Social Sciences | 58 | 4.6% |
| Engineering | 64 | 5.1% |
| Multidisciplinary Studies | 5 | 0.4% |
| Science & Technology | 238 | 19.0% |
| Business | 182 | 14.5% |
| Education | 292 | 23.3% |
| Literature & Languages | 10 | 0.8% |
| Liberal Arts & History | 65 | 5.2% |
| Visual & Performing Arts | 20 | 1.6% |
| Communications | 26 | 2.1% |
| Arts & Humanities | 96 | 7.7% |
| Total | 1,251 | 100.0% |
Transportation & Commute in Bottineau County
Vehicle Availability by Sex in Bottineau County
The most prevalent vehicle ownership categories in Bottineau County are males with 2 vehicles (464, accounting for 28.0%) and females with 2 vehicles (328, making up 36.5%).
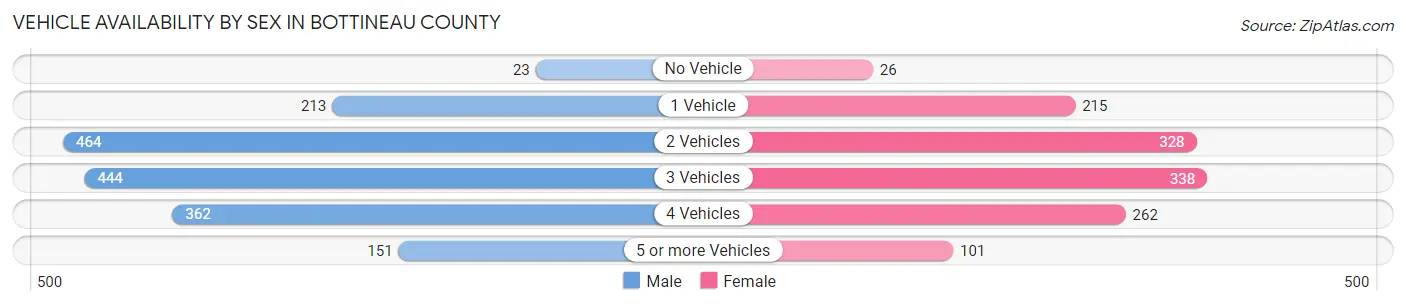
| Vehicles Available | Male | Female |
| No Vehicle | 23 (1.4%) | 26 (2.1%) |
| 1 Vehicle | 213 (12.9%) | 215 (16.9%) |
| 2 Vehicles | 464 (28.0%) | 328 (25.8%) |
| 3 Vehicles | 444 (26.8%) | 338 (26.6%) |
| 4 Vehicles | 362 (21.8%) | 262 (20.6%) |
| 5 or more Vehicles | 151 (9.1%) | 101 (8.0%) |
| Total | 1,657 (100.0%) | 1,270 (100.0%) |
Commute Time in Bottineau County
The most frequently occuring commute durations in Bottineau County are 5 to 9 minutes (637 commuters, 22.6%), 10 to 14 minutes (518 commuters, 18.4%), and less than 5 minutes (437 commuters, 15.5%).
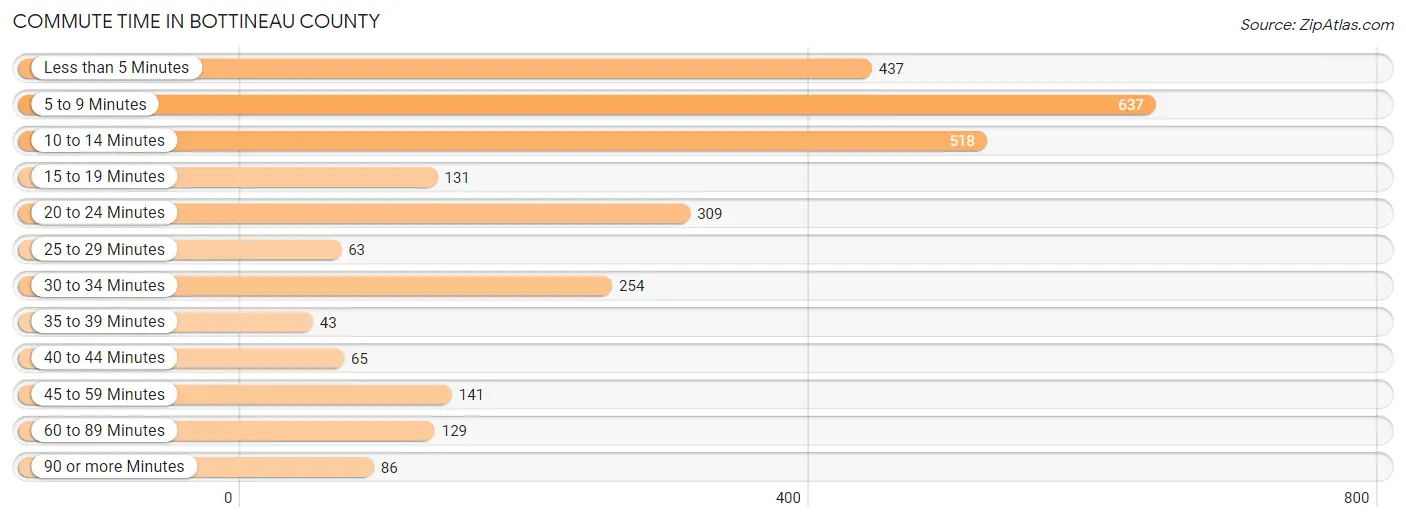
| Commute Time | # Commuters | % Commuters |
| Less than 5 Minutes | 437 | 15.5% |
| 5 to 9 Minutes | 637 | 22.6% |
| 10 to 14 Minutes | 518 | 18.4% |
| 15 to 19 Minutes | 131 | 4.7% |
| 20 to 24 Minutes | 309 | 11.0% |
| 25 to 29 Minutes | 63 | 2.2% |
| 30 to 34 Minutes | 254 | 9.0% |
| 35 to 39 Minutes | 43 | 1.5% |
| 40 to 44 Minutes | 65 | 2.3% |
| 45 to 59 Minutes | 141 | 5.0% |
| 60 to 89 Minutes | 129 | 4.6% |
| 90 or more Minutes | 86 | 3.1% |
Commute Time by Sex in Bottineau County
The most common commute times in Bottineau County are 5 to 9 minutes (381 commuters, 23.5%) for males and 5 to 9 minutes (256 commuters, 21.5%) for females.
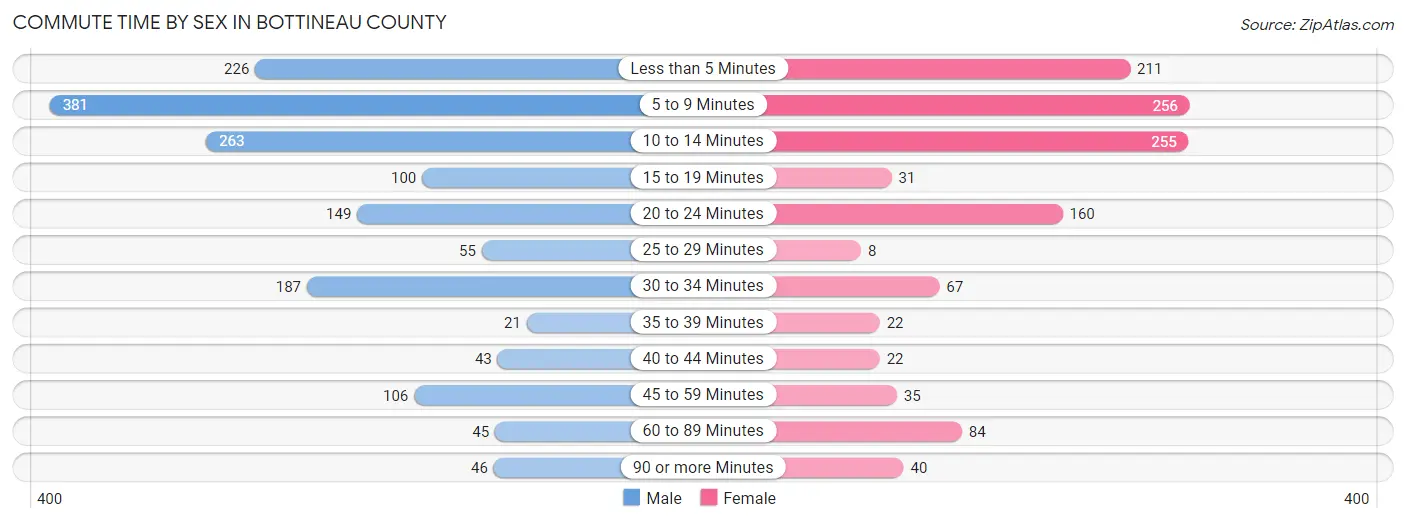
| Commute Time | Male | Female |
| Less than 5 Minutes | 226 (13.9%) | 211 (17.7%) |
| 5 to 9 Minutes | 381 (23.5%) | 256 (21.5%) |
| 10 to 14 Minutes | 263 (16.2%) | 255 (21.4%) |
| 15 to 19 Minutes | 100 (6.2%) | 31 (2.6%) |
| 20 to 24 Minutes | 149 (9.2%) | 160 (13.4%) |
| 25 to 29 Minutes | 55 (3.4%) | 8 (0.7%) |
| 30 to 34 Minutes | 187 (11.5%) | 67 (5.6%) |
| 35 to 39 Minutes | 21 (1.3%) | 22 (1.8%) |
| 40 to 44 Minutes | 43 (2.6%) | 22 (1.8%) |
| 45 to 59 Minutes | 106 (6.5%) | 35 (2.9%) |
| 60 to 89 Minutes | 45 (2.8%) | 84 (7.0%) |
| 90 or more Minutes | 46 (2.8%) | 40 (3.4%) |
Time of Departure to Work by Sex in Bottineau County
The most frequent times of departure to work in Bottineau County are 7:30 AM to 7:59 AM (387, 23.9%) for males and 7:30 AM to 7:59 AM (269, 22.6%) for females.
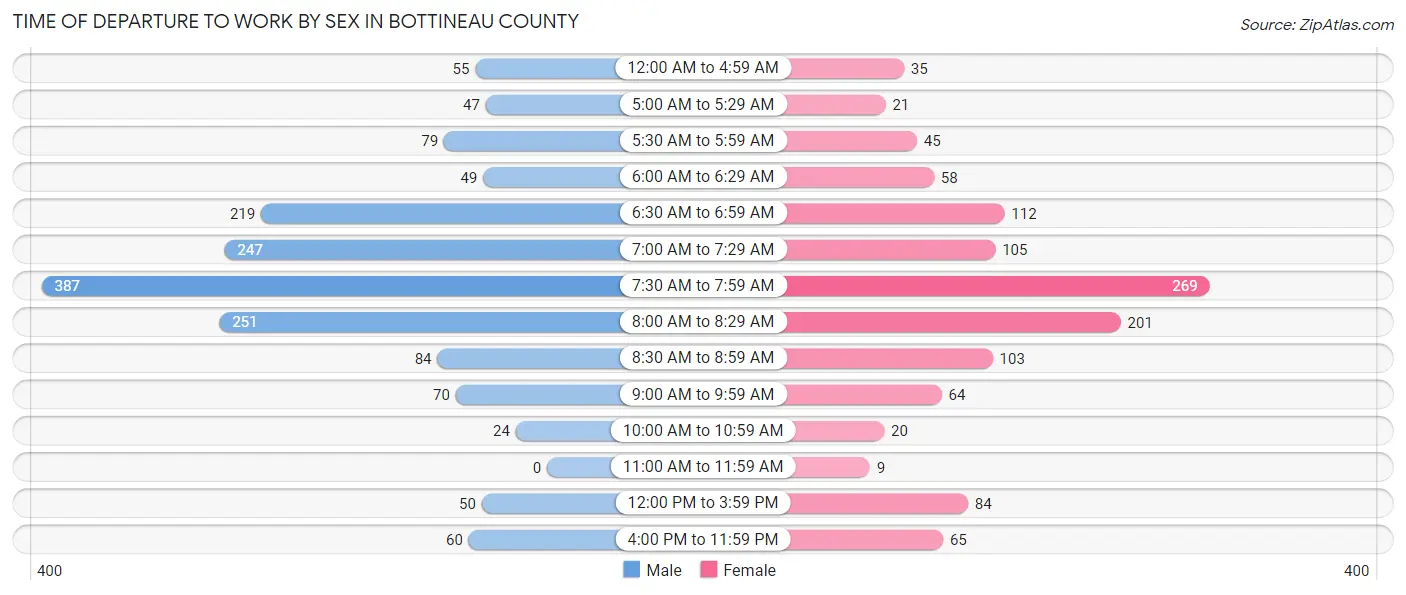
| Time of Departure | Male | Female |
| 12:00 AM to 4:59 AM | 55 (3.4%) | 35 (2.9%) |
| 5:00 AM to 5:29 AM | 47 (2.9%) | 21 (1.8%) |
| 5:30 AM to 5:59 AM | 79 (4.9%) | 45 (3.8%) |
| 6:00 AM to 6:29 AM | 49 (3.0%) | 58 (4.9%) |
| 6:30 AM to 6:59 AM | 219 (13.5%) | 112 (9.4%) |
| 7:00 AM to 7:29 AM | 247 (15.2%) | 105 (8.8%) |
| 7:30 AM to 7:59 AM | 387 (23.9%) | 269 (22.6%) |
| 8:00 AM to 8:29 AM | 251 (15.5%) | 201 (16.9%) |
| 8:30 AM to 8:59 AM | 84 (5.2%) | 103 (8.6%) |
| 9:00 AM to 9:59 AM | 70 (4.3%) | 64 (5.4%) |
| 10:00 AM to 10:59 AM | 24 (1.5%) | 20 (1.7%) |
| 11:00 AM to 11:59 AM | 0 (0.0%) | 9 (0.8%) |
| 12:00 PM to 3:59 PM | 50 (3.1%) | 84 (7.0%) |
| 4:00 PM to 11:59 PM | 60 (3.7%) | 65 (5.5%) |
| Total | 1,622 (100.0%) | 1,191 (100.0%) |
Housing Occupancy in Bottineau County
Occupancy by Ownership in Bottineau County
Of the total 2,613 dwellings in Bottineau County, owner-occupied units account for 2,112 (80.8%), while renter-occupied units make up 501 (19.2%).
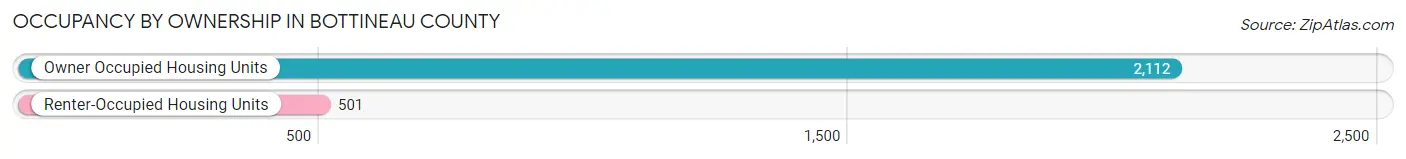
| Occupancy | # Housing Units | % Housing Units |
| Owner Occupied Housing Units | 2,112 | 80.8% |
| Renter-Occupied Housing Units | 501 | 19.2% |
| Total Occupied Housing Units | 2,613 | 100.0% |
Occupancy by Household Size in Bottineau County
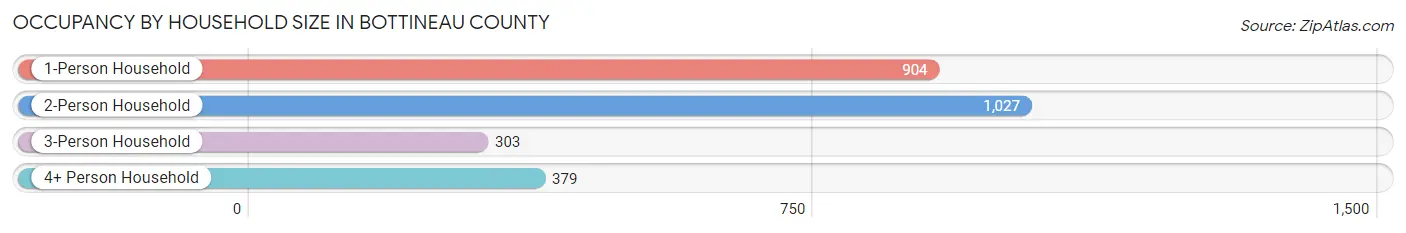
| Household Size | # Housing Units | % Housing Units |
| 1-Person Household | 904 | 34.6% |
| 2-Person Household | 1,027 | 39.3% |
| 3-Person Household | 303 | 11.6% |
| 4+ Person Household | 379 | 14.5% |
| Total Housing Units | 2,613 | 100.0% |
Occupancy by Ownership by Household Size in Bottineau County
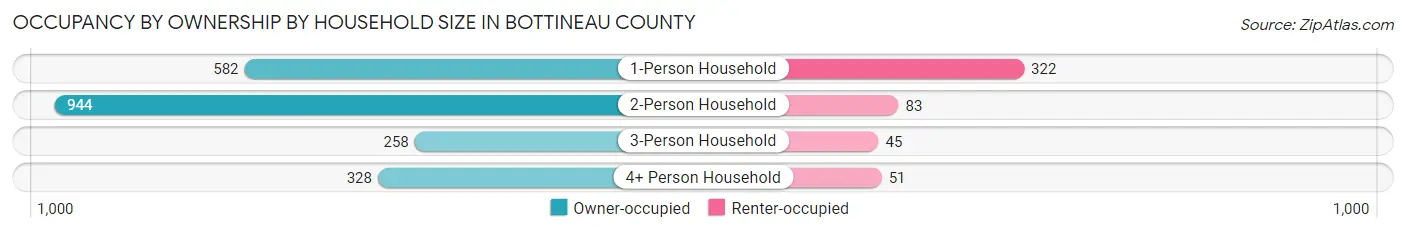
| Household Size | Owner-occupied | Renter-occupied |
| 1-Person Household | 582 (64.4%) | 322 (35.6%) |
| 2-Person Household | 944 (91.9%) | 83 (8.1%) |
| 3-Person Household | 258 (85.2%) | 45 (14.8%) |
| 4+ Person Household | 328 (86.5%) | 51 (13.5%) |
| Total Housing Units | 2,112 (80.8%) | 501 (19.2%) |
Occupancy by Educational Attainment in Bottineau County
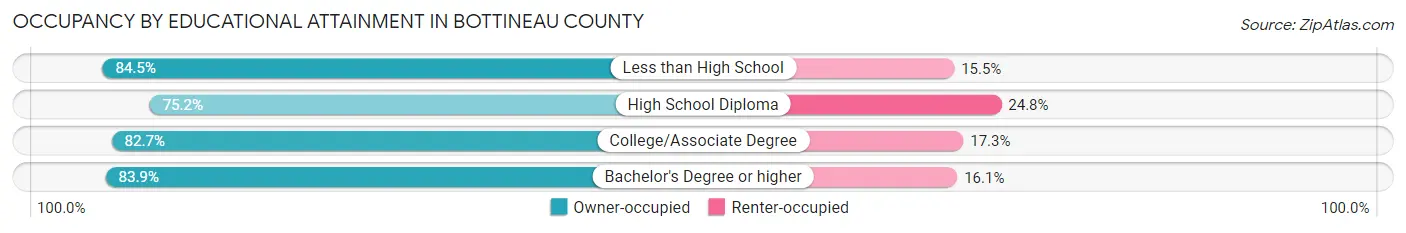
| Household Size | Owner-occupied | Renter-occupied |
| Less than High School | 153 (84.5%) | 28 (15.5%) |
| High School Diploma | 612 (75.2%) | 202 (24.8%) |
| College/Associate Degree | 757 (82.7%) | 158 (17.3%) |
| Bachelor's Degree or higher | 590 (83.9%) | 113 (16.1%) |
Occupancy by Age of Householder in Bottineau County
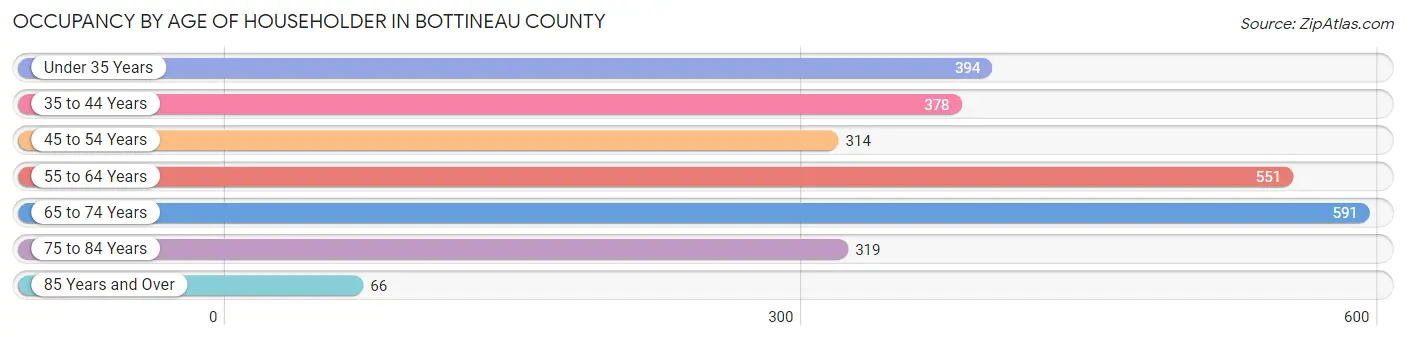
| Age Bracket | # Households | % Households |
| Under 35 Years | 394 | 15.1% |
| 35 to 44 Years | 378 | 14.5% |
| 45 to 54 Years | 314 | 12.0% |
| 55 to 64 Years | 551 | 21.1% |
| 65 to 74 Years | 591 | 22.6% |
| 75 to 84 Years | 319 | 12.2% |
| 85 Years and Over | 66 | 2.5% |
| Total | 2,613 | 100.0% |
Housing Finances in Bottineau County
Median Income by Occupancy in Bottineau County
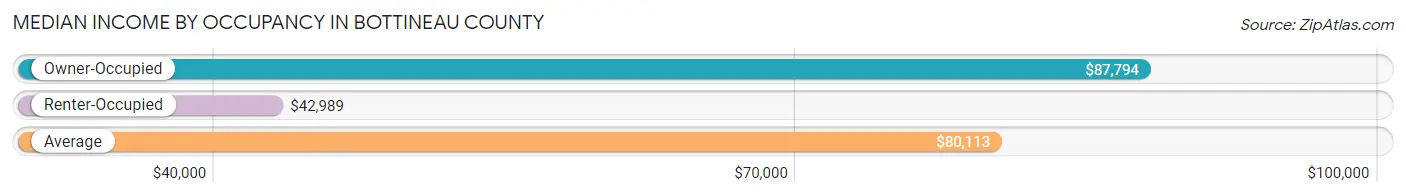
| Occupancy Type | # Households | Median Income |
| Owner-Occupied | 2,112 (80.8%) | $87,794 |
| Renter-Occupied | 501 (19.2%) | $42,989 |
| Average | 2,613 (100.0%) | $80,113 |
Occupancy by Householder Income Bracket in Bottineau County
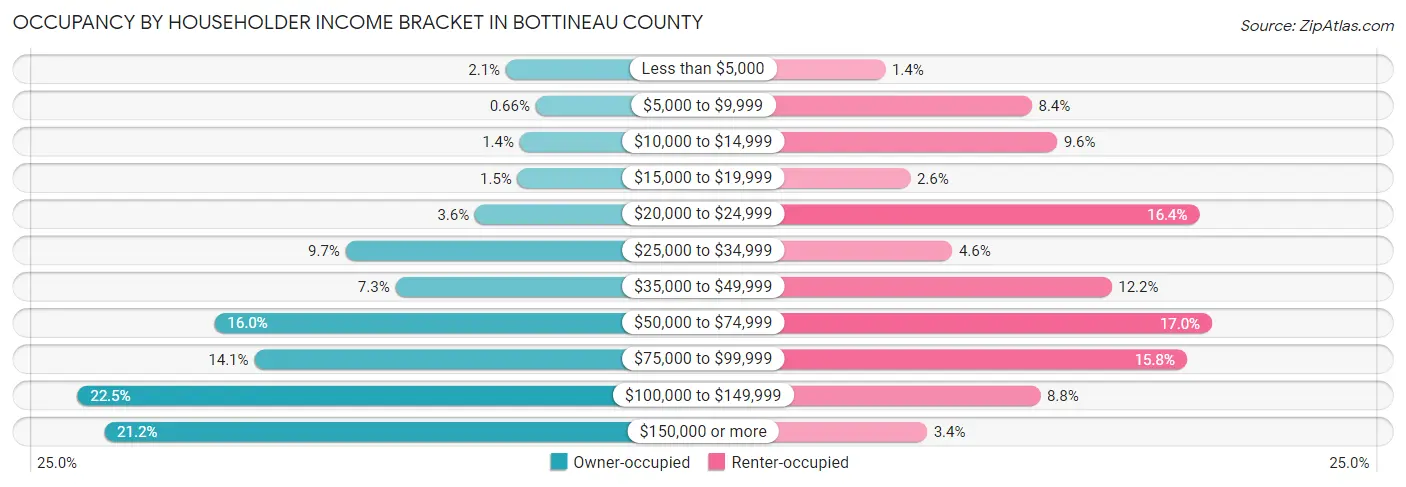
| Income Bracket | Owner-occupied | Renter-occupied |
| Less than $5,000 | 44 (2.1%) | 7 (1.4%) |
| $5,000 to $9,999 | 14 (0.7%) | 42 (8.4%) |
| $10,000 to $14,999 | 30 (1.4%) | 48 (9.6%) |
| $15,000 to $19,999 | 32 (1.5%) | 13 (2.6%) |
| $20,000 to $24,999 | 75 (3.5%) | 82 (16.4%) |
| $25,000 to $34,999 | 205 (9.7%) | 23 (4.6%) |
| $35,000 to $49,999 | 155 (7.3%) | 61 (12.2%) |
| $50,000 to $74,999 | 337 (16.0%) | 85 (17.0%) |
| $75,000 to $99,999 | 297 (14.1%) | 79 (15.8%) |
| $100,000 to $149,999 | 475 (22.5%) | 44 (8.8%) |
| $150,000 or more | 448 (21.2%) | 17 (3.4%) |
| Total | 2,112 (100.0%) | 501 (100.0%) |
Monthly Housing Cost Tiers in Bottineau County
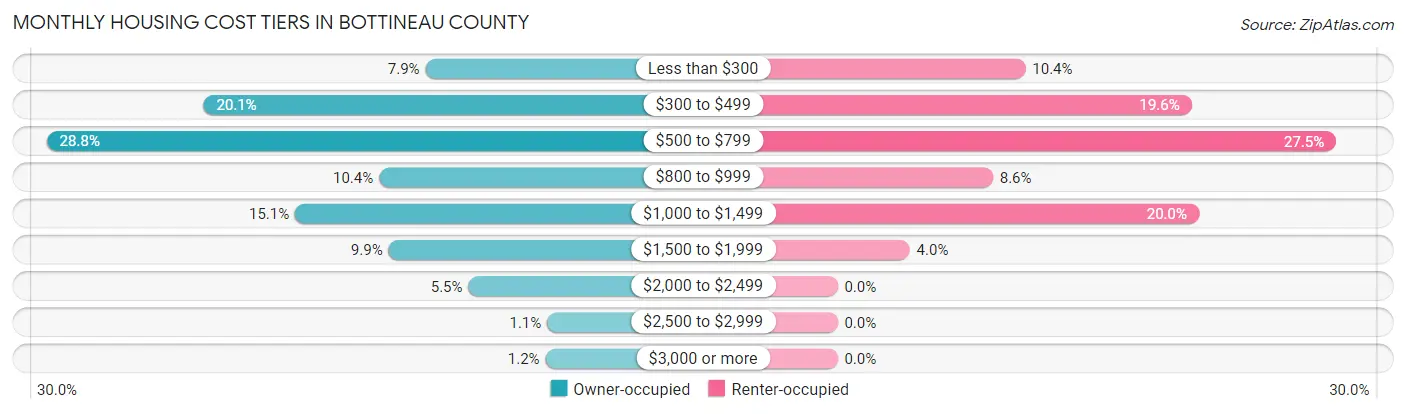
| Monthly Cost | Owner-occupied | Renter-occupied |
| Less than $300 | 166 (7.9%) | 52 (10.4%) |
| $300 to $499 | 425 (20.1%) | 98 (19.6%) |
| $500 to $799 | 608 (28.8%) | 138 (27.5%) |
| $800 to $999 | 220 (10.4%) | 43 (8.6%) |
| $1,000 to $1,499 | 318 (15.1%) | 100 (20.0%) |
| $1,500 to $1,999 | 209 (9.9%) | 20 (4.0%) |
| $2,000 to $2,499 | 116 (5.5%) | 0 (0.0%) |
| $2,500 to $2,999 | 24 (1.1%) | 0 (0.0%) |
| $3,000 or more | 26 (1.2%) | 0 (0.0%) |
| Total | 2,112 (100.0%) | 501 (100.0%) |
Physical Housing Characteristics in Bottineau County
Housing Structures in Bottineau County
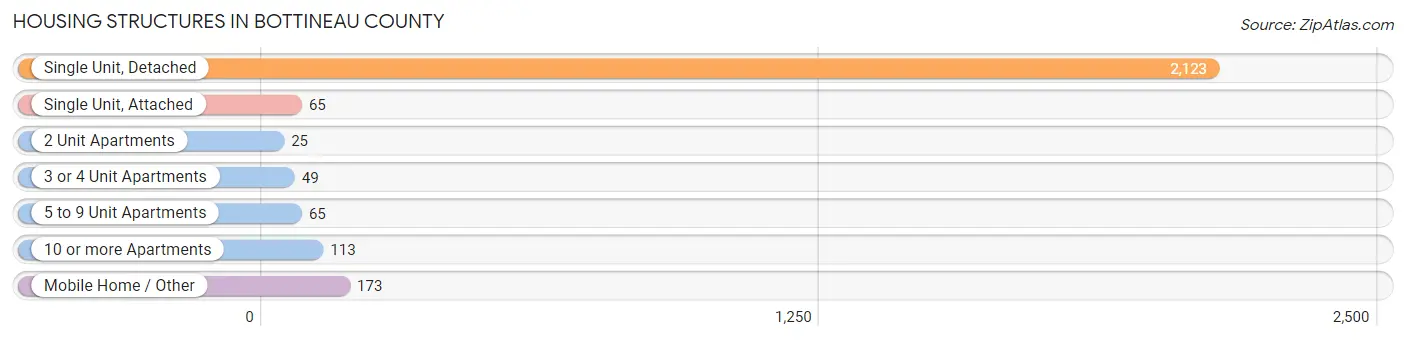
| Structure Type | # Housing Units | % Housing Units |
| Single Unit, Detached | 2,123 | 81.2% |
| Single Unit, Attached | 65 | 2.5% |
| 2 Unit Apartments | 25 | 1.0% |
| 3 or 4 Unit Apartments | 49 | 1.9% |
| 5 to 9 Unit Apartments | 65 | 2.5% |
| 10 or more Apartments | 113 | 4.3% |
| Mobile Home / Other | 173 | 6.6% |
| Total | 2,613 | 100.0% |
Housing Structures by Occupancy in Bottineau County
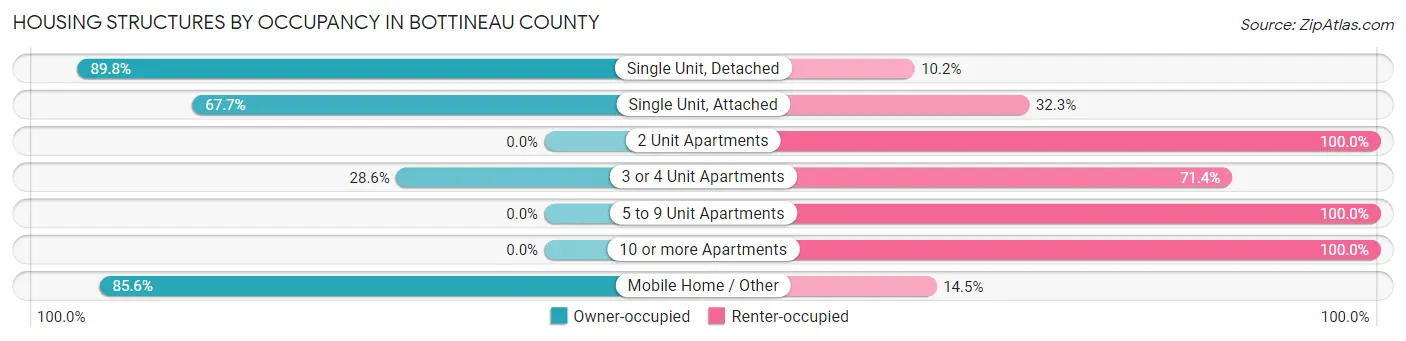
| Structure Type | Owner-occupied | Renter-occupied |
| Single Unit, Detached | 1,906 (89.8%) | 217 (10.2%) |
| Single Unit, Attached | 44 (67.7%) | 21 (32.3%) |
| 2 Unit Apartments | 0 (0.0%) | 25 (100.0%) |
| 3 or 4 Unit Apartments | 14 (28.6%) | 35 (71.4%) |
| 5 to 9 Unit Apartments | 0 (0.0%) | 65 (100.0%) |
| 10 or more Apartments | 0 (0.0%) | 113 (100.0%) |
| Mobile Home / Other | 148 (85.6%) | 25 (14.4%) |
| Total | 2,112 (80.8%) | 501 (19.2%) |
Housing Structures by Number of Rooms in Bottineau County
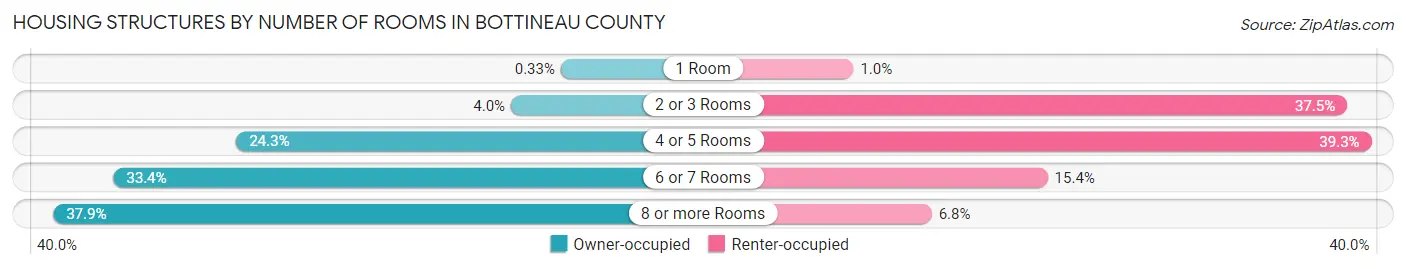
| Number of Rooms | Owner-occupied | Renter-occupied |
| 1 Room | 7 (0.3%) | 5 (1.0%) |
| 2 or 3 Rooms | 85 (4.0%) | 188 (37.5%) |
| 4 or 5 Rooms | 514 (24.3%) | 197 (39.3%) |
| 6 or 7 Rooms | 706 (33.4%) | 77 (15.4%) |
| 8 or more Rooms | 800 (37.9%) | 34 (6.8%) |
| Total | 2,112 (100.0%) | 501 (100.0%) |
Housing Structure by Heating Type in Bottineau County
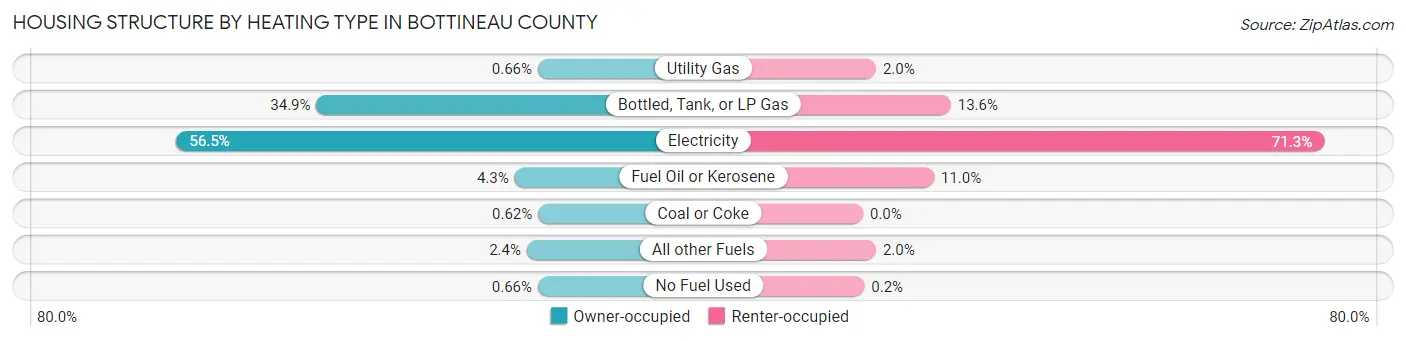
| Heating Type | Owner-occupied | Renter-occupied |
| Utility Gas | 14 (0.7%) | 10 (2.0%) |
| Bottled, Tank, or LP Gas | 737 (34.9%) | 68 (13.6%) |
| Electricity | 1,194 (56.5%) | 357 (71.3%) |
| Fuel Oil or Kerosene | 90 (4.3%) | 55 (11.0%) |
| Coal or Coke | 13 (0.6%) | 0 (0.0%) |
| All other Fuels | 50 (2.4%) | 10 (2.0%) |
| No Fuel Used | 14 (0.7%) | 1 (0.2%) |
| Total | 2,112 (100.0%) | 501 (100.0%) |
Household Vehicle Usage in Bottineau County
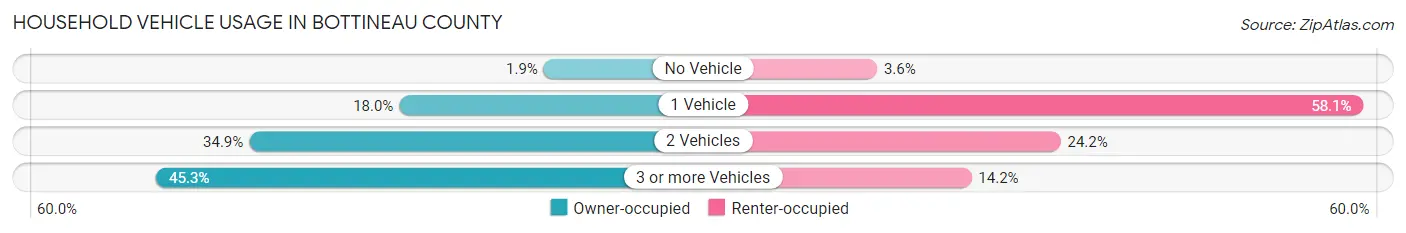
| Vehicles per Household | Owner-occupied | Renter-occupied |
| No Vehicle | 39 (1.8%) | 18 (3.6%) |
| 1 Vehicle | 381 (18.0%) | 291 (58.1%) |
| 2 Vehicles | 736 (34.8%) | 121 (24.1%) |
| 3 or more Vehicles | 956 (45.3%) | 71 (14.2%) |
| Total | 2,112 (100.0%) | 501 (100.0%) |
Real Estate & Mortgages in Bottineau County
Real Estate and Mortgage Overview in Bottineau County
| Characteristic | Without Mortgage | With Mortgage |
| Housing Units | 1,284 | 828 |
| Median Property Value | $182,600 | $195,800 |
| Median Household Income | $69,477 | $243 |
| Monthly Housing Costs | $526 | $26 |
| Real Estate Taxes | $1,414 | $27 |
Property Value by Mortgage Status in Bottineau County
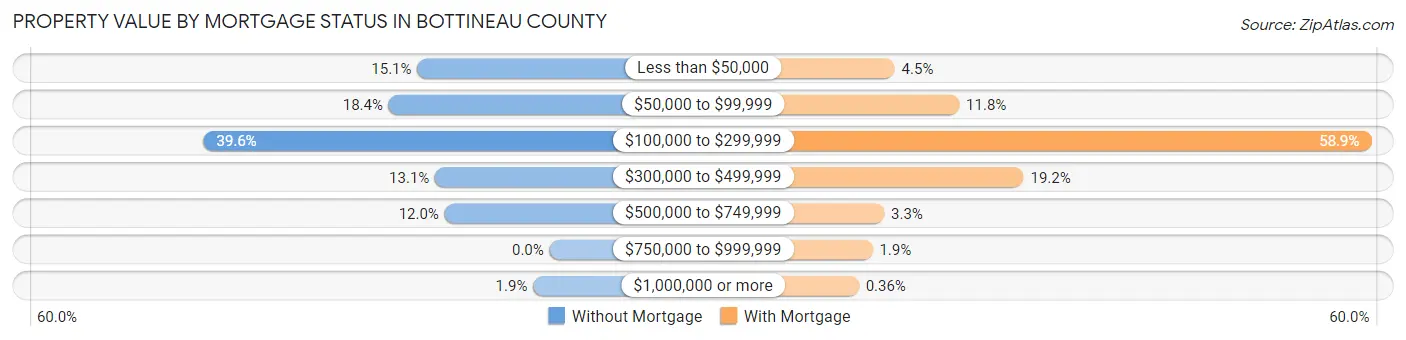
| Property Value | Without Mortgage | With Mortgage |
| Less than $50,000 | 194 (15.1%) | 37 (4.5%) |
| $50,000 to $99,999 | 236 (18.4%) | 98 (11.8%) |
| $100,000 to $299,999 | 508 (39.6%) | 488 (58.9%) |
| $300,000 to $499,999 | 168 (13.1%) | 159 (19.2%) |
| $500,000 to $749,999 | 154 (12.0%) | 27 (3.3%) |
| $750,000 to $999,999 | 0 (0.0%) | 16 (1.9%) |
| $1,000,000 or more | 24 (1.9%) | 3 (0.4%) |
| Total | 1,284 (100.0%) | 828 (100.0%) |
Household Income by Mortgage Status in Bottineau County
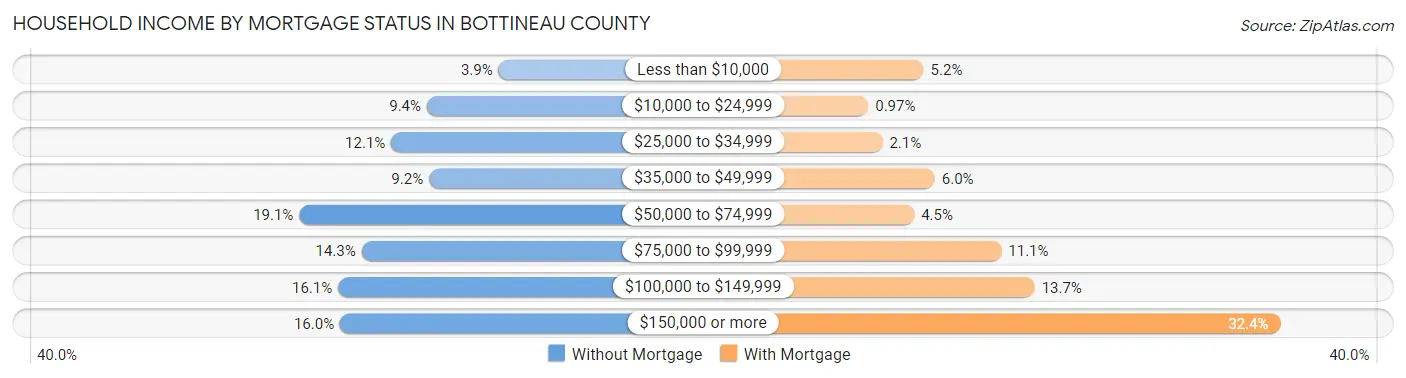
| Household Income | Without Mortgage | With Mortgage |
| Less than $10,000 | 50 (3.9%) | 43 (5.2%) |
| $10,000 to $24,999 | 120 (9.3%) | 8 (1.0%) |
| $25,000 to $34,999 | 155 (12.1%) | 17 (2.1%) |
| $35,000 to $49,999 | 118 (9.2%) | 50 (6.0%) |
| $50,000 to $74,999 | 245 (19.1%) | 37 (4.5%) |
| $75,000 to $99,999 | 184 (14.3%) | 92 (11.1%) |
| $100,000 to $149,999 | 207 (16.1%) | 113 (13.7%) |
| $150,000 or more | 205 (16.0%) | 268 (32.4%) |
| Total | 1,284 (100.0%) | 828 (100.0%) |
Property Value to Household Income Ratio in Bottineau County
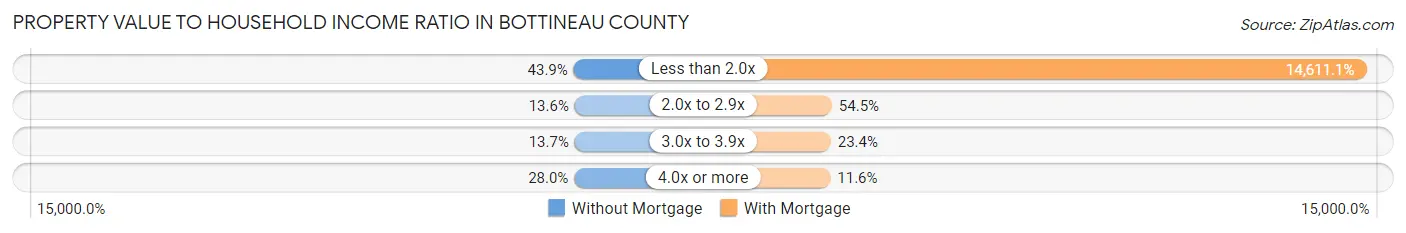
| Value-to-Income Ratio | Without Mortgage | With Mortgage |
| Less than 2.0x | 564 (43.9%) | 120,980 (14,611.1%) |
| 2.0x to 2.9x | 175 (13.6%) | 451 (54.5%) |
| 3.0x to 3.9x | 176 (13.7%) | 194 (23.4%) |
| 4.0x or more | 359 (28.0%) | 96 (11.6%) |
| Total | 1,284 (100.0%) | 828 (100.0%) |
Real Estate Taxes by Mortgage Status in Bottineau County
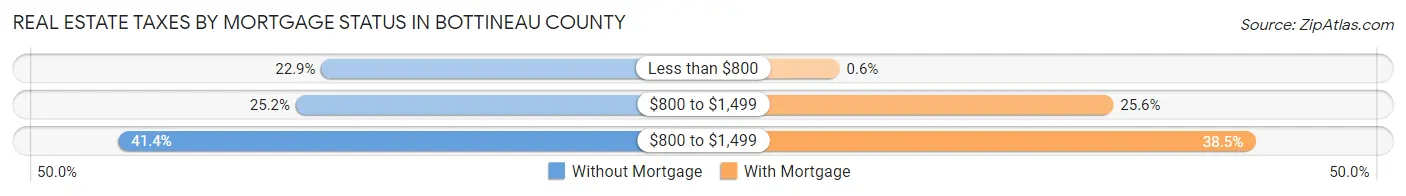
| Property Taxes | Without Mortgage | With Mortgage |
| Less than $800 | 294 (22.9%) | 5 (0.6%) |
| $800 to $1,499 | 324 (25.2%) | 212 (25.6%) |
| $800 to $1,499 | 532 (41.4%) | 319 (38.5%) |
| Total | 1,284 (100.0%) | 828 (100.0%) |
Health & Disability in Bottineau County
Health Insurance Coverage by Age in Bottineau County
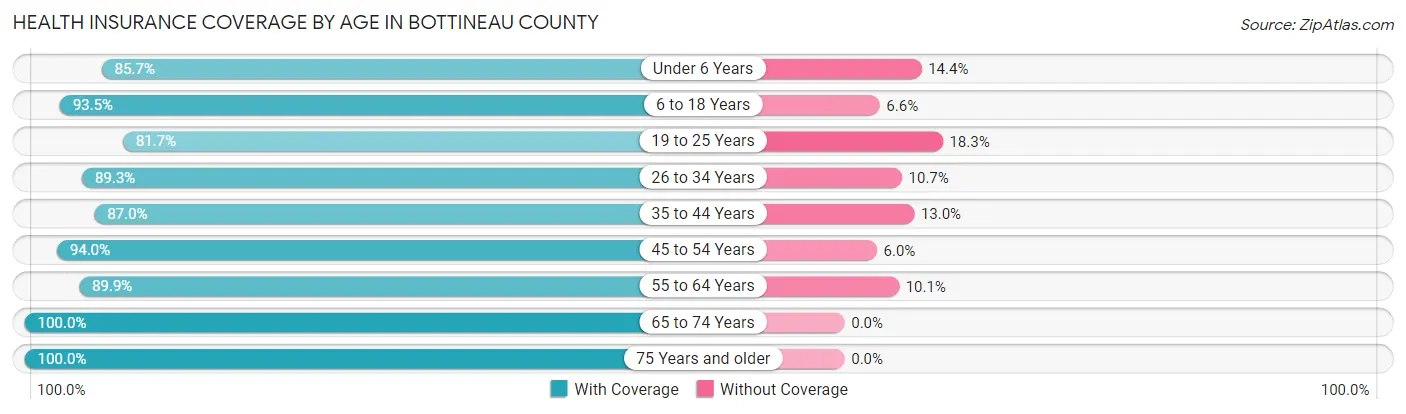
| Age Bracket | With Coverage | Without Coverage |
| Under 6 Years | 370 (85.7%) | 62 (14.3%) |
| 6 to 18 Years | 999 (93.4%) | 70 (6.6%) |
| 19 to 25 Years | 397 (81.7%) | 89 (18.3%) |
| 26 to 34 Years | 493 (89.3%) | 59 (10.7%) |
| 35 to 44 Years | 583 (87.0%) | 87 (13.0%) |
| 45 to 54 Years | 593 (94.0%) | 38 (6.0%) |
| 55 to 64 Years | 851 (89.9%) | 96 (10.1%) |
| 65 to 74 Years | 936 (100.0%) | 0 (0.0%) |
| 75 Years and older | 552 (100.0%) | 0 (0.0%) |
| Total | 5,774 (92.0%) | 501 (8.0%) |
Health Insurance Coverage by Citizenship Status in Bottineau County
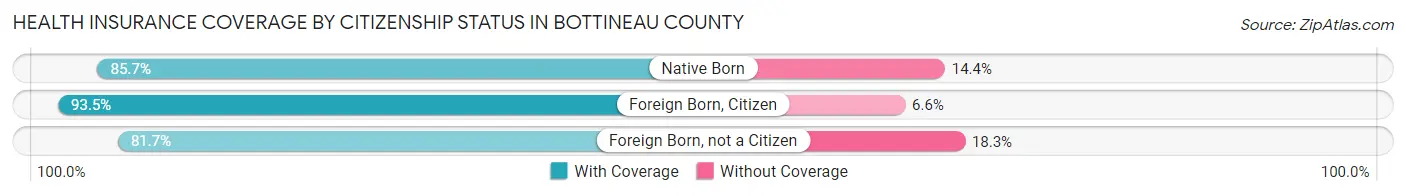
| Citizenship Status | With Coverage | Without Coverage |
| Native Born | 370 (85.7%) | 62 (14.3%) |
| Foreign Born, Citizen | 999 (93.4%) | 70 (6.6%) |
| Foreign Born, not a Citizen | 397 (81.7%) | 89 (18.3%) |
Health Insurance Coverage by Household Income in Bottineau County
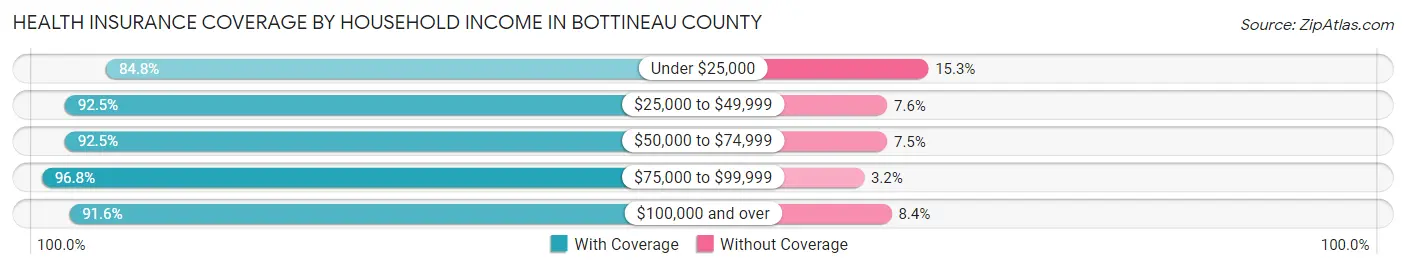
| Household Income | With Coverage | Without Coverage |
| Under $25,000 | 489 (84.8%) | 88 (15.2%) |
| $25,000 to $49,999 | 710 (92.4%) | 58 (7.5%) |
| $50,000 to $74,999 | 748 (92.5%) | 61 (7.5%) |
| $75,000 to $99,999 | 932 (96.8%) | 31 (3.2%) |
| $100,000 and over | 2,736 (91.6%) | 250 (8.4%) |
Public vs Private Health Insurance Coverage by Age in Bottineau County
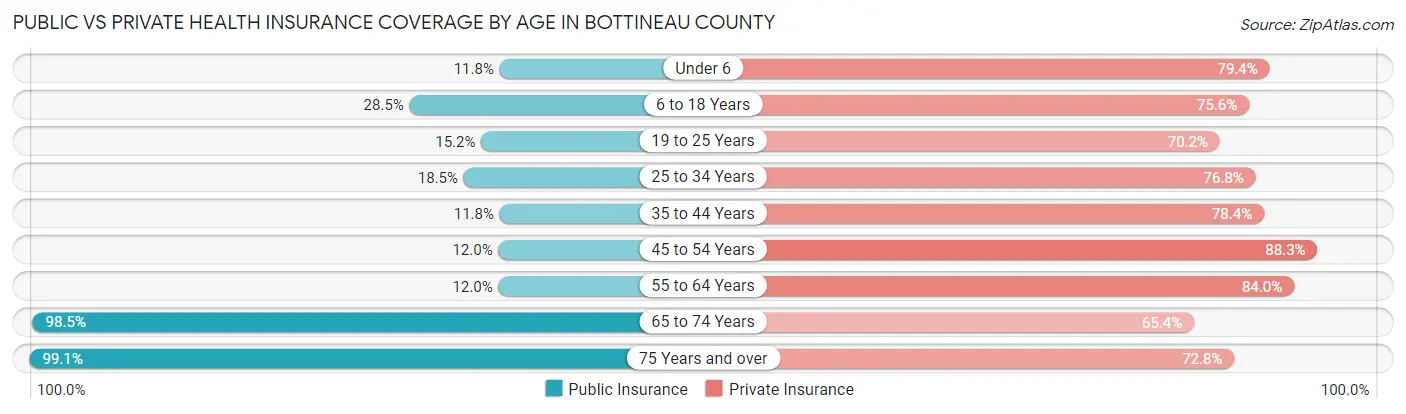
| Age Bracket | Public Insurance | Private Insurance |
| Under 6 | 51 (11.8%) | 343 (79.4%) |
| 6 to 18 Years | 305 (28.5%) | 808 (75.6%) |
| 19 to 25 Years | 74 (15.2%) | 341 (70.2%) |
| 25 to 34 Years | 102 (18.5%) | 424 (76.8%) |
| 35 to 44 Years | 79 (11.8%) | 525 (78.4%) |
| 45 to 54 Years | 76 (12.0%) | 557 (88.3%) |
| 55 to 64 Years | 114 (12.0%) | 795 (84.0%) |
| 65 to 74 Years | 922 (98.5%) | 612 (65.4%) |
| 75 Years and over | 547 (99.1%) | 402 (72.8%) |
| Total | 2,270 (36.2%) | 4,807 (76.6%) |
Disability Status by Sex by Age in Bottineau County
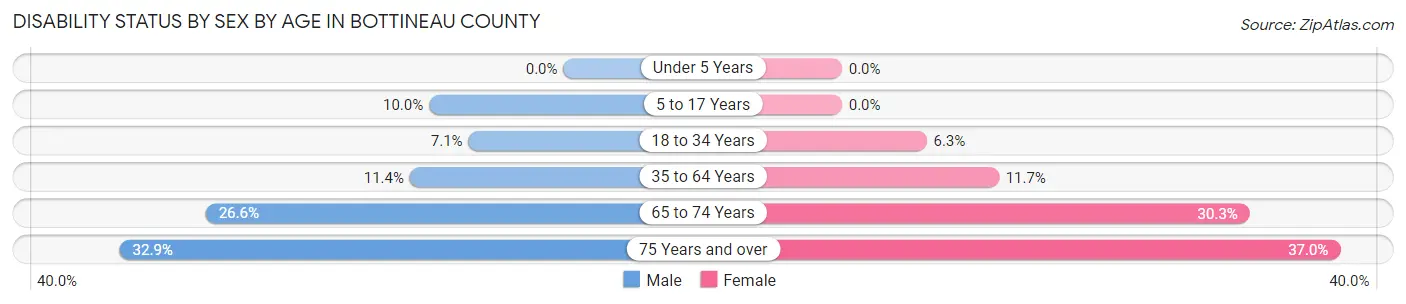
| Age Bracket | Male | Female |
| Under 5 Years | 0 (0.0%) | 0 (0.0%) |
| 5 to 17 Years | 57 (10.0%) | 0 (0.0%) |
| 18 to 34 Years | 45 (7.0%) | 32 (6.3%) |
| 35 to 64 Years | 134 (11.4%) | 125 (11.7%) |
| 65 to 74 Years | 124 (26.6%) | 142 (30.3%) |
| 75 Years and over | 83 (32.9%) | 111 (37.0%) |
Disability Class by Sex by Age in Bottineau County
Disability Class: Hearing Difficulty
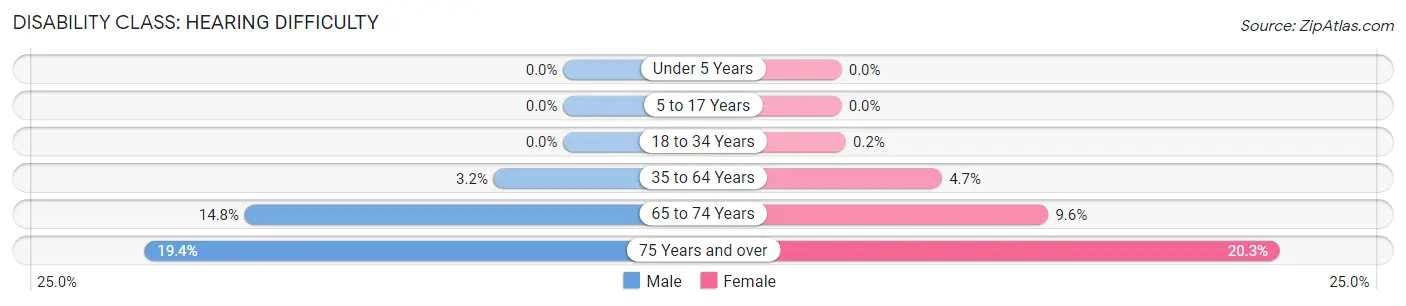
| Age Bracket | Male | Female |
| Under 5 Years | 0 (0.0%) | 0 (0.0%) |
| 5 to 17 Years | 0 (0.0%) | 0 (0.0%) |
| 18 to 34 Years | 0 (0.0%) | 1 (0.2%) |
| 35 to 64 Years | 38 (3.2%) | 50 (4.7%) |
| 65 to 74 Years | 69 (14.8%) | 45 (9.6%) |
| 75 Years and over | 49 (19.4%) | 61 (20.3%) |
Disability Class: Vision Difficulty
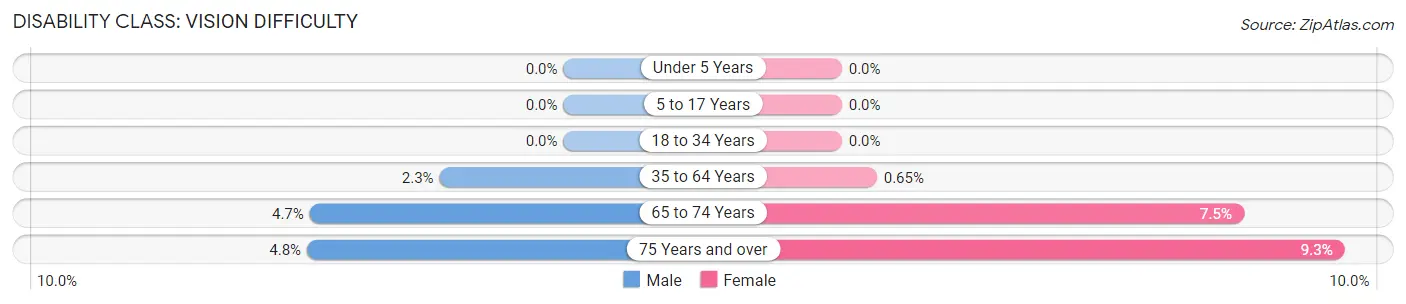
| Age Bracket | Male | Female |
| Under 5 Years | 0 (0.0%) | 0 (0.0%) |
| 5 to 17 Years | 0 (0.0%) | 0 (0.0%) |
| 18 to 34 Years | 0 (0.0%) | 0 (0.0%) |
| 35 to 64 Years | 27 (2.3%) | 7 (0.6%) |
| 65 to 74 Years | 22 (4.7%) | 35 (7.5%) |
| 75 Years and over | 12 (4.8%) | 28 (9.3%) |
Disability Class: Cognitive Difficulty
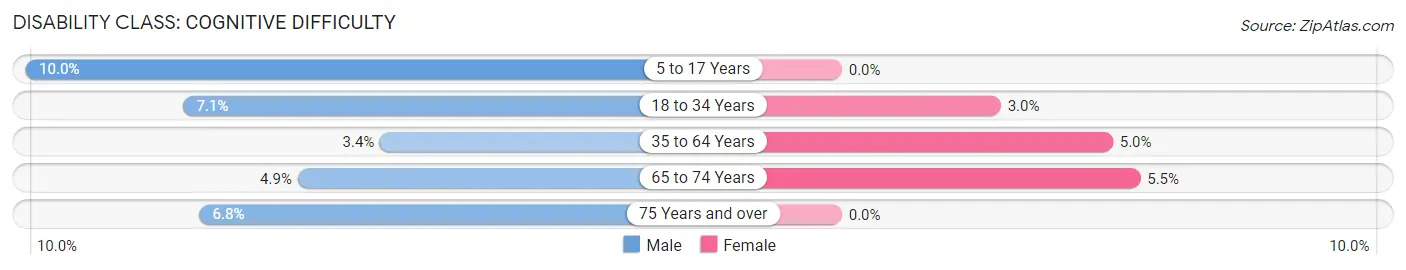
| Age Bracket | Male | Female |
| 5 to 17 Years | 57 (10.0%) | 0 (0.0%) |
| 18 to 34 Years | 45 (7.0%) | 15 (2.9%) |
| 35 to 64 Years | 40 (3.4%) | 54 (5.0%) |
| 65 to 74 Years | 23 (4.9%) | 26 (5.5%) |
| 75 Years and over | 17 (6.8%) | 0 (0.0%) |
Disability Class: Ambulatory Difficulty
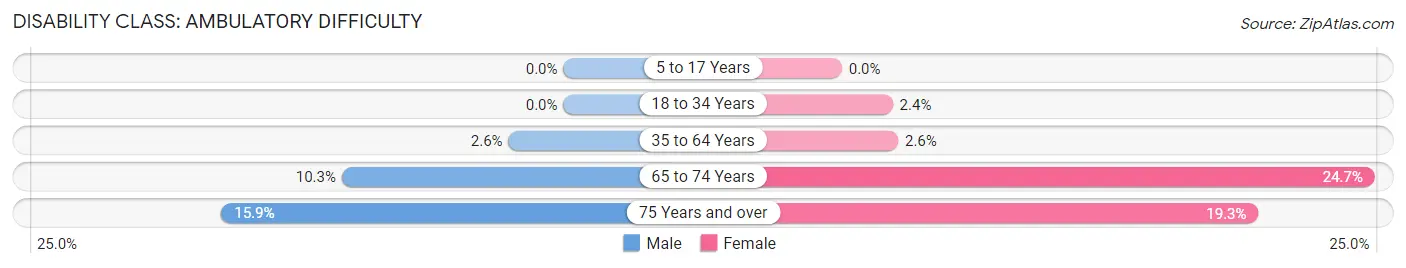
| Age Bracket | Male | Female |
| 5 to 17 Years | 0 (0.0%) | 0 (0.0%) |
| 18 to 34 Years | 0 (0.0%) | 12 (2.4%) |
| 35 to 64 Years | 30 (2.5%) | 28 (2.6%) |
| 65 to 74 Years | 48 (10.3%) | 116 (24.7%) |
| 75 Years and over | 40 (15.9%) | 58 (19.3%) |
Disability Class: Self-Care Difficulty
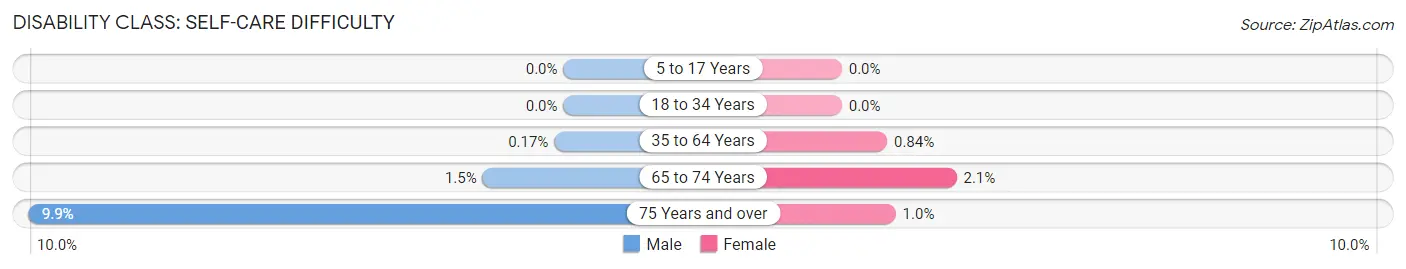
| Age Bracket | Male | Female |
| 5 to 17 Years | 0 (0.0%) | 0 (0.0%) |
| 18 to 34 Years | 0 (0.0%) | 0 (0.0%) |
| 35 to 64 Years | 2 (0.2%) | 9 (0.8%) |
| 65 to 74 Years | 7 (1.5%) | 10 (2.1%) |
| 75 Years and over | 25 (9.9%) | 3 (1.0%) |
Technology Access in Bottineau County
Computing Device Access in Bottineau County
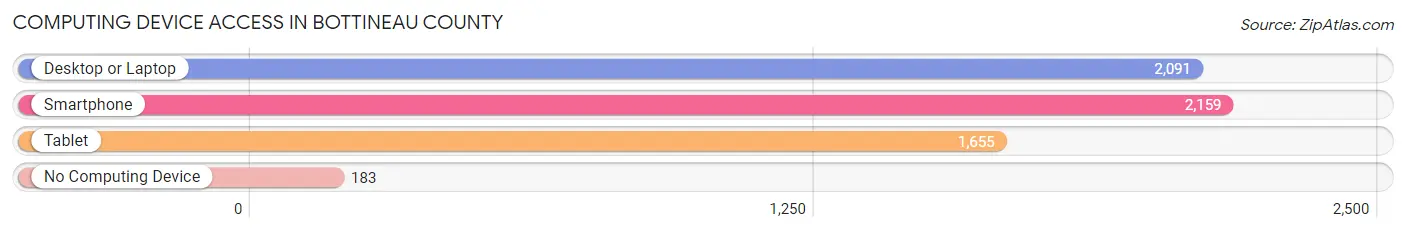
| Device Type | # Households | % Households |
| Desktop or Laptop | 2,091 | 80.0% |
| Smartphone | 2,159 | 82.6% |
| Tablet | 1,655 | 63.3% |
| No Computing Device | 183 | 7.0% |
| Total | 2,613 | 100.0% |
Internet Access in Bottineau County
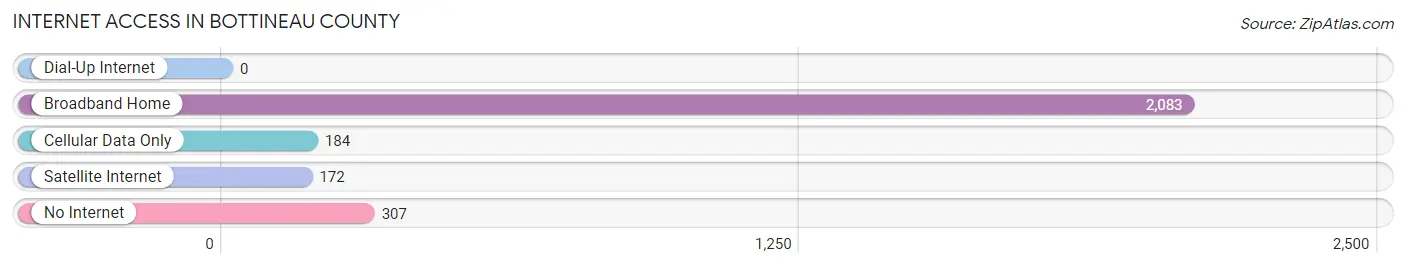
| Internet Type | # Households | % Households |
| Dial-Up Internet | 0 | 0.0% |
| Broadband Home | 2,083 | 79.7% |
| Cellular Data Only | 184 | 7.0% |
| Satellite Internet | 172 | 6.6% |
| No Internet | 307 | 11.7% |
| Total | 2,613 | 100.0% |
Bottineau County Summary
Bottineau County is located in the north-central region of North Dakota, and is bordered by Renville County to the north, Burke County to the east, McHenry County to the south, and Ward County to the west. The county seat is Bottineau, and the county is named after Pierre Bottineau, a French-Canadian fur trader and explorer. The county has a total area of 1,845 square miles, and a population of 6,429 as of the 2010 census.
The geography of Bottineau County is mostly flat, with rolling hills in the western part of the county. The county is located in the Missouri Plateau region of North Dakota, and is part of the Great Plains. The county is drained by the Souris River, which flows through the county from north to south. The county is also home to several lakes, including Lake Metigoshe, Lake Renwick, and Lake Metigoshe State Park.
The economy of Bottineau County is largely based on agriculture, with wheat, barley, oats, and hay being the main crops. The county is also home to several large dairy farms, as well as beef and pork production. The county is also home to several manufacturing companies, including a furniture factory, a wood products plant, and a plastics plant. The county is also home to several tourist attractions, including the International Peace Garden, the Turtle Mountain State Forest, and the Lake Metigoshe State Park.
The demographics of Bottineau County are largely white, with a population of 6,429 as of the 2010 census. The median household income is $45,813, and the median age is 44. The population is largely rural, with only 8.3% of the population living in urban areas. The county is also home to a large Native American population, with the Turtle Mountain Band of Chippewa Indians making up the largest Native American group in the county.
Bottineau County is a rural county with a strong agricultural base, and a population that is largely white and Native American. The county is home to several tourist attractions, and is a popular destination for outdoor recreation. The county is also home to several manufacturing companies, and is a great place to live and work.
Common Questions
What is the Total Population of Bottineau County?
Total Population of Bottineau County is 6,411.
What is the Total Male Population of Bottineau County?
Total Male Population of Bottineau County is 3,358.
What is the Total Female Population of Bottineau County?
Total Female Population of Bottineau County is 3,053.
What is the Ratio of Males per 100 Females in Bottineau County?
There are 109.99 Males per 100 Females in Bottineau County.
What is the Ratio of Females per 100 Males in Bottineau County?
There are 90.92 Females per 100 Males in Bottineau County.
What is the Median Population Age in Bottineau County?
Median Population Age in Bottineau County is 44.3 Years.
What is the Average Family Size in Bottineau County
Average Family Size in Bottineau County is 3.1 People.
What is the Average Household Size in Bottineau County
Average Household Size in Bottineau County is 2.3 People.
What is Per Capita Income in Bottineau County?
Per Capita income in Bottineau County is $45,506.
What is the Median Family Income in Bottineau County?
Median Family Income in Bottineau County is $101,422.
What is the Median Household income in Bottineau County?
Median Household Income in Bottineau County is $80,113.
What is Income or Wage Gap in Bottineau County?
Income or Wage Gap in Bottineau County is 43.3%.
Women in Bottineau County earn 56.7 cents for every dollar earned by a man.
What is Inequality or Gini Index in Bottineau County?
Inequality or Gini Index in Bottineau County is 0.47.
How Large is the Labor Force in Bottineau County?
There are 3,181 People in the Labor Forcein in Bottineau County.
What is the Percentage of People in the Labor Force in Bottineau County?
61.0% of People are in the Labor Force in Bottineau County.
What is the Unemployment Rate in Bottineau County?
Unemployment Rate in Bottineau County is 3.5%.