Benson County, ND
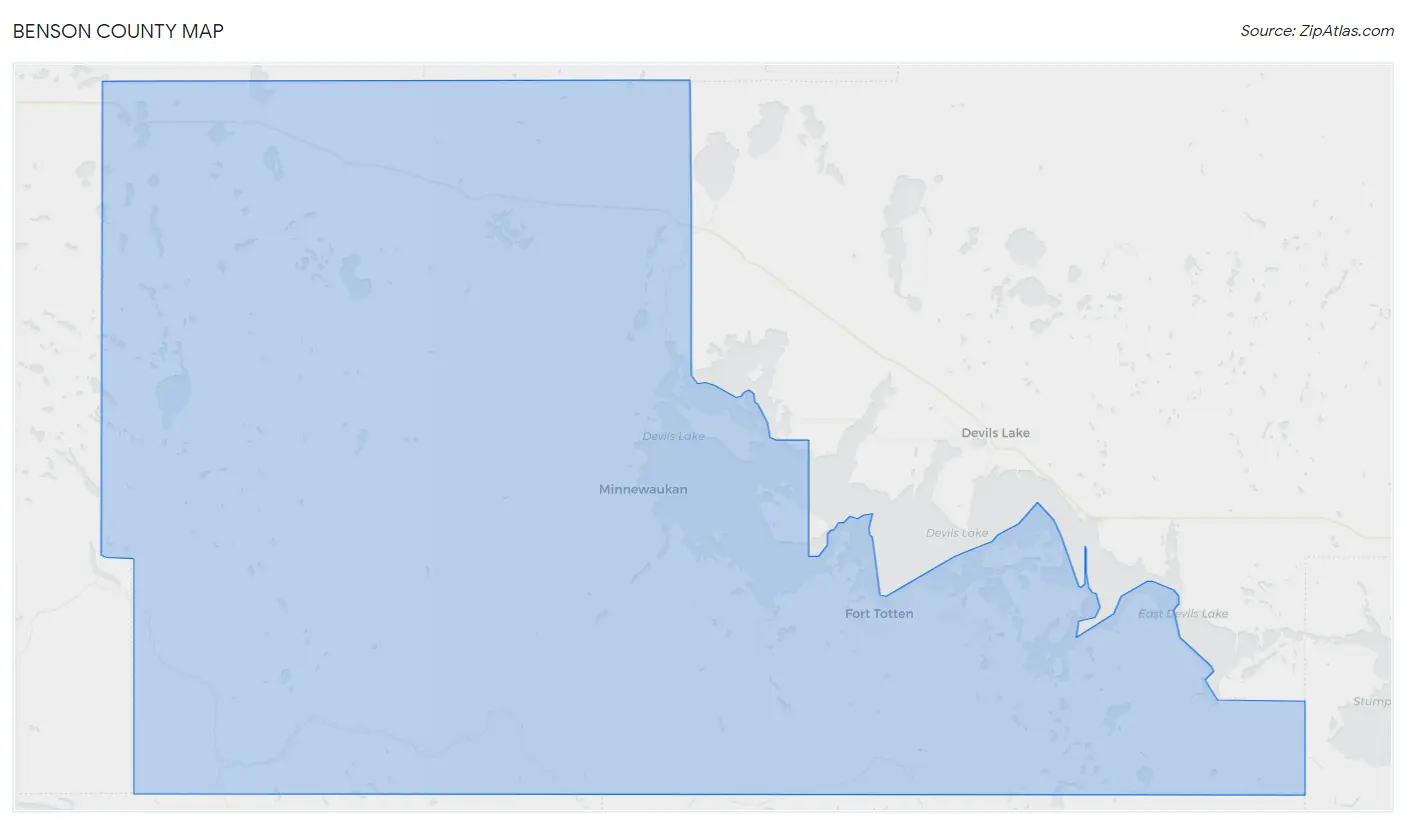
Benson County Map
Benson County Overview
5,960
TOTAL POPULATION
3,080
MALE POPULATION
2,880
FEMALE POPULATION
106.94
MALES / 100 FEMALES
93.51
FEMALES / 100 MALES
31.0
MEDIAN AGE
3.9
AVG FAMILY SIZE
3.2
AVG HOUSEHOLD SIZE
$24,490
PER CAPITA INCOME
$68,523
AVG FAMILY INCOME
$63,220
AVG HOUSEHOLD INCOME
19.1%
WAGE / INCOME GAP [ % ]
80.9¢/ $1
WAGE / INCOME GAP [ $ ]
$19,229
FAMILY INCOME DEFICIT
0.49
INEQUALITY / GINI INDEX
2,096
LABOR FORCE [ PEOPLE ]
51.4%
PERCENT IN LABOR FORCE
2.2%
UNEMPLOYMENT RATE
Benson County Area Codes
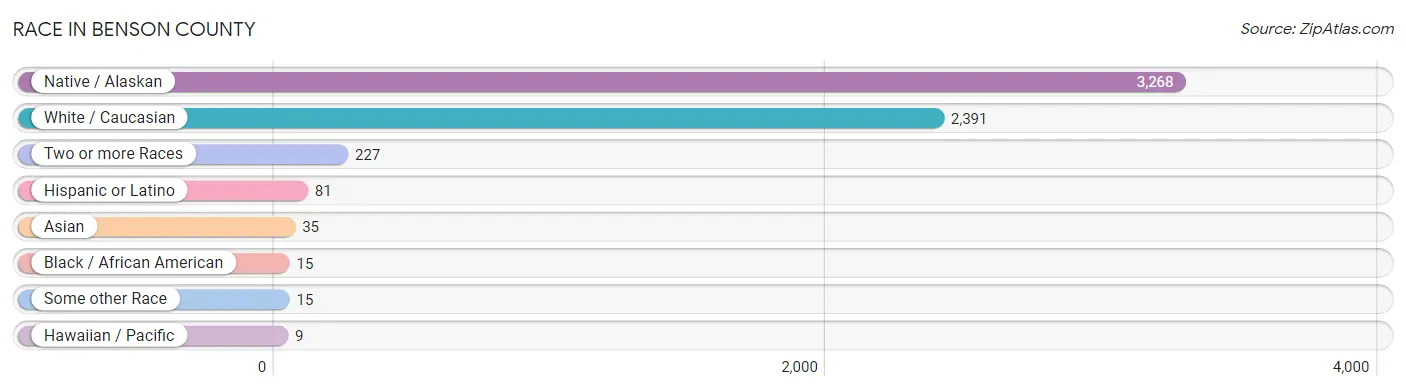
Race in Benson County
The most populous races in Benson County are Native / Alaskan (3,268 | 54.8%), White / Caucasian (2,391 | 40.1%), and Two or more Races (227 | 3.8%).
| Race | # Population | % Population |
| Asian | 35 | 0.6% |
| Black / African American | 15 | 0.3% |
| Hawaiian / Pacific | 9 | 0.2% |
| Hispanic or Latino | 81 | 1.4% |
| Native / Alaskan | 3,268 | 54.8% |
| White / Caucasian | 2,391 | 40.1% |
| Two or more Races | 227 | 3.8% |
| Some other Race | 15 | 0.3% |
| Total | 5,960 | 100.0% |
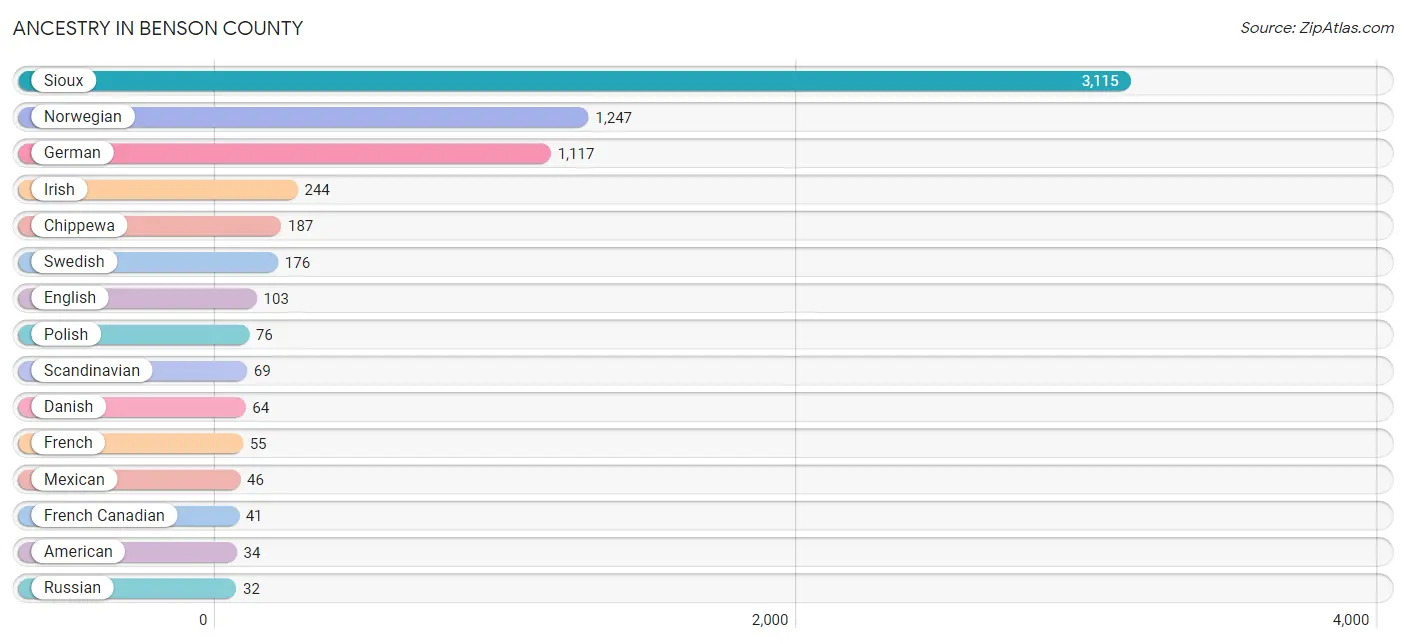
Ancestry in Benson County
The most populous ancestries reported in Benson County are Sioux (3,115 | 52.3%), Norwegian (1,247 | 20.9%), German (1,117 | 18.7%), Irish (244 | 4.1%), and Chippewa (187 | 3.1%), together accounting for 99.2% of all Benson County residents.
| Ancestry | # Population | % Population |
| American | 34 | 0.6% |
| Belgian | 3 | 0.1% |
| Belizean | 1 | 0.0% |
| British | 9 | 0.2% |
| Chippewa | 187 | 3.1% |
| Cuban | 3 | 0.1% |
| Czech | 22 | 0.4% |
| Czechoslovakian | 2 | 0.0% |
| Danish | 64 | 1.1% |
| Dominican | 29 | 0.5% |
| Dutch | 17 | 0.3% |
| English | 103 | 1.7% |
| European | 1 | 0.0% |
| Finnish | 4 | 0.1% |
| French | 55 | 0.9% |
| French Canadian | 41 | 0.7% |
| German | 1,117 | 18.7% |
| Greek | 7 | 0.1% |
| Hungarian | 1 | 0.0% |
| Icelander | 7 | 0.1% |
| Irish | 244 | 4.1% |
| Italian | 29 | 0.5% |
| Korean | 31 | 0.5% |
| Malaysian | 4 | 0.1% |
| Mexican | 46 | 0.8% |
| Native Hawaiian | 9 | 0.2% |
| Northern European | 2 | 0.0% |
| Norwegian | 1,247 | 20.9% |
| Pennsylvania German | 7 | 0.1% |
| Polish | 76 | 1.3% |
| Russian | 32 | 0.5% |
| Scandinavian | 69 | 1.2% |
| Scotch-Irish | 19 | 0.3% |
| Scottish | 15 | 0.3% |
| Sioux | 3,115 | 52.3% |
| Spaniard | 2 | 0.0% |
| Swedish | 176 | 2.9% |
| Swiss | 12 | 0.2% |
| Ukrainian | 2 | 0.0% |
| Welsh | 1 | 0.0% |
| West Indian | 6 | 0.1% | View All 41 Rows |
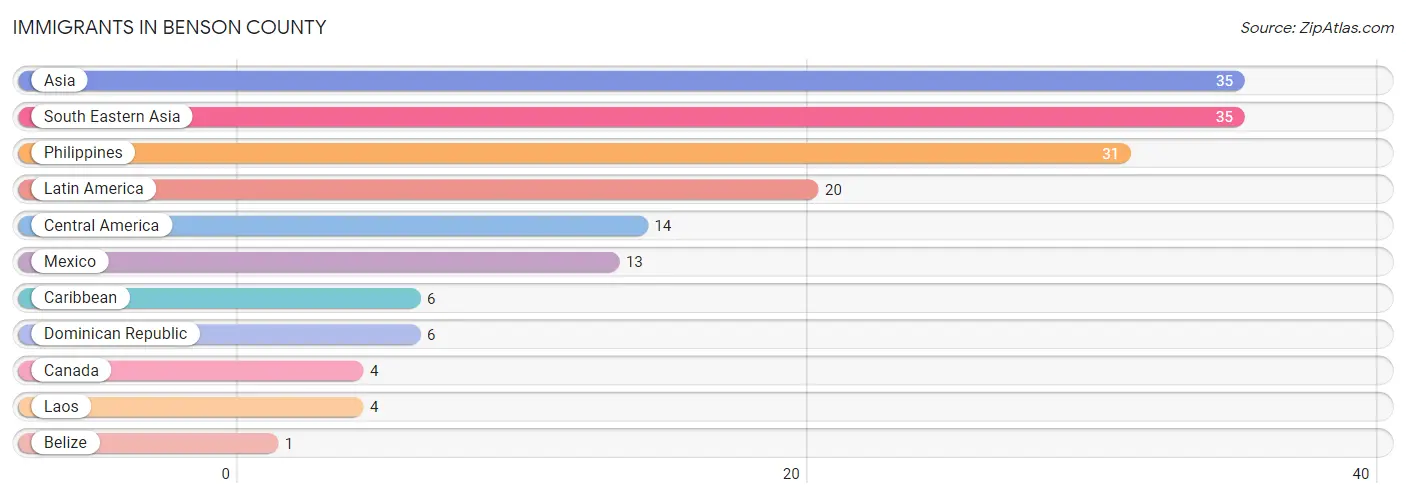
Immigrants in Benson County
The most numerous immigrant groups reported in Benson County came from Asia (35 | 0.6%), South Eastern Asia (35 | 0.6%), Philippines (31 | 0.5%), Latin America (20 | 0.3%), and Central America (14 | 0.2%), together accounting for 2.3% of all Benson County residents.
| Immigration Origin | # Population | % Population |
| Asia | 35 | 0.6% |
| Belize | 1 | 0.0% |
| Canada | 4 | 0.1% |
| Caribbean | 6 | 0.1% |
| Central America | 14 | 0.2% |
| Dominican Republic | 6 | 0.1% |
| Laos | 4 | 0.1% |
| Latin America | 20 | 0.3% |
| Mexico | 13 | 0.2% |
| Philippines | 31 | 0.5% |
| South Eastern Asia | 35 | 0.6% | View All 11 Rows |
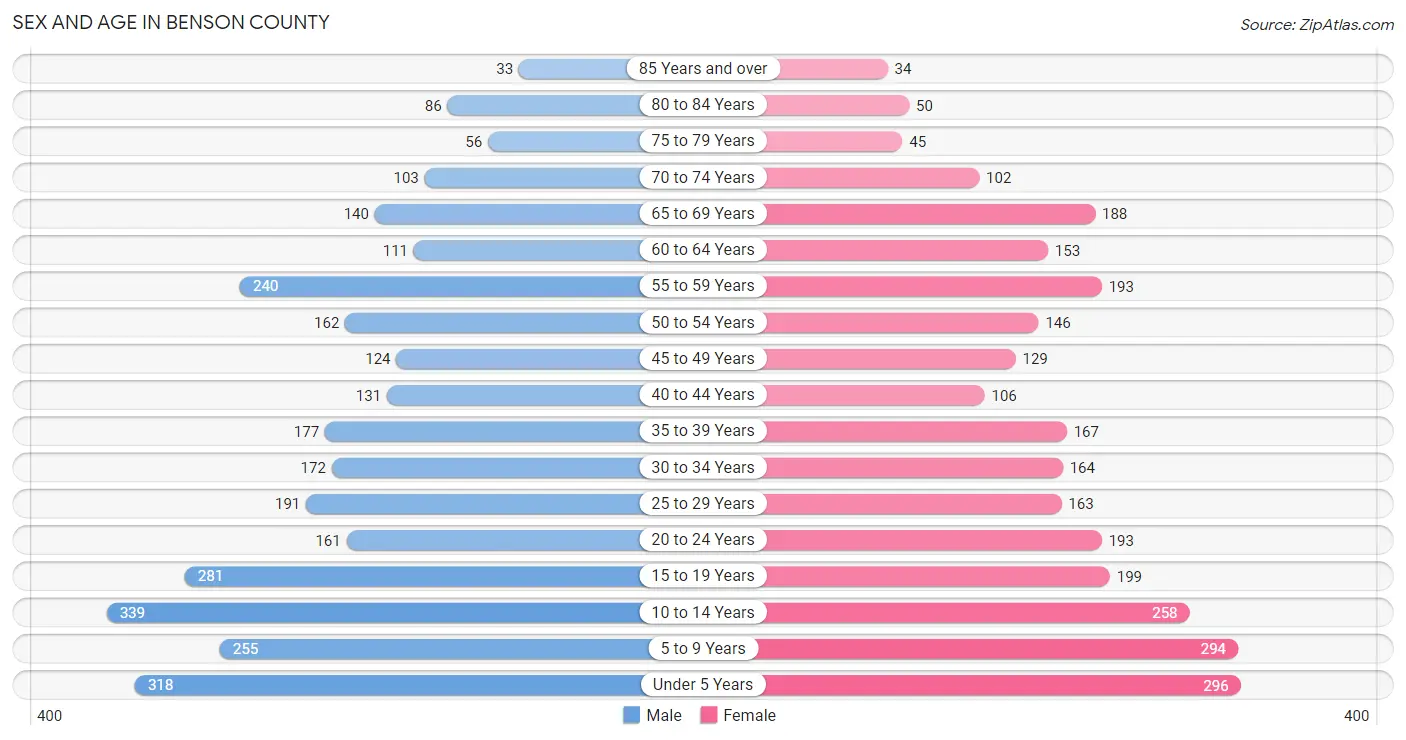
Sex and Age in Benson County
Sex and Age in Benson County
The most populous age groups in Benson County are 10 to 14 Years (339 | 11.0%) for men and Under 5 Years (296 | 10.3%) for women.
| Age Bracket | Male | Female |
| Under 5 Years | 318 (10.3%) | 296 (10.3%) |
| 5 to 9 Years | 255 (8.3%) | 294 (10.2%) |
| 10 to 14 Years | 339 (11.0%) | 258 (9.0%) |
| 15 to 19 Years | 281 (9.1%) | 199 (6.9%) |
| 20 to 24 Years | 161 (5.2%) | 193 (6.7%) |
| 25 to 29 Years | 191 (6.2%) | 163 (5.7%) |
| 30 to 34 Years | 172 (5.6%) | 164 (5.7%) |
| 35 to 39 Years | 177 (5.8%) | 167 (5.8%) |
| 40 to 44 Years | 131 (4.3%) | 106 (3.7%) |
| 45 to 49 Years | 124 (4.0%) | 129 (4.5%) |
| 50 to 54 Years | 162 (5.3%) | 146 (5.1%) |
| 55 to 59 Years | 240 (7.8%) | 193 (6.7%) |
| 60 to 64 Years | 111 (3.6%) | 153 (5.3%) |
| 65 to 69 Years | 140 (4.5%) | 188 (6.5%) |
| 70 to 74 Years | 103 (3.3%) | 102 (3.5%) |
| 75 to 79 Years | 56 (1.8%) | 45 (1.6%) |
| 80 to 84 Years | 86 (2.8%) | 50 (1.7%) |
| 85 Years and over | 33 (1.1%) | 34 (1.2%) |
| Total | 3,080 (100.0%) | 2,880 (100.0%) |
Families and Households in Benson County
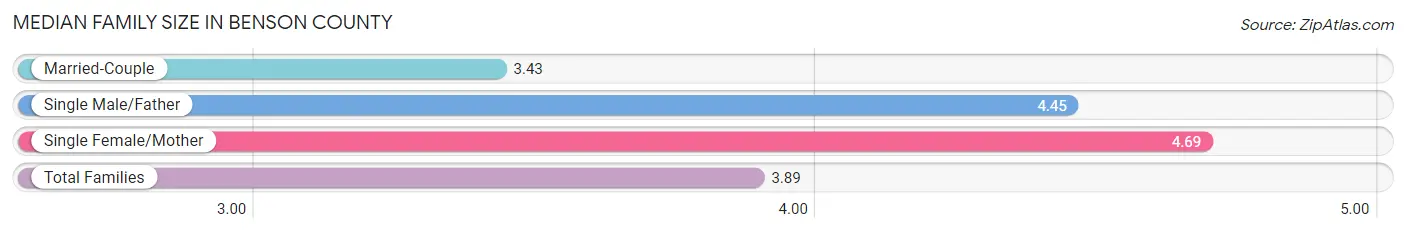
Median Family Size in Benson County
The median family size in Benson County is 3.89 persons per family, with single female/mother families (373 | 28.3%) accounting for the largest median family size of 4.69 persons per family. On the other hand, married-couple families (804 | 61.1%) represent the smallest median family size with 3.43 persons per family.
| Family Type | # Families | Family Size |
| Married-Couple | 804 (61.1%) | 3.43 |
| Single Male/Father | 139 (10.6%) | 4.45 |
| Single Female/Mother | 373 (28.3%) | 4.69 |
| Total Families | 1,316 (100.0%) | 3.89 |
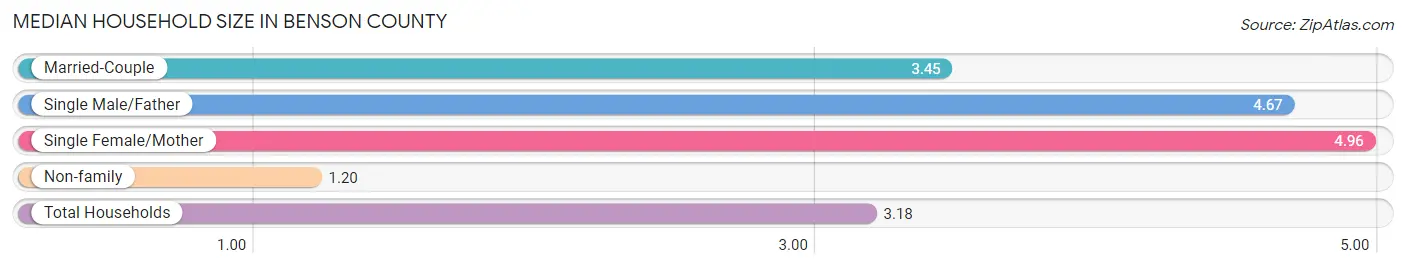
Median Household Size in Benson County
The median household size in Benson County is 3.18 persons per household, with single female/mother households (373 | 20.0%) accounting for the largest median household size of 4.96 persons per household. non-family households (553 | 29.6%) represent the smallest median household size with 1.20 persons per household.
| Household Type | # Households | Household Size |
| Married-Couple | 804 (43.0%) | 3.45 |
| Single Male/Father | 139 (7.4%) | 4.67 |
| Single Female/Mother | 373 (20.0%) | 4.96 |
| Non-family | 553 (29.6%) | 1.20 |
| Total Households | 1,869 (100.0%) | 3.18 |
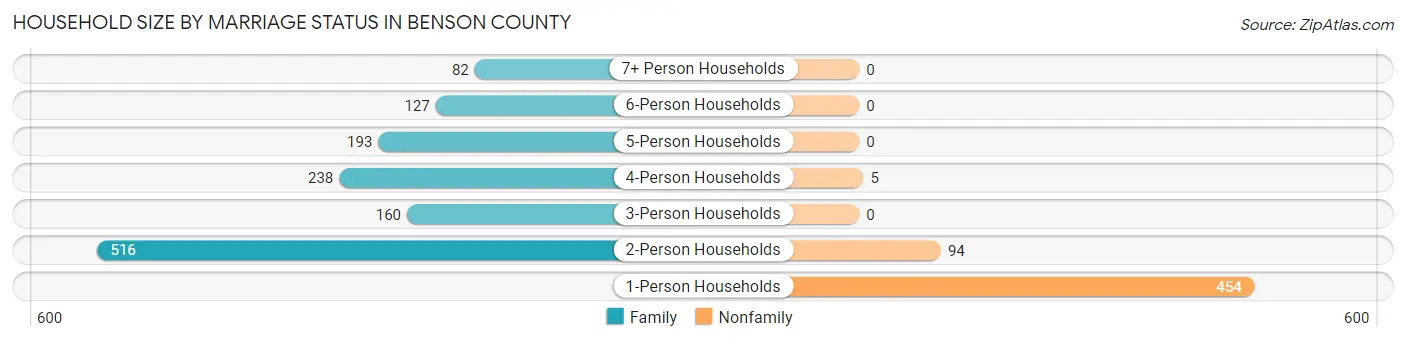
Household Size by Marriage Status in Benson County
Out of a total of 1,869 households in Benson County, 1,316 (70.4%) are family households, while 553 (29.6%) are nonfamily households. The most numerous type of family households are 2-person households, comprising 516, and the most common type of nonfamily households are 1-person households, comprising 454.
| Household Size | Family Households | Nonfamily Households |
| 1-Person Households | - | 454 (24.3%) |
| 2-Person Households | 516 (27.6%) | 94 (5.0%) |
| 3-Person Households | 160 (8.6%) | 0 (0.0%) |
| 4-Person Households | 238 (12.7%) | 5 (0.3%) |
| 5-Person Households | 193 (10.3%) | 0 (0.0%) |
| 6-Person Households | 127 (6.8%) | 0 (0.0%) |
| 7+ Person Households | 82 (4.4%) | 0 (0.0%) |
| Total | 1,316 (70.4%) | 553 (29.6%) |
Female Fertility in Benson County
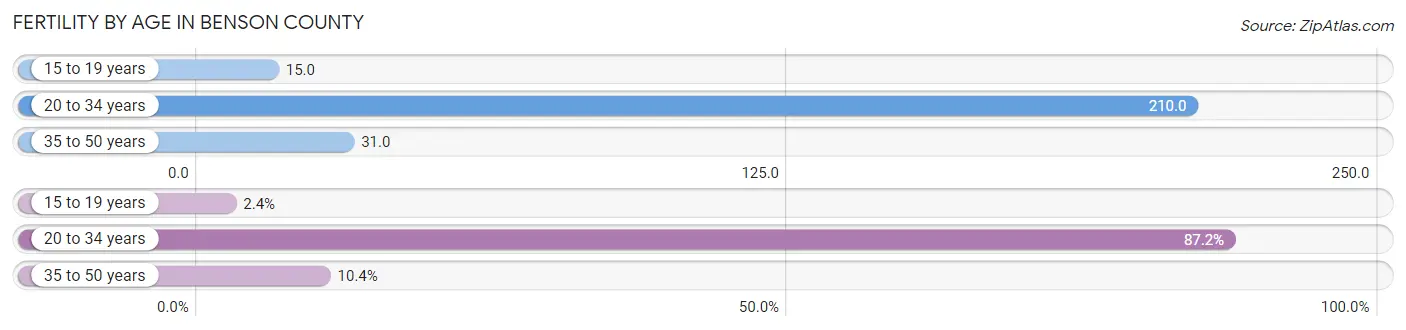
Fertility by Age in Benson County
Average fertility rate in Benson County is 109.0 births per 1,000 women. Women in the age bracket of 20 to 34 years have the highest fertility rate with 210.0 births per 1,000 women. Women in the age bracket of 20 to 34 years acount for 87.2% of all women with births.
| Age Bracket | Women with Births | Births / 1,000 Women |
| 15 to 19 years | 3 (2.4%) | 15.0 |
| 20 to 34 years | 109 (87.2%) | 210.0 |
| 35 to 50 years | 13 (10.4%) | 31.0 |
| Total | 125 (100.0%) | 109.0 |
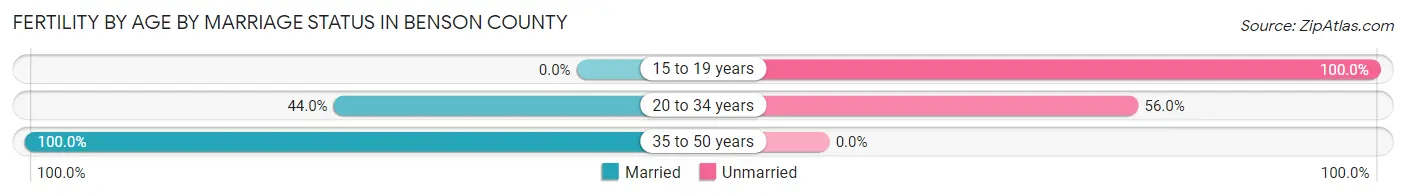
Fertility by Age by Marriage Status in Benson County
48.8% of women with births (125) in Benson County are married. The highest percentage of unmarried women with births falls into 15 to 19 years age bracket with 100.0% of them unmarried at the time of birth, while the lowest percentage of unmarried women with births belong to 35 to 50 years age bracket with 0.0% of them unmarried.
| Age Bracket | Married | Unmarried |
| 15 to 19 years | 0 (0.0%) | 3 (100.0%) |
| 20 to 34 years | 48 (44.0%) | 61 (56.0%) |
| 35 to 50 years | 13 (100.0%) | 0 (0.0%) |
| Total | 61 (48.8%) | 64 (51.2%) |
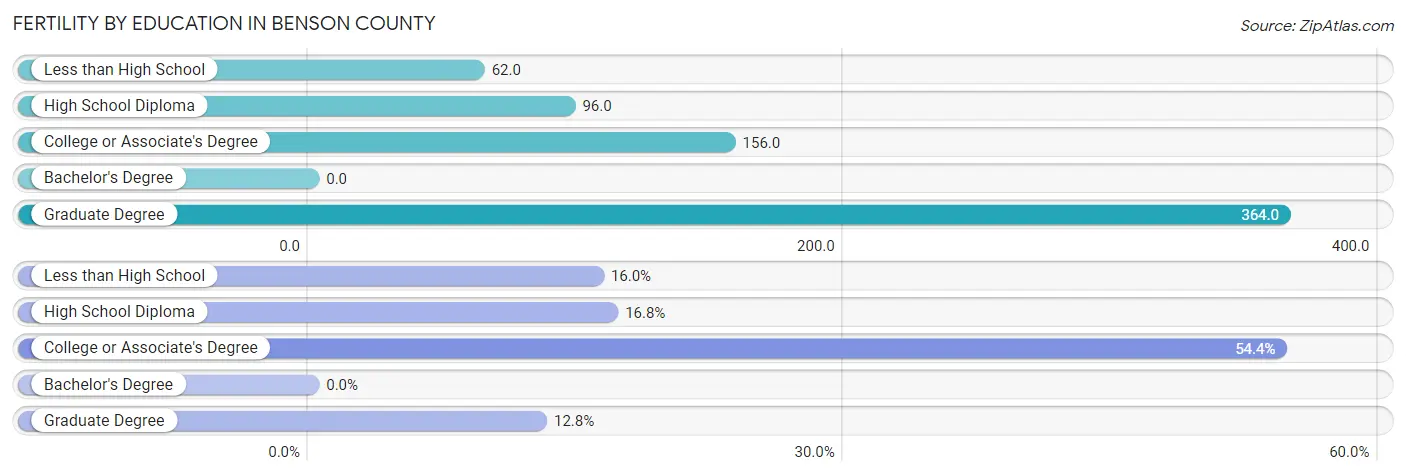
Fertility by Education in Benson County
| Educational Attainment | Women with Births | Births / 1,000 Women |
| Less than High School | 20 (16.0%) | 62.0 |
| High School Diploma | 21 (16.8%) | 96.0 |
| College or Associate's Degree | 68 (54.4%) | 156.0 |
| Bachelor's Degree | 0 (0.0%) | 0.0 |
| Graduate Degree | 16 (12.8%) | 364.0 |
| Total | 125 (100.0%) | 109.0 |
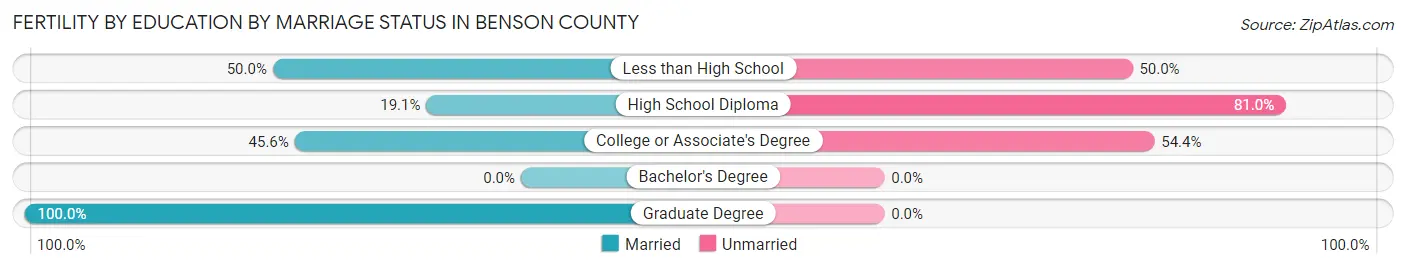
Fertility by Education by Marriage Status in Benson County
51.2% of women with births in Benson County are unmarried. Women with the educational attainment of graduate degree are most likely to be married with 100.0% of them married at childbirth, while women with the educational attainment of high school diploma are least likely to be married with 80.9% of them unmarried at childbirth.
| Educational Attainment | Married | Unmarried |
| Less than High School | 10 (50.0%) | 10 (50.0%) |
| High School Diploma | 4 (19.1%) | 17 (80.9%) |
| College or Associate's Degree | 31 (45.6%) | 37 (54.4%) |
| Bachelor's Degree | 0 (0.0%) | 0 (0.0%) |
| Graduate Degree | 16 (100.0%) | 0 (0.0%) |
| Total | 61 (48.8%) | 64 (51.2%) |
Income in Benson County
Income Overview in Benson County
Per Capita Income in Benson County is $24,490, while median incomes of families and households are $68,523 and $63,220 respectively.
| Characteristic | Number | Measure |
| Per Capita Income | 5,960 | $24,490 |
| Median Family Income | 1,316 | $68,523 |
| Mean Family Income | 1,316 | $86,044 |
| Median Household Income | 1,869 | $63,220 |
| Mean Household Income | 1,869 | $77,560 |
| Income Deficit | 1,316 | $19,229 |
| Wage / Income Gap (%) | 5,960 | 19.10% |
| Wage / Income Gap ($) | 5,960 | 80.90¢ per $1 |
| Gini / Inequality Index | 5,960 | 0.49 |
Earnings by Sex in Benson County
Average Earnings in Benson County are $41,186, $45,744 for men and $37,005 for women, a difference of 19.1%.
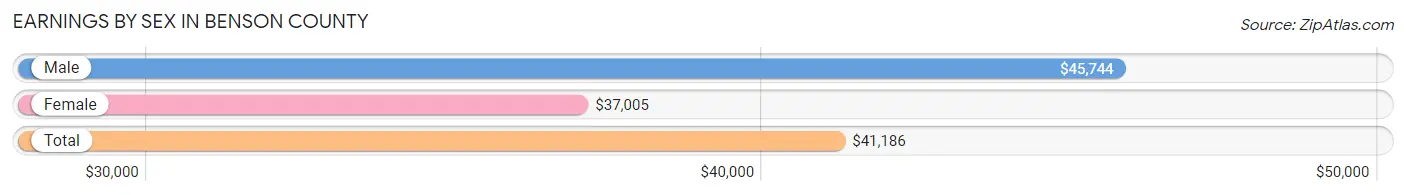
| Sex | Number | Average Earnings |
| Male | 1,201 (52.2%) | $45,744 |
| Female | 1,101 (47.8%) | $37,005 |
| Total | 2,302 (100.0%) | $41,186 |
Earnings by Sex by Income Bracket in Benson County
The most common earnings brackets in Benson County are $55,000 to $64,999 for men (150 | 12.5%) and $55,000 to $64,999 for women (120 | 10.9%).
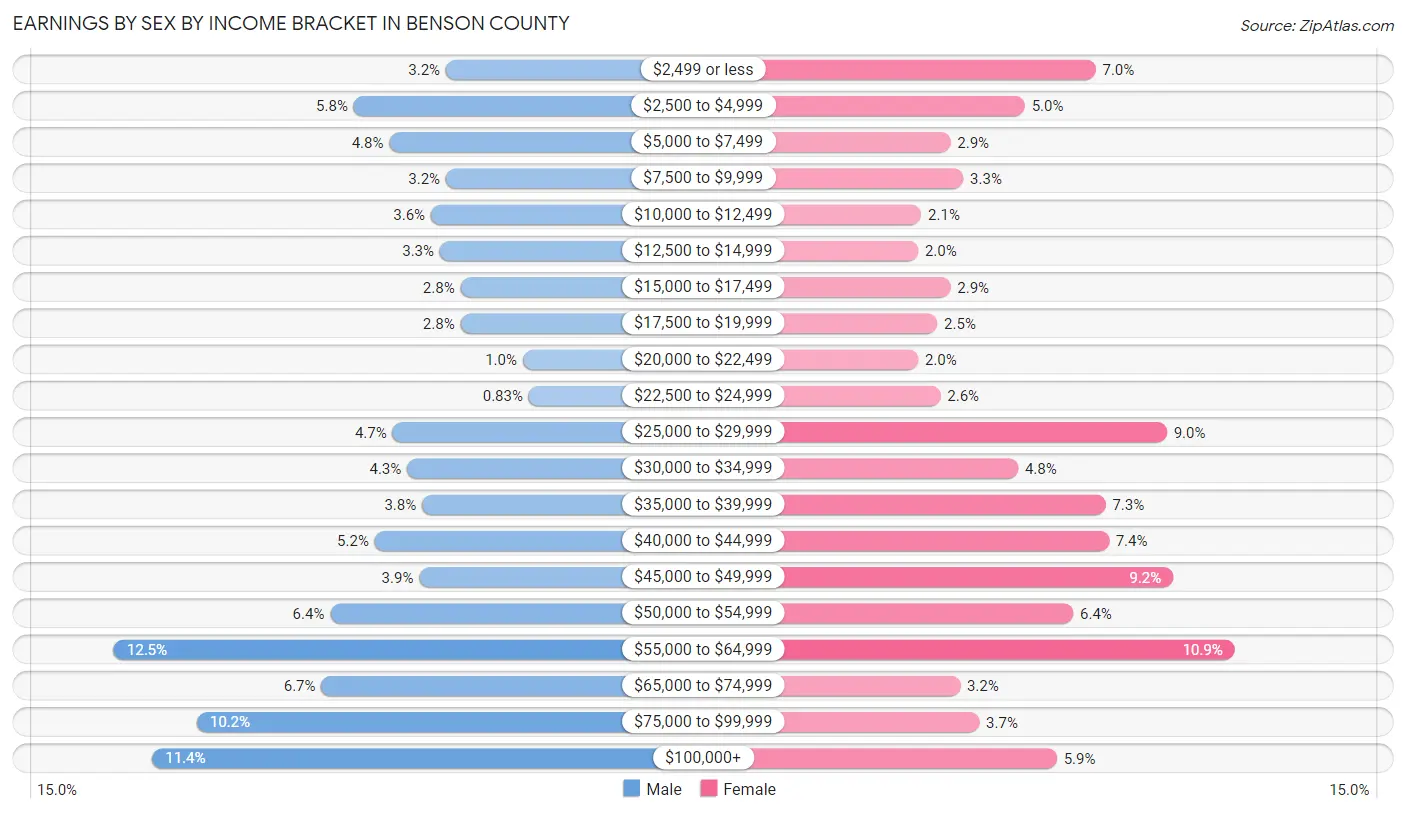
| Income | Male | Female |
| $2,499 or less | 38 (3.2%) | 77 (7.0%) |
| $2,500 to $4,999 | 69 (5.8%) | 55 (5.0%) |
| $5,000 to $7,499 | 57 (4.8%) | 32 (2.9%) |
| $7,500 to $9,999 | 38 (3.2%) | 36 (3.3%) |
| $10,000 to $12,499 | 43 (3.6%) | 23 (2.1%) |
| $12,500 to $14,999 | 40 (3.3%) | 22 (2.0%) |
| $15,000 to $17,499 | 33 (2.8%) | 32 (2.9%) |
| $17,500 to $19,999 | 33 (2.8%) | 28 (2.5%) |
| $20,000 to $22,499 | 12 (1.0%) | 22 (2.0%) |
| $22,500 to $24,999 | 10 (0.8%) | 29 (2.6%) |
| $25,000 to $29,999 | 56 (4.7%) | 99 (9.0%) |
| $30,000 to $34,999 | 51 (4.3%) | 53 (4.8%) |
| $35,000 to $39,999 | 46 (3.8%) | 80 (7.3%) |
| $40,000 to $44,999 | 62 (5.2%) | 81 (7.4%) |
| $45,000 to $49,999 | 47 (3.9%) | 101 (9.2%) |
| $50,000 to $54,999 | 77 (6.4%) | 70 (6.4%) |
| $55,000 to $64,999 | 150 (12.5%) | 120 (10.9%) |
| $65,000 to $74,999 | 80 (6.7%) | 35 (3.2%) |
| $75,000 to $99,999 | 122 (10.2%) | 41 (3.7%) |
| $100,000+ | 137 (11.4%) | 65 (5.9%) |
| Total | 1,201 (100.0%) | 1,101 (100.0%) |
Earnings by Sex by Educational Attainment in Benson County
Average earnings in Benson County are $52,608 for men and $41,181 for women, a difference of 21.7%. Men with an educational attainment of bachelor's degree enjoy the highest average annual earnings of $67,531, while those with less than high school education earn the least with $15,972. Women with an educational attainment of bachelor's degree earn the most with the average annual earnings of $55,043, while those with less than high school education have the smallest earnings of $23,333.
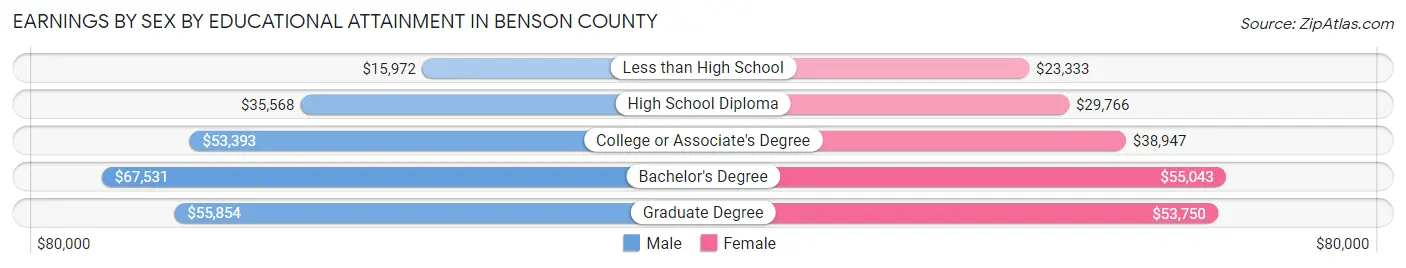
| Educational Attainment | Male Income | Female Income |
| Less than High School | $15,972 | $23,333 |
| High School Diploma | $35,568 | $29,766 |
| College or Associate's Degree | $53,393 | $38,947 |
| Bachelor's Degree | $67,531 | $55,043 |
| Graduate Degree | $55,854 | $53,750 |
| Total | $52,608 | $41,181 |
Family Income in Benson County
Family Income Brackets in Benson County
According to the Benson County family income data, there are 236 families falling into the $50,000 to $74,999 income range, which is the most common income bracket and makes up 17.9% of all families. Conversely, the $10,000 to $14,999 income bracket is the least frequent group with only 37 families (2.8%) belonging to this category.
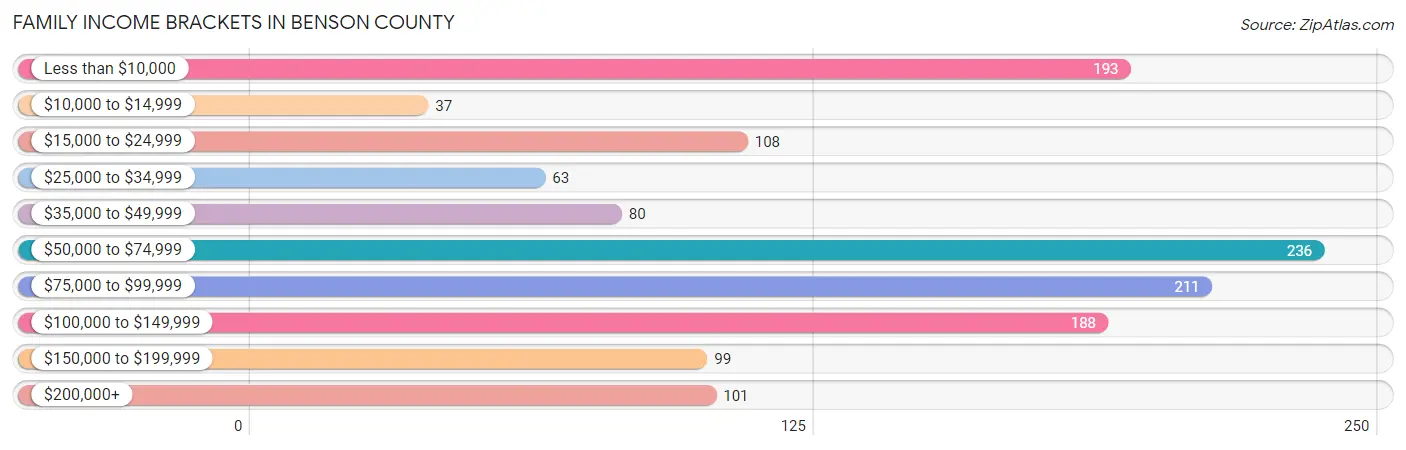
| Income Bracket | # Families | % Families |
| Less than $10,000 | 193 | 14.7% |
| $10,000 to $14,999 | 37 | 2.8% |
| $15,000 to $24,999 | 108 | 8.2% |
| $25,000 to $34,999 | 63 | 4.8% |
| $35,000 to $49,999 | 80 | 6.1% |
| $50,000 to $74,999 | 236 | 17.9% |
| $75,000 to $99,999 | 211 | 16.0% |
| $100,000 to $149,999 | 188 | 14.3% |
| $150,000 to $199,999 | 99 | 7.5% |
| $200,000+ | 101 | 7.7% |
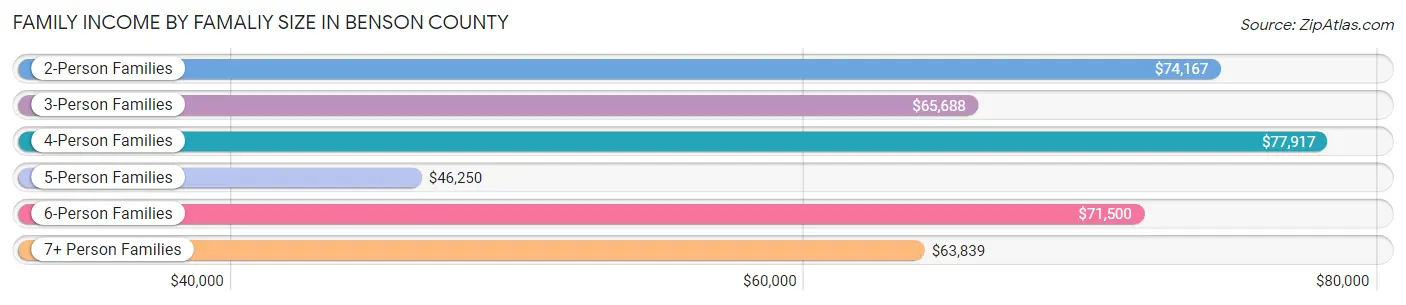
Family Income by Famaliy Size in Benson County
4-person families (234 | 17.8%) account for the highest median family income in Benson County with $77,917 per family, while 2-person families (538 | 40.9%) have the highest median income of $37,084 per family member.
| Income Bracket | # Families | Median Income |
| 2-Person Families | 538 (40.9%) | $74,167 |
| 3-Person Families | 177 (13.5%) | $65,688 |
| 4-Person Families | 234 (17.8%) | $77,917 |
| 5-Person Families | 174 (13.2%) | $46,250 |
| 6-Person Families | 126 (9.6%) | $71,500 |
| 7+ Person Families | 67 (5.1%) | $63,839 |
| Total | 1,316 (100.0%) | $68,523 |
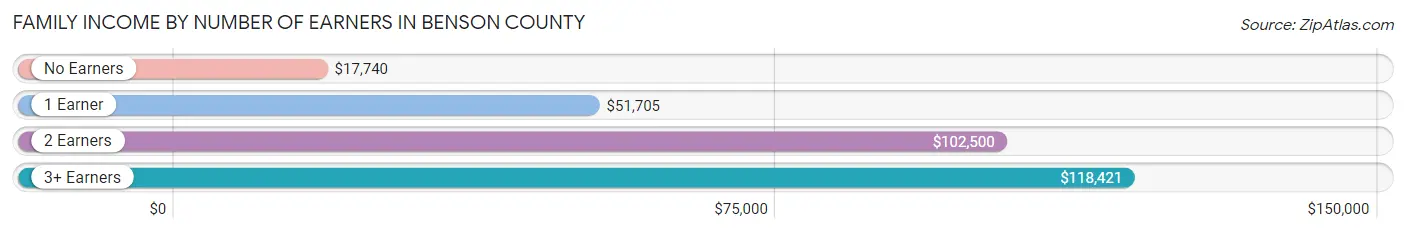
Family Income by Number of Earners in Benson County
The median family income in Benson County is $68,523, with families comprising 3+ earners (96) having the highest median family income of $118,421, while families with no earners (277) have the lowest median family income of $17,740, accounting for 7.3% and 21.0% of families, respectively.
| Number of Earners | # Families | Median Income |
| No Earners | 277 (21.0%) | $17,740 |
| 1 Earner | 471 (35.8%) | $51,705 |
| 2 Earners | 472 (35.9%) | $102,500 |
| 3+ Earners | 96 (7.3%) | $118,421 |
| Total | 1,316 (100.0%) | $68,523 |
Household Income in Benson County
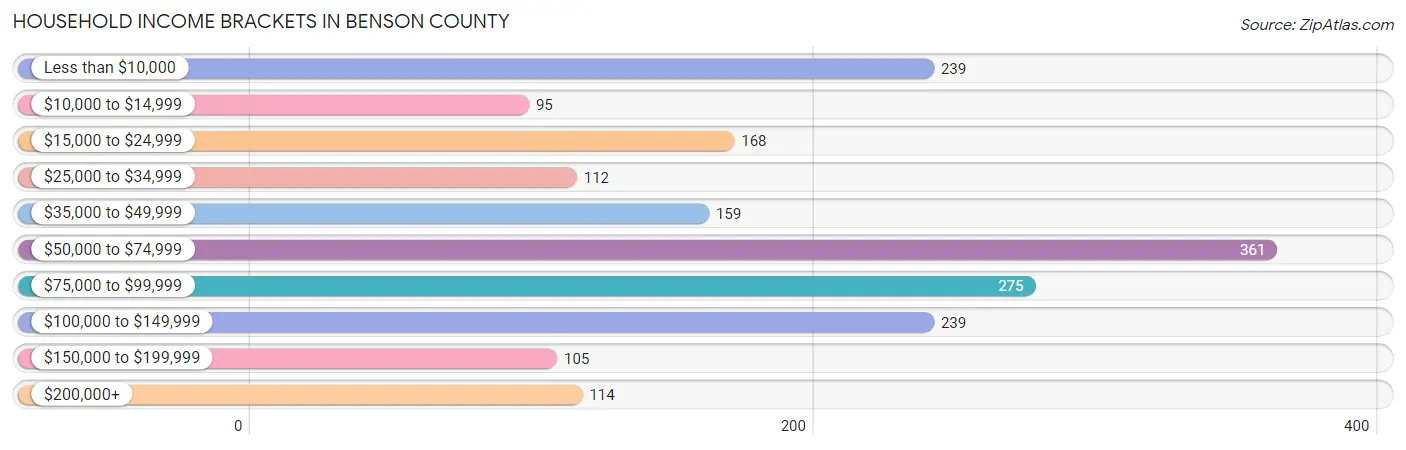
Household Income Brackets in Benson County
With 361 households falling in the category, the $50,000 to $74,999 income range is the most frequent in Benson County, accounting for 19.3% of all households. In contrast, only 95 households (5.1%) fall into the $10,000 to $14,999 income bracket, making it the least populous group.
| Income Bracket | # Households | % Households |
| Less than $10,000 | 239 | 12.8% |
| $10,000 to $14,999 | 95 | 5.1% |
| $15,000 to $24,999 | 168 | 9.0% |
| $25,000 to $34,999 | 112 | 6.0% |
| $35,000 to $49,999 | 159 | 8.5% |
| $50,000 to $74,999 | 361 | 19.3% |
| $75,000 to $99,999 | 275 | 14.7% |
| $100,000 to $149,999 | 239 | 12.8% |
| $150,000 to $199,999 | 105 | 5.6% |
| $200,000+ | 114 | 6.1% |
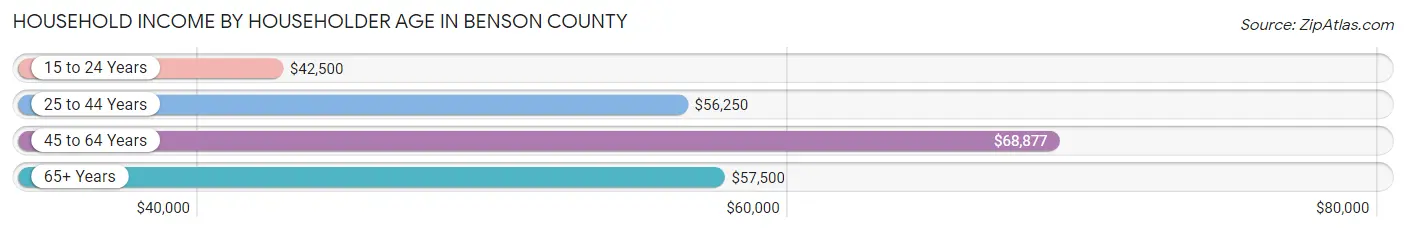
Household Income by Householder Age in Benson County
The median household income in Benson County is $63,220, with the highest median household income of $68,877 found in the 45 to 64 years age bracket for the primary householder. A total of 763 households (40.8%) fall into this category. Meanwhile, the 15 to 24 years age bracket for the primary householder has the lowest median household income of $42,500, with 60 households (3.2%) in this group.
| Income Bracket | # Households | Median Income |
| 15 to 24 Years | 60 (3.2%) | $42,500 |
| 25 to 44 Years | 524 (28.0%) | $56,250 |
| 45 to 64 Years | 763 (40.8%) | $68,877 |
| 65+ Years | 522 (27.9%) | $57,500 |
| Total | 1,869 (100.0%) | $63,220 |
Poverty in Benson County
Income Below Poverty by Sex and Age in Benson County
With 25.6% poverty level for males and 28.9% for females among the residents of Benson County, 6 to 11 year old males and 12 to 14 year old females are the most vulnerable to poverty, with 164 males (47.8%) and 113 females (61.1%) in their respective age groups living below the poverty level.
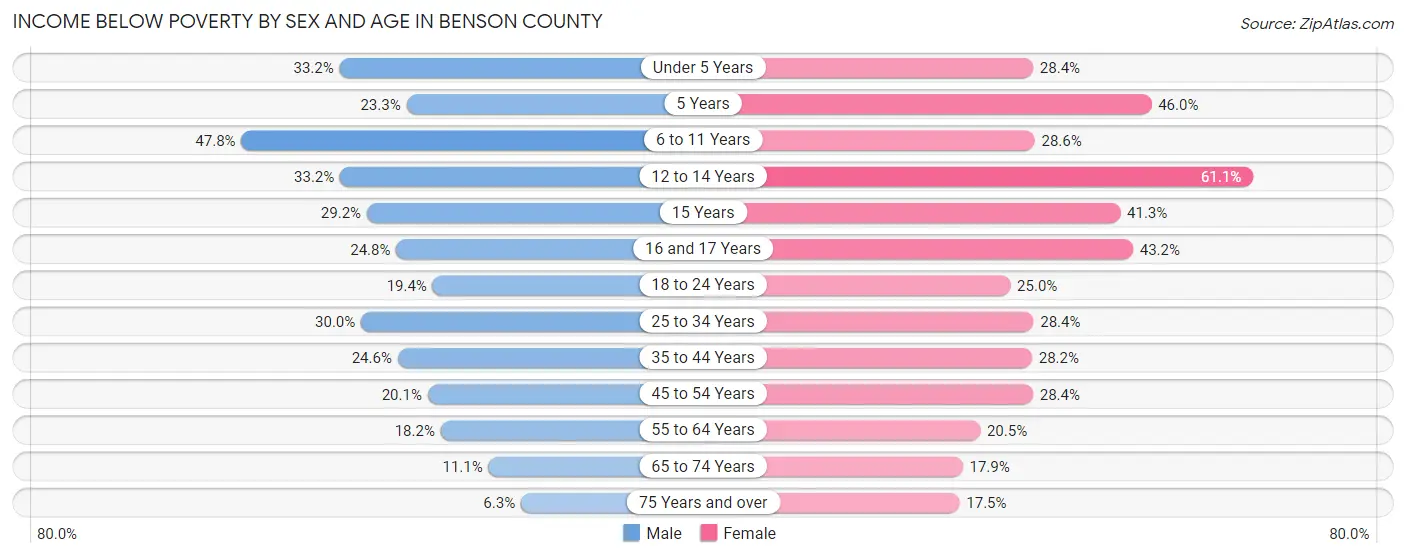
| Age Bracket | Male | Female |
| Under 5 Years | 105 (33.2%) | 84 (28.4%) |
| 5 Years | 17 (23.3%) | 34 (46.0%) |
| 6 to 11 Years | 164 (47.8%) | 81 (28.6%) |
| 12 to 14 Years | 59 (33.2%) | 113 (61.1%) |
| 15 Years | 14 (29.2%) | 31 (41.3%) |
| 16 and 17 Years | 31 (24.8%) | 35 (43.2%) |
| 18 to 24 Years | 52 (19.4%) | 59 (25.0%) |
| 25 to 34 Years | 109 (30.0%) | 93 (28.4%) |
| 35 to 44 Years | 75 (24.6%) | 77 (28.2%) |
| 45 to 54 Years | 57 (20.1%) | 78 (28.4%) |
| 55 to 64 Years | 63 (18.2%) | 71 (20.5%) |
| 65 to 74 Years | 27 (11.1%) | 52 (17.9%) |
| 75 Years and over | 11 (6.3%) | 22 (17.5%) |
| Total | 784 (25.6%) | 830 (28.9%) |
Income Above Poverty by Sex and Age in Benson County
According to the poverty statistics in Benson County, males aged 75 years and over and females aged 75 years and over are the age groups that are most secure financially, with 93.7% of males and 82.5% of females in these age groups living above the poverty line.
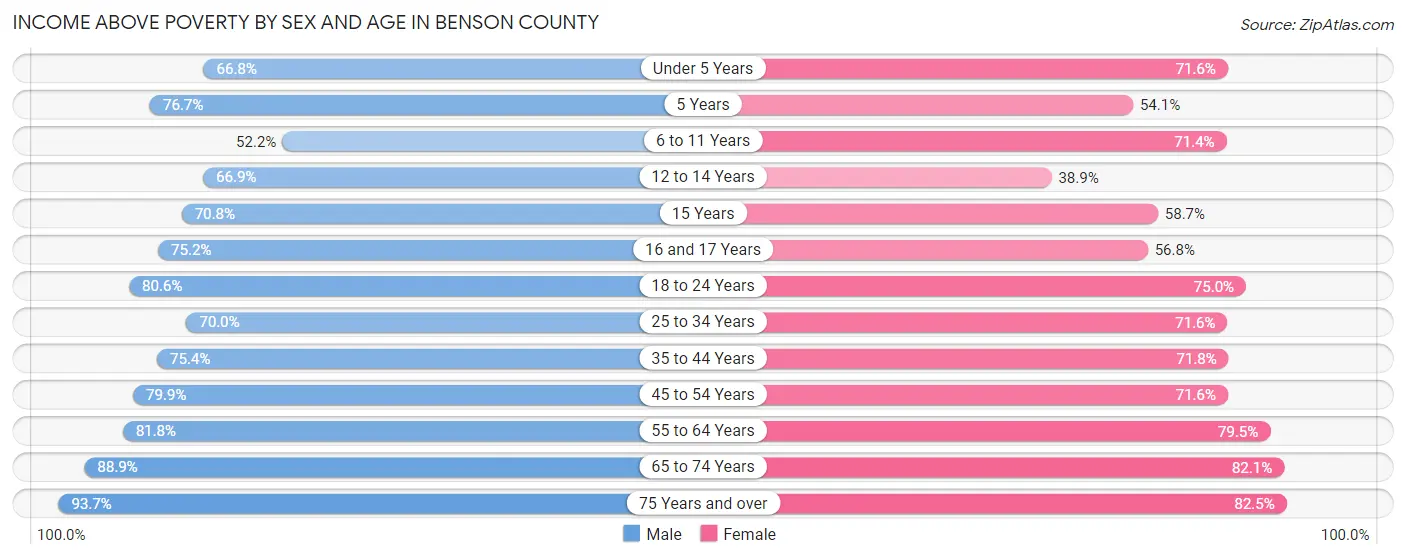
| Age Bracket | Male | Female |
| Under 5 Years | 211 (66.8%) | 212 (71.6%) |
| 5 Years | 56 (76.7%) | 40 (54.0%) |
| 6 to 11 Years | 179 (52.2%) | 202 (71.4%) |
| 12 to 14 Years | 119 (66.8%) | 72 (38.9%) |
| 15 Years | 34 (70.8%) | 44 (58.7%) |
| 16 and 17 Years | 94 (75.2%) | 46 (56.8%) |
| 18 to 24 Years | 216 (80.6%) | 177 (75.0%) |
| 25 to 34 Years | 254 (70.0%) | 234 (71.6%) |
| 35 to 44 Years | 230 (75.4%) | 196 (71.8%) |
| 45 to 54 Years | 226 (79.9%) | 197 (71.6%) |
| 55 to 64 Years | 283 (81.8%) | 275 (79.5%) |
| 65 to 74 Years | 216 (88.9%) | 238 (82.1%) |
| 75 Years and over | 164 (93.7%) | 104 (82.5%) |
| Total | 2,282 (74.4%) | 2,037 (71.1%) |
Income Below Poverty Among Married-Couple Families in Benson County
The poverty statistics for married-couple families in Benson County show that 7.1% or 57 of the total 804 families live below the poverty line. Families with 5 or more children have the highest poverty rate of 30.4%, comprising of 7 families. On the other hand, families with no children have the lowest poverty rate of 3.5%, which includes 17 families.
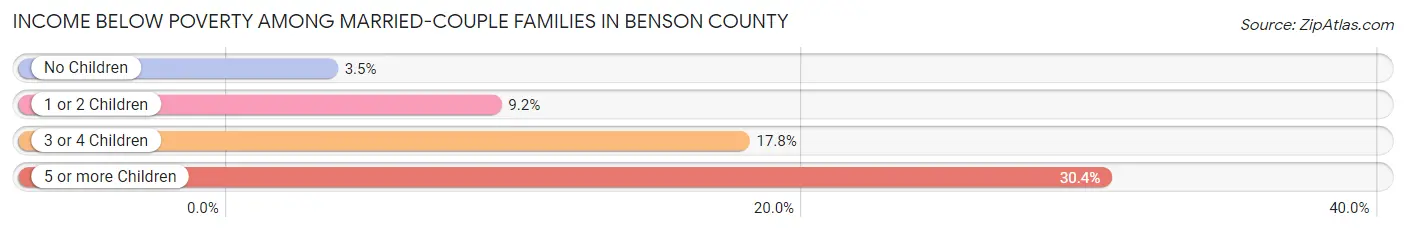
| Children | Above Poverty | Below Poverty |
| No Children | 473 (96.5%) | 17 (3.5%) |
| 1 or 2 Children | 198 (90.8%) | 20 (9.2%) |
| 3 or 4 Children | 60 (82.2%) | 13 (17.8%) |
| 5 or more Children | 16 (69.6%) | 7 (30.4%) |
| Total | 747 (92.9%) | 57 (7.1%) |
Income Below Poverty Among Single-Parent Households in Benson County
According to the poverty data in Benson County, 46.8% or 65 single-father households and 50.7% or 189 single-mother households are living below the poverty line. Among single-father households, those with 3 or 4 children have the highest poverty rate, with 26 households (70.3%) experiencing poverty. Likewise, among single-mother households, those with 3 or 4 children have the highest poverty rate, with 94 households (75.8%) falling below the poverty line.
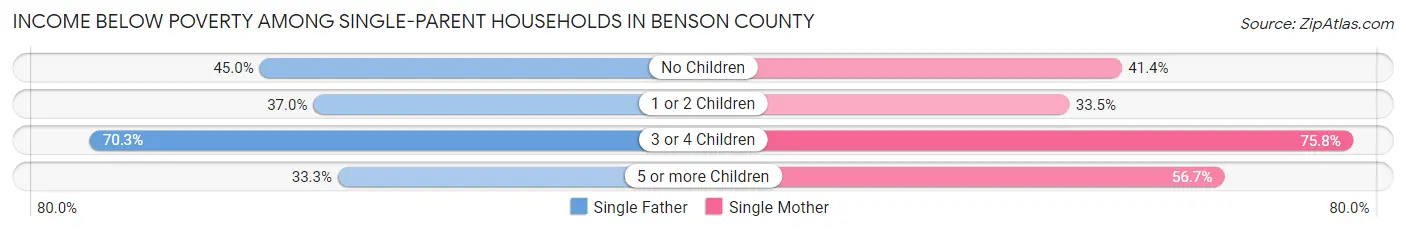
| Children | Single Father | Single Mother |
| No Children | 9 (45.0%) | 24 (41.4%) |
| 1 or 2 Children | 27 (37.0%) | 54 (33.5%) |
| 3 or 4 Children | 26 (70.3%) | 94 (75.8%) |
| 5 or more Children | 3 (33.3%) | 17 (56.7%) |
| Total | 65 (46.8%) | 189 (50.7%) |
Income Below Poverty Among Married-Couple vs Single-Parent Households in Benson County
The poverty data for Benson County shows that 57 of the married-couple family households (7.1%) and 254 of the single-parent households (49.6%) are living below the poverty level. Within the married-couple family households, those with 5 or more children have the highest poverty rate, with 7 households (30.4%) falling below the poverty line. Among the single-parent households, those with 3 or 4 children have the highest poverty rate, with 120 household (74.5%) living below poverty.
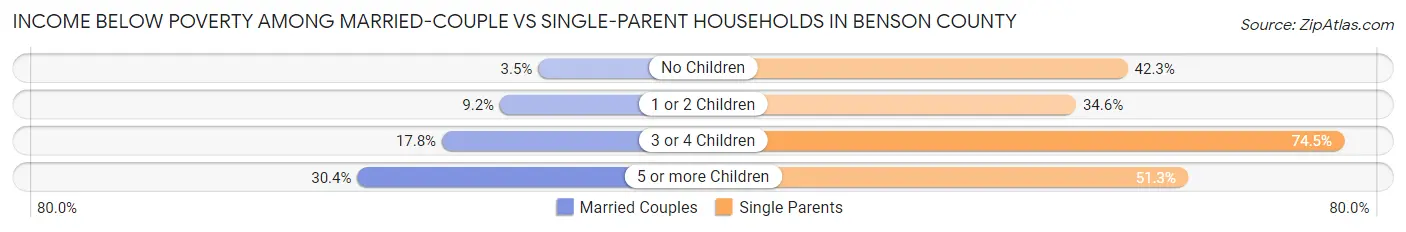
| Children | Married-Couple Families | Single-Parent Households |
| No Children | 17 (3.5%) | 33 (42.3%) |
| 1 or 2 Children | 20 (9.2%) | 81 (34.6%) |
| 3 or 4 Children | 13 (17.8%) | 120 (74.5%) |
| 5 or more Children | 7 (30.4%) | 20 (51.3%) |
| Total | 57 (7.1%) | 254 (49.6%) |
Employment Characteristics in Benson County
Employment by Class of Employer in Benson County
Among the 2,014 employed individuals in Benson County, private company employees (954 | 47.4%), local government employees (423 | 21.0%), and not-for-profit organizations (294 | 14.6%) make up the most common classes of employment.
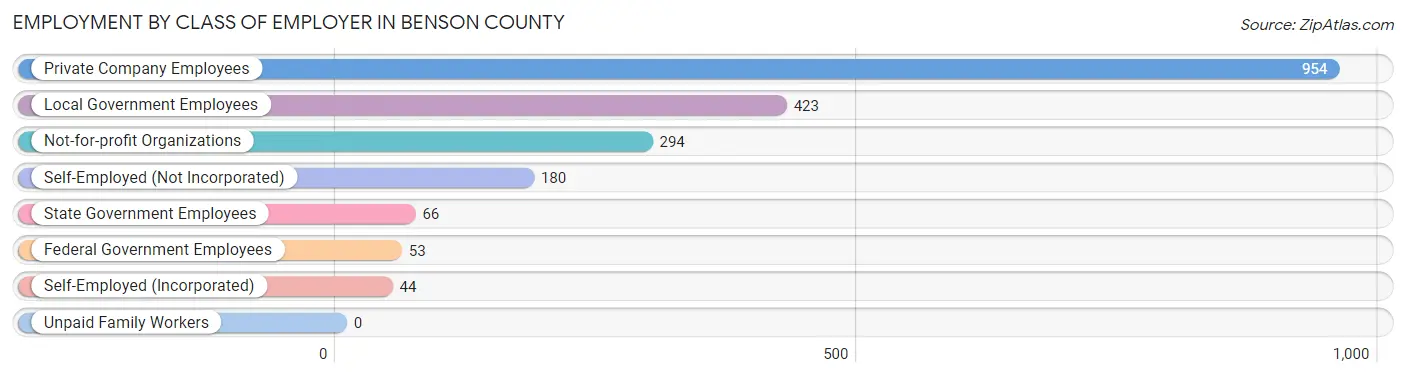
| Employer Class | # Employees | % Employees |
| Private Company Employees | 954 | 47.4% |
| Self-Employed (Incorporated) | 44 | 2.2% |
| Self-Employed (Not Incorporated) | 180 | 8.9% |
| Not-for-profit Organizations | 294 | 14.6% |
| Local Government Employees | 423 | 21.0% |
| State Government Employees | 66 | 3.3% |
| Federal Government Employees | 53 | 2.6% |
| Unpaid Family Workers | 0 | 0.0% |
| Total | 2,014 | 100.0% |
Employment Status by Age in Benson County
According to the labor force statistics for Benson County, out of the total population over 16 years of age (4,077), 51.4% or 2,096 individuals are in the labor force, with 2.2% or 46 of them unemployed. The age group with the highest labor force participation rate is 55 to 59 years, with 71.8% or 311 individuals in the labor force. Within the labor force, the 16 to 19 years age range has the highest percentage of unemployed individuals, with 10.1% or 10 of them being unemployed.
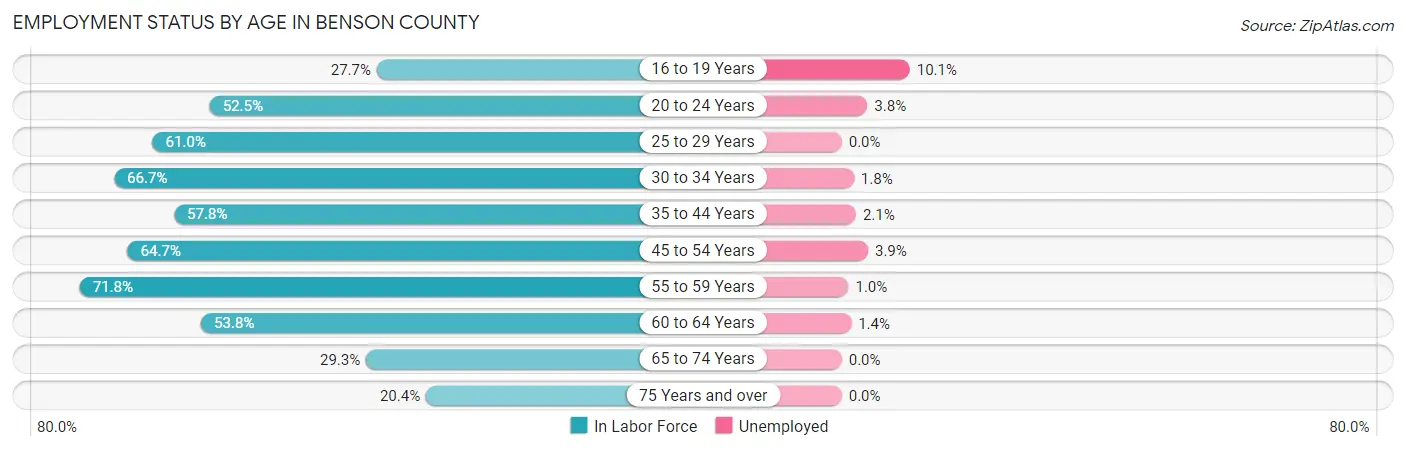
| Age Bracket | In Labor Force | Unemployed |
| 16 to 19 Years | 99 (27.7%) | 10 (10.1%) |
| 20 to 24 Years | 186 (52.5%) | 7 (3.8%) |
| 25 to 29 Years | 216 (61.0%) | 0 (0.0%) |
| 30 to 34 Years | 224 (66.7%) | 4 (1.8%) |
| 35 to 44 Years | 336 (57.8%) | 7 (2.1%) |
| 45 to 54 Years | 363 (64.7%) | 14 (3.9%) |
| 55 to 59 Years | 311 (71.8%) | 3 (1.0%) |
| 60 to 64 Years | 142 (53.8%) | 2 (1.4%) |
| 65 to 74 Years | 156 (29.3%) | 0 (0.0%) |
| 75 Years and over | 62 (20.4%) | 0 (0.0%) |
| Total | 2,096 (51.4%) | 46 (2.2%) |
Employment Status by Educational Attainment in Benson County
According to labor force statistics for Benson County, 62.9% of individuals (1,591) out of the total population between 25 and 64 years of age (2,529) are in the labor force, with 1.9% or 30 of them being unemployed. The group with the highest labor force participation rate are those with the educational attainment of bachelor's degree or higher, with 89.9% or 419 individuals in the labor force. Within the labor force, individuals with less than high school education have the highest percentage of unemployment, with 6.3% or 5 of them being unemployed.
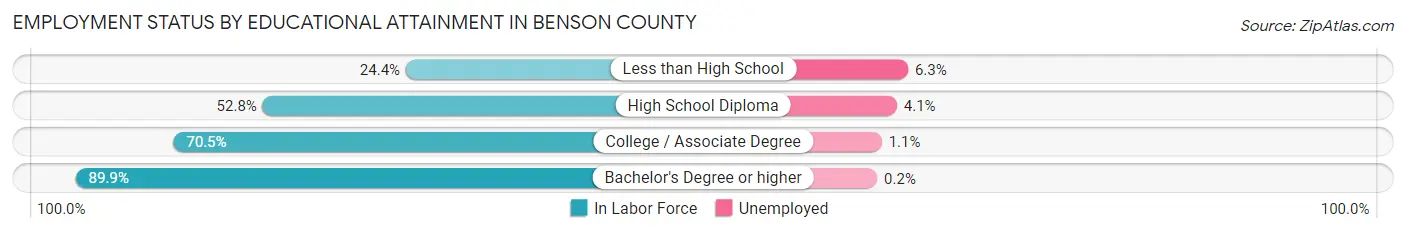
| Educational Attainment | In Labor Force | Unemployed |
| Less than High School | 79 (24.4%) | 20 (6.3%) |
| High School Diploma | 393 (52.8%) | 31 (4.1%) |
| College / Associate Degree | 701 (70.5%) | 11 (1.1%) |
| Bachelor's Degree or higher | 419 (89.9%) | 1 (0.2%) |
| Total | 1,591 (62.9%) | 48 (1.9%) |
Employment Occupations by Sex in Benson County
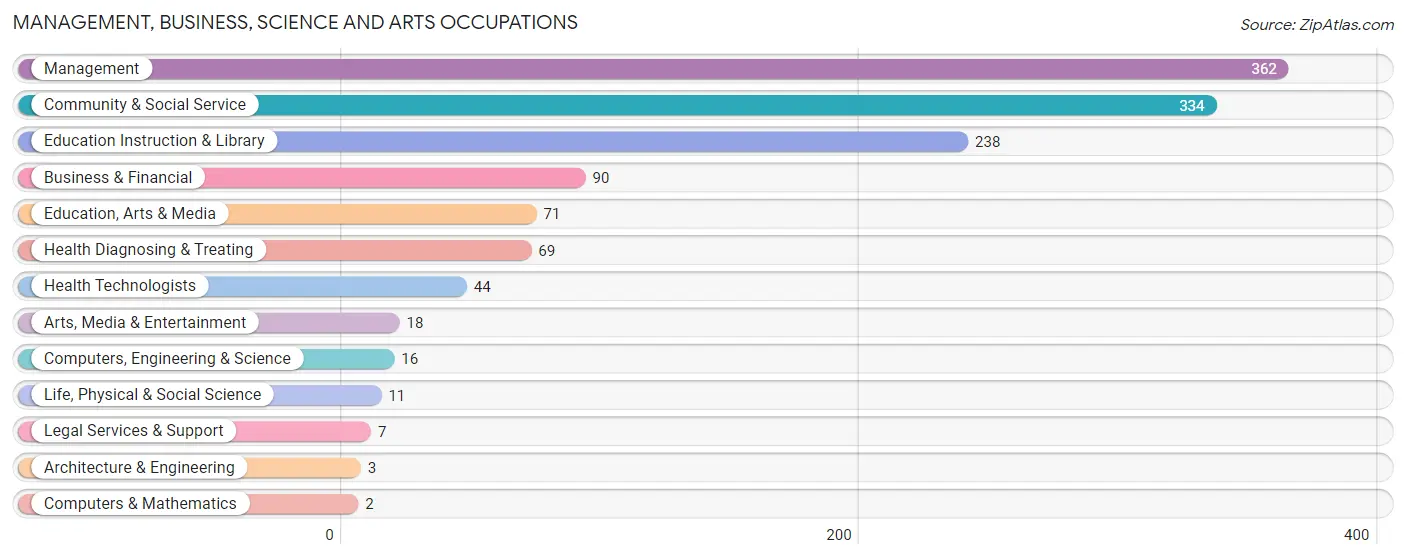
Management, Business, Science and Arts Occupations
The most common Management, Business, Science and Arts occupations in Benson County are Management (362 | 17.7%), Community & Social Service (334 | 16.3%), Education Instruction & Library (238 | 11.6%), Business & Financial (90 | 4.4%), and Education, Arts & Media (71 | 3.5%).
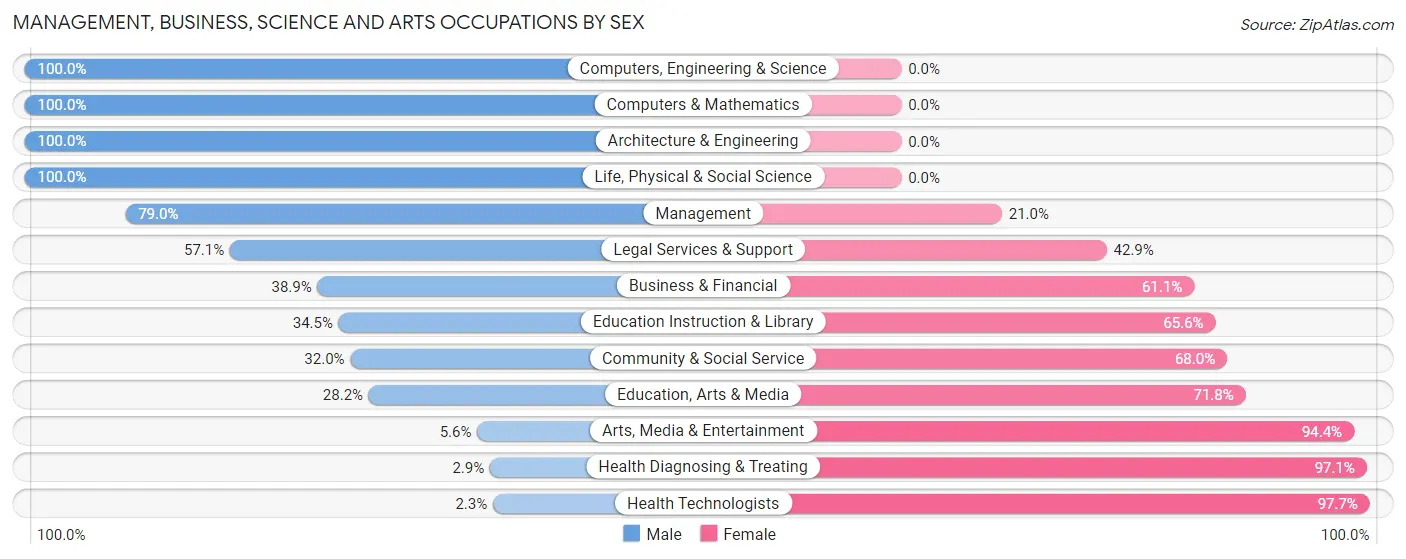
Management, Business, Science and Arts Occupations by Sex
Within the Management, Business, Science and Arts occupations in Benson County, the most male-oriented occupations are Computers, Engineering & Science (100.0%), Computers & Mathematics (100.0%), and Architecture & Engineering (100.0%), while the most female-oriented occupations are Health Technologists (97.7%), Health Diagnosing & Treating (97.1%), and Arts, Media & Entertainment (94.4%).
| Occupation | Male | Female |
| Management | 286 (79.0%) | 76 (21.0%) |
| Business & Financial | 35 (38.9%) | 55 (61.1%) |
| Computers, Engineering & Science | 16 (100.0%) | 0 (0.0%) |
| Computers & Mathematics | 2 (100.0%) | 0 (0.0%) |
| Architecture & Engineering | 3 (100.0%) | 0 (0.0%) |
| Life, Physical & Social Science | 11 (100.0%) | 0 (0.0%) |
| Community & Social Service | 107 (32.0%) | 227 (68.0%) |
| Education, Arts & Media | 20 (28.2%) | 51 (71.8%) |
| Legal Services & Support | 4 (57.1%) | 3 (42.9%) |
| Education Instruction & Library | 82 (34.4%) | 156 (65.5%) |
| Arts, Media & Entertainment | 1 (5.6%) | 17 (94.4%) |
| Health Diagnosing & Treating | 2 (2.9%) | 67 (97.1%) |
| Health Technologists | 1 (2.3%) | 43 (97.7%) |
| Total (Category) | 446 (51.2%) | 425 (48.8%) |
| Total (Overall) | 1,076 (52.5%) | 972 (47.5%) |
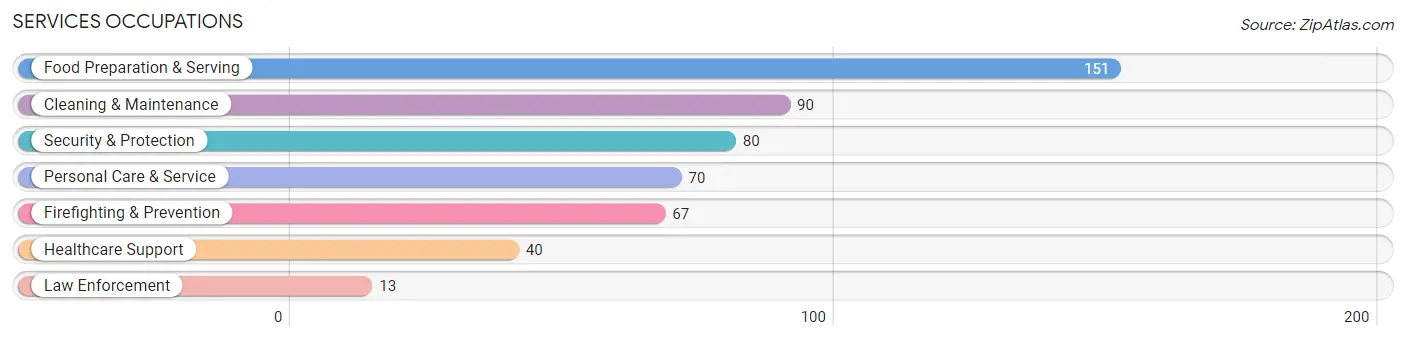
Services Occupations
The most common Services occupations in Benson County are Food Preparation & Serving (151 | 7.4%), Cleaning & Maintenance (90 | 4.4%), Security & Protection (80 | 3.9%), Personal Care & Service (70 | 3.4%), and Firefighting & Prevention (67 | 3.3%).
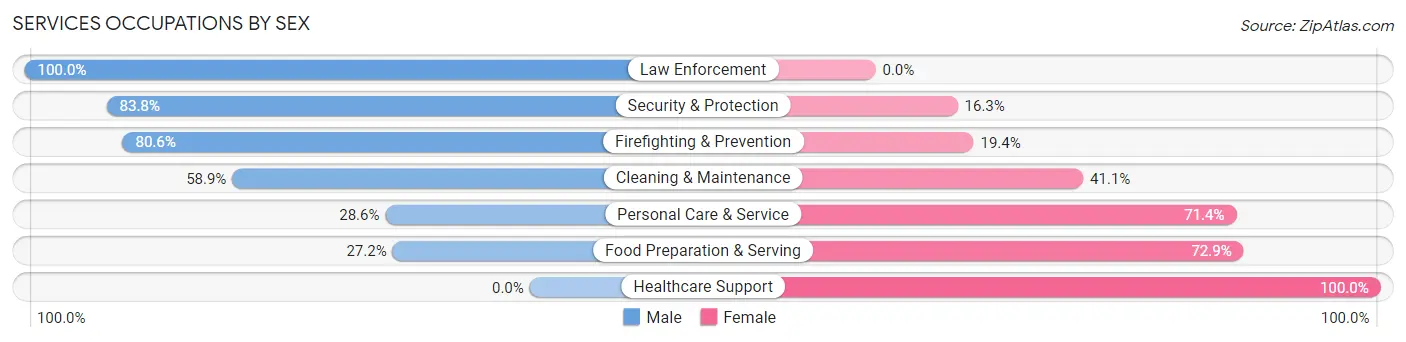
Services Occupations by Sex
Within the Services occupations in Benson County, the most male-oriented occupations are Law Enforcement (100.0%), Security & Protection (83.8%), and Firefighting & Prevention (80.6%), while the most female-oriented occupations are Healthcare Support (100.0%), Food Preparation & Serving (72.9%), and Personal Care & Service (71.4%).
| Occupation | Male | Female |
| Healthcare Support | 0 (0.0%) | 40 (100.0%) |
| Security & Protection | 67 (83.8%) | 13 (16.3%) |
| Firefighting & Prevention | 54 (80.6%) | 13 (19.4%) |
| Law Enforcement | 13 (100.0%) | 0 (0.0%) |
| Food Preparation & Serving | 41 (27.2%) | 110 (72.9%) |
| Cleaning & Maintenance | 53 (58.9%) | 37 (41.1%) |
| Personal Care & Service | 20 (28.6%) | 50 (71.4%) |
| Total (Category) | 181 (42.0%) | 250 (58.0%) |
| Total (Overall) | 1,076 (52.5%) | 972 (47.5%) |
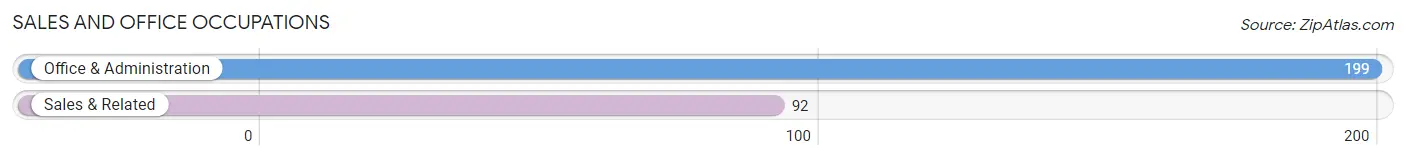
Sales and Office Occupations
The most common Sales and Office occupations in Benson County are Office & Administration (199 | 9.7%), and Sales & Related (92 | 4.5%).
Sales and Office Occupations by Sex
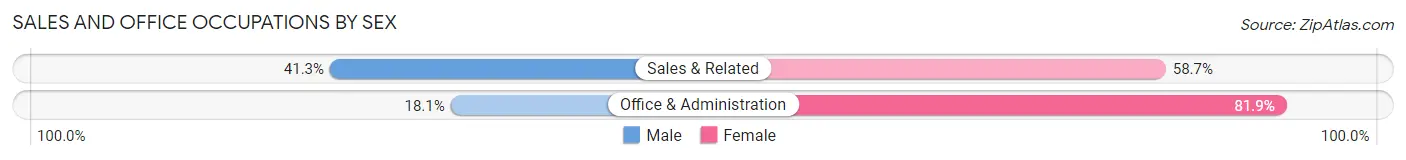
| Occupation | Male | Female |
| Sales & Related | 38 (41.3%) | 54 (58.7%) |
| Office & Administration | 36 (18.1%) | 163 (81.9%) |
| Total (Category) | 74 (25.4%) | 217 (74.6%) |
| Total (Overall) | 1,076 (52.5%) | 972 (47.5%) |
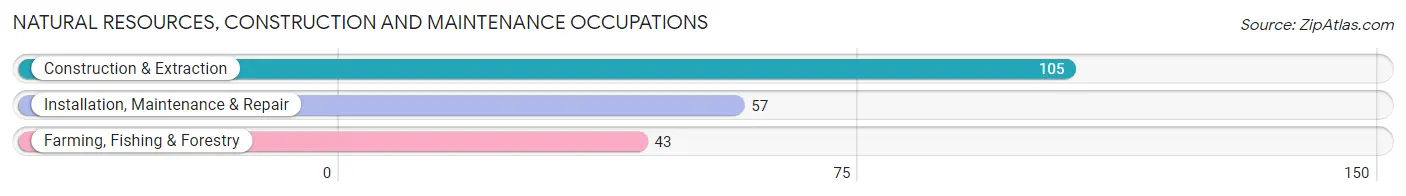
Natural Resources, Construction and Maintenance Occupations
The most common Natural Resources, Construction and Maintenance occupations in Benson County are Construction & Extraction (105 | 5.1%), Installation, Maintenance & Repair (57 | 2.8%), and Farming, Fishing & Forestry (43 | 2.1%).
Natural Resources, Construction and Maintenance Occupations by Sex
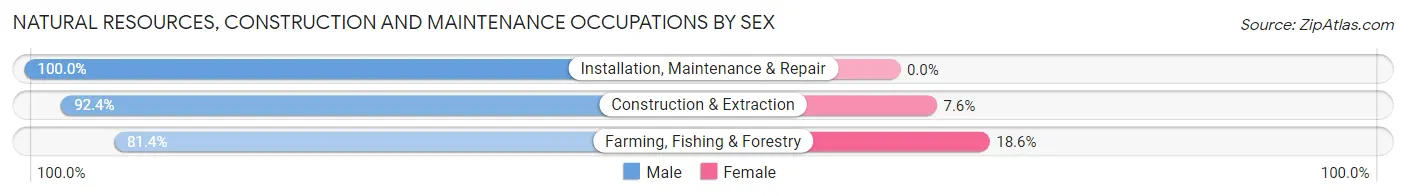
| Occupation | Male | Female |
| Farming, Fishing & Forestry | 35 (81.4%) | 8 (18.6%) |
| Construction & Extraction | 97 (92.4%) | 8 (7.6%) |
| Installation, Maintenance & Repair | 57 (100.0%) | 0 (0.0%) |
| Total (Category) | 189 (92.2%) | 16 (7.8%) |
| Total (Overall) | 1,076 (52.5%) | 972 (47.5%) |
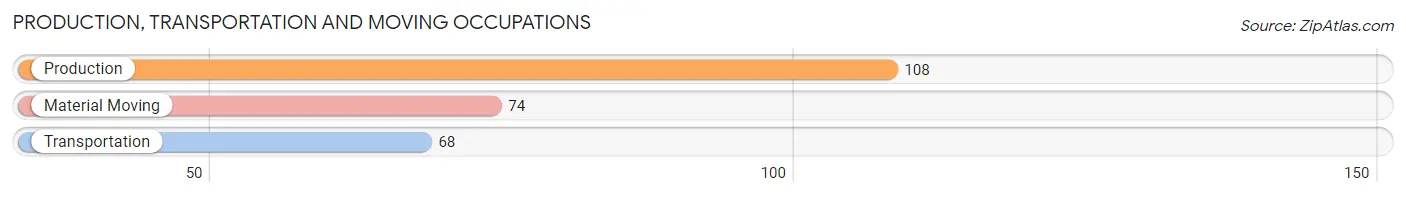
Production, Transportation and Moving Occupations
The most common Production, Transportation and Moving occupations in Benson County are Production (108 | 5.3%), Material Moving (74 | 3.6%), and Transportation (68 | 3.3%).
Production, Transportation and Moving Occupations by Sex
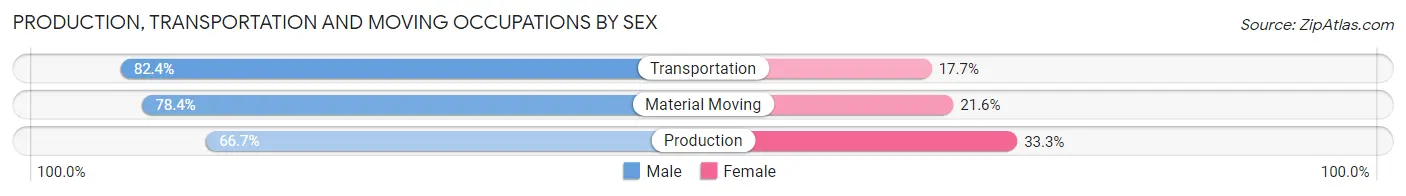
| Occupation | Male | Female |
| Production | 72 (66.7%) | 36 (33.3%) |
| Transportation | 56 (82.4%) | 12 (17.6%) |
| Material Moving | 58 (78.4%) | 16 (21.6%) |
| Total (Category) | 186 (74.4%) | 64 (25.6%) |
| Total (Overall) | 1,076 (52.5%) | 972 (47.5%) |
Employment Industries by Sex in Benson County
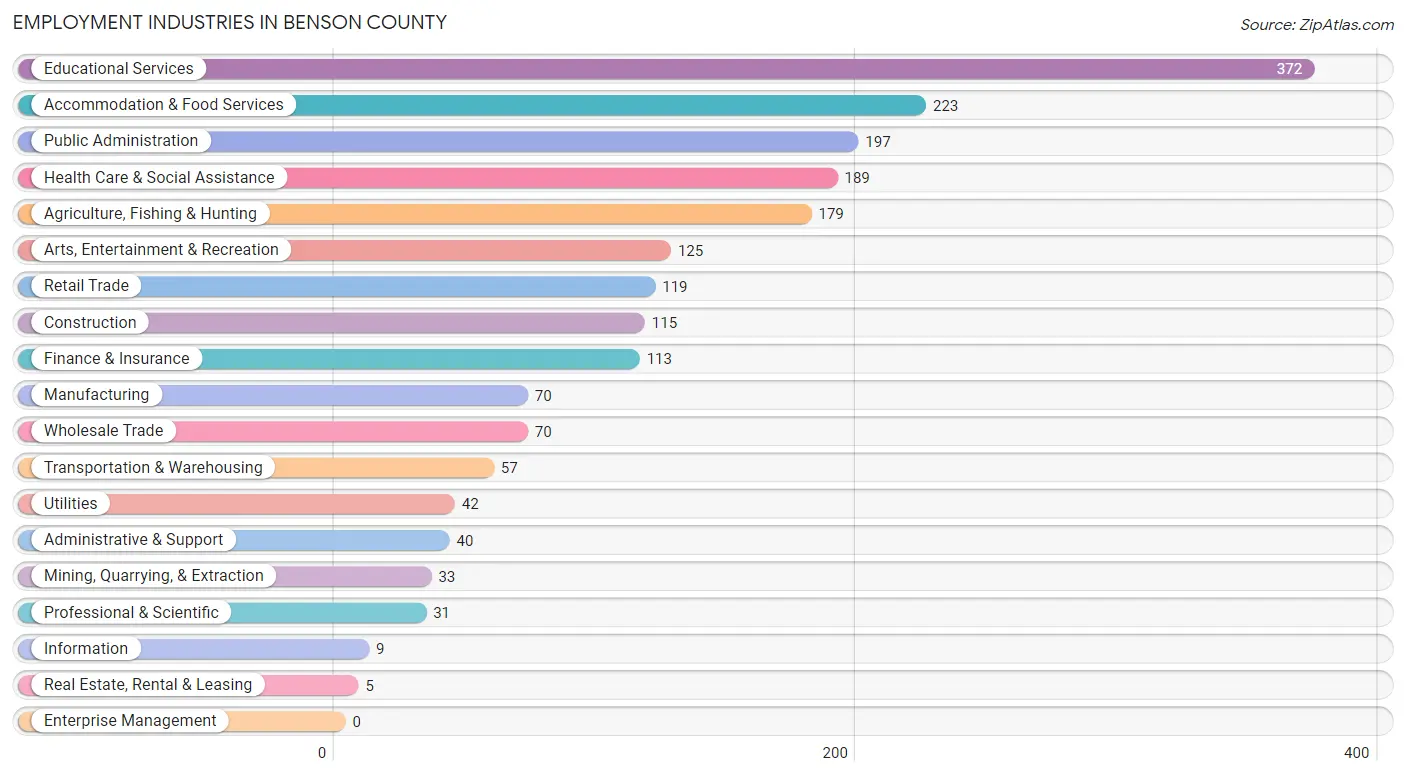
Employment Industries in Benson County
The major employment industries in Benson County include Educational Services (372 | 18.2%), Accommodation & Food Services (223 | 10.9%), Public Administration (197 | 9.6%), Health Care & Social Assistance (189 | 9.2%), and Agriculture, Fishing & Hunting (179 | 8.7%).
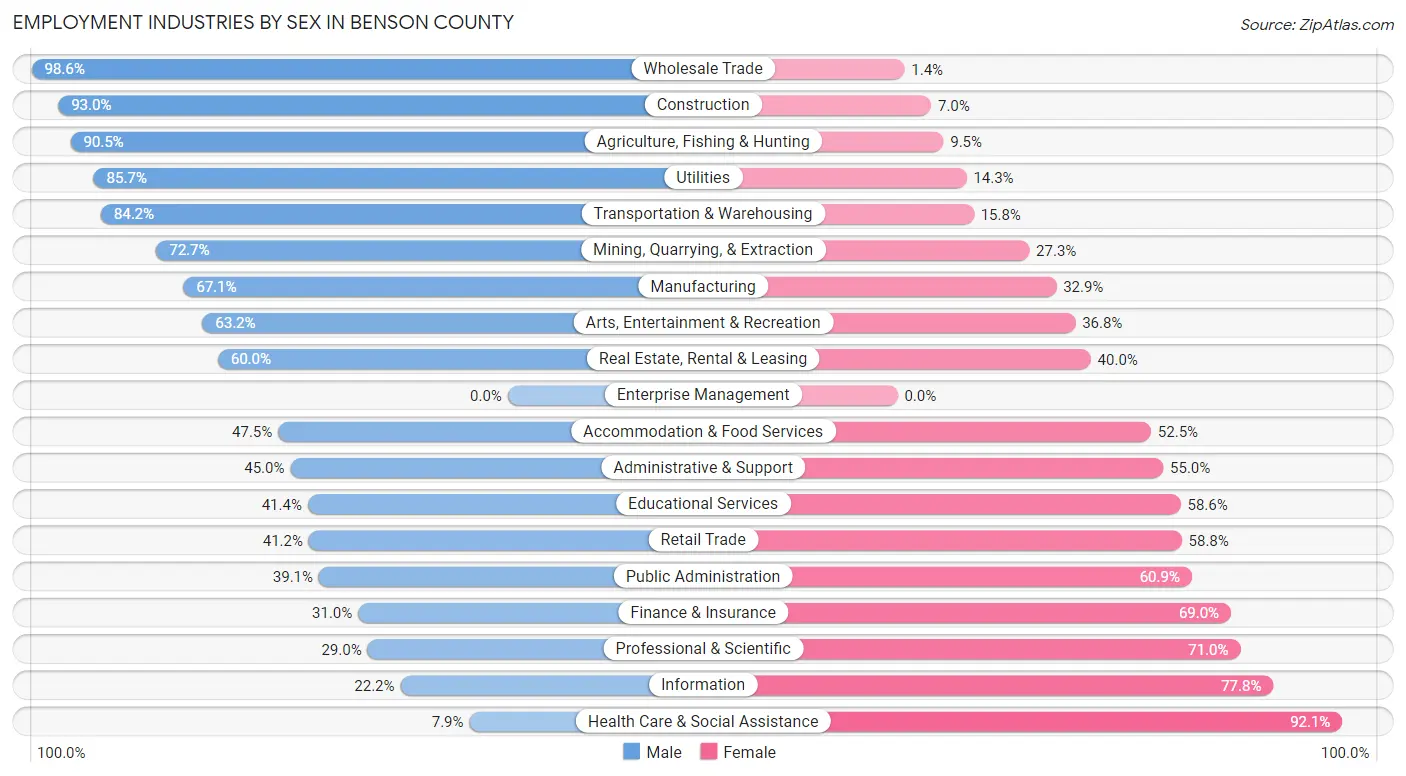
Employment Industries by Sex in Benson County
The Benson County industries that see more men than women are Wholesale Trade (98.6%), Construction (93.0%), and Agriculture, Fishing & Hunting (90.5%), whereas the industries that tend to have a higher number of women are Health Care & Social Assistance (92.1%), Information (77.8%), and Professional & Scientific (71.0%).
| Industry | Male | Female |
| Agriculture, Fishing & Hunting | 162 (90.5%) | 17 (9.5%) |
| Mining, Quarrying, & Extraction | 24 (72.7%) | 9 (27.3%) |
| Construction | 107 (93.0%) | 8 (7.0%) |
| Manufacturing | 47 (67.1%) | 23 (32.9%) |
| Wholesale Trade | 69 (98.6%) | 1 (1.4%) |
| Retail Trade | 49 (41.2%) | 70 (58.8%) |
| Transportation & Warehousing | 48 (84.2%) | 9 (15.8%) |
| Utilities | 36 (85.7%) | 6 (14.3%) |
| Information | 2 (22.2%) | 7 (77.8%) |
| Finance & Insurance | 35 (31.0%) | 78 (69.0%) |
| Real Estate, Rental & Leasing | 3 (60.0%) | 2 (40.0%) |
| Professional & Scientific | 9 (29.0%) | 22 (71.0%) |
| Enterprise Management | 0 (0.0%) | 0 (0.0%) |
| Administrative & Support | 18 (45.0%) | 22 (55.0%) |
| Educational Services | 154 (41.4%) | 218 (58.6%) |
| Health Care & Social Assistance | 15 (7.9%) | 174 (92.1%) |
| Arts, Entertainment & Recreation | 79 (63.2%) | 46 (36.8%) |
| Accommodation & Food Services | 106 (47.5%) | 117 (52.5%) |
| Public Administration | 77 (39.1%) | 120 (60.9%) |
| Total | 1,076 (52.5%) | 972 (47.5%) |
Education in Benson County
School Enrollment in Benson County
The most common levels of schooling among the 1,696 students in Benson County are middle school (472 | 27.8%), high school (391 | 23.1%), and elementary school (360 | 21.2%).
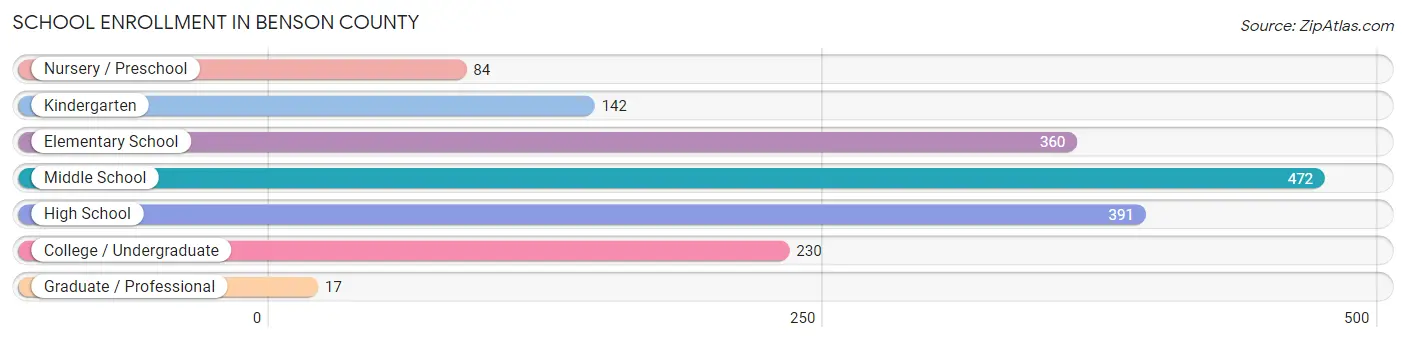
| School Level | # Students | % Students |
| Nursery / Preschool | 84 | 5.0% |
| Kindergarten | 142 | 8.4% |
| Elementary School | 360 | 21.2% |
| Middle School | 472 | 27.8% |
| High School | 391 | 23.1% |
| College / Undergraduate | 230 | 13.6% |
| Graduate / Professional | 17 | 1.0% |
| Total | 1,696 | 100.0% |
School Enrollment by Age by Funding Source in Benson County
Out of a total of 1,696 students who are enrolled in schools in Benson County, 31 (1.8%) attend a private institution, while the remaining 1,665 (98.2%) are enrolled in public schools. The age group of 25 to 34 year olds has the highest likelihood of being enrolled in private schools, with 16 (21.3% in the age bracket) enrolled. Conversely, the age group of 3 to 4 year olds has the lowest likelihood of being enrolled in a private school, with 38 (100.0% in the age bracket) attending a public institution.
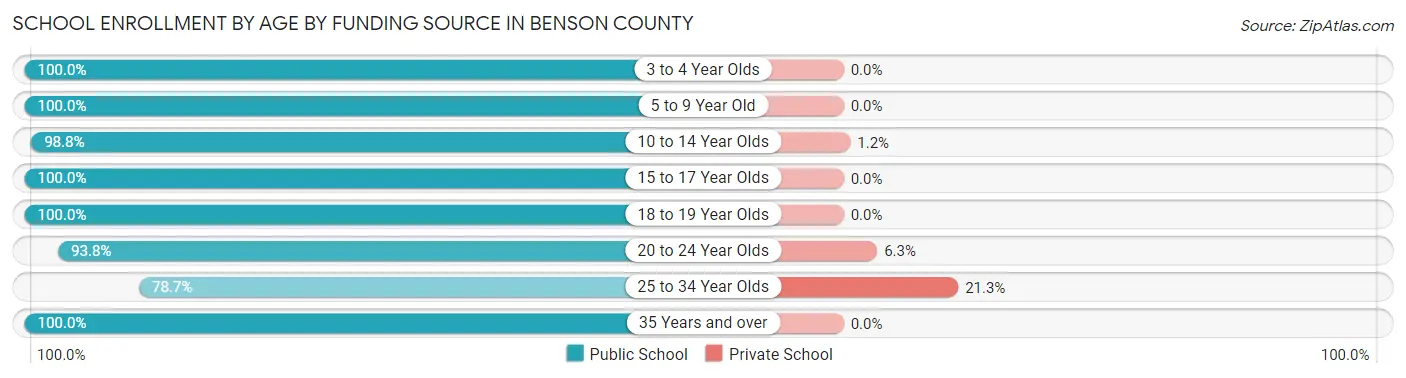
| Age Bracket | Public School | Private School |
| 3 to 4 Year Olds | 38 (100.0%) | 0 (0.0%) |
| 5 to 9 Year Old | 490 (100.0%) | 0 (0.0%) |
| 10 to 14 Year Olds | 559 (98.8%) | 7 (1.2%) |
| 15 to 17 Year Olds | 300 (100.0%) | 0 (0.0%) |
| 18 to 19 Year Olds | 79 (100.0%) | 0 (0.0%) |
| 20 to 24 Year Olds | 105 (93.8%) | 7 (6.2%) |
| 25 to 34 Year Olds | 59 (78.7%) | 16 (21.3%) |
| 35 Years and over | 36 (100.0%) | 0 (0.0%) |
| Total | 1,665 (98.2%) | 31 (1.8%) |
Educational Attainment by Field of Study in Benson County
Education (262 | 36.4%), science & technology (97 | 13.5%), business (93 | 12.9%), bio, nature & agricultural (90 | 12.5%), and computers & mathematics (42 | 5.8%) are the most common fields of study among 720 individuals in Benson County who have obtained a bachelor's degree or higher.
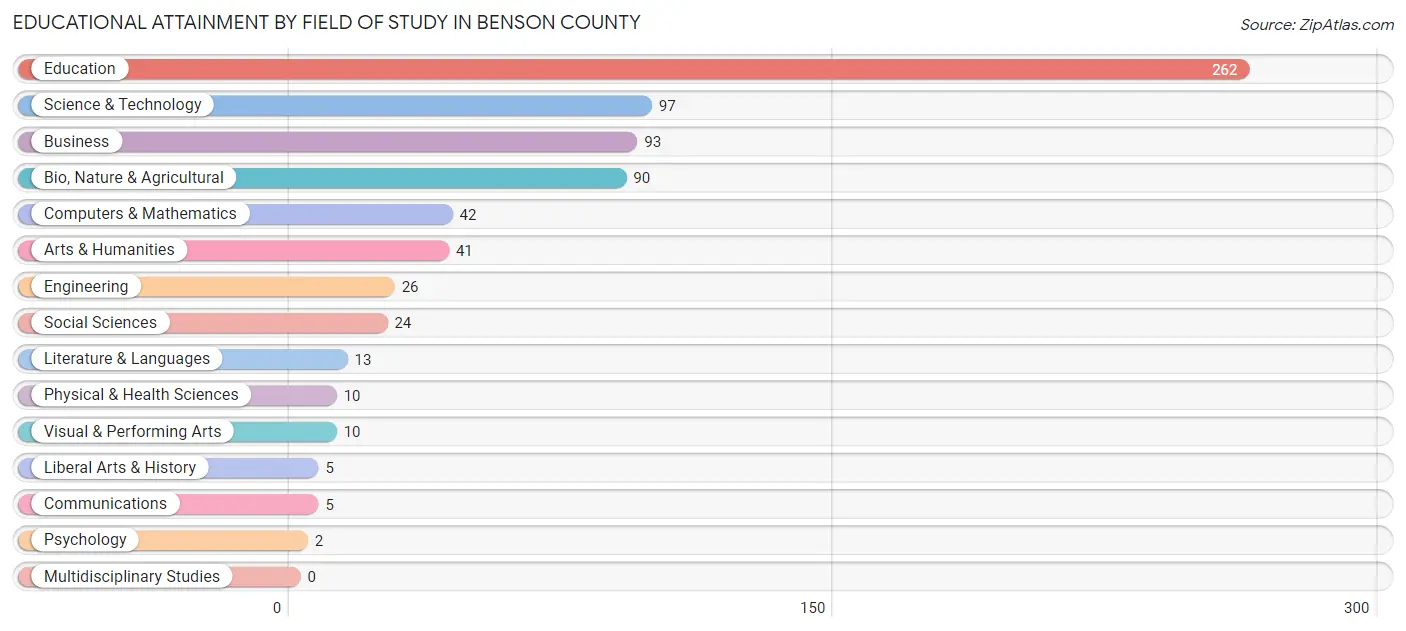
| Field of Study | # Graduates | % Graduates |
| Computers & Mathematics | 42 | 5.8% |
| Bio, Nature & Agricultural | 90 | 12.5% |
| Physical & Health Sciences | 10 | 1.4% |
| Psychology | 2 | 0.3% |
| Social Sciences | 24 | 3.3% |
| Engineering | 26 | 3.6% |
| Multidisciplinary Studies | 0 | 0.0% |
| Science & Technology | 97 | 13.5% |
| Business | 93 | 12.9% |
| Education | 262 | 36.4% |
| Literature & Languages | 13 | 1.8% |
| Liberal Arts & History | 5 | 0.7% |
| Visual & Performing Arts | 10 | 1.4% |
| Communications | 5 | 0.7% |
| Arts & Humanities | 41 | 5.7% |
| Total | 720 | 100.0% |
Transportation & Commute in Benson County
Vehicle Availability by Sex in Benson County
The most prevalent vehicle ownership categories in Benson County are males with 3 vehicles (369, accounting for 34.6%) and females with 3 vehicles (208, making up 39.0%).
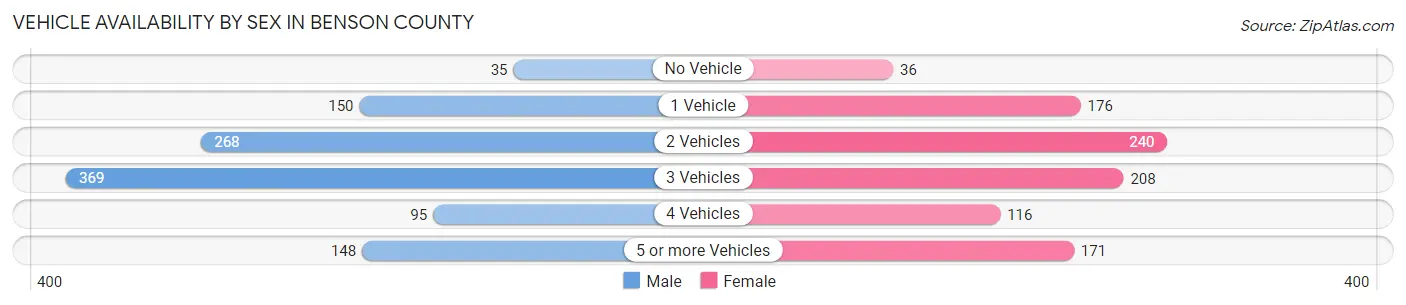
| Vehicles Available | Male | Female |
| No Vehicle | 35 (3.3%) | 36 (3.8%) |
| 1 Vehicle | 150 (14.1%) | 176 (18.6%) |
| 2 Vehicles | 268 (25.2%) | 240 (25.3%) |
| 3 Vehicles | 369 (34.6%) | 208 (22.0%) |
| 4 Vehicles | 95 (8.9%) | 116 (12.2%) |
| 5 or more Vehicles | 148 (13.9%) | 171 (18.1%) |
| Total | 1,065 (100.0%) | 947 (100.0%) |
Commute Time in Benson County
The most frequently occuring commute durations in Benson County are 10 to 14 minutes (392 commuters, 20.2%), 5 to 9 minutes (327 commuters, 16.9%), and less than 5 minutes (283 commuters, 14.6%).
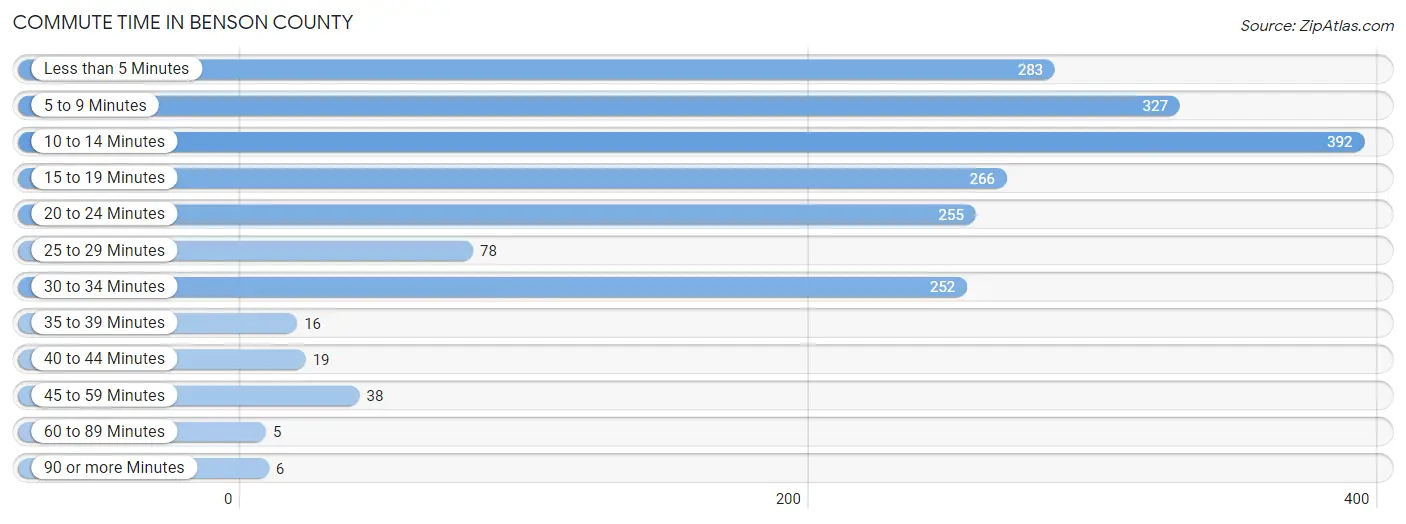
| Commute Time | # Commuters | % Commuters |
| Less than 5 Minutes | 283 | 14.6% |
| 5 to 9 Minutes | 327 | 16.9% |
| 10 to 14 Minutes | 392 | 20.2% |
| 15 to 19 Minutes | 266 | 13.7% |
| 20 to 24 Minutes | 255 | 13.2% |
| 25 to 29 Minutes | 78 | 4.0% |
| 30 to 34 Minutes | 252 | 13.0% |
| 35 to 39 Minutes | 16 | 0.8% |
| 40 to 44 Minutes | 19 | 1.0% |
| 45 to 59 Minutes | 38 | 2.0% |
| 60 to 89 Minutes | 5 | 0.3% |
| 90 or more Minutes | 6 | 0.3% |
Commute Time by Sex in Benson County
The most common commute times in Benson County are 10 to 14 minutes (248 commuters, 24.0%) for males and 30 to 34 minutes (149 commuters, 16.5%) for females.
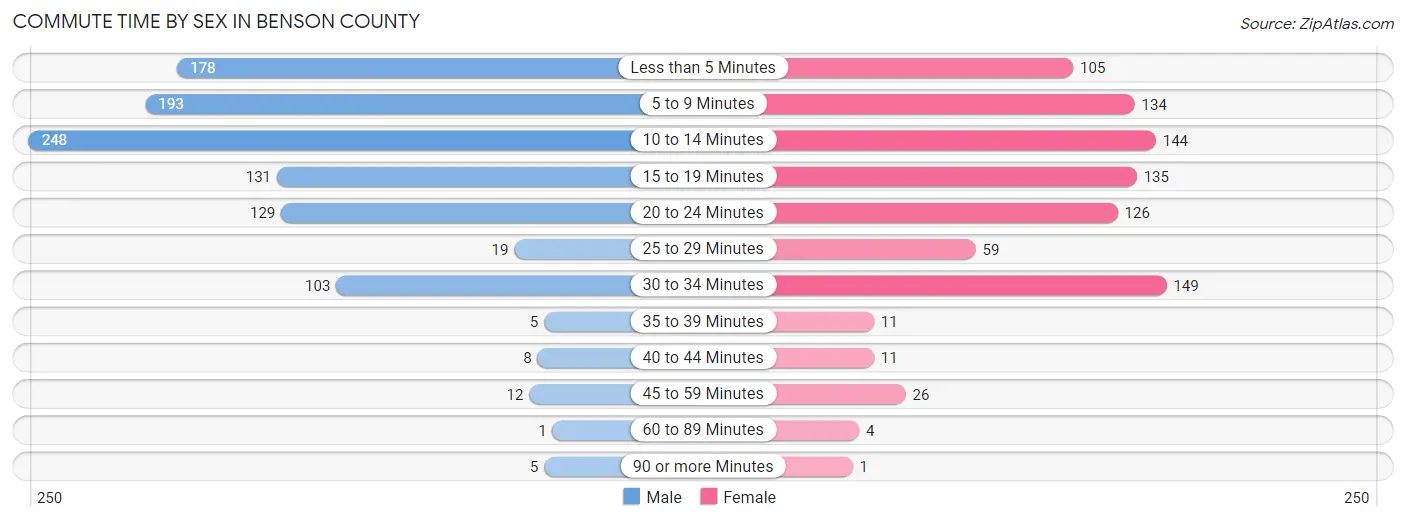
| Commute Time | Male | Female |
| Less than 5 Minutes | 178 (17.2%) | 105 (11.6%) |
| 5 to 9 Minutes | 193 (18.7%) | 134 (14.8%) |
| 10 to 14 Minutes | 248 (24.0%) | 144 (15.9%) |
| 15 to 19 Minutes | 131 (12.7%) | 135 (14.9%) |
| 20 to 24 Minutes | 129 (12.5%) | 126 (13.9%) |
| 25 to 29 Minutes | 19 (1.8%) | 59 (6.5%) |
| 30 to 34 Minutes | 103 (10.0%) | 149 (16.5%) |
| 35 to 39 Minutes | 5 (0.5%) | 11 (1.2%) |
| 40 to 44 Minutes | 8 (0.8%) | 11 (1.2%) |
| 45 to 59 Minutes | 12 (1.2%) | 26 (2.9%) |
| 60 to 89 Minutes | 1 (0.1%) | 4 (0.4%) |
| 90 or more Minutes | 5 (0.5%) | 1 (0.1%) |
Time of Departure to Work by Sex in Benson County
The most frequent times of departure to work in Benson County are 7:30 AM to 7:59 AM (246, 23.8%) for males and 7:30 AM to 7:59 AM (234, 25.9%) for females.
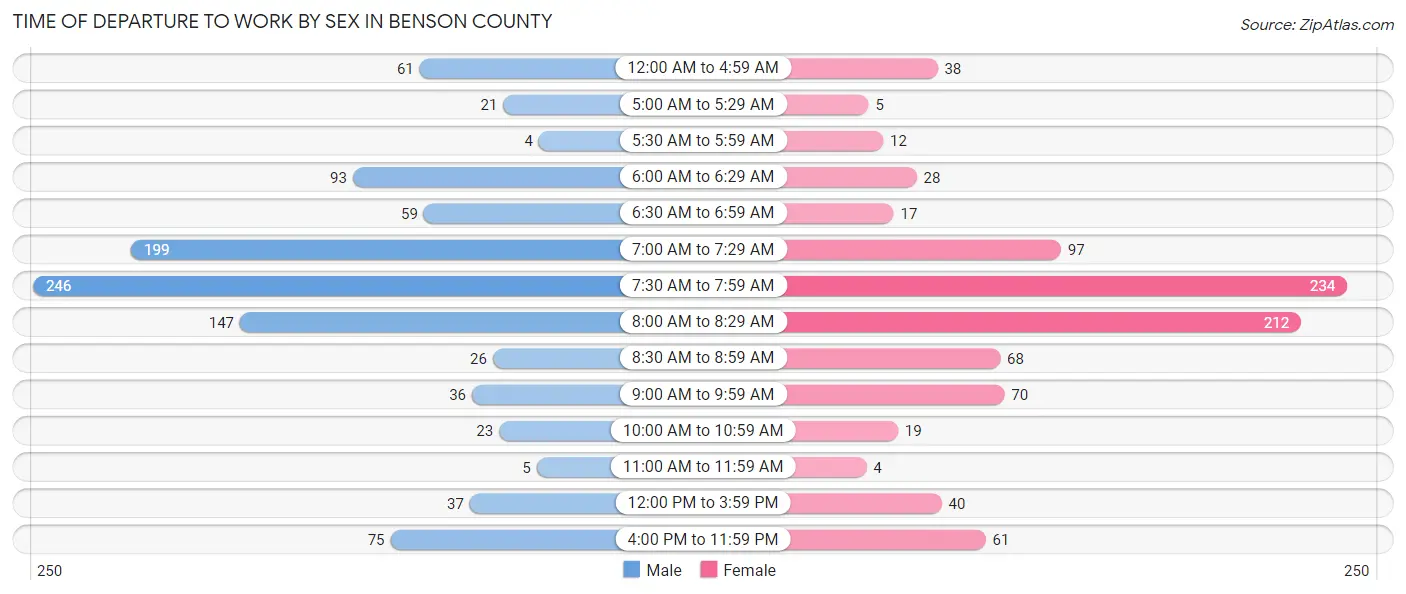
| Time of Departure | Male | Female |
| 12:00 AM to 4:59 AM | 61 (5.9%) | 38 (4.2%) |
| 5:00 AM to 5:29 AM | 21 (2.0%) | 5 (0.5%) |
| 5:30 AM to 5:59 AM | 4 (0.4%) | 12 (1.3%) |
| 6:00 AM to 6:29 AM | 93 (9.0%) | 28 (3.1%) |
| 6:30 AM to 6:59 AM | 59 (5.7%) | 17 (1.9%) |
| 7:00 AM to 7:29 AM | 199 (19.3%) | 97 (10.7%) |
| 7:30 AM to 7:59 AM | 246 (23.8%) | 234 (25.9%) |
| 8:00 AM to 8:29 AM | 147 (14.2%) | 212 (23.4%) |
| 8:30 AM to 8:59 AM | 26 (2.5%) | 68 (7.5%) |
| 9:00 AM to 9:59 AM | 36 (3.5%) | 70 (7.7%) |
| 10:00 AM to 10:59 AM | 23 (2.2%) | 19 (2.1%) |
| 11:00 AM to 11:59 AM | 5 (0.5%) | 4 (0.4%) |
| 12:00 PM to 3:59 PM | 37 (3.6%) | 40 (4.4%) |
| 4:00 PM to 11:59 PM | 75 (7.3%) | 61 (6.7%) |
| Total | 1,032 (100.0%) | 905 (100.0%) |
Housing Occupancy in Benson County
Occupancy by Ownership in Benson County
Of the total 1,869 dwellings in Benson County, owner-occupied units account for 1,341 (71.8%), while renter-occupied units make up 528 (28.2%).
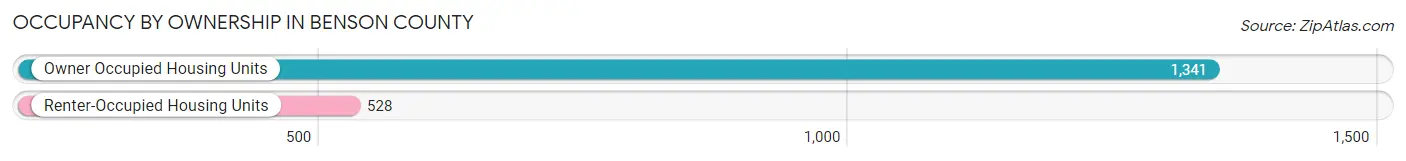
| Occupancy | # Housing Units | % Housing Units |
| Owner Occupied Housing Units | 1,341 | 71.8% |
| Renter-Occupied Housing Units | 528 | 28.2% |
| Total Occupied Housing Units | 1,869 | 100.0% |
Occupancy by Household Size in Benson County
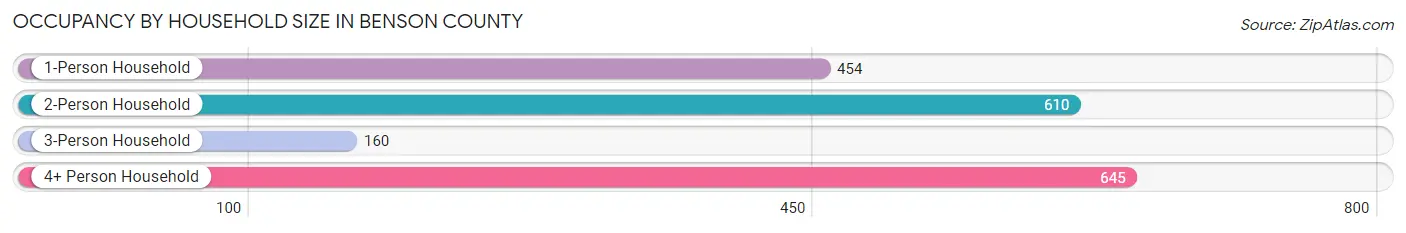
| Household Size | # Housing Units | % Housing Units |
| 1-Person Household | 454 | 24.3% |
| 2-Person Household | 610 | 32.6% |
| 3-Person Household | 160 | 8.6% |
| 4+ Person Household | 645 | 34.5% |
| Total Housing Units | 1,869 | 100.0% |
Occupancy by Ownership by Household Size in Benson County
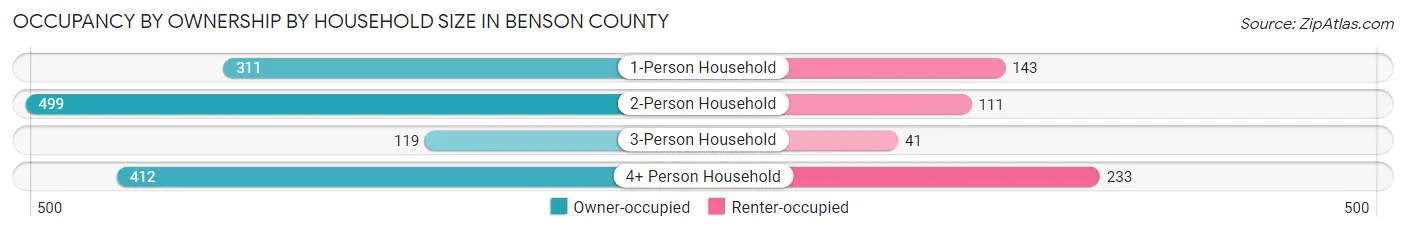
| Household Size | Owner-occupied | Renter-occupied |
| 1-Person Household | 311 (68.5%) | 143 (31.5%) |
| 2-Person Household | 499 (81.8%) | 111 (18.2%) |
| 3-Person Household | 119 (74.4%) | 41 (25.6%) |
| 4+ Person Household | 412 (63.9%) | 233 (36.1%) |
| Total Housing Units | 1,341 (71.8%) | 528 (28.2%) |
Occupancy by Educational Attainment in Benson County
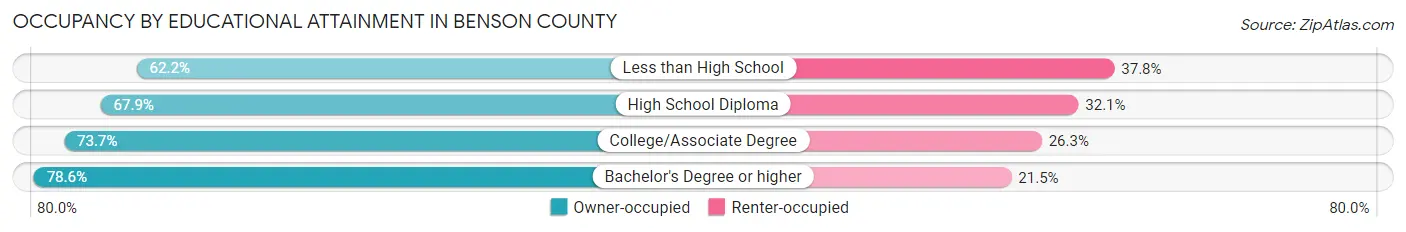
| Household Size | Owner-occupied | Renter-occupied |
| Less than High School | 140 (62.2%) | 85 (37.8%) |
| High School Diploma | 358 (67.9%) | 169 (32.1%) |
| College/Associate Degree | 528 (73.7%) | 188 (26.3%) |
| Bachelor's Degree or higher | 315 (78.5%) | 86 (21.4%) |
Occupancy by Age of Householder in Benson County

| Age Bracket | # Households | % Households |
| Under 35 Years | 310 | 16.6% |
| 35 to 44 Years | 274 | 14.7% |
| 45 to 54 Years | 298 | 15.9% |
| 55 to 64 Years | 465 | 24.9% |
| 65 to 74 Years | 306 | 16.4% |
| 75 to 84 Years | 167 | 8.9% |
| 85 Years and Over | 49 | 2.6% |
| Total | 1,869 | 100.0% |
Housing Finances in Benson County
Median Income by Occupancy in Benson County
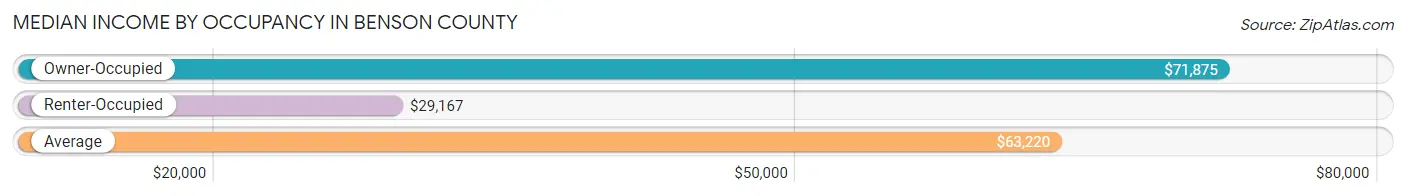
| Occupancy Type | # Households | Median Income |
| Owner-Occupied | 1,341 (71.8%) | $71,875 |
| Renter-Occupied | 528 (28.2%) | $29,167 |
| Average | 1,869 (100.0%) | $63,220 |
Occupancy by Householder Income Bracket in Benson County
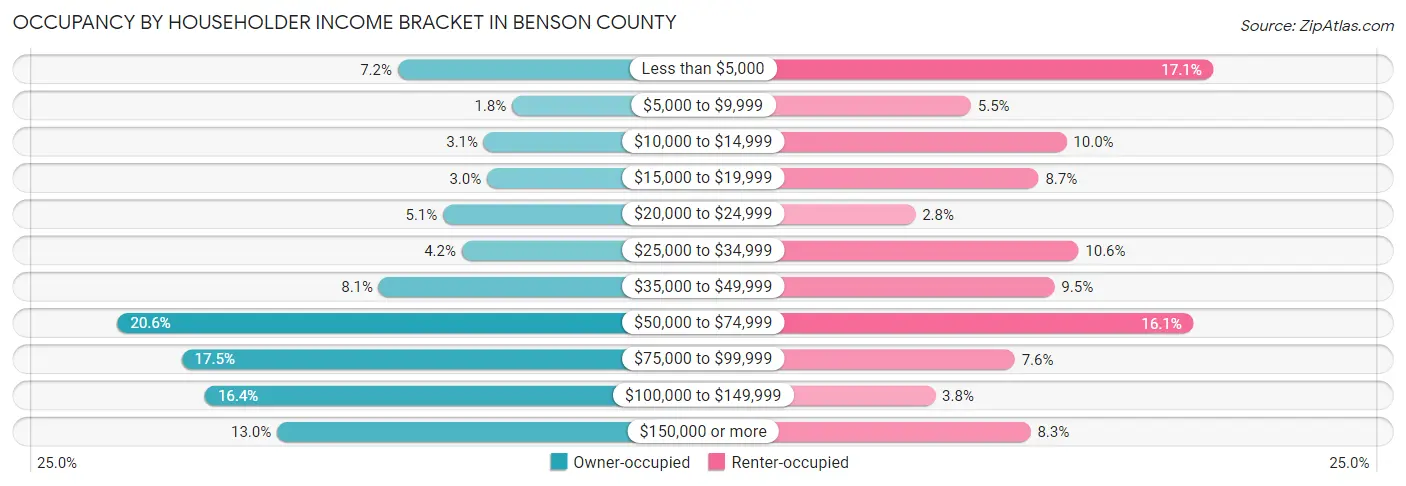
| Income Bracket | Owner-occupied | Renter-occupied |
| Less than $5,000 | 97 (7.2%) | 90 (17.1%) |
| $5,000 to $9,999 | 24 (1.8%) | 29 (5.5%) |
| $10,000 to $14,999 | 42 (3.1%) | 53 (10.0%) |
| $15,000 to $19,999 | 40 (3.0%) | 46 (8.7%) |
| $20,000 to $24,999 | 68 (5.1%) | 15 (2.8%) |
| $25,000 to $34,999 | 56 (4.2%) | 56 (10.6%) |
| $35,000 to $49,999 | 109 (8.1%) | 50 (9.5%) |
| $50,000 to $74,999 | 276 (20.6%) | 85 (16.1%) |
| $75,000 to $99,999 | 235 (17.5%) | 40 (7.6%) |
| $100,000 to $149,999 | 220 (16.4%) | 20 (3.8%) |
| $150,000 or more | 174 (13.0%) | 44 (8.3%) |
| Total | 1,341 (100.0%) | 528 (100.0%) |
Monthly Housing Cost Tiers in Benson County
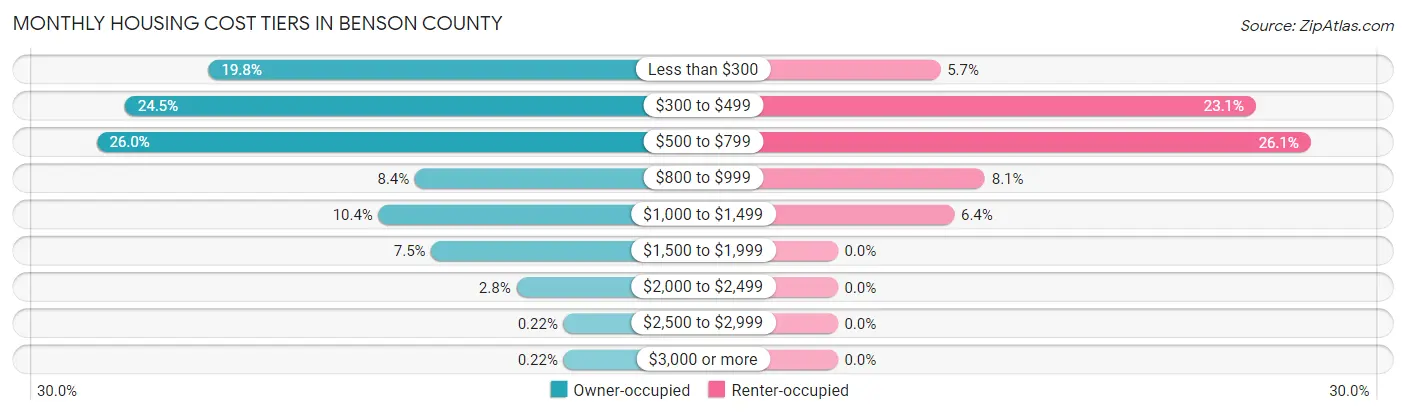
| Monthly Cost | Owner-occupied | Renter-occupied |
| Less than $300 | 266 (19.8%) | 30 (5.7%) |
| $300 to $499 | 328 (24.5%) | 122 (23.1%) |
| $500 to $799 | 349 (26.0%) | 138 (26.1%) |
| $800 to $999 | 113 (8.4%) | 43 (8.1%) |
| $1,000 to $1,499 | 140 (10.4%) | 34 (6.4%) |
| $1,500 to $1,999 | 101 (7.5%) | 0 (0.0%) |
| $2,000 to $2,499 | 38 (2.8%) | 0 (0.0%) |
| $2,500 to $2,999 | 3 (0.2%) | 0 (0.0%) |
| $3,000 or more | 3 (0.2%) | 0 (0.0%) |
| Total | 1,341 (100.0%) | 528 (100.0%) |
Physical Housing Characteristics in Benson County
Housing Structures in Benson County
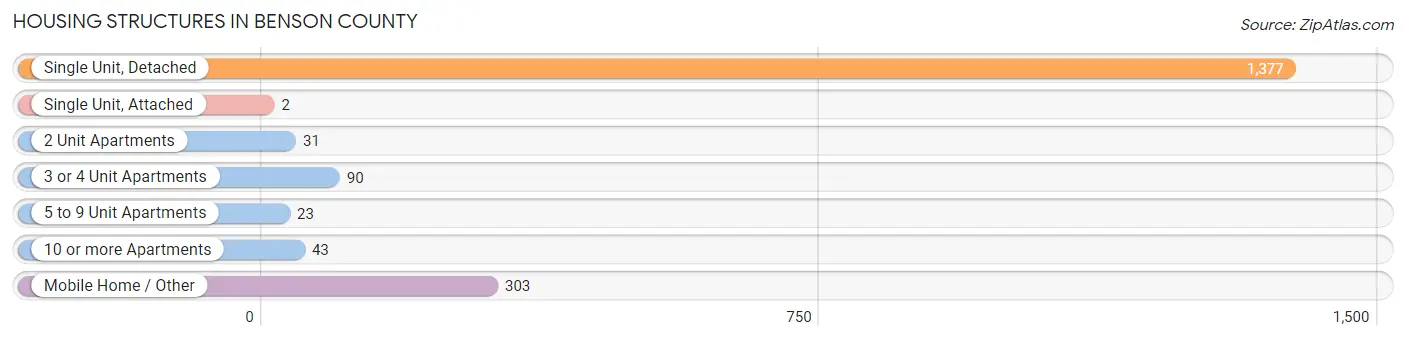
| Structure Type | # Housing Units | % Housing Units |
| Single Unit, Detached | 1,377 | 73.7% |
| Single Unit, Attached | 2 | 0.1% |
| 2 Unit Apartments | 31 | 1.7% |
| 3 or 4 Unit Apartments | 90 | 4.8% |
| 5 to 9 Unit Apartments | 23 | 1.2% |
| 10 or more Apartments | 43 | 2.3% |
| Mobile Home / Other | 303 | 16.2% |
| Total | 1,869 | 100.0% |
Housing Structures by Occupancy in Benson County
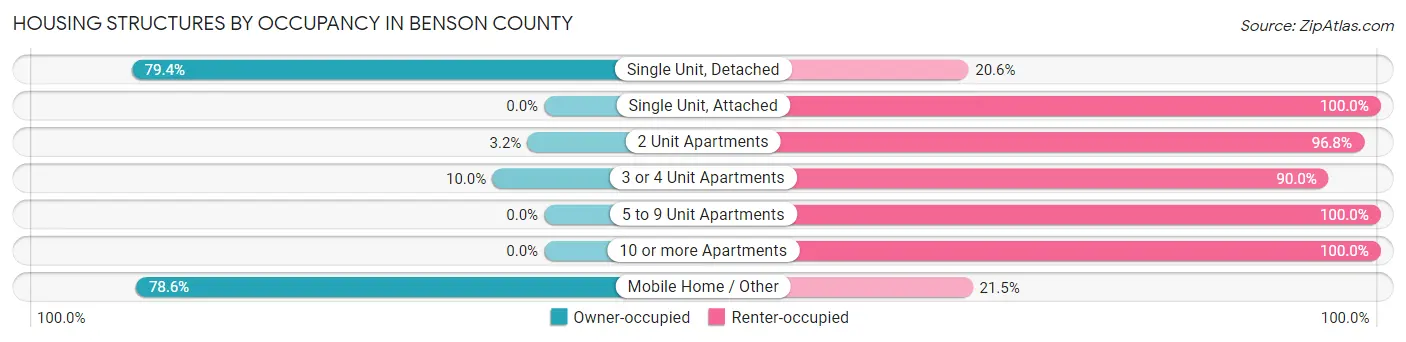
| Structure Type | Owner-occupied | Renter-occupied |
| Single Unit, Detached | 1,093 (79.4%) | 284 (20.6%) |
| Single Unit, Attached | 0 (0.0%) | 2 (100.0%) |
| 2 Unit Apartments | 1 (3.2%) | 30 (96.8%) |
| 3 or 4 Unit Apartments | 9 (10.0%) | 81 (90.0%) |
| 5 to 9 Unit Apartments | 0 (0.0%) | 23 (100.0%) |
| 10 or more Apartments | 0 (0.0%) | 43 (100.0%) |
| Mobile Home / Other | 238 (78.5%) | 65 (21.4%) |
| Total | 1,341 (71.8%) | 528 (28.2%) |
Housing Structures by Number of Rooms in Benson County
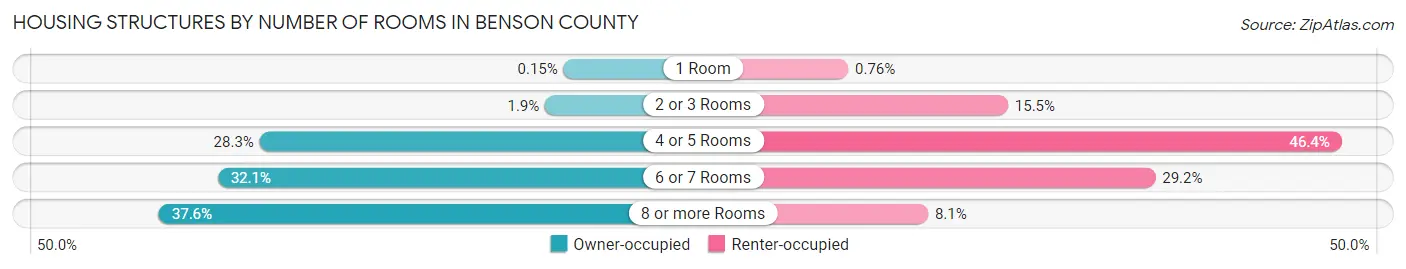
| Number of Rooms | Owner-occupied | Renter-occupied |
| 1 Room | 2 (0.2%) | 4 (0.8%) |
| 2 or 3 Rooms | 25 (1.9%) | 82 (15.5%) |
| 4 or 5 Rooms | 379 (28.3%) | 245 (46.4%) |
| 6 or 7 Rooms | 431 (32.1%) | 154 (29.2%) |
| 8 or more Rooms | 504 (37.6%) | 43 (8.1%) |
| Total | 1,341 (100.0%) | 528 (100.0%) |
Housing Structure by Heating Type in Benson County
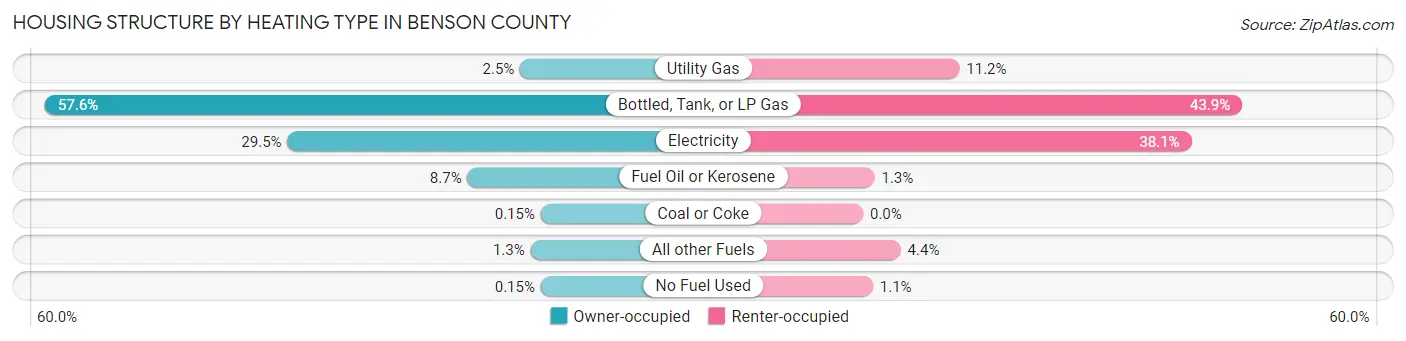
| Heating Type | Owner-occupied | Renter-occupied |
| Utility Gas | 34 (2.5%) | 59 (11.2%) |
| Bottled, Tank, or LP Gas | 773 (57.6%) | 232 (43.9%) |
| Electricity | 396 (29.5%) | 201 (38.1%) |
| Fuel Oil or Kerosene | 116 (8.6%) | 7 (1.3%) |
| Coal or Coke | 2 (0.2%) | 0 (0.0%) |
| All other Fuels | 18 (1.3%) | 23 (4.4%) |
| No Fuel Used | 2 (0.2%) | 6 (1.1%) |
| Total | 1,341 (100.0%) | 528 (100.0%) |
Household Vehicle Usage in Benson County
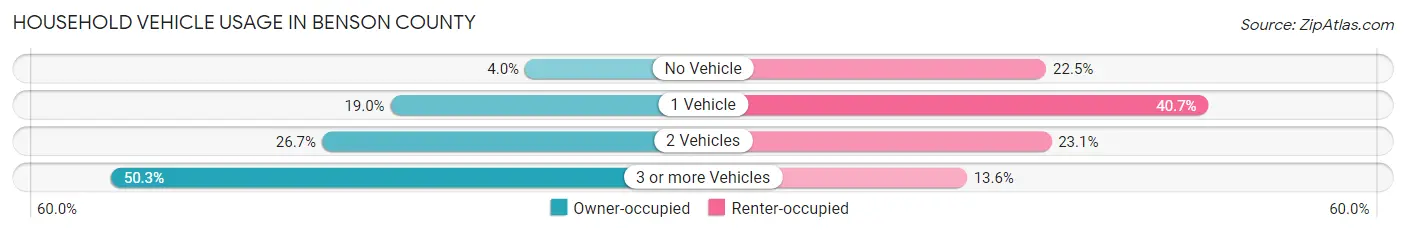
| Vehicles per Household | Owner-occupied | Renter-occupied |
| No Vehicle | 53 (4.0%) | 119 (22.5%) |
| 1 Vehicle | 255 (19.0%) | 215 (40.7%) |
| 2 Vehicles | 358 (26.7%) | 122 (23.1%) |
| 3 or more Vehicles | 675 (50.3%) | 72 (13.6%) |
| Total | 1,341 (100.0%) | 528 (100.0%) |
Real Estate & Mortgages in Benson County
Real Estate and Mortgage Overview in Benson County
| Characteristic | Without Mortgage | With Mortgage |
| Housing Units | 989 | 352 |
| Median Property Value | $58,700 | $122,900 |
| Median Household Income | $66,033 | $80 |
| Monthly Housing Costs | $443 | $3 |
| Real Estate Taxes | $553 | $26 |
Property Value by Mortgage Status in Benson County
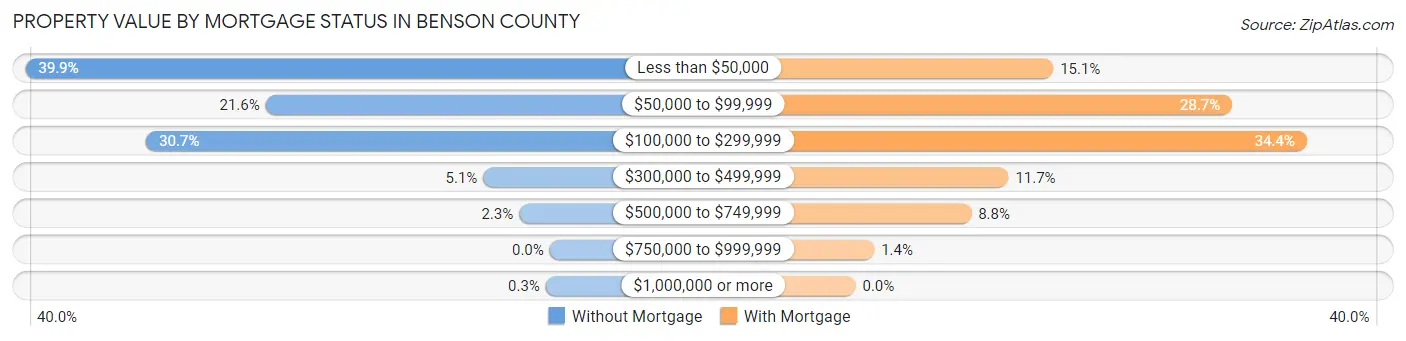
| Property Value | Without Mortgage | With Mortgage |
| Less than $50,000 | 395 (39.9%) | 53 (15.1%) |
| $50,000 to $99,999 | 214 (21.6%) | 101 (28.7%) |
| $100,000 to $299,999 | 304 (30.7%) | 121 (34.4%) |
| $300,000 to $499,999 | 50 (5.1%) | 41 (11.7%) |
| $500,000 to $749,999 | 23 (2.3%) | 31 (8.8%) |
| $750,000 to $999,999 | 0 (0.0%) | 5 (1.4%) |
| $1,000,000 or more | 3 (0.3%) | 0 (0.0%) |
| Total | 989 (100.0%) | 352 (100.0%) |
Household Income by Mortgage Status in Benson County
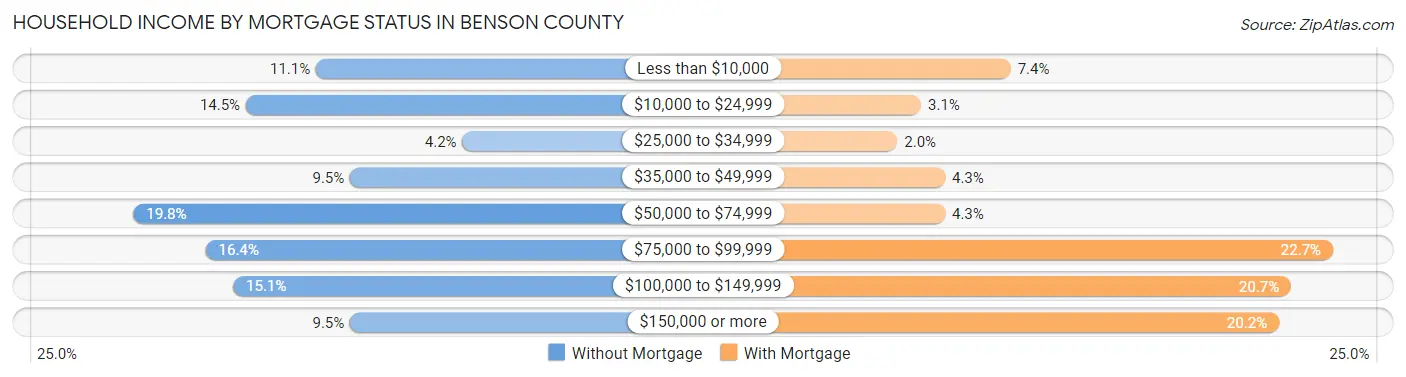
| Household Income | Without Mortgage | With Mortgage |
| Less than $10,000 | 110 (11.1%) | 26 (7.4%) |
| $10,000 to $24,999 | 143 (14.5%) | 11 (3.1%) |
| $25,000 to $34,999 | 41 (4.2%) | 7 (2.0%) |
| $35,000 to $49,999 | 94 (9.5%) | 15 (4.3%) |
| $50,000 to $74,999 | 196 (19.8%) | 15 (4.3%) |
| $75,000 to $99,999 | 162 (16.4%) | 80 (22.7%) |
| $100,000 to $149,999 | 149 (15.1%) | 73 (20.7%) |
| $150,000 or more | 94 (9.5%) | 71 (20.2%) |
| Total | 989 (100.0%) | 352 (100.0%) |
Property Value to Household Income Ratio in Benson County
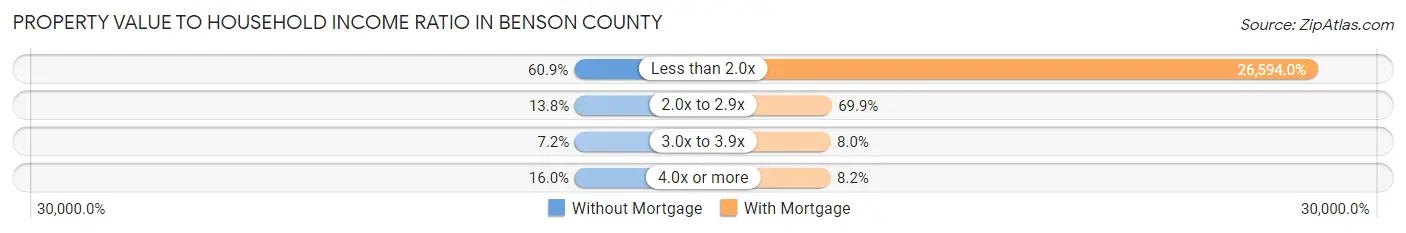
| Value-to-Income Ratio | Without Mortgage | With Mortgage |
| Less than 2.0x | 602 (60.9%) | 93,611 (26,594.0%) |
| 2.0x to 2.9x | 136 (13.8%) | 246 (69.9%) |
| 3.0x to 3.9x | 71 (7.2%) | 28 (8.0%) |
| 4.0x or more | 158 (16.0%) | 29 (8.2%) |
| Total | 989 (100.0%) | 352 (100.0%) |
Real Estate Taxes by Mortgage Status in Benson County
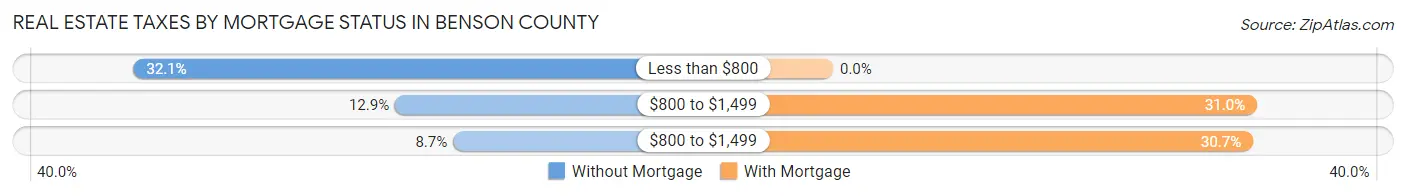
| Property Taxes | Without Mortgage | With Mortgage |
| Less than $800 | 317 (32.1%) | 0 (0.0%) |
| $800 to $1,499 | 128 (12.9%) | 109 (31.0%) |
| $800 to $1,499 | 86 (8.7%) | 108 (30.7%) |
| Total | 989 (100.0%) | 352 (100.0%) |
Health & Disability in Benson County
Health Insurance Coverage by Age in Benson County
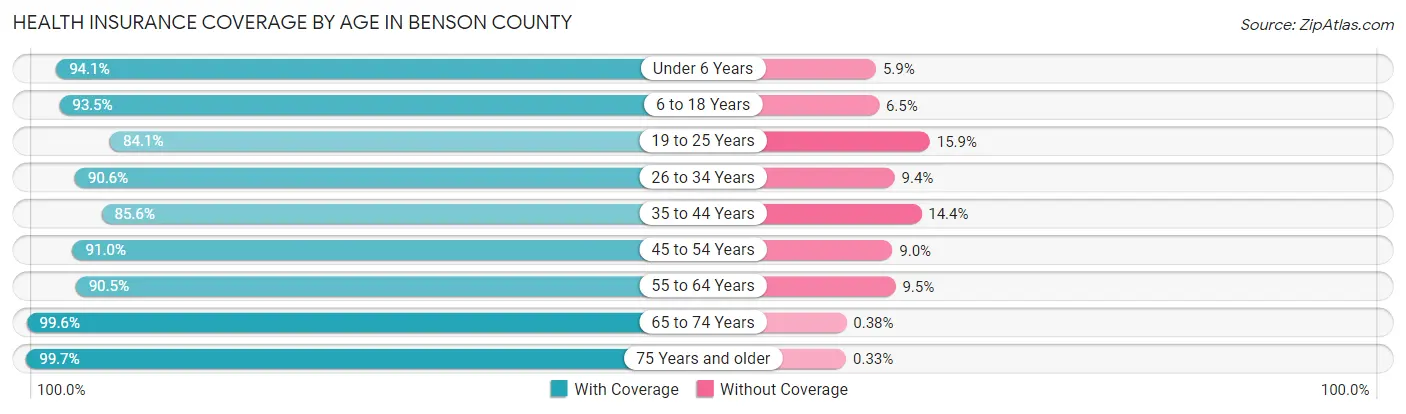
| Age Bracket | With Coverage | Without Coverage |
| Under 6 Years | 716 (94.1%) | 45 (5.9%) |
| 6 to 18 Years | 1,331 (93.5%) | 92 (6.5%) |
| 19 to 25 Years | 422 (84.1%) | 80 (15.9%) |
| 26 to 34 Years | 541 (90.6%) | 56 (9.4%) |
| 35 to 44 Years | 495 (85.6%) | 83 (14.4%) |
| 45 to 54 Years | 508 (91.0%) | 50 (9.0%) |
| 55 to 64 Years | 626 (90.5%) | 66 (9.5%) |
| 65 to 74 Years | 531 (99.6%) | 2 (0.4%) |
| 75 Years and older | 300 (99.7%) | 1 (0.3%) |
| Total | 5,470 (92.0%) | 475 (8.0%) |
Health Insurance Coverage by Citizenship Status in Benson County
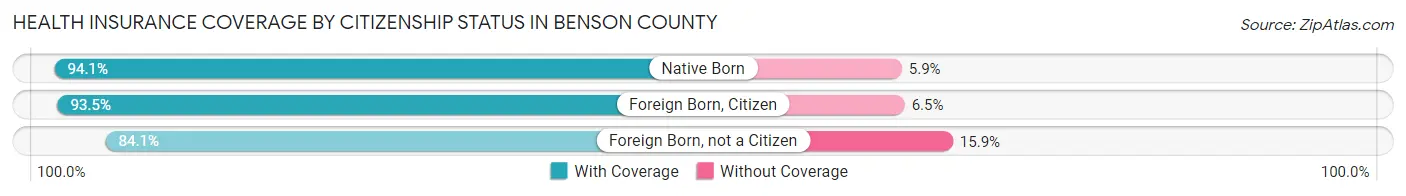
| Citizenship Status | With Coverage | Without Coverage |
| Native Born | 716 (94.1%) | 45 (5.9%) |
| Foreign Born, Citizen | 1,331 (93.5%) | 92 (6.5%) |
| Foreign Born, not a Citizen | 422 (84.1%) | 80 (15.9%) |
Health Insurance Coverage by Household Income in Benson County
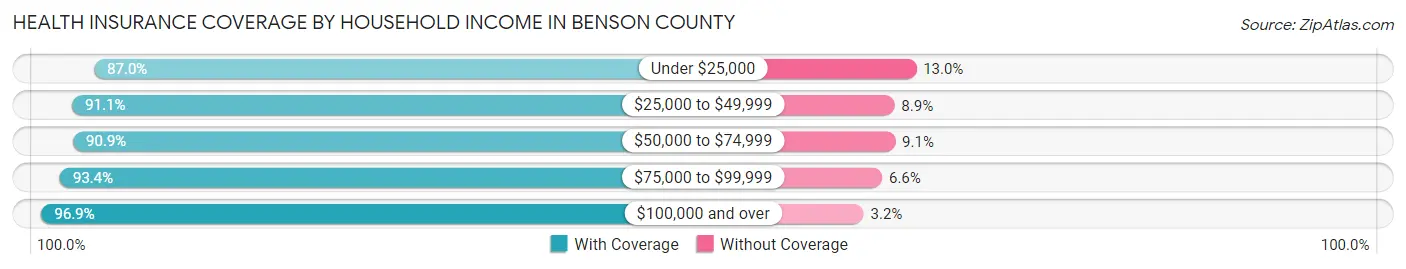
| Household Income | With Coverage | Without Coverage |
| Under $25,000 | 1,258 (87.0%) | 188 (13.0%) |
| $25,000 to $49,999 | 674 (91.1%) | 66 (8.9%) |
| $50,000 to $74,999 | 1,124 (90.9%) | 112 (9.1%) |
| $75,000 to $99,999 | 750 (93.4%) | 53 (6.6%) |
| $100,000 and over | 1,661 (96.9%) | 54 (3.2%) |
Public vs Private Health Insurance Coverage by Age in Benson County
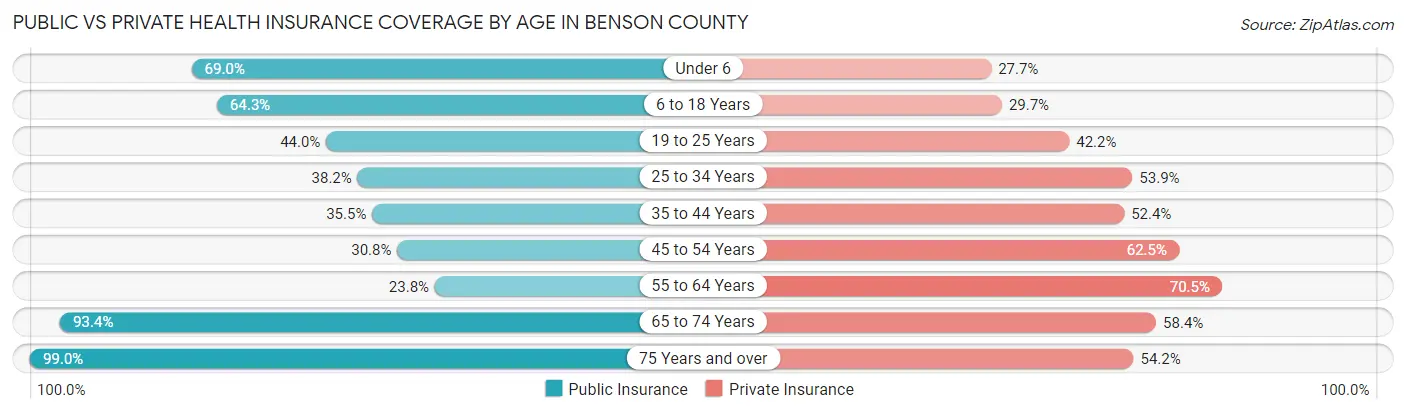
| Age Bracket | Public Insurance | Private Insurance |
| Under 6 | 525 (69.0%) | 211 (27.7%) |
| 6 to 18 Years | 915 (64.3%) | 423 (29.7%) |
| 19 to 25 Years | 221 (44.0%) | 212 (42.2%) |
| 25 to 34 Years | 228 (38.2%) | 322 (53.9%) |
| 35 to 44 Years | 205 (35.5%) | 303 (52.4%) |
| 45 to 54 Years | 172 (30.8%) | 349 (62.5%) |
| 55 to 64 Years | 165 (23.8%) | 488 (70.5%) |
| 65 to 74 Years | 498 (93.4%) | 311 (58.4%) |
| 75 Years and over | 298 (99.0%) | 163 (54.1%) |
| Total | 3,227 (54.3%) | 2,782 (46.8%) |
Disability Status by Sex by Age in Benson County
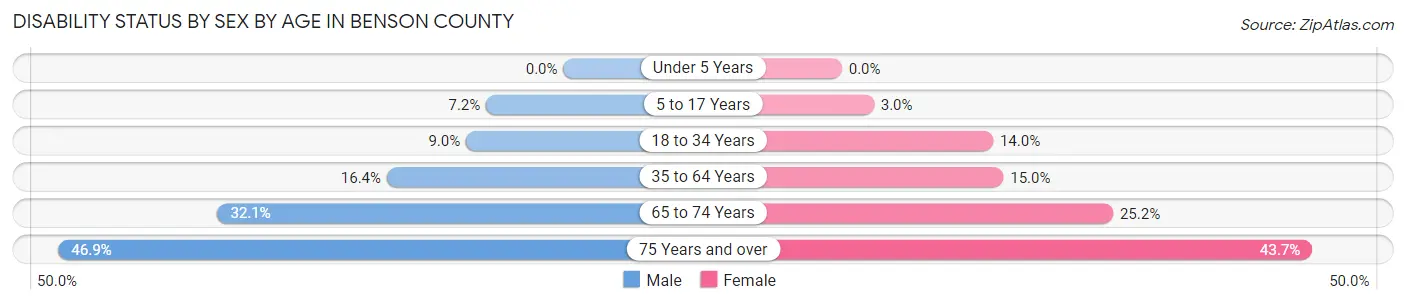
| Age Bracket | Male | Female |
| Under 5 Years | 0 (0.0%) | 0 (0.0%) |
| 5 to 17 Years | 55 (7.2%) | 21 (3.0%) |
| 18 to 34 Years | 57 (9.0%) | 79 (14.0%) |
| 35 to 64 Years | 153 (16.4%) | 134 (15.0%) |
| 65 to 74 Years | 78 (32.1%) | 73 (25.2%) |
| 75 Years and over | 82 (46.9%) | 55 (43.6%) |
Disability Class by Sex by Age in Benson County
Disability Class: Hearing Difficulty
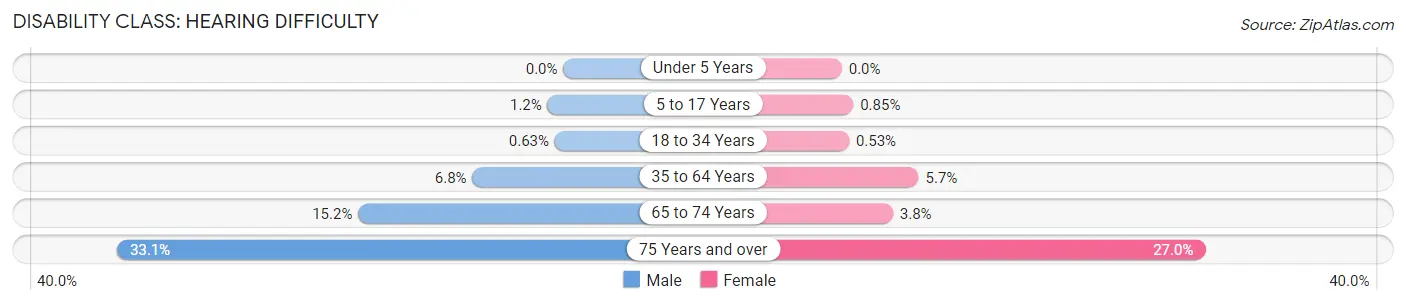
| Age Bracket | Male | Female |
| Under 5 Years | 0 (0.0%) | 0 (0.0%) |
| 5 to 17 Years | 9 (1.2%) | 6 (0.9%) |
| 18 to 34 Years | 4 (0.6%) | 3 (0.5%) |
| 35 to 64 Years | 63 (6.8%) | 51 (5.7%) |
| 65 to 74 Years | 37 (15.2%) | 11 (3.8%) |
| 75 Years and over | 58 (33.1%) | 34 (27.0%) |
Disability Class: Vision Difficulty
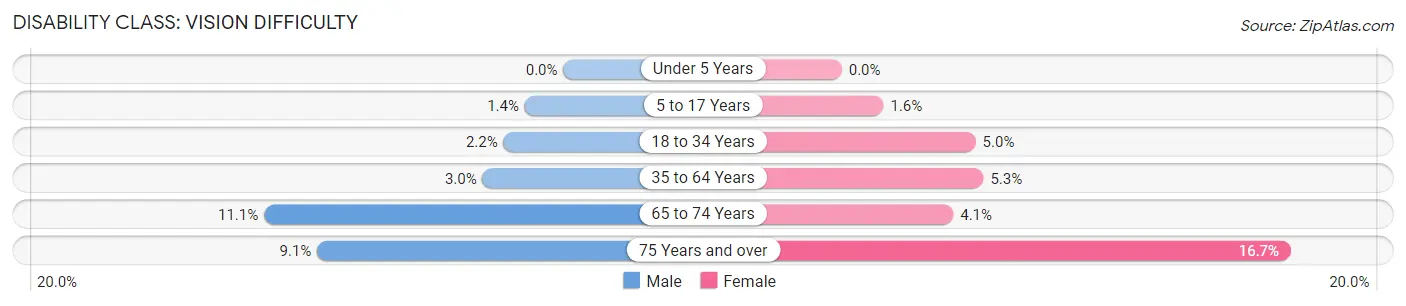
| Age Bracket | Male | Female |
| Under 5 Years | 0 (0.0%) | 0 (0.0%) |
| 5 to 17 Years | 11 (1.4%) | 11 (1.5%) |
| 18 to 34 Years | 14 (2.2%) | 28 (5.0%) |
| 35 to 64 Years | 28 (3.0%) | 47 (5.3%) |
| 65 to 74 Years | 27 (11.1%) | 12 (4.1%) |
| 75 Years and over | 16 (9.1%) | 21 (16.7%) |
Disability Class: Cognitive Difficulty
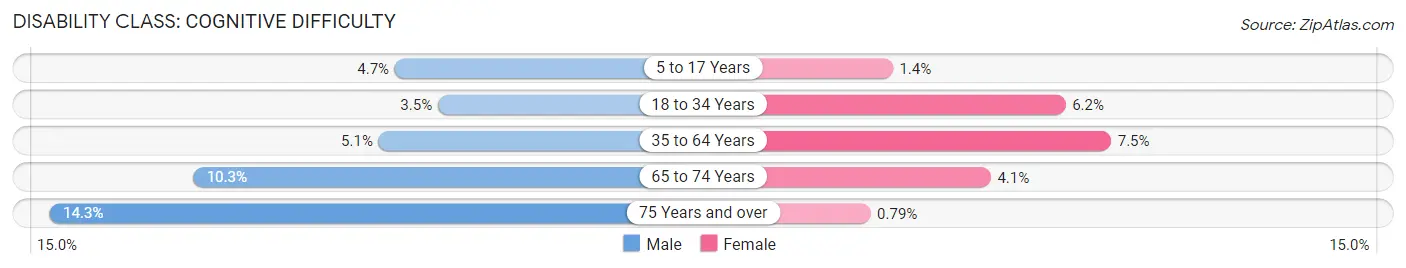
| Age Bracket | Male | Female |
| 5 to 17 Years | 36 (4.7%) | 10 (1.4%) |
| 18 to 34 Years | 22 (3.5%) | 35 (6.2%) |
| 35 to 64 Years | 48 (5.1%) | 67 (7.5%) |
| 65 to 74 Years | 25 (10.3%) | 12 (4.1%) |
| 75 Years and over | 25 (14.3%) | 1 (0.8%) |
Disability Class: Ambulatory Difficulty
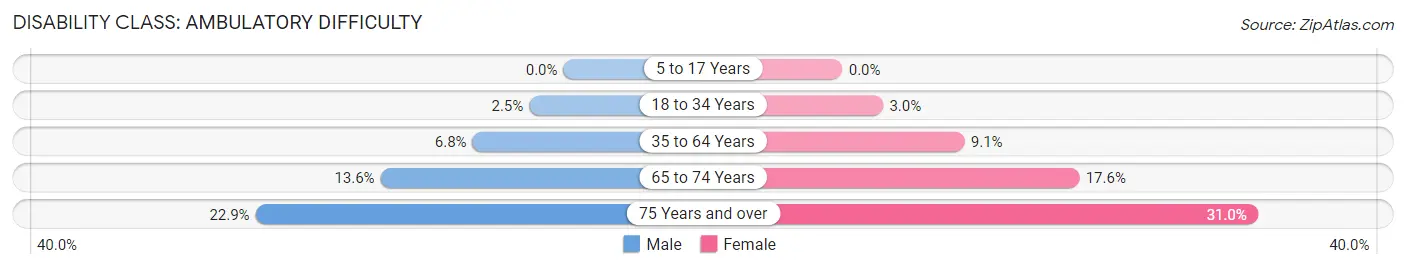
| Age Bracket | Male | Female |
| 5 to 17 Years | 0 (0.0%) | 0 (0.0%) |
| 18 to 34 Years | 16 (2.5%) | 17 (3.0%) |
| 35 to 64 Years | 63 (6.8%) | 81 (9.1%) |
| 65 to 74 Years | 33 (13.6%) | 51 (17.6%) |
| 75 Years and over | 40 (22.9%) | 39 (30.9%) |
Disability Class: Self-Care Difficulty
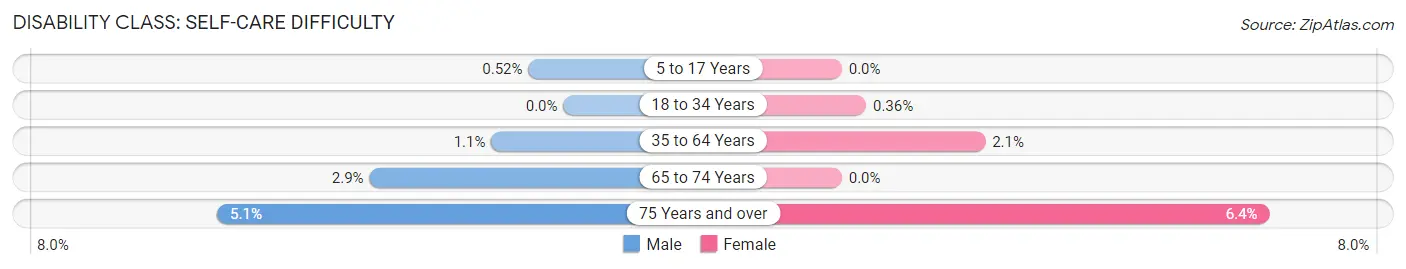
| Age Bracket | Male | Female |
| 5 to 17 Years | 4 (0.5%) | 0 (0.0%) |
| 18 to 34 Years | 0 (0.0%) | 2 (0.4%) |
| 35 to 64 Years | 10 (1.1%) | 19 (2.1%) |
| 65 to 74 Years | 7 (2.9%) | 0 (0.0%) |
| 75 Years and over | 9 (5.1%) | 8 (6.4%) |
Technology Access in Benson County
Computing Device Access in Benson County
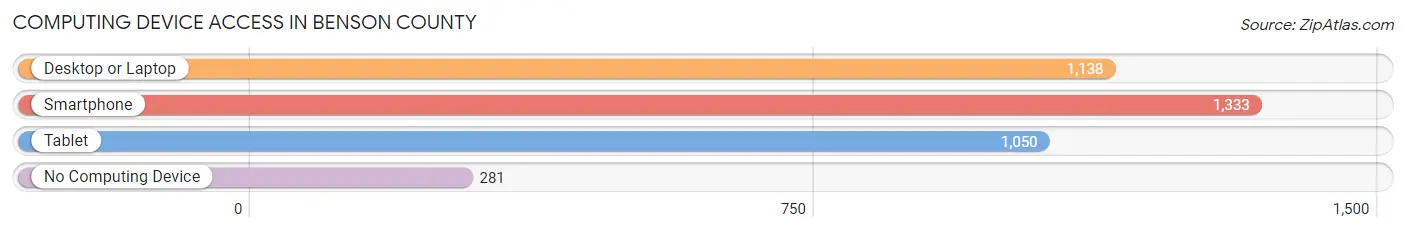
| Device Type | # Households | % Households |
| Desktop or Laptop | 1,138 | 60.9% |
| Smartphone | 1,333 | 71.3% |
| Tablet | 1,050 | 56.2% |
| No Computing Device | 281 | 15.0% |
| Total | 1,869 | 100.0% |
Internet Access in Benson County
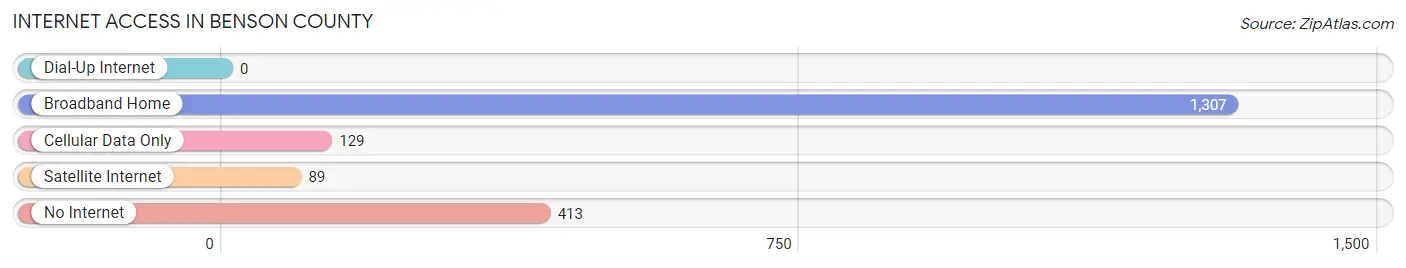
| Internet Type | # Households | % Households |
| Dial-Up Internet | 0 | 0.0% |
| Broadband Home | 1,307 | 69.9% |
| Cellular Data Only | 129 | 6.9% |
| Satellite Internet | 89 | 4.8% |
| No Internet | 413 | 22.1% |
| Total | 1,869 | 100.0% |
Benson County Summary
Benson County is located in the northeastern corner of North Dakota, and is bordered by Canada to the north, Walsh County to the east, Ramsey County to the south, and Rolette County to the west. The county seat is Minnewaukan, and the county was named after B.W. Benson, a former state legislator. Benson County has a total area of 1,845 square miles, of which 1,843 square miles is land and 2 square miles is water.
History
Benson County was established in 1883, and was originally part of the Dakota Territory. The county was named after B.W. Benson, a former state legislator. The first settlers in the area were mostly of Scandinavian descent, and the county was largely agricultural. The county was also home to several Native American tribes, including the Chippewa, Sioux, and Mandan.
In the early 1900s, the county experienced a population boom due to the discovery of oil in the area. This led to the development of several towns, including Minnewaukan, which became the county seat. The county also experienced a surge in population due to the construction of the Garrison Dam in the 1950s.
Geography
Benson County is located in the northeastern corner of North Dakota, and is bordered by Canada to the north, Walsh County to the east, Ramsey County to the south, and Rolette County to the west. The county has a total area of 1,845 square miles, of which 1,843 square miles is land and 2 square miles is water.
The county is mostly flat, with some rolling hills in the western part of the county. The county is home to several lakes, including Lake Metigoshe, Lake Ashtabula, and Lake Alice. The county is also home to several rivers, including the Sheyenne River, the Red River, and the Souris River.
Economy
Benson County has a largely agricultural economy, with the majority of the population employed in farming and ranching. The county is also home to several oil and gas fields, which provide additional employment opportunities. The county is also home to several manufacturing companies, including a paper mill and a furniture factory.
Demographics
As of the 2010 census, Benson County had a population of 6,660. The racial makeup of the county was 94.3% White, 0.3% African American, 2.2% Native American, 0.2% Asian, 0.1% Pacific Islander, 0.7% from other races, and 2.3% from two or more races. Hispanic or Latino of any race were 1.7% of the population.
The median income for a household in the county was $41,944, and the median income for a family was $50,938. The per capita income for the county was $20,845. About 11.2% of families and 14.2% of the population were below the poverty line, including 19.2% of those under age 18 and 11.2% of those age 65 or over.
Common Questions
What is the Total Population of Benson County?
Total Population of Benson County is 5,960.
What is the Total Male Population of Benson County?
Total Male Population of Benson County is 3,080.
What is the Total Female Population of Benson County?
Total Female Population of Benson County is 2,880.
What is the Ratio of Males per 100 Females in Benson County?
There are 106.94 Males per 100 Females in Benson County.
What is the Ratio of Females per 100 Males in Benson County?
There are 93.51 Females per 100 Males in Benson County.
What is the Median Population Age in Benson County?
Median Population Age in Benson County is 31.0 Years.
What is the Average Family Size in Benson County
Average Family Size in Benson County is 3.9 People.
What is the Average Household Size in Benson County
Average Household Size in Benson County is 3.2 People.
What is Per Capita Income in Benson County?
Per Capita income in Benson County is $24,490.
What is the Median Family Income in Benson County?
Median Family Income in Benson County is $68,523.
What is the Median Household income in Benson County?
Median Household Income in Benson County is $63,220.
What is Income or Wage Gap in Benson County?
Income or Wage Gap in Benson County is 19.1%.
Women in Benson County earn 80.9 cents for every dollar earned by a man.
What is Family Income Deficit in Benson County?
Family Income Deficit in Benson County is $19,229.
Families that are below poverty line in Benson County earn $19,229 less on average than the poverty threshold level.
What is Inequality or Gini Index in Benson County?
Inequality or Gini Index in Benson County is 0.49.
How Large is the Labor Force in Benson County?
There are 2,096 People in the Labor Forcein in Benson County.
What is the Percentage of People in the Labor Force in Benson County?
51.4% of People are in the Labor Force in Benson County.
What is the Unemployment Rate in Benson County?
Unemployment Rate in Benson County is 2.2%.