Ackerman, MS
Ackerman Map
Ackerman Overview
1,793
TOTAL POPULATION
855
MALE POPULATION
938
FEMALE POPULATION
91.15
MALES / 100 FEMALES
109.71
FEMALES / 100 MALES
38.5
MEDIAN AGE
3.0
AVG FAMILY SIZE
2.4
AVG HOUSEHOLD SIZE
$22,049
PER CAPITA INCOME
$42,292
AVG FAMILY INCOME
$36,230
AVG HOUSEHOLD INCOME
32.8%
WAGE / INCOME GAP [ % ]
67.2¢/ $1
WAGE / INCOME GAP [ $ ]
0.58
INEQUALITY / GINI INDEX
660
LABOR FORCE [ PEOPLE ]
48.1%
PERCENT IN LABOR FORCE
18.0%
UNEMPLOYMENT RATE
Ackerman Zip Codes
Ackerman Area Codes
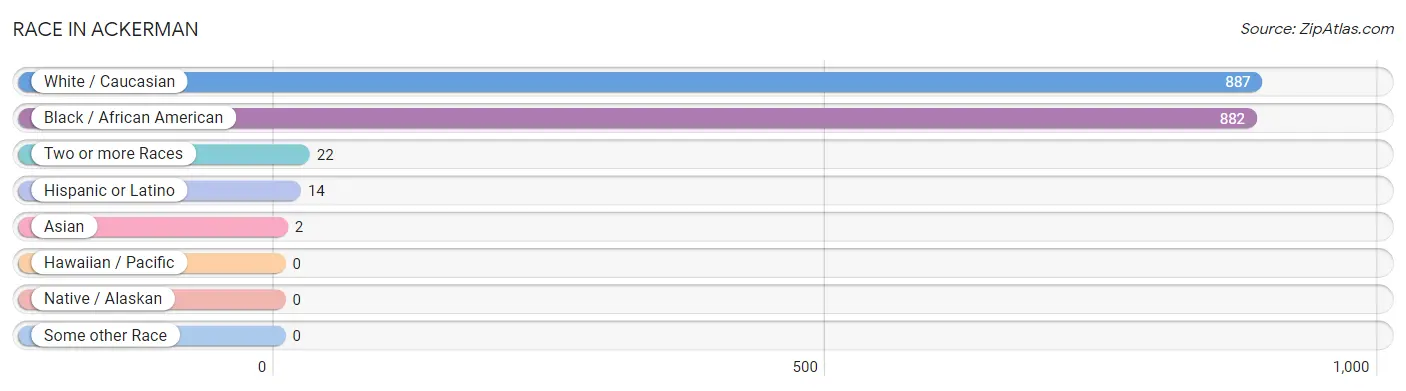
Race in Ackerman
The most populous races in Ackerman are White / Caucasian (887 | 49.5%), Black / African American (882 | 49.2%), and Two or more Races (22 | 1.2%).
| Race | # Population | % Population |
| Asian | 2 | 0.1% |
| Black / African American | 882 | 49.2% |
| Hawaiian / Pacific | 0 | 0.0% |
| Hispanic or Latino | 14 | 0.8% |
| Native / Alaskan | 0 | 0.0% |
| White / Caucasian | 887 | 49.5% |
| Two or more Races | 22 | 1.2% |
| Some other Race | 0 | 0.0% |
| Total | 1,793 | 100.0% |
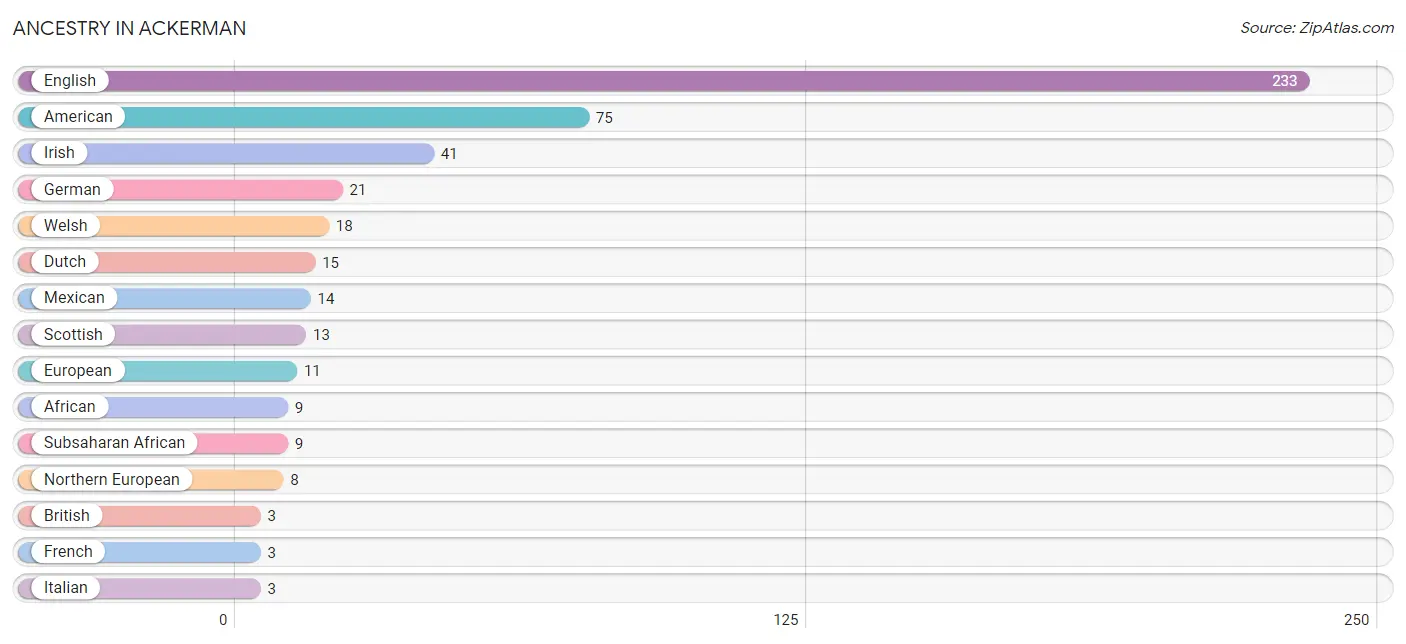
Ancestry in Ackerman
The most populous ancestries reported in Ackerman are English (233 | 13.0%), American (75 | 4.2%), Irish (41 | 2.3%), German (21 | 1.2%), and Welsh (18 | 1.0%), together accounting for 21.6% of all Ackerman residents.
| Ancestry | # Population | % Population |
| African | 9 | 0.5% |
| American | 75 | 4.2% |
| British | 3 | 0.2% |
| Dutch | 15 | 0.8% |
| English | 233 | 13.0% |
| European | 11 | 0.6% |
| French | 3 | 0.2% |
| German | 21 | 1.2% |
| Irish | 41 | 2.3% |
| Italian | 3 | 0.2% |
| Korean | 2 | 0.1% |
| Mexican | 14 | 0.8% |
| Northern European | 8 | 0.4% |
| Norwegian | 1 | 0.1% |
| Polish | 2 | 0.1% |
| Scotch-Irish | 2 | 0.1% |
| Scottish | 13 | 0.7% |
| Subsaharan African | 9 | 0.5% |
| Welsh | 18 | 1.0% | View All 19 Rows |
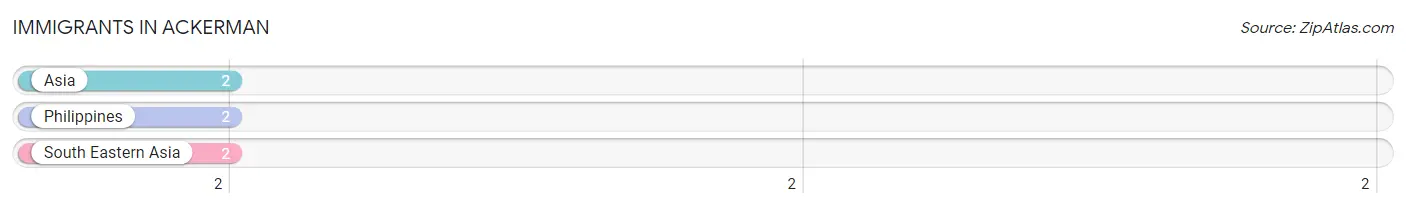
Immigrants in Ackerman
The most numerous immigrant groups reported in Ackerman came from Asia (2 | 0.1%), Philippines (2 | 0.1%), and South Eastern Asia (2 | 0.1%), together accounting for 0.3% of all Ackerman residents.
| Immigration Origin | # Population | % Population |
| Asia | 2 | 0.1% |
| Philippines | 2 | 0.1% |
| South Eastern Asia | 2 | 0.1% | View All 3 Rows |
Sex and Age in Ackerman
Sex and Age in Ackerman
The most populous age groups in Ackerman are 10 to 14 Years (132 | 15.4%) for men and 40 to 44 Years (112 | 11.9%) for women.
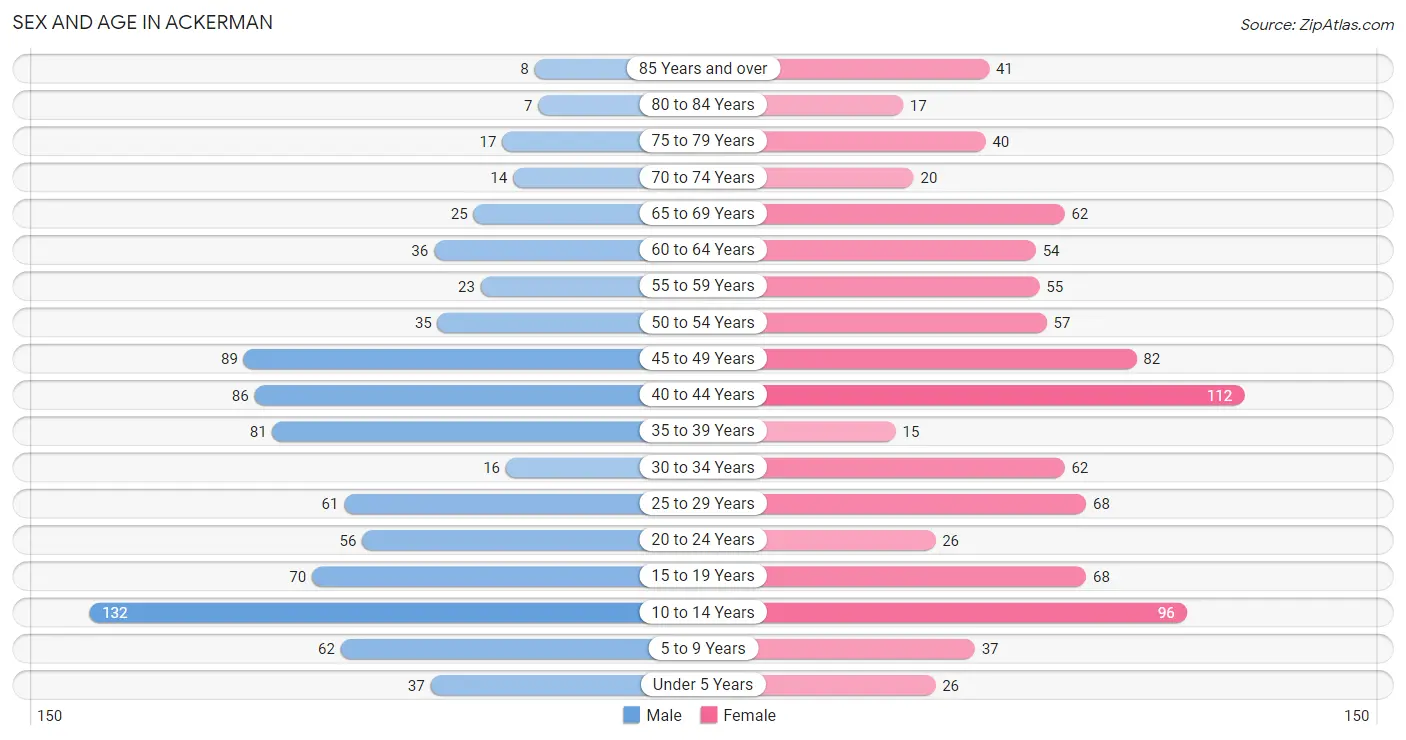
| Age Bracket | Male | Female |
| Under 5 Years | 37 (4.3%) | 26 (2.8%) |
| 5 to 9 Years | 62 (7.2%) | 37 (3.9%) |
| 10 to 14 Years | 132 (15.4%) | 96 (10.2%) |
| 15 to 19 Years | 70 (8.2%) | 68 (7.2%) |
| 20 to 24 Years | 56 (6.6%) | 26 (2.8%) |
| 25 to 29 Years | 61 (7.1%) | 68 (7.2%) |
| 30 to 34 Years | 16 (1.9%) | 62 (6.6%) |
| 35 to 39 Years | 81 (9.5%) | 15 (1.6%) |
| 40 to 44 Years | 86 (10.1%) | 112 (11.9%) |
| 45 to 49 Years | 89 (10.4%) | 82 (8.7%) |
| 50 to 54 Years | 35 (4.1%) | 57 (6.1%) |
| 55 to 59 Years | 23 (2.7%) | 55 (5.9%) |
| 60 to 64 Years | 36 (4.2%) | 54 (5.8%) |
| 65 to 69 Years | 25 (2.9%) | 62 (6.6%) |
| 70 to 74 Years | 14 (1.6%) | 20 (2.1%) |
| 75 to 79 Years | 17 (2.0%) | 40 (4.3%) |
| 80 to 84 Years | 7 (0.8%) | 17 (1.8%) |
| 85 Years and over | 8 (0.9%) | 41 (4.4%) |
| Total | 855 (100.0%) | 938 (100.0%) |
Families and Households in Ackerman
Median Family Size in Ackerman
The median family size in Ackerman is 3.00 persons per family, with married-couple families (241 | 52.3%) accounting for the largest median family size of 3.08 persons per family. On the other hand, single male/father families (29 | 6.3%) represent the smallest median family size with 1.90 persons per family.
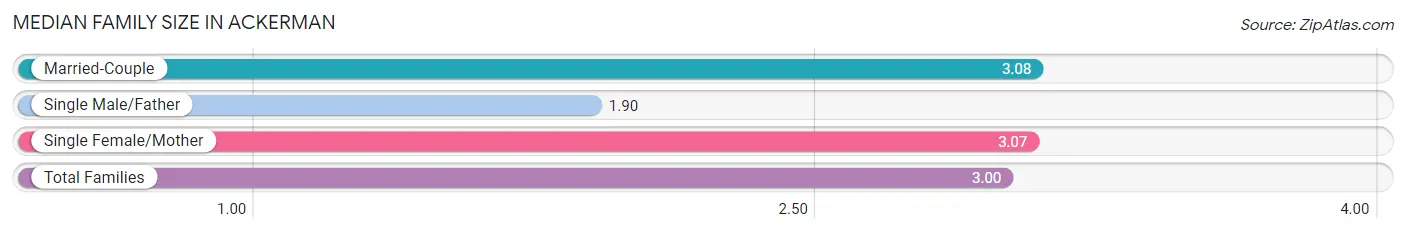
| Family Type | # Families | Family Size |
| Married-Couple | 241 (52.3%) | 3.08 |
| Single Male/Father | 29 (6.3%) | 1.90 |
| Single Female/Mother | 191 (41.4%) | 3.07 |
| Total Families | 461 (100.0%) | 3.00 |
Median Household Size in Ackerman
The median household size in Ackerman is 2.40 persons per household, with single female/mother households (191 | 27.4%) accounting for the largest median household size of 3.15 persons per household. non-family households (236 | 33.9%) represent the smallest median household size with 1.16 persons per household.
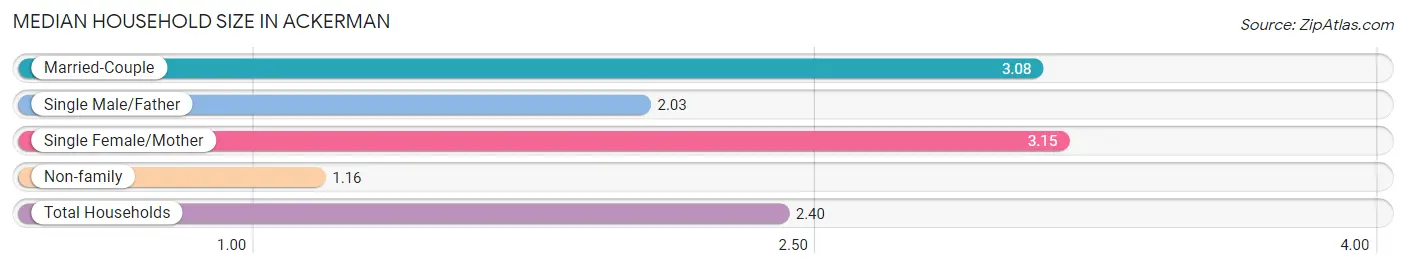
| Household Type | # Households | Household Size |
| Married-Couple | 241 (34.6%) | 3.08 |
| Single Male/Father | 29 (4.2%) | 2.03 |
| Single Female/Mother | 191 (27.4%) | 3.15 |
| Non-family | 236 (33.9%) | 1.16 |
| Total Households | 697 (100.0%) | 2.40 |
Household Size by Marriage Status in Ackerman
Out of a total of 697 households in Ackerman, 461 (66.1%) are family households, while 236 (33.9%) are nonfamily households. The most numerous type of family households are 2-person households, comprising 170, and the most common type of nonfamily households are 1-person households, comprising 200.
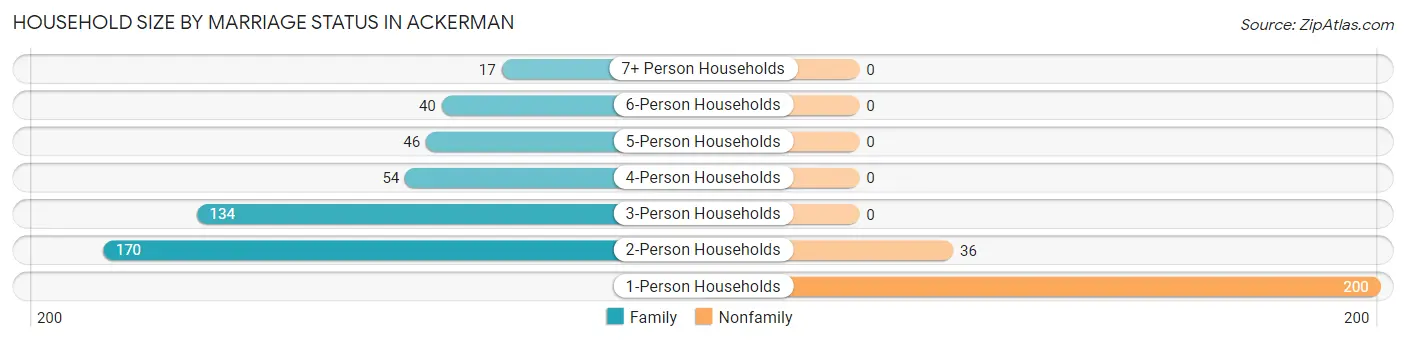
| Household Size | Family Households | Nonfamily Households |
| 1-Person Households | - | 200 (28.7%) |
| 2-Person Households | 170 (24.4%) | 36 (5.2%) |
| 3-Person Households | 134 (19.2%) | 0 (0.0%) |
| 4-Person Households | 54 (7.7%) | 0 (0.0%) |
| 5-Person Households | 46 (6.6%) | 0 (0.0%) |
| 6-Person Households | 40 (5.7%) | 0 (0.0%) |
| 7+ Person Households | 17 (2.4%) | 0 (0.0%) |
| Total | 461 (66.1%) | 236 (33.9%) |
Female Fertility in Ackerman
Fertility by Age in Ackerman
Average fertility rate in Ackerman is 147.0 births per 1,000 women. Women in the age bracket of 20 to 34 years have the highest fertility rate with 410.0 births per 1,000 women. Women in the age bracket of 20 to 34 years acount for 100.0% of all women with births.
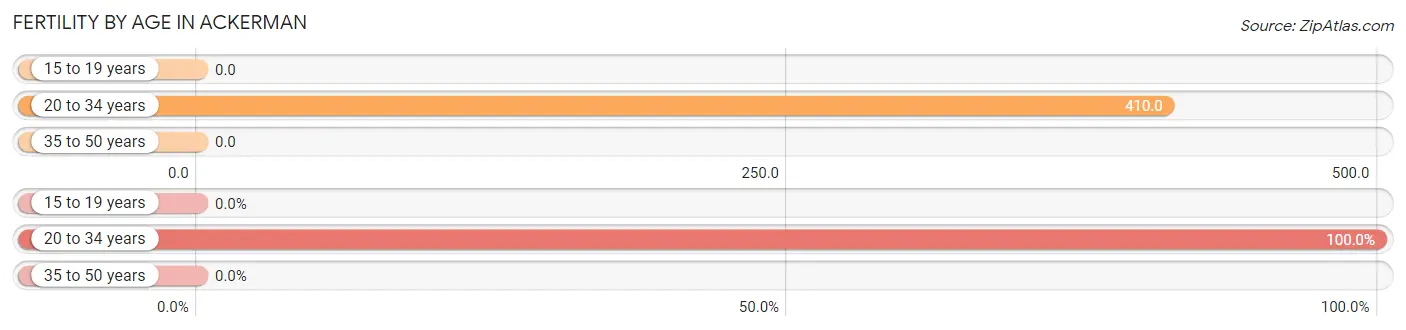
| Age Bracket | Women with Births | Births / 1,000 Women |
| 15 to 19 years | 0 (0.0%) | 0.0 |
| 20 to 34 years | 64 (100.0%) | 410.0 |
| 35 to 50 years | 0 (0.0%) | 0.0 |
| Total | 64 (100.0%) | 147.0 |
Fertility by Age by Marriage Status in Ackerman
73.4% of women with births (64) in Ackerman are married. The highest percentage of unmarried women with births falls into 20 to 34 years age bracket with 26.6% of them unmarried at the time of birth, while the lowest percentage of unmarried women with births belong to 20 to 34 years age bracket with 26.6% of them unmarried.
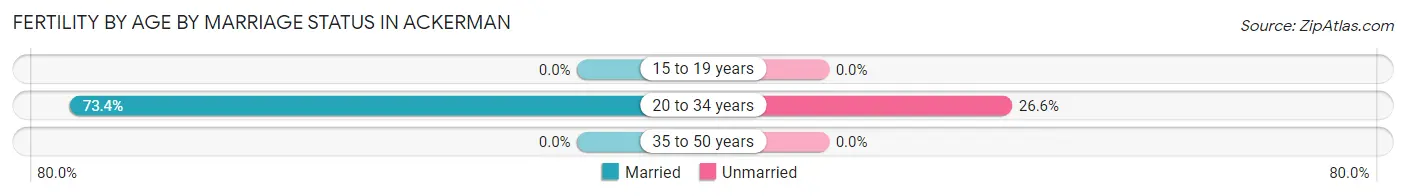
| Age Bracket | Married | Unmarried |
| 15 to 19 years | 0 (0.0%) | 0 (0.0%) |
| 20 to 34 years | 47 (73.4%) | 17 (26.6%) |
| 35 to 50 years | 0 (0.0%) | 0 (0.0%) |
| Total | 47 (73.4%) | 17 (26.6%) |
Fertility by Education in Ackerman
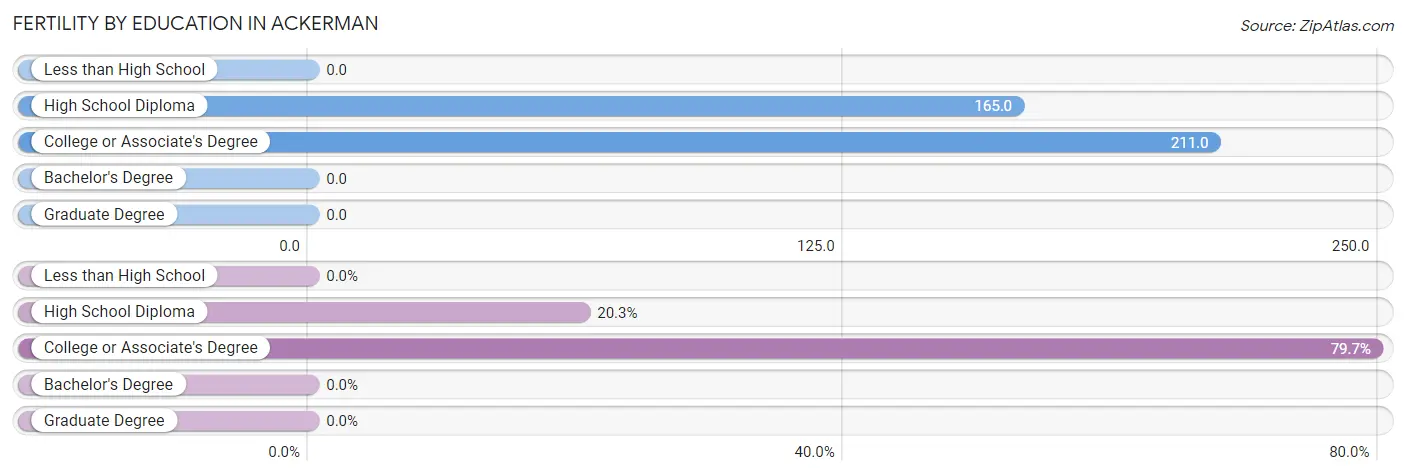
| Educational Attainment | Women with Births | Births / 1,000 Women |
| Less than High School | 0 (0.0%) | 0.0 |
| High School Diploma | 13 (20.3%) | 165.0 |
| College or Associate's Degree | 51 (79.7%) | 211.0 |
| Bachelor's Degree | 0 (0.0%) | 0.0 |
| Graduate Degree | 0 (0.0%) | 0.0 |
| Total | 64 (100.0%) | 147.0 |
Fertility by Education by Marriage Status in Ackerman
26.6% of women with births in Ackerman are unmarried. Women with the educational attainment of college or associate's degree are most likely to be married with 92.2% of them married at childbirth, while women with the educational attainment of high school diploma are least likely to be married with 100.0% of them unmarried at childbirth.
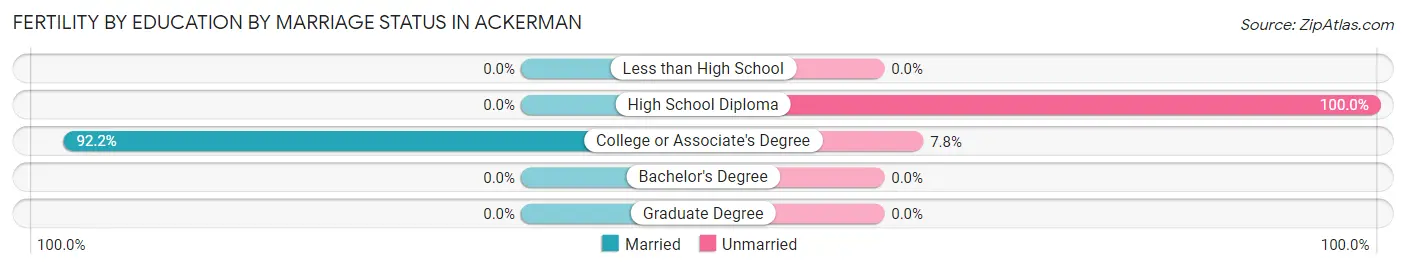
| Educational Attainment | Married | Unmarried |
| Less than High School | 0 (0.0%) | 0 (0.0%) |
| High School Diploma | 0 (0.0%) | 13 (100.0%) |
| College or Associate's Degree | 47 (92.2%) | 4 (7.8%) |
| Bachelor's Degree | 0 (0.0%) | 0 (0.0%) |
| Graduate Degree | 0 (0.0%) | 0 (0.0%) |
| Total | 47 (73.4%) | 17 (26.6%) |
Income in Ackerman
Income Overview in Ackerman
Per Capita Income in Ackerman is $22,049, while median incomes of families and households are $42,292 and $36,230 respectively.
| Characteristic | Number | Measure |
| Per Capita Income | 1,793 | $22,049 |
| Median Family Income | 461 | $42,292 |
| Mean Family Income | 461 | $81,711 |
| Median Household Income | 697 | $36,230 |
| Mean Household Income | 697 | $70,117 |
| Income Deficit | 461 | $0 |
| Wage / Income Gap (%) | 1,793 | 32.77% |
| Wage / Income Gap ($) | 1,793 | 67.23¢ per $1 |
| Gini / Inequality Index | 1,793 | 0.58 |
Earnings by Sex in Ackerman
Average Earnings in Ackerman are $31,667, $41,484 for men and $27,891 for women, a difference of 32.8%.
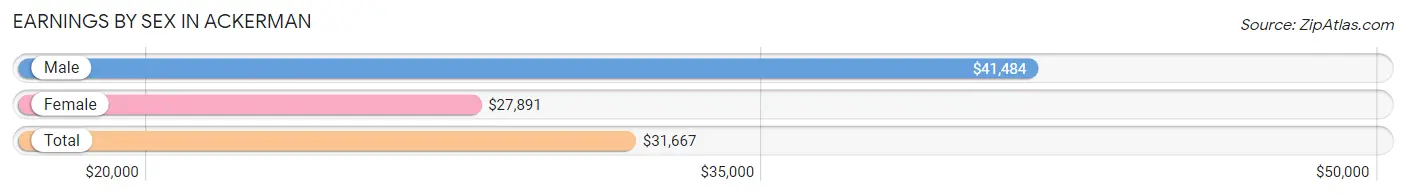
| Sex | Number | Average Earnings |
| Male | 399 (55.0%) | $41,484 |
| Female | 327 (45.0%) | $27,891 |
| Total | 726 (100.0%) | $31,667 |
Earnings by Sex by Income Bracket in Ackerman
The most common earnings brackets in Ackerman are $2,500 to $4,999 for men (74 | 18.5%) and $30,000 to $34,999 for women (87 | 26.6%).
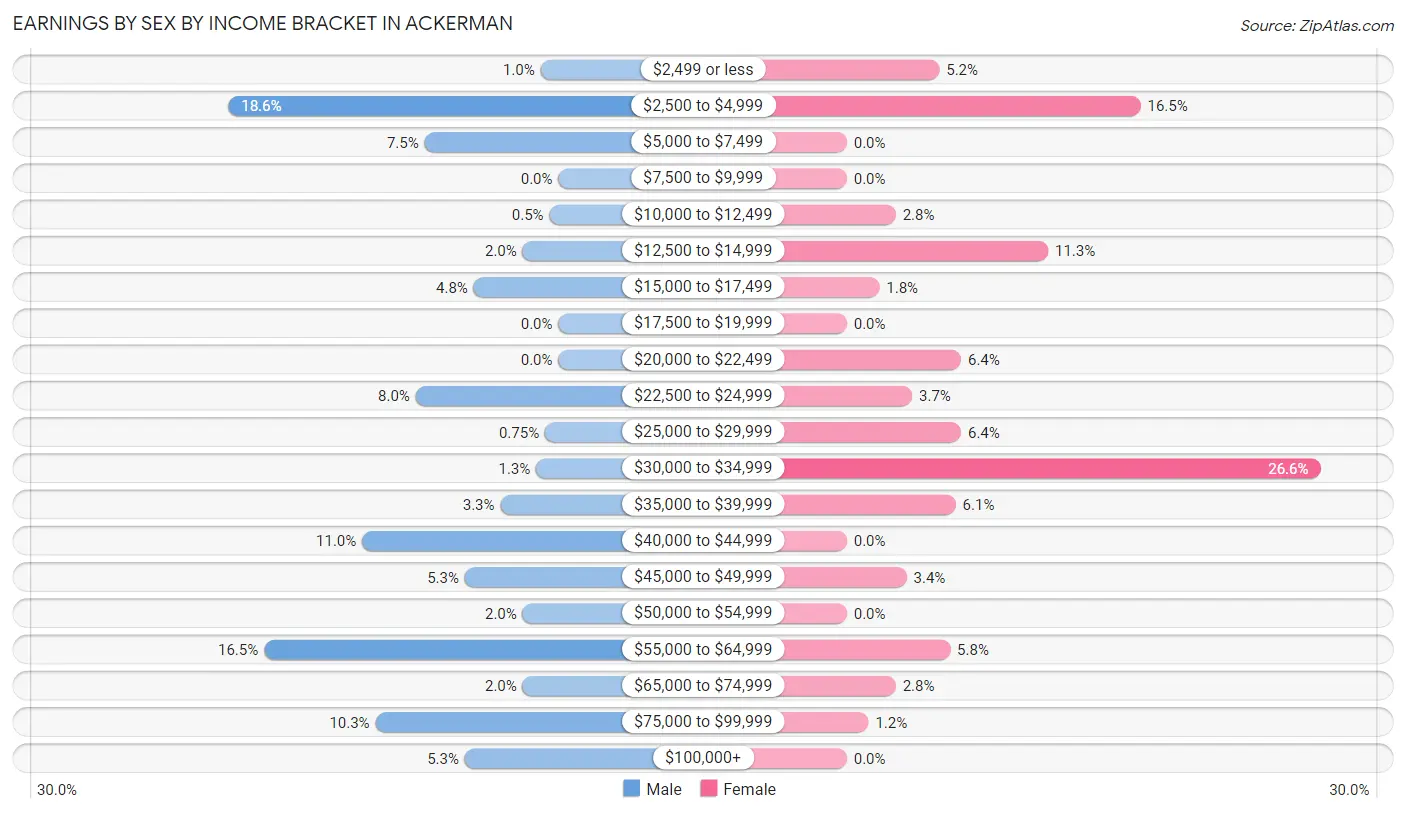
| Income | Male | Female |
| $2,499 or less | 4 (1.0%) | 17 (5.2%) |
| $2,500 to $4,999 | 74 (18.5%) | 54 (16.5%) |
| $5,000 to $7,499 | 30 (7.5%) | 0 (0.0%) |
| $7,500 to $9,999 | 0 (0.0%) | 0 (0.0%) |
| $10,000 to $12,499 | 2 (0.5%) | 9 (2.8%) |
| $12,500 to $14,999 | 8 (2.0%) | 37 (11.3%) |
| $15,000 to $17,499 | 19 (4.8%) | 6 (1.8%) |
| $17,500 to $19,999 | 0 (0.0%) | 0 (0.0%) |
| $20,000 to $22,499 | 0 (0.0%) | 21 (6.4%) |
| $22,500 to $24,999 | 32 (8.0%) | 12 (3.7%) |
| $25,000 to $29,999 | 3 (0.7%) | 21 (6.4%) |
| $30,000 to $34,999 | 5 (1.3%) | 87 (26.6%) |
| $35,000 to $39,999 | 13 (3.3%) | 20 (6.1%) |
| $40,000 to $44,999 | 44 (11.0%) | 0 (0.0%) |
| $45,000 to $49,999 | 21 (5.3%) | 11 (3.4%) |
| $50,000 to $54,999 | 8 (2.0%) | 0 (0.0%) |
| $55,000 to $64,999 | 66 (16.5%) | 19 (5.8%) |
| $65,000 to $74,999 | 8 (2.0%) | 9 (2.8%) |
| $75,000 to $99,999 | 41 (10.3%) | 4 (1.2%) |
| $100,000+ | 21 (5.3%) | 0 (0.0%) |
| Total | 399 (100.0%) | 327 (100.0%) |
Earnings by Sex by Educational Attainment in Ackerman
Average earnings in Ackerman are $42,188 for men and $31,172 for women, a difference of 26.1%. Men with an educational attainment of college or associate's degree enjoy the highest average annual earnings of $55,547, while those with bachelor's degree education earn the least with $44,688. Women with an educational attainment of college or associate's degree earn the most with the average annual earnings of $32,898, while those with bachelor's degree education have the smallest earnings of $23,750.
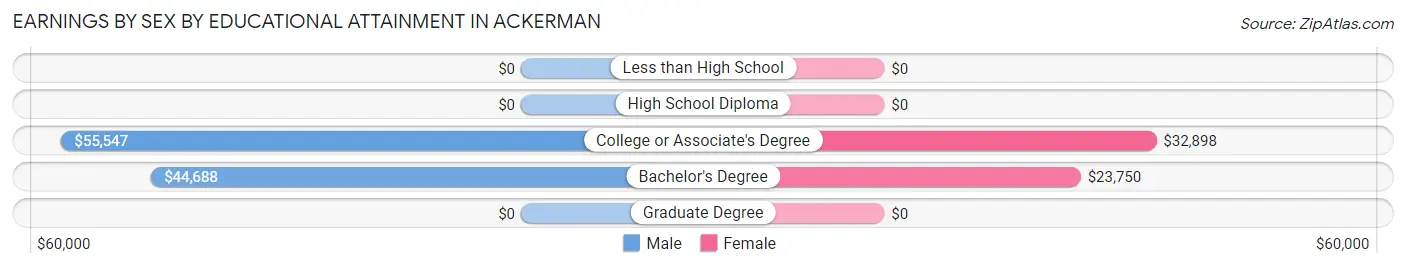
| Educational Attainment | Male Income | Female Income |
| Less than High School | - | - |
| High School Diploma | - | - |
| College or Associate's Degree | $55,547 | $32,898 |
| Bachelor's Degree | $44,688 | $23,750 |
| Graduate Degree | - | - |
| Total | $42,188 | $31,172 |
Family Income in Ackerman
Family Income Brackets in Ackerman
According to the Ackerman family income data, there are 82 families falling into the $50,000 to $74,999 income range, which is the most common income bracket and makes up 17.8% of all families. Conversely, the $150,000 to $199,999 income bracket is the least frequent group with only 10 families (2.2%) belonging to this category.
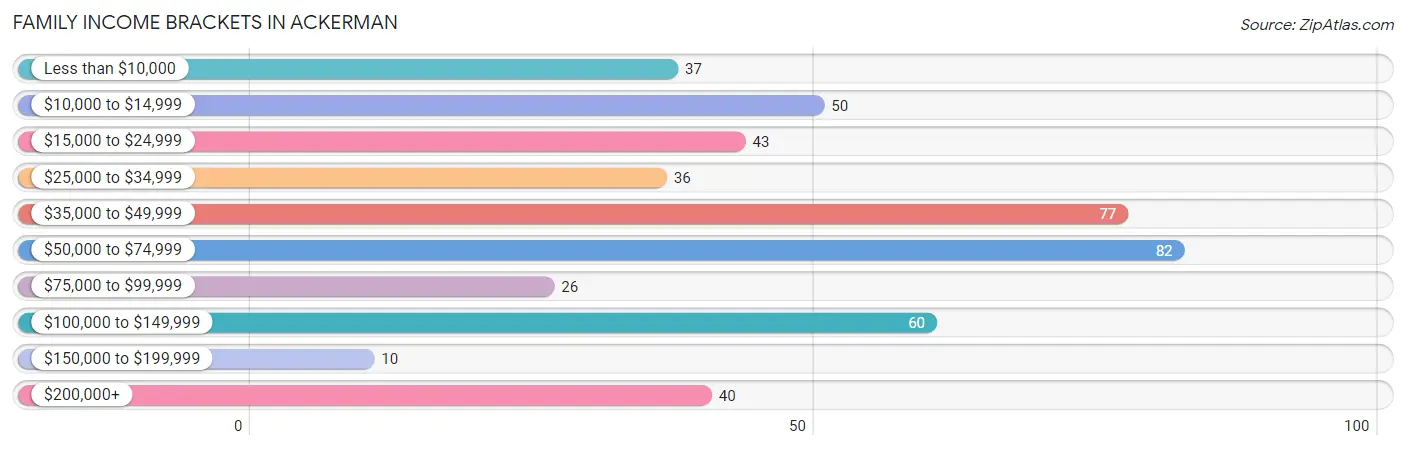
| Income Bracket | # Families | % Families |
| Less than $10,000 | 37 | 8.0% |
| $10,000 to $14,999 | 50 | 10.8% |
| $15,000 to $24,999 | 43 | 9.3% |
| $25,000 to $34,999 | 36 | 7.8% |
| $35,000 to $49,999 | 77 | 16.7% |
| $50,000 to $74,999 | 82 | 17.8% |
| $75,000 to $99,999 | 26 | 5.6% |
| $100,000 to $149,999 | 60 | 13.0% |
| $150,000 to $199,999 | 10 | 2.2% |
| $200,000+ | 40 | 8.7% |
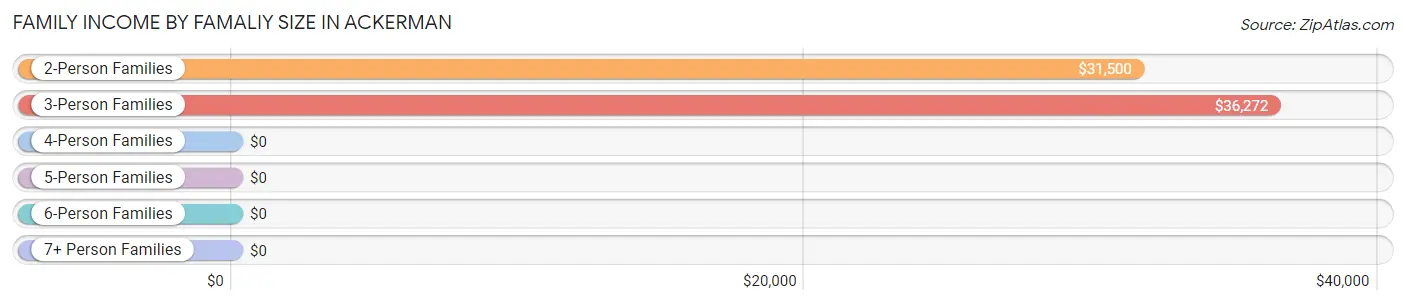
Family Income by Famaliy Size in Ackerman
3-person families (150 | 32.5%) account for the highest median family income in Ackerman with $36,272 per family, while 2-person families (182 | 39.5%) have the highest median income of $15,750 per family member.
| Income Bracket | # Families | Median Income |
| 2-Person Families | 182 (39.5%) | $31,500 |
| 3-Person Families | 150 (32.5%) | $36,272 |
| 4-Person Families | 26 (5.6%) | $0 |
| 5-Person Families | 46 (10.0%) | $0 |
| 6-Person Families | 40 (8.7%) | $0 |
| 7+ Person Families | 17 (3.7%) | $0 |
| Total | 461 (100.0%) | $42,292 |
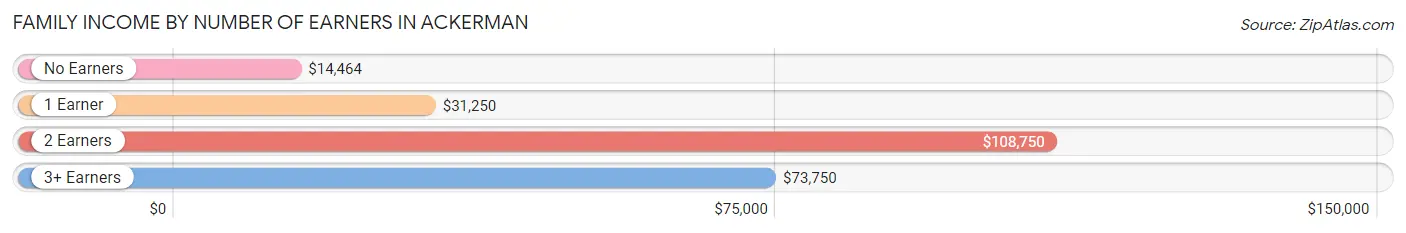
Family Income by Number of Earners in Ackerman
The median family income in Ackerman is $42,292, with families comprising 2 earners (190) having the highest median family income of $108,750, while families with no earners (95) have the lowest median family income of $14,464, accounting for 41.2% and 20.6% of families, respectively.
| Number of Earners | # Families | Median Income |
| No Earners | 95 (20.6%) | $14,464 |
| 1 Earner | 158 (34.3%) | $31,250 |
| 2 Earners | 190 (41.2%) | $108,750 |
| 3+ Earners | 18 (3.9%) | $73,750 |
| Total | 461 (100.0%) | $42,292 |
Household Income in Ackerman
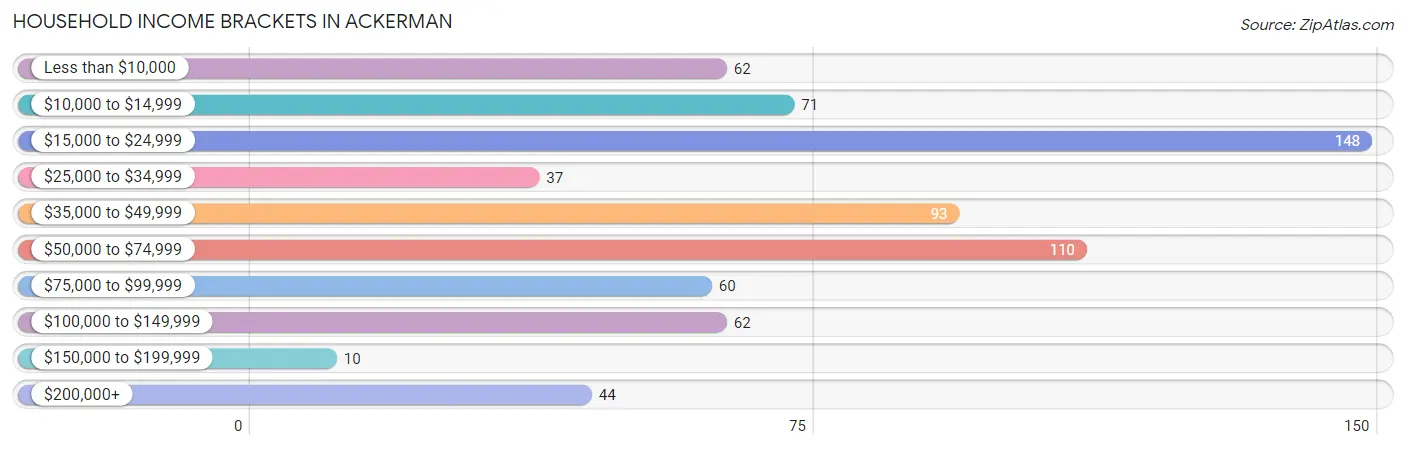
Household Income Brackets in Ackerman
With 148 households falling in the category, the $15,000 to $24,999 income range is the most frequent in Ackerman, accounting for 21.2% of all households. In contrast, only 10 households (1.4%) fall into the $150,000 to $199,999 income bracket, making it the least populous group.
| Income Bracket | # Households | % Households |
| Less than $10,000 | 62 | 8.9% |
| $10,000 to $14,999 | 71 | 10.2% |
| $15,000 to $24,999 | 148 | 21.2% |
| $25,000 to $34,999 | 37 | 5.3% |
| $35,000 to $49,999 | 93 | 13.3% |
| $50,000 to $74,999 | 110 | 15.8% |
| $75,000 to $99,999 | 60 | 8.6% |
| $100,000 to $149,999 | 62 | 8.9% |
| $150,000 to $199,999 | 10 | 1.4% |
| $200,000+ | 44 | 6.3% |
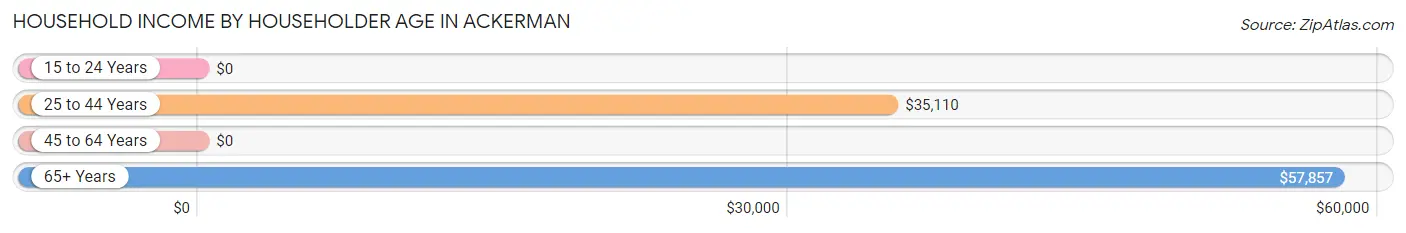
Household Income by Householder Age in Ackerman
The median household income in Ackerman is $36,230, with the highest median household income of $57,857 found in the 65+ years age bracket for the primary householder. A total of 162 households (23.2%) fall into this category. Meanwhile, the 15 to 24 years age bracket for the primary householder has the lowest median household income of $0, with 21 households (3.0%) in this group.
| Income Bracket | # Households | Median Income |
| 15 to 24 Years | 21 (3.0%) | $0 |
| 25 to 44 Years | 335 (48.1%) | $35,110 |
| 45 to 64 Years | 179 (25.7%) | $0 |
| 65+ Years | 162 (23.2%) | $57,857 |
| Total | 697 (100.0%) | $36,230 |
Poverty in Ackerman
Income Below Poverty by Sex and Age in Ackerman
With 25.2% poverty level for males and 27.7% for females among the residents of Ackerman, 15 year old males and 5 year old females are the most vulnerable to poverty, with 25 males (100.0%) and 11 females (84.6%) in their respective age groups living below the poverty level.

| Age Bracket | Male | Female |
| Under 5 Years | 17 (46.0%) | 0 (0.0%) |
| 5 Years | 0 (0.0%) | 11 (84.6%) |
| 6 to 11 Years | 30 (19.7%) | 11 (16.2%) |
| 12 to 14 Years | 17 (56.7%) | 25 (48.1%) |
| 15 Years | 25 (100.0%) | 0 (0.0%) |
| 16 and 17 Years | 0 (0.0%) | 16 (33.3%) |
| 18 to 24 Years | 46 (60.5%) | 25 (61.0%) |
| 25 to 34 Years | 14 (20.6%) | 60 (46.2%) |
| 35 to 44 Years | 18 (12.9%) | 30 (23.6%) |
| 45 to 54 Years | 7 (5.9%) | 0 (0.0%) |
| 55 to 64 Years | 18 (33.3%) | 43 (40.6%) |
| 65 to 74 Years | 5 (15.6%) | 13 (15.9%) |
| 75 Years and over | 2 (8.0%) | 11 (13.6%) |
| Total | 199 (25.2%) | 245 (27.7%) |
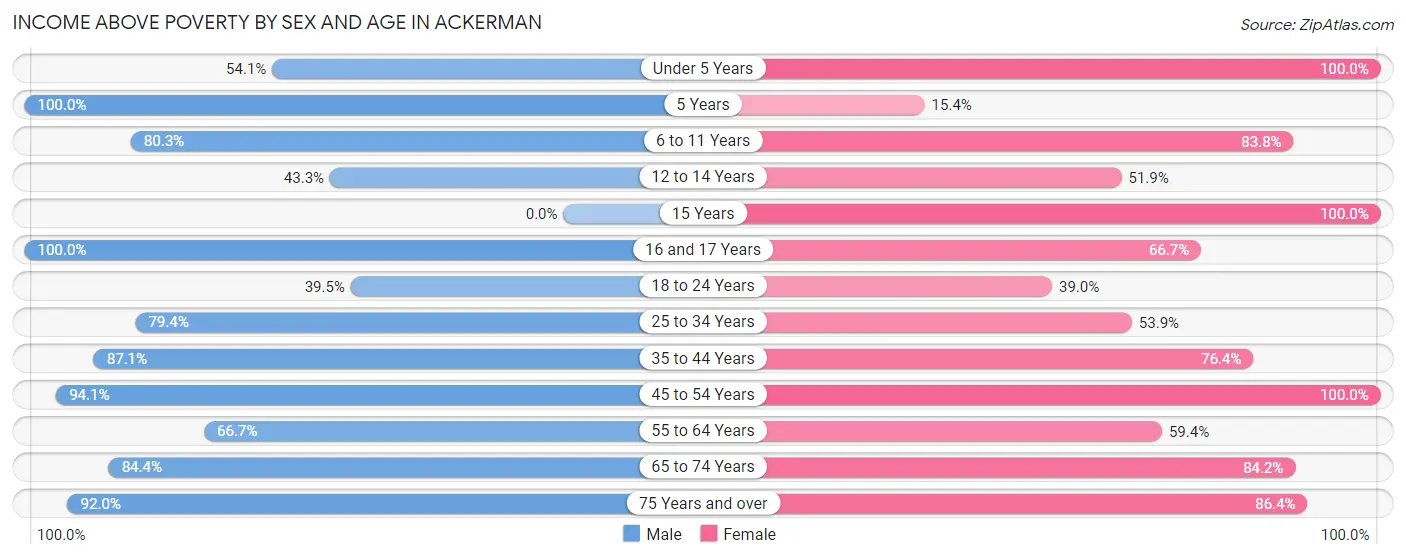
Income Above Poverty by Sex and Age in Ackerman
According to the poverty statistics in Ackerman, males aged 5 years and females aged under 5 years are the age groups that are most secure financially, with 100.0% of males and 100.0% of females in these age groups living above the poverty line.
| Age Bracket | Male | Female |
| Under 5 Years | 20 (54.0%) | 26 (100.0%) |
| 5 Years | 12 (100.0%) | 2 (15.4%) |
| 6 to 11 Years | 122 (80.3%) | 57 (83.8%) |
| 12 to 14 Years | 13 (43.3%) | 27 (51.9%) |
| 15 Years | 0 (0.0%) | 5 (100.0%) |
| 16 and 17 Years | 21 (100.0%) | 32 (66.7%) |
| 18 to 24 Years | 30 (39.5%) | 16 (39.0%) |
| 25 to 34 Years | 54 (79.4%) | 70 (53.8%) |
| 35 to 44 Years | 122 (87.1%) | 97 (76.4%) |
| 45 to 54 Years | 112 (94.1%) | 106 (100.0%) |
| 55 to 64 Years | 36 (66.7%) | 63 (59.4%) |
| 65 to 74 Years | 27 (84.4%) | 69 (84.2%) |
| 75 Years and over | 23 (92.0%) | 70 (86.4%) |
| Total | 592 (74.8%) | 640 (72.3%) |
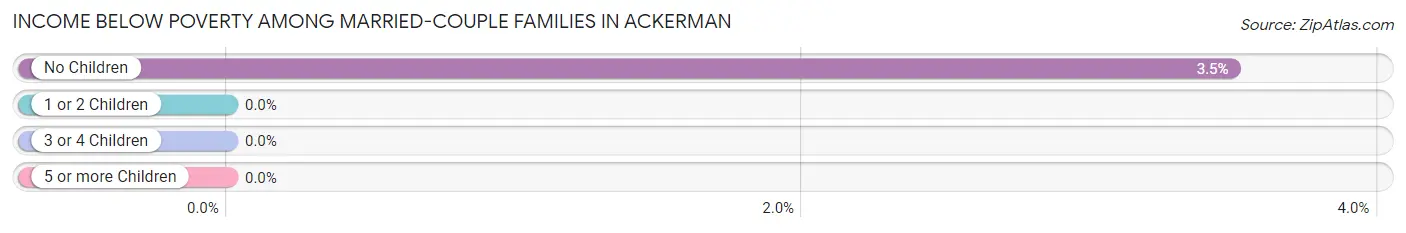
Income Below Poverty Among Married-Couple Families in Ackerman
The poverty statistics for married-couple families in Ackerman show that 1.2% or 3 of the total 241 families live below the poverty line. Families with no children have the highest poverty rate of 3.5%, comprising of 3 families. On the other hand, families with 1 or 2 children have the lowest poverty rate of 0.0%, which includes 0 families.
| Children | Above Poverty | Below Poverty |
| No Children | 83 (96.5%) | 3 (3.5%) |
| 1 or 2 Children | 84 (100.0%) | 0 (0.0%) |
| 3 or 4 Children | 71 (100.0%) | 0 (0.0%) |
| 5 or more Children | 0 (0.0%) | 0 (0.0%) |
| Total | 238 (98.8%) | 3 (1.2%) |
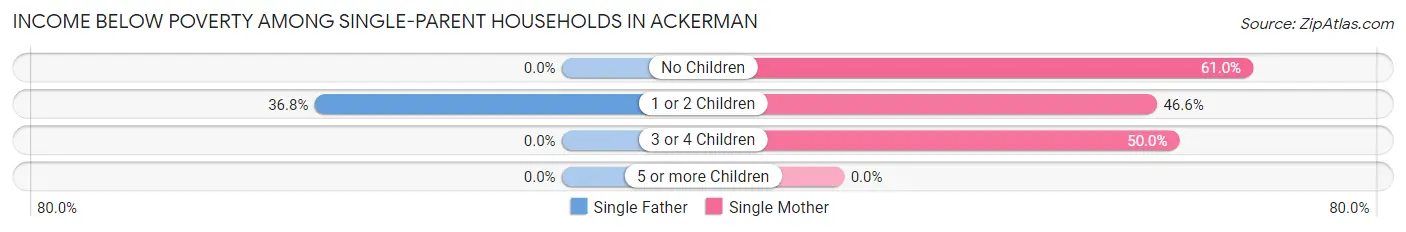
Income Below Poverty Among Single-Parent Households in Ackerman
According to the poverty data in Ackerman, 24.1% or 7 single-father households and 50.3% or 96 single-mother households are living below the poverty line. Among single-father households, those with 1 or 2 children have the highest poverty rate, with 7 households (36.8%) experiencing poverty. Likewise, among single-mother households, those with no children have the highest poverty rate, with 25 households (61.0%) falling below the poverty line.
| Children | Single Father | Single Mother |
| No Children | 0 (0.0%) | 25 (61.0%) |
| 1 or 2 Children | 7 (36.8%) | 55 (46.6%) |
| 3 or 4 Children | 0 (0.0%) | 16 (50.0%) |
| 5 or more Children | 0 (0.0%) | 0 (0.0%) |
| Total | 7 (24.1%) | 96 (50.3%) |
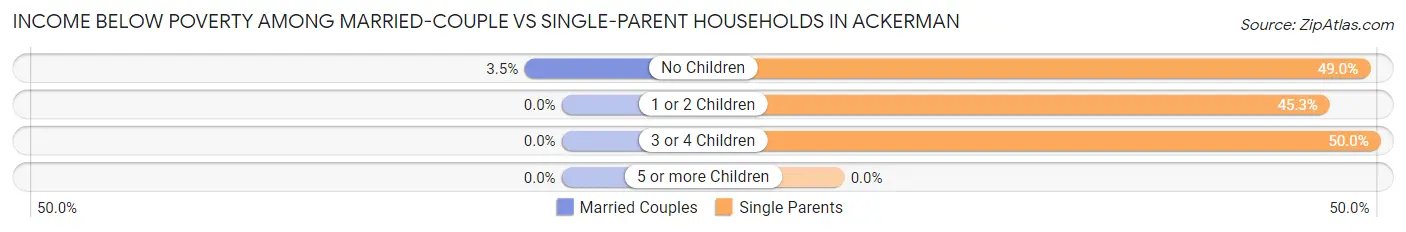
Income Below Poverty Among Married-Couple vs Single-Parent Households in Ackerman
The poverty data for Ackerman shows that 3 of the married-couple family households (1.2%) and 103 of the single-parent households (46.8%) are living below the poverty level. Within the married-couple family households, those with no children have the highest poverty rate, with 3 households (3.5%) falling below the poverty line. Among the single-parent households, those with 3 or 4 children have the highest poverty rate, with 16 household (50.0%) living below poverty.
| Children | Married-Couple Families | Single-Parent Households |
| No Children | 3 (3.5%) | 25 (49.0%) |
| 1 or 2 Children | 0 (0.0%) | 62 (45.3%) |
| 3 or 4 Children | 0 (0.0%) | 16 (50.0%) |
| 5 or more Children | 0 (0.0%) | 0 (0.0%) |
| Total | 3 (1.2%) | 103 (46.8%) |
Employment Characteristics in Ackerman
Employment by Class of Employer in Ackerman
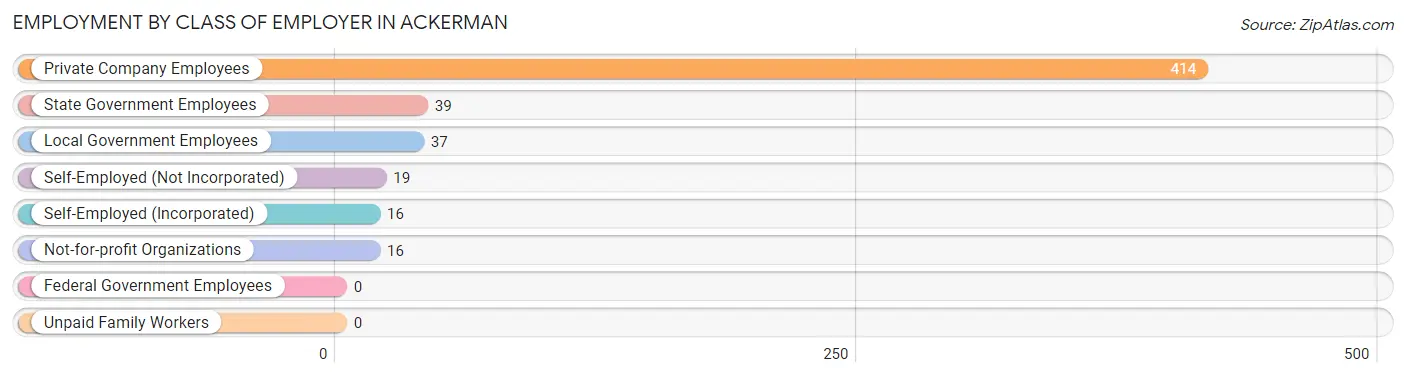
Among the 541 employed individuals in Ackerman, private company employees (414 | 76.5%), state government employees (39 | 7.2%), and local government employees (37 | 6.8%) make up the most common classes of employment.
| Employer Class | # Employees | % Employees |
| Private Company Employees | 414 | 76.5% |
| Self-Employed (Incorporated) | 16 | 3.0% |
| Self-Employed (Not Incorporated) | 19 | 3.5% |
| Not-for-profit Organizations | 16 | 3.0% |
| Local Government Employees | 37 | 6.8% |
| State Government Employees | 39 | 7.2% |
| Federal Government Employees | 0 | 0.0% |
| Unpaid Family Workers | 0 | 0.0% |
| Total | 541 | 100.0% |
Employment Status by Age in Ackerman
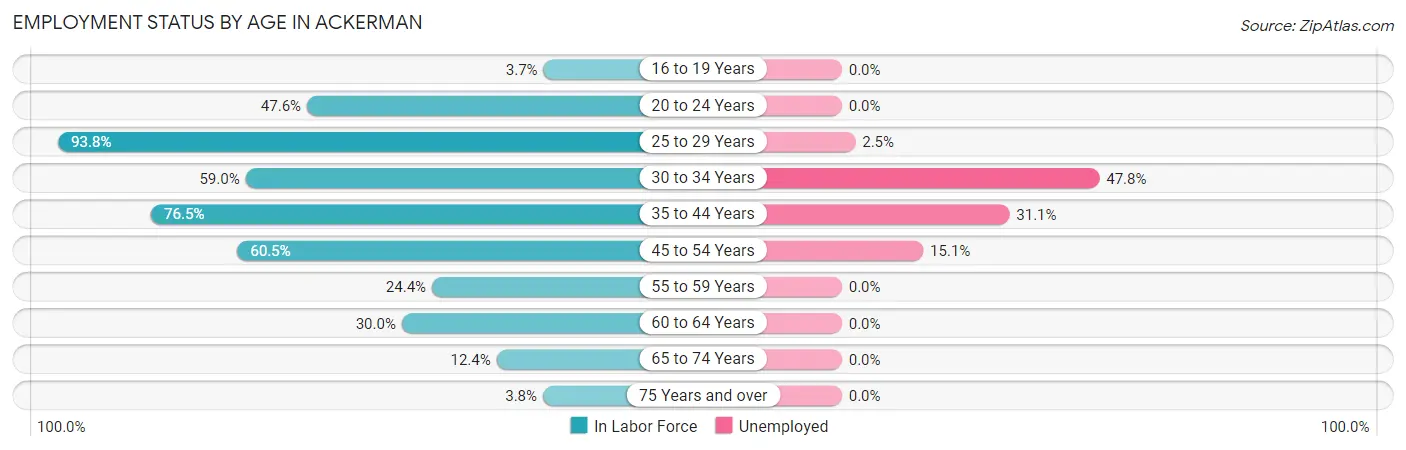
According to the labor force statistics for Ackerman, out of the total population over 16 years of age (1,373), 48.1% or 660 individuals are in the labor force, with 18.0% or 119 of them unemployed. The age group with the highest labor force participation rate is 25 to 29 years, with 93.8% or 121 individuals in the labor force. Within the labor force, the 30 to 34 years age range has the highest percentage of unemployed individuals, with 47.8% or 22 of them being unemployed.
| Age Bracket | In Labor Force | Unemployed |
| 16 to 19 Years | 4 (3.7%) | 0 (0.0%) |
| 20 to 24 Years | 39 (47.6%) | 0 (0.0%) |
| 25 to 29 Years | 121 (93.8%) | 3 (2.5%) |
| 30 to 34 Years | 46 (59.0%) | 22 (47.8%) |
| 35 to 44 Years | 225 (76.5%) | 70 (31.1%) |
| 45 to 54 Years | 159 (60.5%) | 24 (15.1%) |
| 55 to 59 Years | 19 (24.4%) | 0 (0.0%) |
| 60 to 64 Years | 27 (30.0%) | 0 (0.0%) |
| 65 to 74 Years | 15 (12.4%) | 0 (0.0%) |
| 75 Years and over | 5 (3.8%) | 0 (0.0%) |
| Total | 660 (48.1%) | 119 (18.0%) |
Employment Status by Educational Attainment in Ackerman
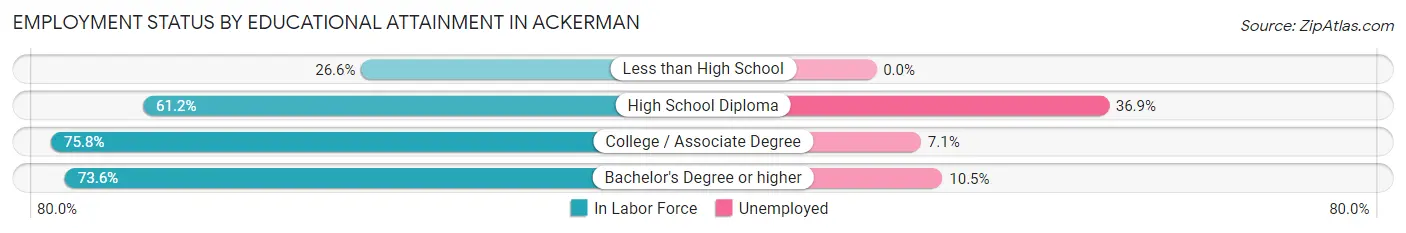
According to labor force statistics for Ackerman, 64.1% of individuals (597) out of the total population between 25 and 64 years of age (932) are in the labor force, with 19.9% or 119 of them being unemployed. The group with the highest labor force participation rate are those with the educational attainment of college / associate degree, with 75.8% or 225 individuals in the labor force. Within the labor force, individuals with high school diploma education have the highest percentage of unemployment, with 36.9% or 93 of them being unemployed.
| Educational Attainment | In Labor Force | Unemployed |
| Less than High School | 25 (26.6%) | 0 (0.0%) |
| High School Diploma | 252 (61.2%) | 152 (36.9%) |
| College / Associate Degree | 225 (75.8%) | 21 (7.1%) |
| Bachelor's Degree or higher | 95 (73.6%) | 14 (10.5%) |
| Total | 597 (64.1%) | 185 (19.9%) |
Employment Occupations by Sex in Ackerman
Management, Business, Science and Arts Occupations
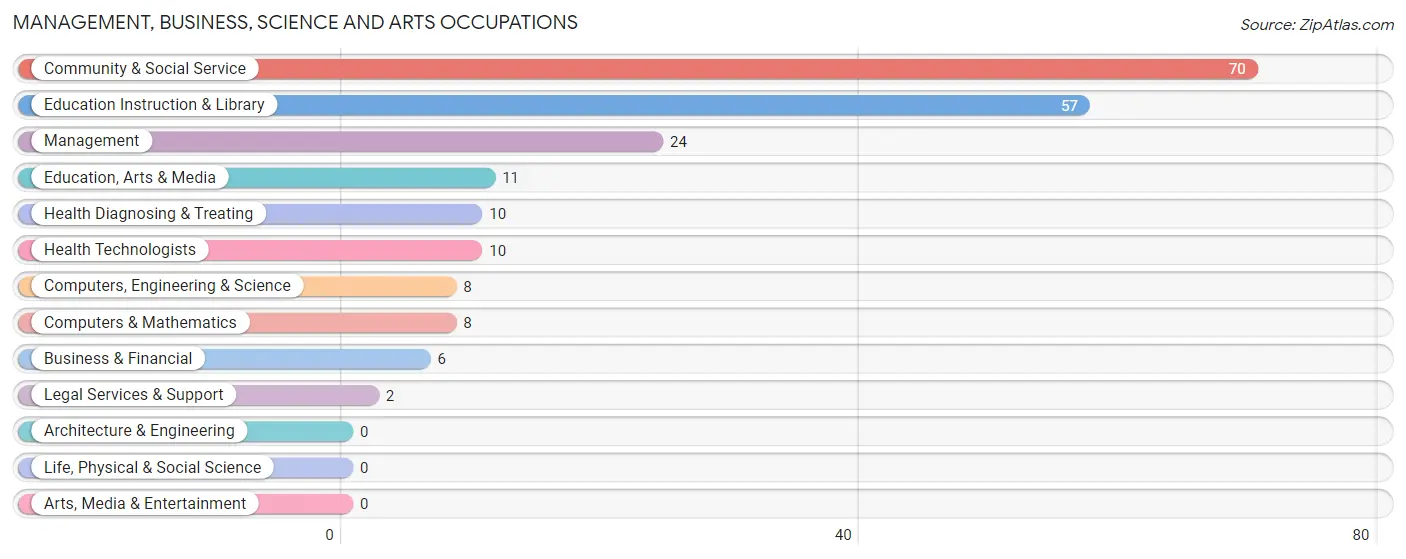
The most common Management, Business, Science and Arts occupations in Ackerman are Community & Social Service (70 | 12.9%), Education Instruction & Library (57 | 10.5%), Management (24 | 4.4%), Education, Arts & Media (11 | 2.0%), and Health Diagnosing & Treating (10 | 1.8%).
Management, Business, Science and Arts Occupations by Sex
Within the Management, Business, Science and Arts occupations in Ackerman, the most male-oriented occupations are Computers, Engineering & Science (100.0%), Computers & Mathematics (100.0%), and Education, Arts & Media (100.0%), while the most female-oriented occupations are Legal Services & Support (100.0%), Education Instruction & Library (91.2%), and Health Diagnosing & Treating (90.0%).
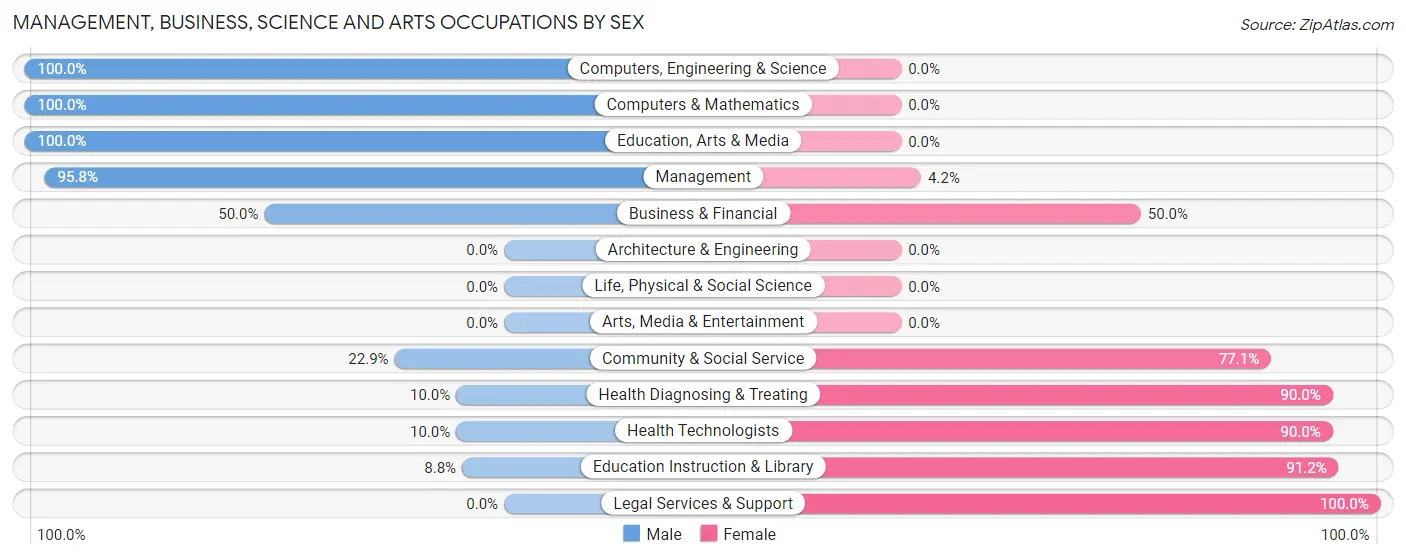
| Occupation | Male | Female |
| Management | 23 (95.8%) | 1 (4.2%) |
| Business & Financial | 3 (50.0%) | 3 (50.0%) |
| Computers, Engineering & Science | 8 (100.0%) | 0 (0.0%) |
| Computers & Mathematics | 8 (100.0%) | 0 (0.0%) |
| Architecture & Engineering | 0 (0.0%) | 0 (0.0%) |
| Life, Physical & Social Science | 0 (0.0%) | 0 (0.0%) |
| Community & Social Service | 16 (22.9%) | 54 (77.1%) |
| Education, Arts & Media | 11 (100.0%) | 0 (0.0%) |
| Legal Services & Support | 0 (0.0%) | 2 (100.0%) |
| Education Instruction & Library | 5 (8.8%) | 52 (91.2%) |
| Arts, Media & Entertainment | 0 (0.0%) | 0 (0.0%) |
| Health Diagnosing & Treating | 1 (10.0%) | 9 (90.0%) |
| Health Technologists | 1 (10.0%) | 9 (90.0%) |
| Total (Category) | 51 (43.2%) | 67 (56.8%) |
| Total (Overall) | 274 (50.6%) | 267 (49.3%) |
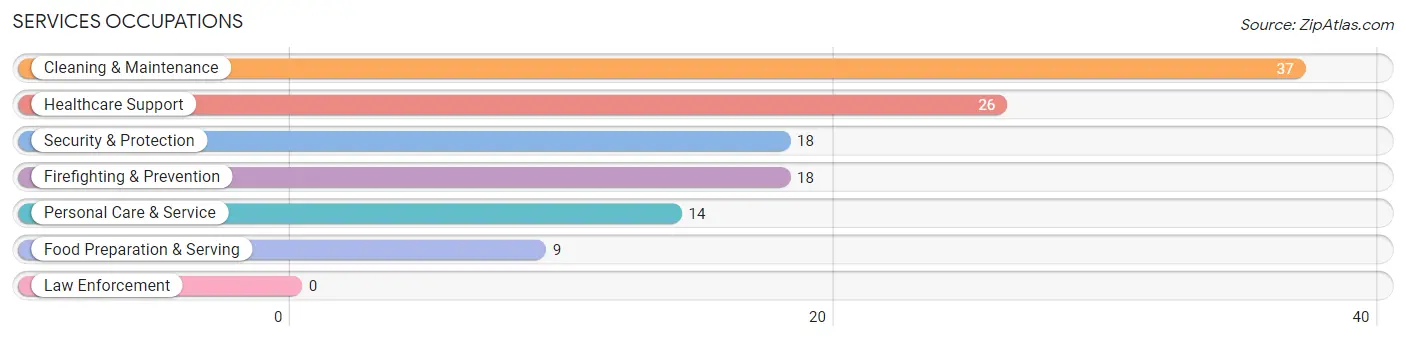
Services Occupations
The most common Services occupations in Ackerman are Cleaning & Maintenance (37 | 6.8%), Healthcare Support (26 | 4.8%), Security & Protection (18 | 3.3%), Firefighting & Prevention (18 | 3.3%), and Personal Care & Service (14 | 2.6%).
Services Occupations by Sex
Within the Services occupations in Ackerman, the most male-oriented occupations are Cleaning & Maintenance (48.6%), and Personal Care & Service (42.9%), while the most female-oriented occupations are Healthcare Support (100.0%), Security & Protection (100.0%), and Firefighting & Prevention (100.0%).
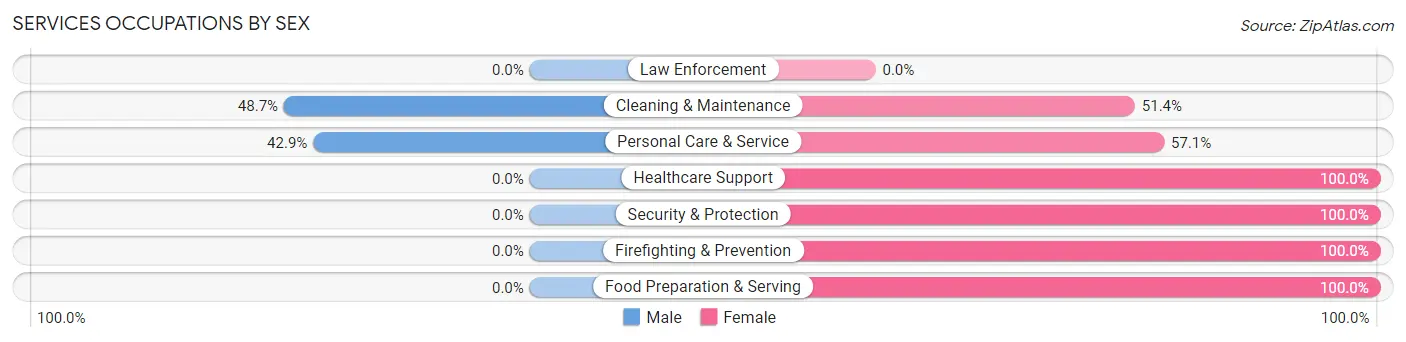
| Occupation | Male | Female |
| Healthcare Support | 0 (0.0%) | 26 (100.0%) |
| Security & Protection | 0 (0.0%) | 18 (100.0%) |
| Firefighting & Prevention | 0 (0.0%) | 18 (100.0%) |
| Law Enforcement | 0 (0.0%) | 0 (0.0%) |
| Food Preparation & Serving | 0 (0.0%) | 9 (100.0%) |
| Cleaning & Maintenance | 18 (48.6%) | 19 (51.3%) |
| Personal Care & Service | 6 (42.9%) | 8 (57.1%) |
| Total (Category) | 24 (23.1%) | 80 (76.9%) |
| Total (Overall) | 274 (50.6%) | 267 (49.3%) |
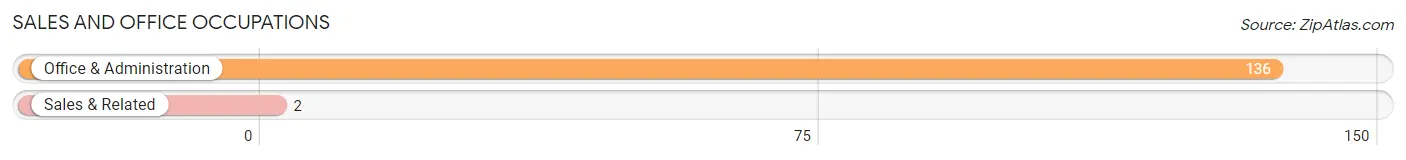
Sales and Office Occupations
The most common Sales and Office occupations in Ackerman are Office & Administration (136 | 25.1%), and Sales & Related (2 | 0.4%).
Sales and Office Occupations by Sex
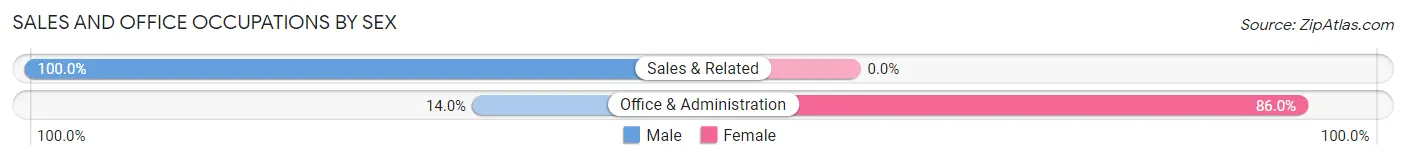
| Occupation | Male | Female |
| Sales & Related | 2 (100.0%) | 0 (0.0%) |
| Office & Administration | 19 (14.0%) | 117 (86.0%) |
| Total (Category) | 21 (15.2%) | 117 (84.8%) |
| Total (Overall) | 274 (50.6%) | 267 (49.3%) |
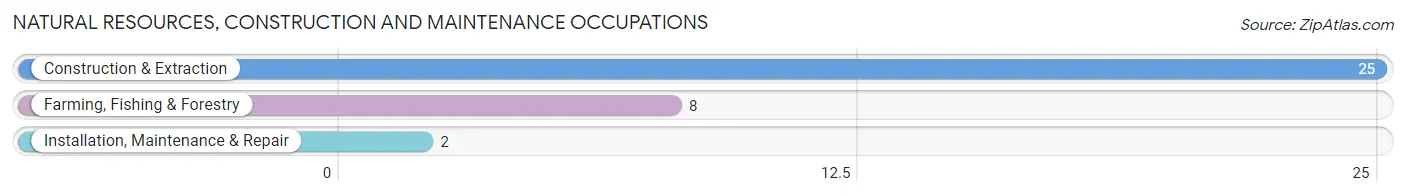
Natural Resources, Construction and Maintenance Occupations
The most common Natural Resources, Construction and Maintenance occupations in Ackerman are Construction & Extraction (25 | 4.6%), Farming, Fishing & Forestry (8 | 1.5%), and Installation, Maintenance & Repair (2 | 0.4%).
Natural Resources, Construction and Maintenance Occupations by Sex
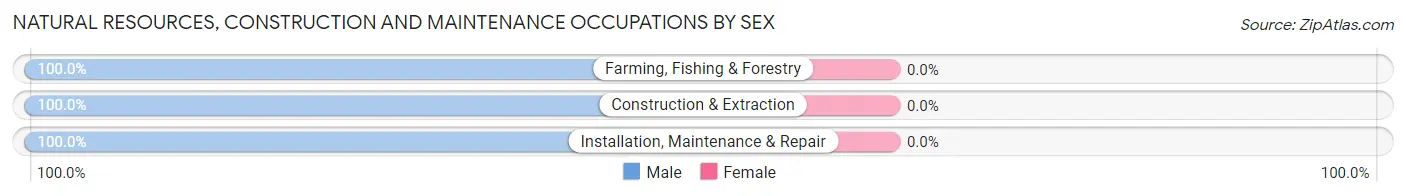
| Occupation | Male | Female |
| Farming, Fishing & Forestry | 8 (100.0%) | 0 (0.0%) |
| Construction & Extraction | 25 (100.0%) | 0 (0.0%) |
| Installation, Maintenance & Repair | 2 (100.0%) | 0 (0.0%) |
| Total (Category) | 35 (100.0%) | 0 (0.0%) |
| Total (Overall) | 274 (50.6%) | 267 (49.3%) |
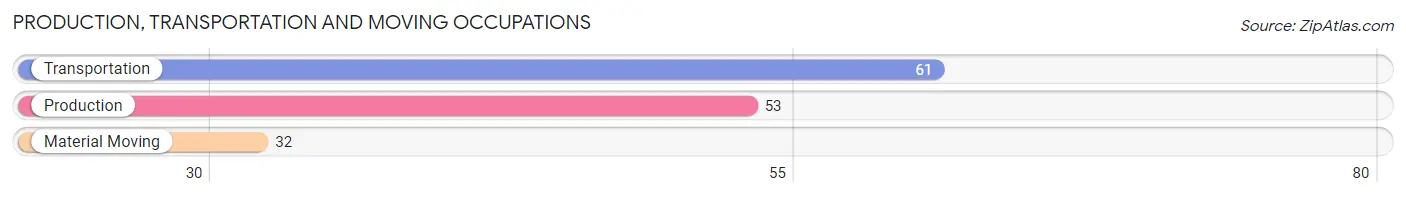
Production, Transportation and Moving Occupations
The most common Production, Transportation and Moving occupations in Ackerman are Transportation (61 | 11.3%), Production (53 | 9.8%), and Material Moving (32 | 5.9%).
Production, Transportation and Moving Occupations by Sex
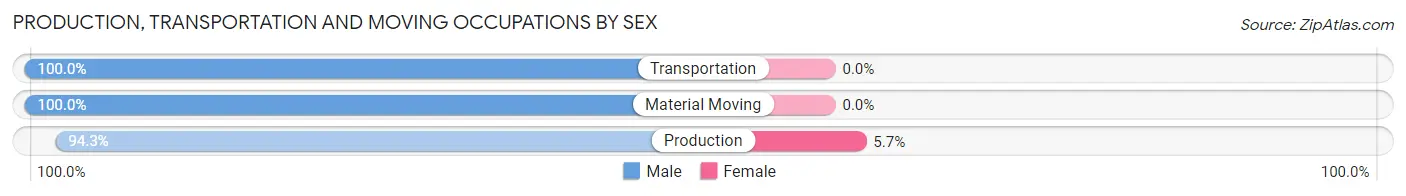
| Occupation | Male | Female |
| Production | 50 (94.3%) | 3 (5.7%) |
| Transportation | 61 (100.0%) | 0 (0.0%) |
| Material Moving | 32 (100.0%) | 0 (0.0%) |
| Total (Category) | 143 (98.0%) | 3 (2.1%) |
| Total (Overall) | 274 (50.6%) | 267 (49.3%) |
Employment Industries by Sex in Ackerman
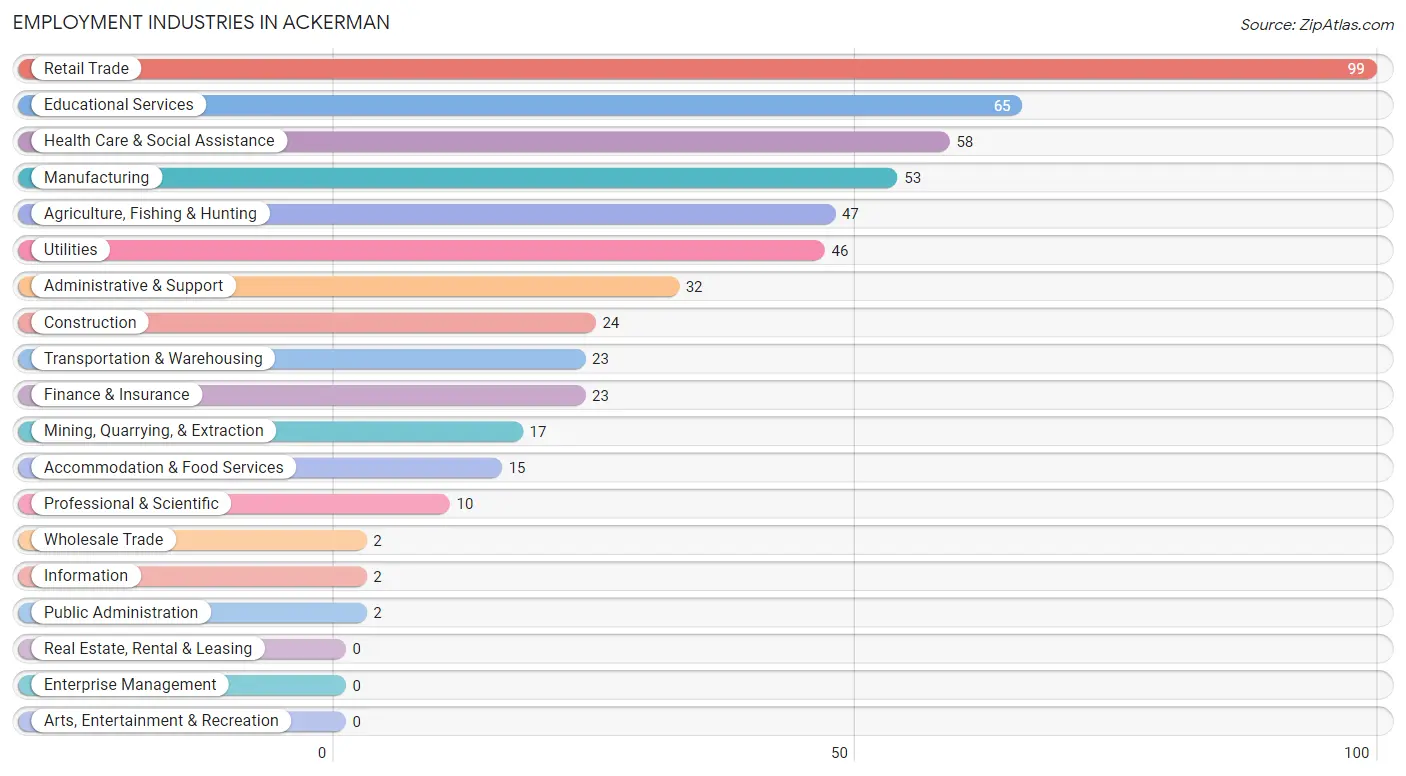
Employment Industries in Ackerman
The major employment industries in Ackerman include Retail Trade (99 | 18.3%), Educational Services (65 | 12.0%), Health Care & Social Assistance (58 | 10.7%), Manufacturing (53 | 9.8%), and Agriculture, Fishing & Hunting (47 | 8.7%).
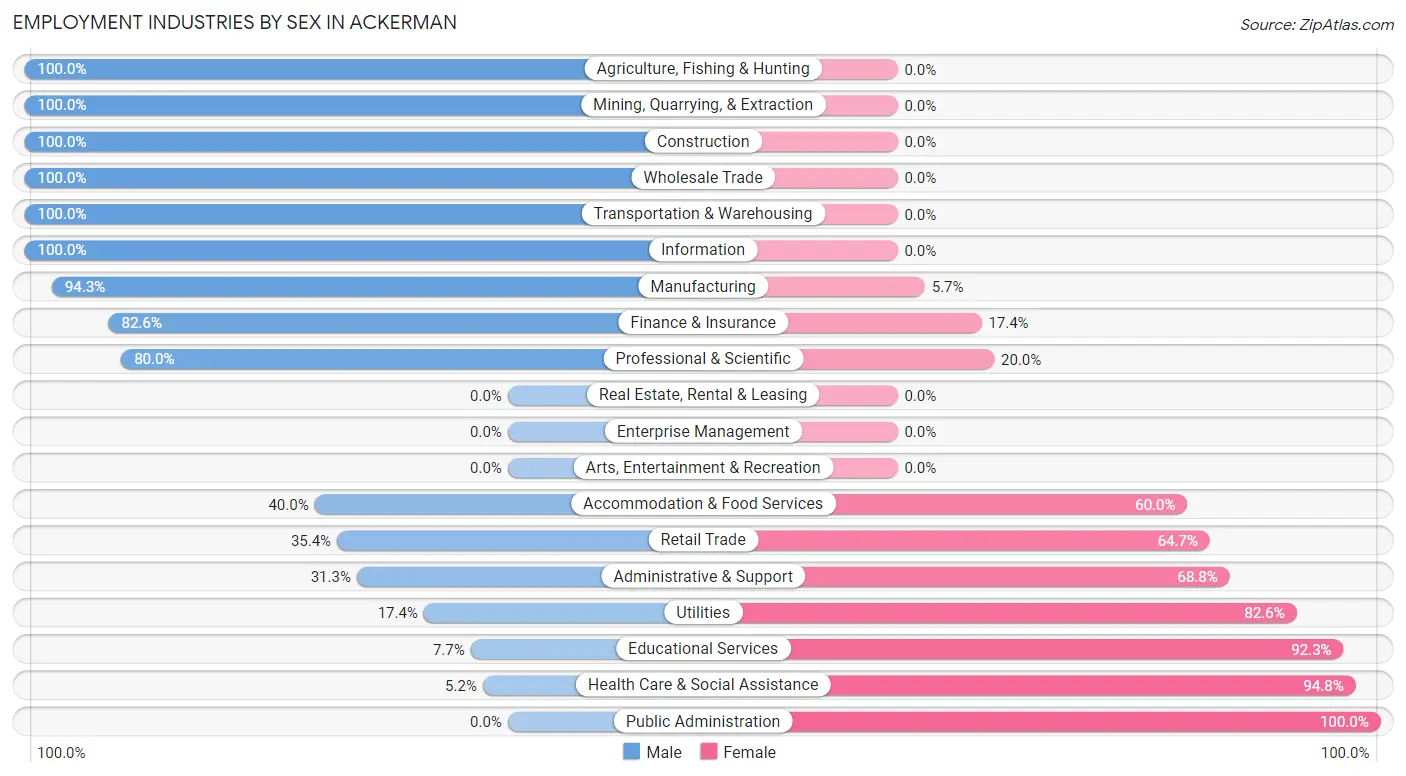
Employment Industries by Sex in Ackerman
The Ackerman industries that see more men than women are Agriculture, Fishing & Hunting (100.0%), Mining, Quarrying, & Extraction (100.0%), and Construction (100.0%), whereas the industries that tend to have a higher number of women are Public Administration (100.0%), Health Care & Social Assistance (94.8%), and Educational Services (92.3%).
| Industry | Male | Female |
| Agriculture, Fishing & Hunting | 47 (100.0%) | 0 (0.0%) |
| Mining, Quarrying, & Extraction | 17 (100.0%) | 0 (0.0%) |
| Construction | 24 (100.0%) | 0 (0.0%) |
| Manufacturing | 50 (94.3%) | 3 (5.7%) |
| Wholesale Trade | 2 (100.0%) | 0 (0.0%) |
| Retail Trade | 35 (35.3%) | 64 (64.6%) |
| Transportation & Warehousing | 23 (100.0%) | 0 (0.0%) |
| Utilities | 8 (17.4%) | 38 (82.6%) |
| Information | 2 (100.0%) | 0 (0.0%) |
| Finance & Insurance | 19 (82.6%) | 4 (17.4%) |
| Real Estate, Rental & Leasing | 0 (0.0%) | 0 (0.0%) |
| Professional & Scientific | 8 (80.0%) | 2 (20.0%) |
| Enterprise Management | 0 (0.0%) | 0 (0.0%) |
| Administrative & Support | 10 (31.2%) | 22 (68.8%) |
| Educational Services | 5 (7.7%) | 60 (92.3%) |
| Health Care & Social Assistance | 3 (5.2%) | 55 (94.8%) |
| Arts, Entertainment & Recreation | 0 (0.0%) | 0 (0.0%) |
| Accommodation & Food Services | 6 (40.0%) | 9 (60.0%) |
| Public Administration | 0 (0.0%) | 2 (100.0%) |
| Total | 274 (50.6%) | 267 (49.3%) |
Education in Ackerman
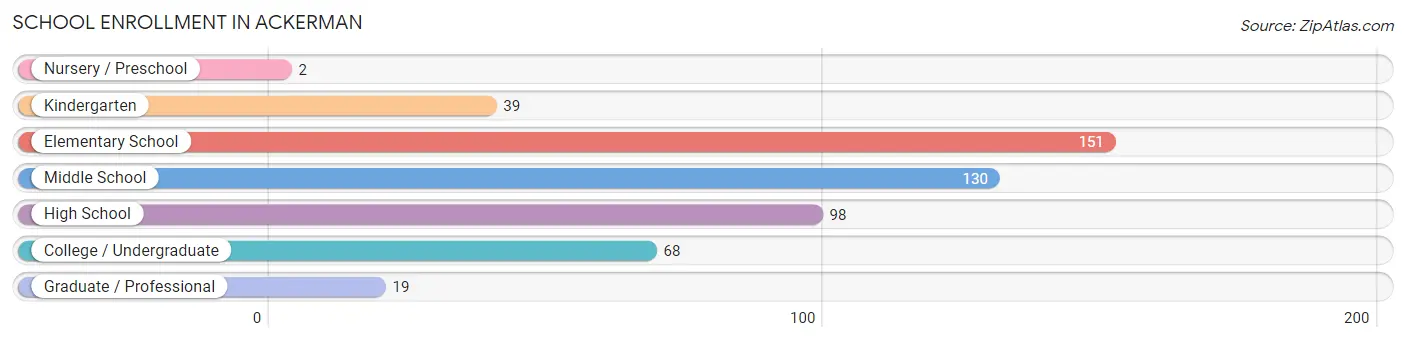
School Enrollment in Ackerman
The most common levels of schooling among the 507 students in Ackerman are elementary school (151 | 29.8%), middle school (130 | 25.6%), and high school (98 | 19.3%).
| School Level | # Students | % Students |
| Nursery / Preschool | 2 | 0.4% |
| Kindergarten | 39 | 7.7% |
| Elementary School | 151 | 29.8% |
| Middle School | 130 | 25.6% |
| High School | 98 | 19.3% |
| College / Undergraduate | 68 | 13.4% |
| Graduate / Professional | 19 | 3.7% |
| Total | 507 | 100.0% |
School Enrollment by Age by Funding Source in Ackerman
Out of a total of 507 students who are enrolled in schools in Ackerman, 36 (7.1%) attend a private institution, while the remaining 471 (92.9%) are enrolled in public schools. The age group of 35 years and over has the highest likelihood of being enrolled in private schools, with 9 (47.4% in the age bracket) enrolled. Conversely, the age group of 18 to 19 year olds has the lowest likelihood of being enrolled in a private school, with 19 (100.0% in the age bracket) attending a public institution.
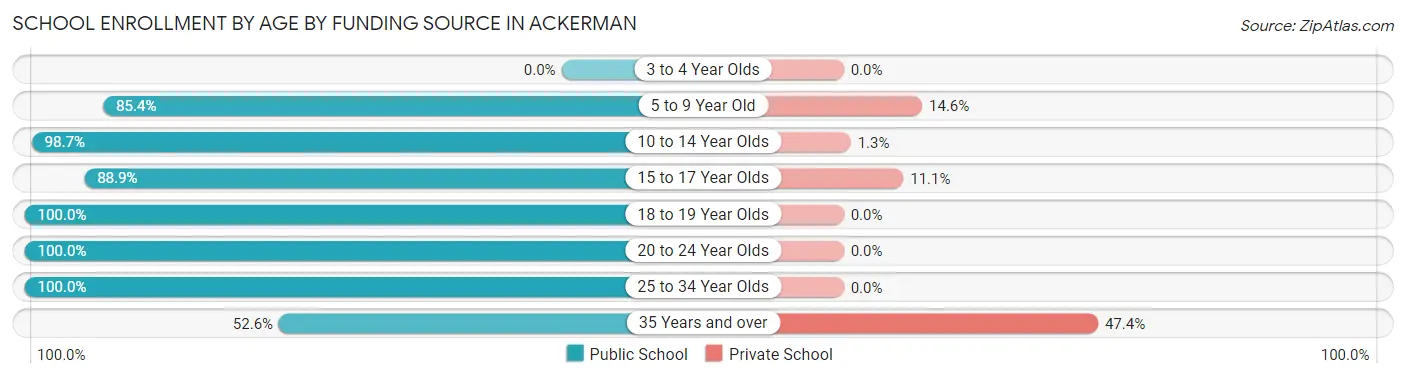
| Age Bracket | Public School | Private School |
| 3 to 4 Year Olds | 0 (0.0%) | 0 (0.0%) |
| 5 to 9 Year Old | 76 (85.4%) | 13 (14.6%) |
| 10 to 14 Year Olds | 225 (98.7%) | 3 (1.3%) |
| 15 to 17 Year Olds | 88 (88.9%) | 11 (11.1%) |
| 18 to 19 Year Olds | 19 (100.0%) | 0 (0.0%) |
| 20 to 24 Year Olds | 7 (100.0%) | 0 (0.0%) |
| 25 to 34 Year Olds | 46 (100.0%) | 0 (0.0%) |
| 35 Years and over | 10 (52.6%) | 9 (47.4%) |
| Total | 471 (92.9%) | 36 (7.1%) |
Educational Attainment by Field of Study in Ackerman
Education (93 | 46.5%), liberal arts & history (25 | 12.5%), literature & languages (21 | 10.5%), arts & humanities (13 | 6.5%), and science & technology (9 | 4.5%) are the most common fields of study among 200 individuals in Ackerman who have obtained a bachelor's degree or higher.
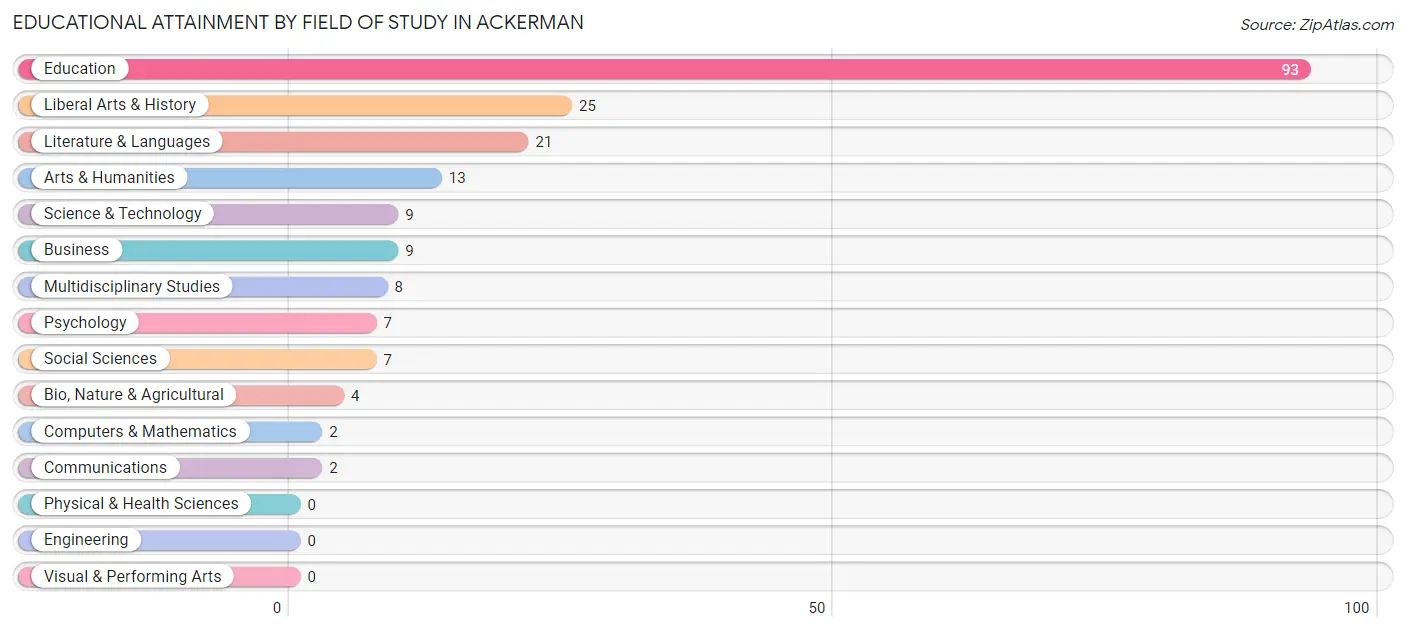
| Field of Study | # Graduates | % Graduates |
| Computers & Mathematics | 2 | 1.0% |
| Bio, Nature & Agricultural | 4 | 2.0% |
| Physical & Health Sciences | 0 | 0.0% |
| Psychology | 7 | 3.5% |
| Social Sciences | 7 | 3.5% |
| Engineering | 0 | 0.0% |
| Multidisciplinary Studies | 8 | 4.0% |
| Science & Technology | 9 | 4.5% |
| Business | 9 | 4.5% |
| Education | 93 | 46.5% |
| Literature & Languages | 21 | 10.5% |
| Liberal Arts & History | 25 | 12.5% |
| Visual & Performing Arts | 0 | 0.0% |
| Communications | 2 | 1.0% |
| Arts & Humanities | 13 | 6.5% |
| Total | 200 | 100.0% |
Transportation & Commute in Ackerman
Vehicle Availability by Sex in Ackerman
The most prevalent vehicle ownership categories in Ackerman are males with 2 vehicles (126, accounting for 46.0%) and females with 2 vehicles (116, making up 47.2%).
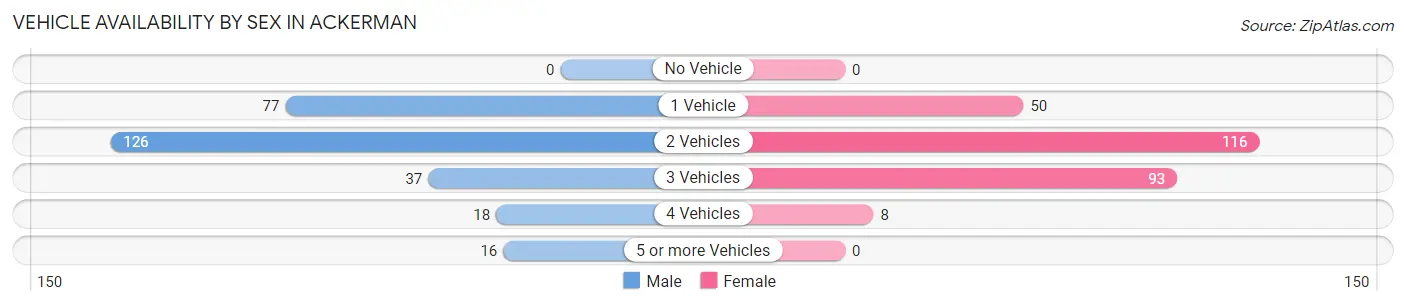
| Vehicles Available | Male | Female |
| No Vehicle | 0 (0.0%) | 0 (0.0%) |
| 1 Vehicle | 77 (28.1%) | 50 (18.7%) |
| 2 Vehicles | 126 (46.0%) | 116 (43.4%) |
| 3 Vehicles | 37 (13.5%) | 93 (34.8%) |
| 4 Vehicles | 18 (6.6%) | 8 (3.0%) |
| 5 or more Vehicles | 16 (5.8%) | 0 (0.0%) |
| Total | 274 (100.0%) | 267 (100.0%) |
Commute Time in Ackerman
The most frequently occuring commute durations in Ackerman are 30 to 34 minutes (150 commuters, 29.2%), 5 to 9 minutes (92 commuters, 17.9%), and 35 to 39 minutes (85 commuters, 16.6%).
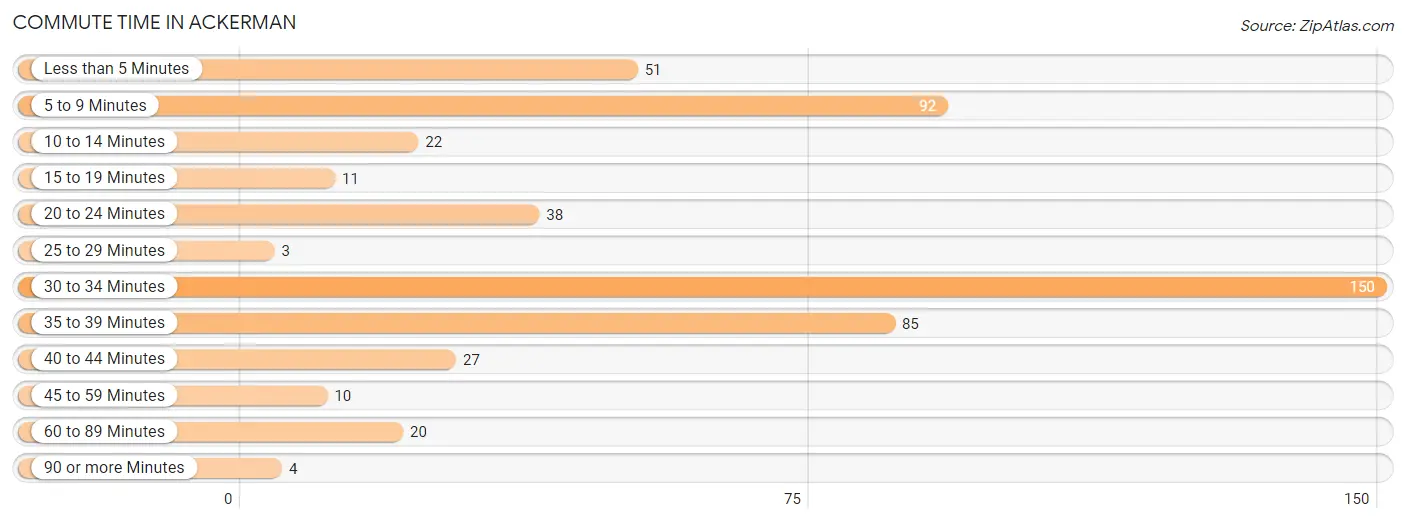
| Commute Time | # Commuters | % Commuters |
| Less than 5 Minutes | 51 | 9.9% |
| 5 to 9 Minutes | 92 | 17.9% |
| 10 to 14 Minutes | 22 | 4.3% |
| 15 to 19 Minutes | 11 | 2.1% |
| 20 to 24 Minutes | 38 | 7.4% |
| 25 to 29 Minutes | 3 | 0.6% |
| 30 to 34 Minutes | 150 | 29.2% |
| 35 to 39 Minutes | 85 | 16.6% |
| 40 to 44 Minutes | 27 | 5.3% |
| 45 to 59 Minutes | 10 | 1.9% |
| 60 to 89 Minutes | 20 | 3.9% |
| 90 or more Minutes | 4 | 0.8% |
Commute Time by Sex in Ackerman
The most common commute times in Ackerman are 5 to 9 minutes (49 commuters, 19.6%) for males and 30 to 34 minutes (125 commuters, 47.5%) for females.
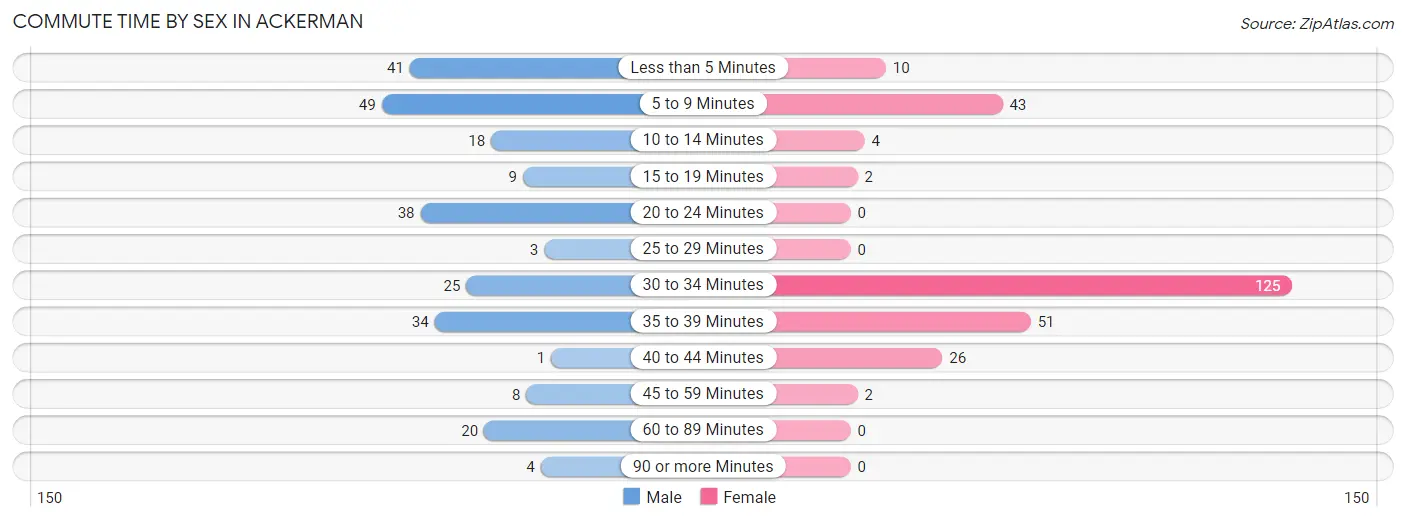
| Commute Time | Male | Female |
| Less than 5 Minutes | 41 (16.4%) | 10 (3.8%) |
| 5 to 9 Minutes | 49 (19.6%) | 43 (16.4%) |
| 10 to 14 Minutes | 18 (7.2%) | 4 (1.5%) |
| 15 to 19 Minutes | 9 (3.6%) | 2 (0.8%) |
| 20 to 24 Minutes | 38 (15.2%) | 0 (0.0%) |
| 25 to 29 Minutes | 3 (1.2%) | 0 (0.0%) |
| 30 to 34 Minutes | 25 (10.0%) | 125 (47.5%) |
| 35 to 39 Minutes | 34 (13.6%) | 51 (19.4%) |
| 40 to 44 Minutes | 1 (0.4%) | 26 (9.9%) |
| 45 to 59 Minutes | 8 (3.2%) | 2 (0.8%) |
| 60 to 89 Minutes | 20 (8.0%) | 0 (0.0%) |
| 90 or more Minutes | 4 (1.6%) | 0 (0.0%) |
Time of Departure to Work by Sex in Ackerman
The most frequent times of departure to work in Ackerman are 12:00 AM to 4:59 AM (60, 24.0%) for males and 7:00 AM to 7:29 AM (76, 28.9%) for females.
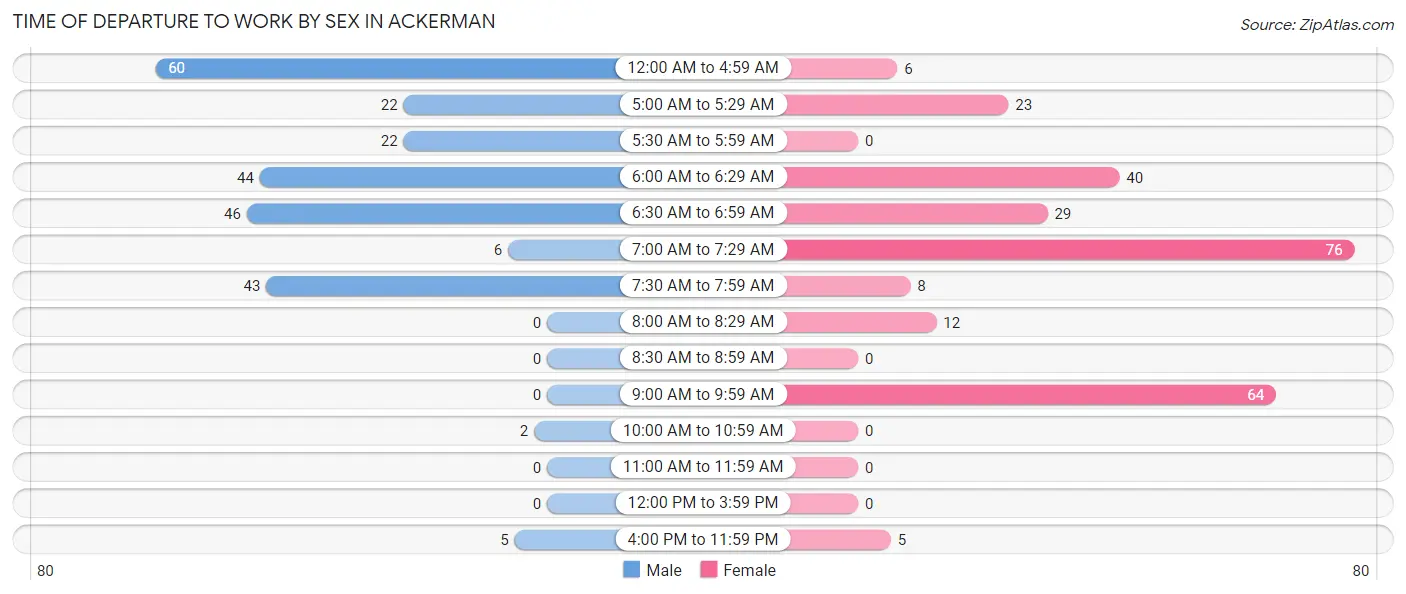
| Time of Departure | Male | Female |
| 12:00 AM to 4:59 AM | 60 (24.0%) | 6 (2.3%) |
| 5:00 AM to 5:29 AM | 22 (8.8%) | 23 (8.7%) |
| 5:30 AM to 5:59 AM | 22 (8.8%) | 0 (0.0%) |
| 6:00 AM to 6:29 AM | 44 (17.6%) | 40 (15.2%) |
| 6:30 AM to 6:59 AM | 46 (18.4%) | 29 (11.0%) |
| 7:00 AM to 7:29 AM | 6 (2.4%) | 76 (28.9%) |
| 7:30 AM to 7:59 AM | 43 (17.2%) | 8 (3.0%) |
| 8:00 AM to 8:29 AM | 0 (0.0%) | 12 (4.6%) |
| 8:30 AM to 8:59 AM | 0 (0.0%) | 0 (0.0%) |
| 9:00 AM to 9:59 AM | 0 (0.0%) | 64 (24.3%) |
| 10:00 AM to 10:59 AM | 2 (0.8%) | 0 (0.0%) |
| 11:00 AM to 11:59 AM | 0 (0.0%) | 0 (0.0%) |
| 12:00 PM to 3:59 PM | 0 (0.0%) | 0 (0.0%) |
| 4:00 PM to 11:59 PM | 5 (2.0%) | 5 (1.9%) |
| Total | 250 (100.0%) | 263 (100.0%) |
Housing Occupancy in Ackerman
Occupancy by Ownership in Ackerman
Of the total 697 dwellings in Ackerman, owner-occupied units account for 369 (52.9%), while renter-occupied units make up 328 (47.1%).
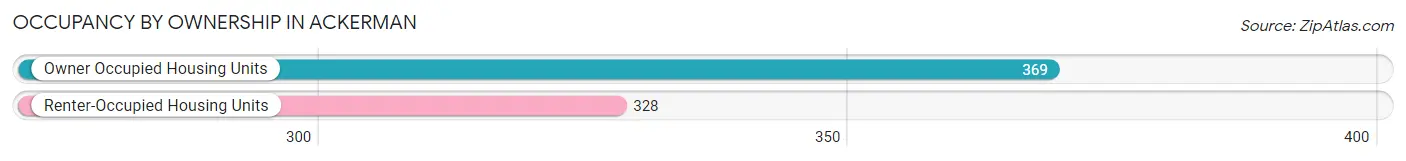
| Occupancy | # Housing Units | % Housing Units |
| Owner Occupied Housing Units | 369 | 52.9% |
| Renter-Occupied Housing Units | 328 | 47.1% |
| Total Occupied Housing Units | 697 | 100.0% |
Occupancy by Household Size in Ackerman
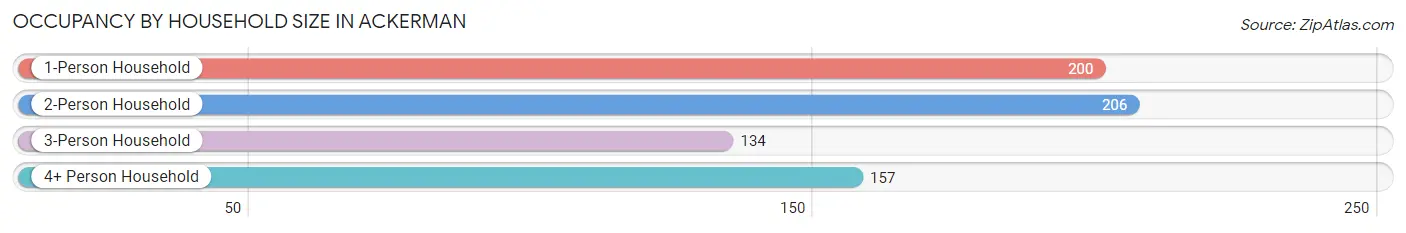
| Household Size | # Housing Units | % Housing Units |
| 1-Person Household | 200 | 28.7% |
| 2-Person Household | 206 | 29.6% |
| 3-Person Household | 134 | 19.2% |
| 4+ Person Household | 157 | 22.5% |
| Total Housing Units | 697 | 100.0% |
Occupancy by Ownership by Household Size in Ackerman
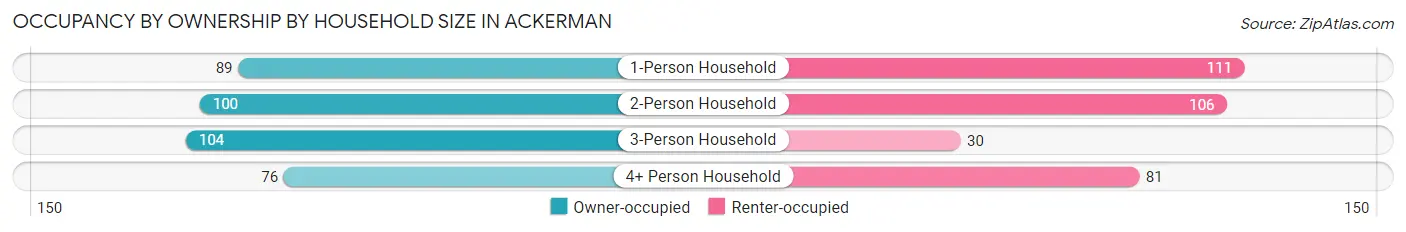
| Household Size | Owner-occupied | Renter-occupied |
| 1-Person Household | 89 (44.5%) | 111 (55.5%) |
| 2-Person Household | 100 (48.5%) | 106 (51.5%) |
| 3-Person Household | 104 (77.6%) | 30 (22.4%) |
| 4+ Person Household | 76 (48.4%) | 81 (51.6%) |
| Total Housing Units | 369 (52.9%) | 328 (47.1%) |
Occupancy by Educational Attainment in Ackerman
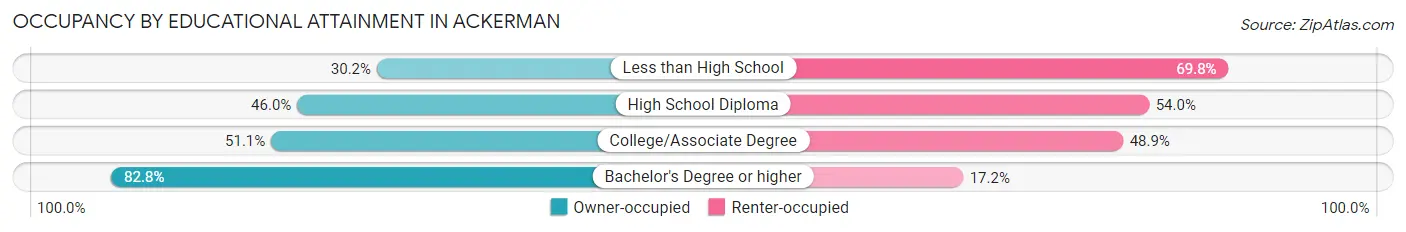
| Household Size | Owner-occupied | Renter-occupied |
| Less than High School | 19 (30.2%) | 44 (69.8%) |
| High School Diploma | 148 (46.0%) | 174 (54.0%) |
| College/Associate Degree | 91 (51.1%) | 87 (48.9%) |
| Bachelor's Degree or higher | 111 (82.8%) | 23 (17.2%) |
Occupancy by Age of Householder in Ackerman
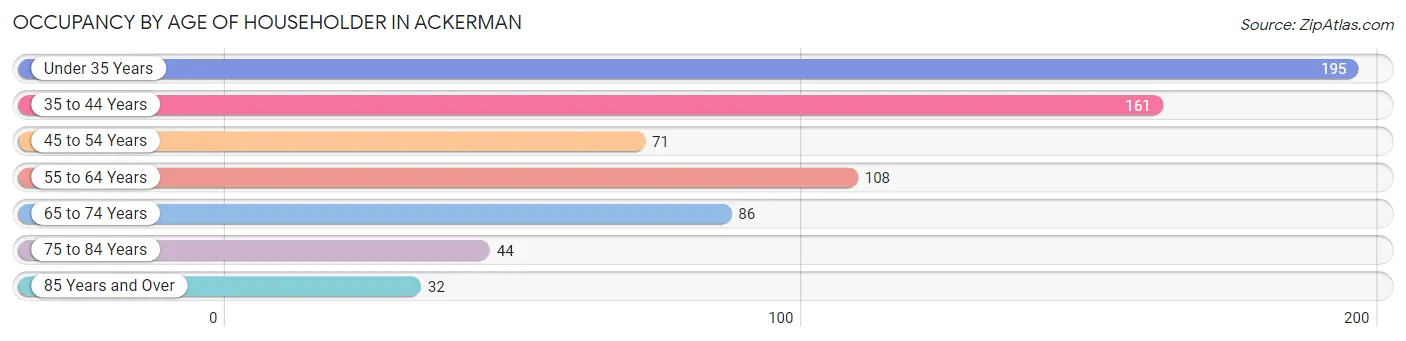
| Age Bracket | # Households | % Households |
| Under 35 Years | 195 | 28.0% |
| 35 to 44 Years | 161 | 23.1% |
| 45 to 54 Years | 71 | 10.2% |
| 55 to 64 Years | 108 | 15.5% |
| 65 to 74 Years | 86 | 12.3% |
| 75 to 84 Years | 44 | 6.3% |
| 85 Years and Over | 32 | 4.6% |
| Total | 697 | 100.0% |
Housing Finances in Ackerman
Median Income by Occupancy in Ackerman
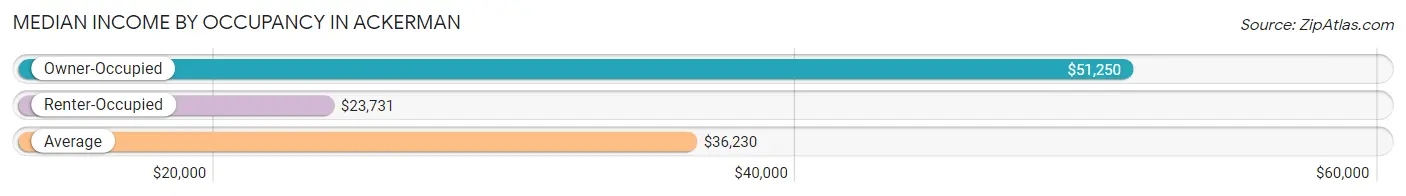
| Occupancy Type | # Households | Median Income |
| Owner-Occupied | 369 (52.9%) | $51,250 |
| Renter-Occupied | 328 (47.1%) | $23,731 |
| Average | 697 (100.0%) | $36,230 |
Occupancy by Householder Income Bracket in Ackerman
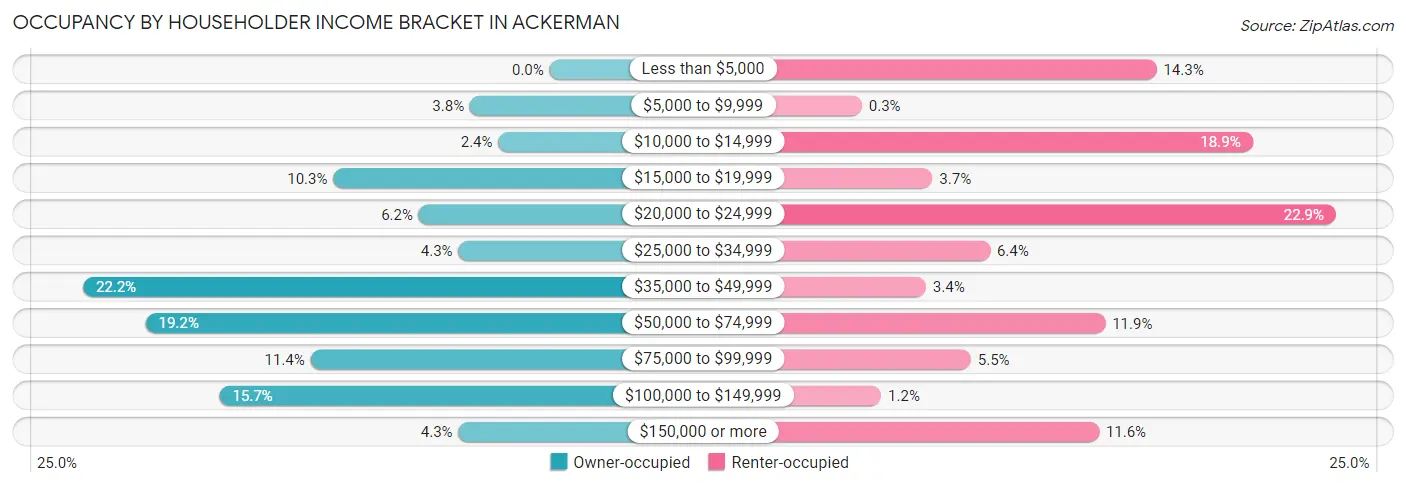
| Income Bracket | Owner-occupied | Renter-occupied |
| Less than $5,000 | 0 (0.0%) | 47 (14.3%) |
| $5,000 to $9,999 | 14 (3.8%) | 1 (0.3%) |
| $10,000 to $14,999 | 9 (2.4%) | 62 (18.9%) |
| $15,000 to $19,999 | 38 (10.3%) | 12 (3.7%) |
| $20,000 to $24,999 | 23 (6.2%) | 75 (22.9%) |
| $25,000 to $34,999 | 16 (4.3%) | 21 (6.4%) |
| $35,000 to $49,999 | 82 (22.2%) | 11 (3.4%) |
| $50,000 to $74,999 | 71 (19.2%) | 39 (11.9%) |
| $75,000 to $99,999 | 42 (11.4%) | 18 (5.5%) |
| $100,000 to $149,999 | 58 (15.7%) | 4 (1.2%) |
| $150,000 or more | 16 (4.3%) | 38 (11.6%) |
| Total | 369 (100.0%) | 328 (100.0%) |
Monthly Housing Cost Tiers in Ackerman
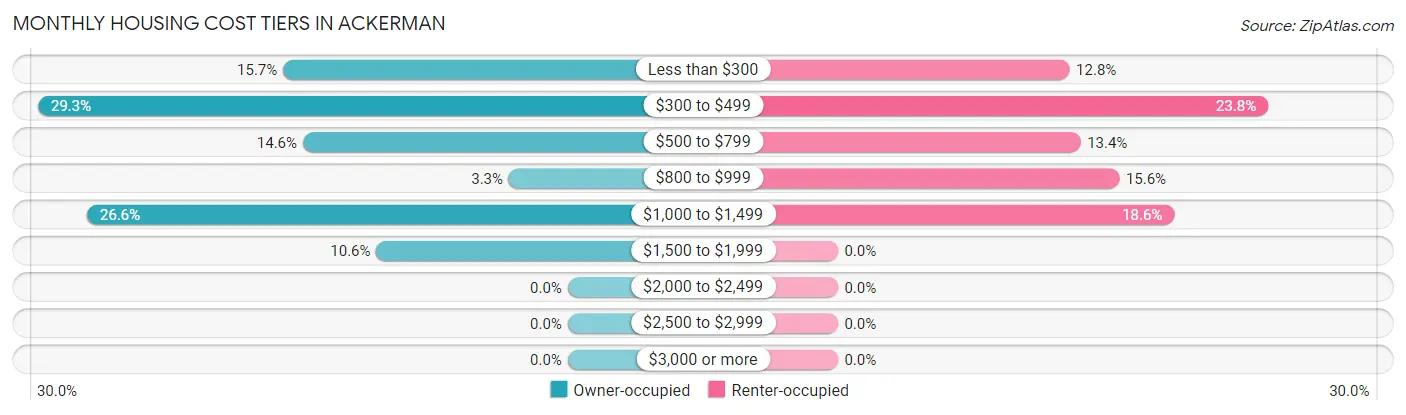
| Monthly Cost | Owner-occupied | Renter-occupied |
| Less than $300 | 58 (15.7%) | 42 (12.8%) |
| $300 to $499 | 108 (29.3%) | 78 (23.8%) |
| $500 to $799 | 54 (14.6%) | 44 (13.4%) |
| $800 to $999 | 12 (3.3%) | 51 (15.5%) |
| $1,000 to $1,499 | 98 (26.6%) | 61 (18.6%) |
| $1,500 to $1,999 | 39 (10.6%) | 0 (0.0%) |
| $2,000 to $2,499 | 0 (0.0%) | 0 (0.0%) |
| $2,500 to $2,999 | 0 (0.0%) | 0 (0.0%) |
| $3,000 or more | 0 (0.0%) | 0 (0.0%) |
| Total | 369 (100.0%) | 328 (100.0%) |
Physical Housing Characteristics in Ackerman
Housing Structures in Ackerman
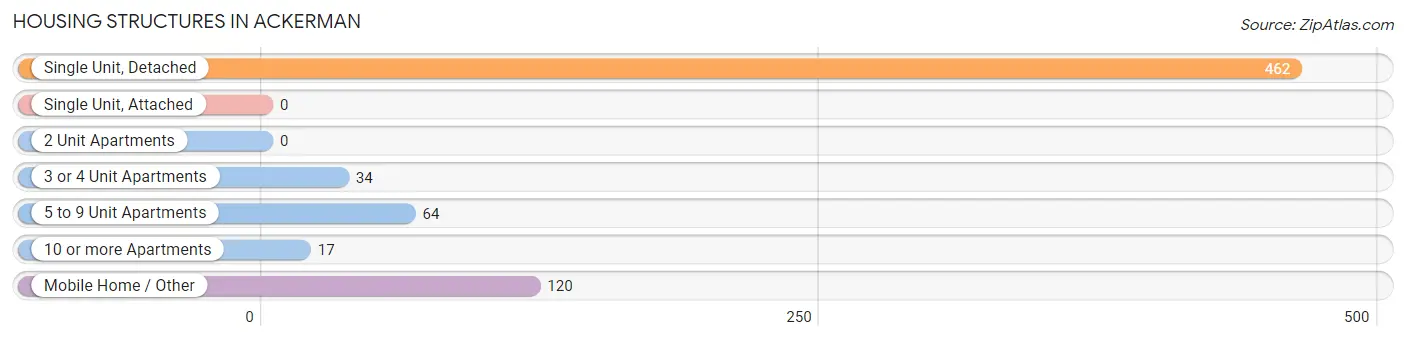
| Structure Type | # Housing Units | % Housing Units |
| Single Unit, Detached | 462 | 66.3% |
| Single Unit, Attached | 0 | 0.0% |
| 2 Unit Apartments | 0 | 0.0% |
| 3 or 4 Unit Apartments | 34 | 4.9% |
| 5 to 9 Unit Apartments | 64 | 9.2% |
| 10 or more Apartments | 17 | 2.4% |
| Mobile Home / Other | 120 | 17.2% |
| Total | 697 | 100.0% |
Housing Structures by Occupancy in Ackerman
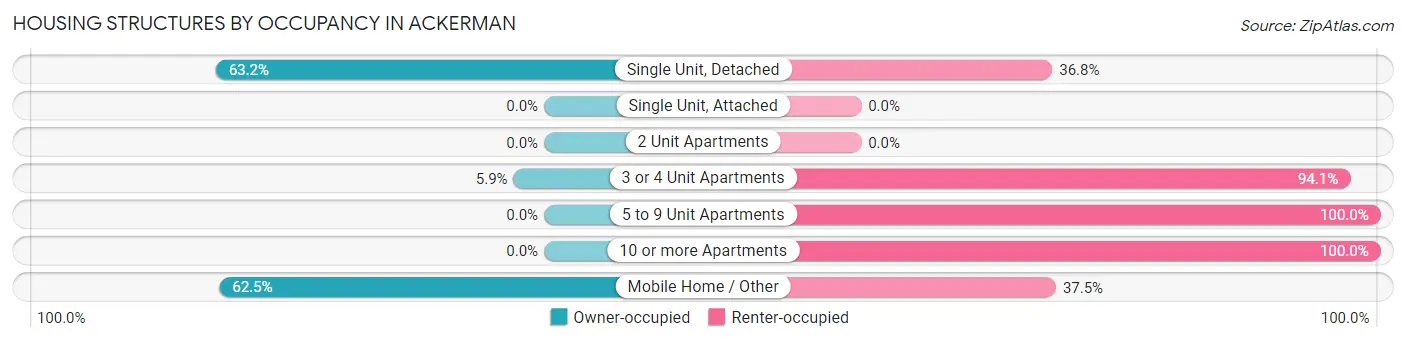
| Structure Type | Owner-occupied | Renter-occupied |
| Single Unit, Detached | 292 (63.2%) | 170 (36.8%) |
| Single Unit, Attached | 0 (0.0%) | 0 (0.0%) |
| 2 Unit Apartments | 0 (0.0%) | 0 (0.0%) |
| 3 or 4 Unit Apartments | 2 (5.9%) | 32 (94.1%) |
| 5 to 9 Unit Apartments | 0 (0.0%) | 64 (100.0%) |
| 10 or more Apartments | 0 (0.0%) | 17 (100.0%) |
| Mobile Home / Other | 75 (62.5%) | 45 (37.5%) |
| Total | 369 (52.9%) | 328 (47.1%) |
Housing Structures by Number of Rooms in Ackerman
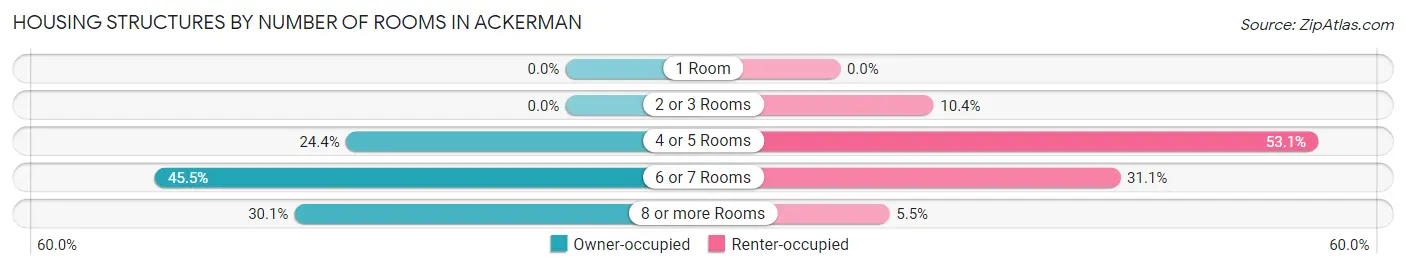
| Number of Rooms | Owner-occupied | Renter-occupied |
| 1 Room | 0 (0.0%) | 0 (0.0%) |
| 2 or 3 Rooms | 0 (0.0%) | 34 (10.4%) |
| 4 or 5 Rooms | 90 (24.4%) | 174 (53.0%) |
| 6 or 7 Rooms | 168 (45.5%) | 102 (31.1%) |
| 8 or more Rooms | 111 (30.1%) | 18 (5.5%) |
| Total | 369 (100.0%) | 328 (100.0%) |
Housing Structure by Heating Type in Ackerman
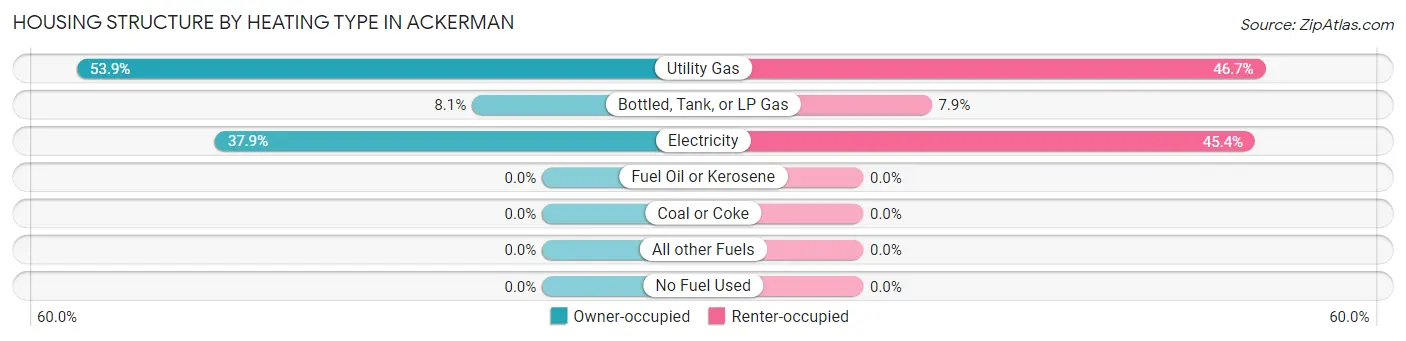
| Heating Type | Owner-occupied | Renter-occupied |
| Utility Gas | 199 (53.9%) | 153 (46.7%) |
| Bottled, Tank, or LP Gas | 30 (8.1%) | 26 (7.9%) |
| Electricity | 140 (37.9%) | 149 (45.4%) |
| Fuel Oil or Kerosene | 0 (0.0%) | 0 (0.0%) |
| Coal or Coke | 0 (0.0%) | 0 (0.0%) |
| All other Fuels | 0 (0.0%) | 0 (0.0%) |
| No Fuel Used | 0 (0.0%) | 0 (0.0%) |
| Total | 369 (100.0%) | 328 (100.0%) |
Household Vehicle Usage in Ackerman
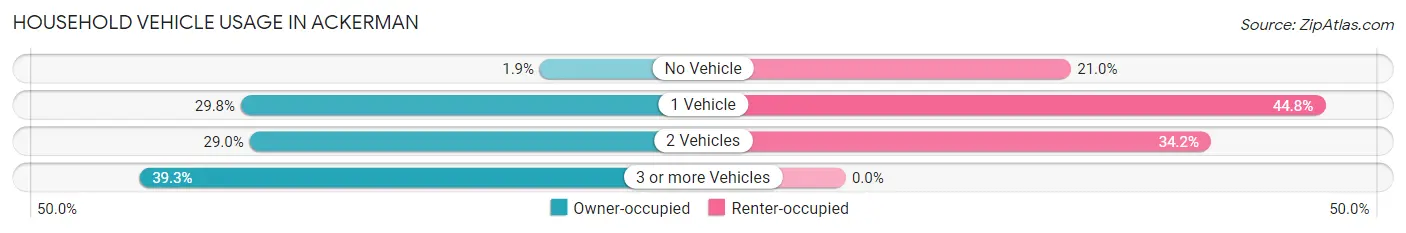
| Vehicles per Household | Owner-occupied | Renter-occupied |
| No Vehicle | 7 (1.9%) | 69 (21.0%) |
| 1 Vehicle | 110 (29.8%) | 147 (44.8%) |
| 2 Vehicles | 107 (29.0%) | 112 (34.2%) |
| 3 or more Vehicles | 145 (39.3%) | 0 (0.0%) |
| Total | 369 (100.0%) | 328 (100.0%) |
Real Estate & Mortgages in Ackerman
Real Estate and Mortgage Overview in Ackerman
| Characteristic | Without Mortgage | With Mortgage |
| Housing Units | 197 | 172 |
| Median Property Value | $91,900 | $179,200 |
| Median Household Income | $51,750 | $11 |
| Monthly Housing Costs | $347 | $0 |
| Real Estate Taxes | $383 | $16 |
Property Value by Mortgage Status in Ackerman
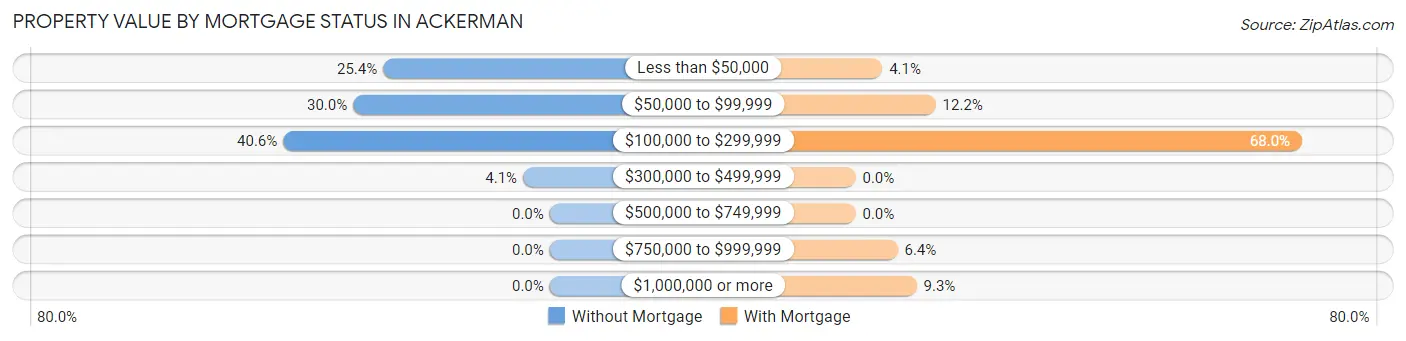
| Property Value | Without Mortgage | With Mortgage |
| Less than $50,000 | 50 (25.4%) | 7 (4.1%) |
| $50,000 to $99,999 | 59 (29.9%) | 21 (12.2%) |
| $100,000 to $299,999 | 80 (40.6%) | 117 (68.0%) |
| $300,000 to $499,999 | 8 (4.1%) | 0 (0.0%) |
| $500,000 to $749,999 | 0 (0.0%) | 0 (0.0%) |
| $750,000 to $999,999 | 0 (0.0%) | 11 (6.4%) |
| $1,000,000 or more | 0 (0.0%) | 16 (9.3%) |
| Total | 197 (100.0%) | 172 (100.0%) |
Household Income by Mortgage Status in Ackerman
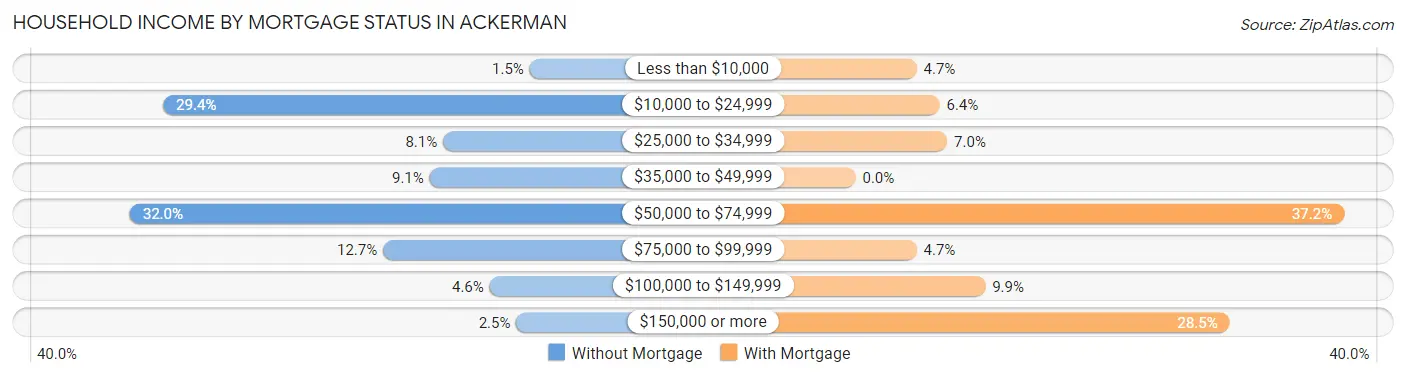
| Household Income | Without Mortgage | With Mortgage |
| Less than $10,000 | 3 (1.5%) | 8 (4.6%) |
| $10,000 to $24,999 | 58 (29.4%) | 11 (6.4%) |
| $25,000 to $34,999 | 16 (8.1%) | 12 (7.0%) |
| $35,000 to $49,999 | 18 (9.1%) | 0 (0.0%) |
| $50,000 to $74,999 | 63 (32.0%) | 64 (37.2%) |
| $75,000 to $99,999 | 25 (12.7%) | 8 (4.6%) |
| $100,000 to $149,999 | 9 (4.6%) | 17 (9.9%) |
| $150,000 or more | 5 (2.5%) | 49 (28.5%) |
| Total | 197 (100.0%) | 172 (100.0%) |
Property Value to Household Income Ratio in Ackerman
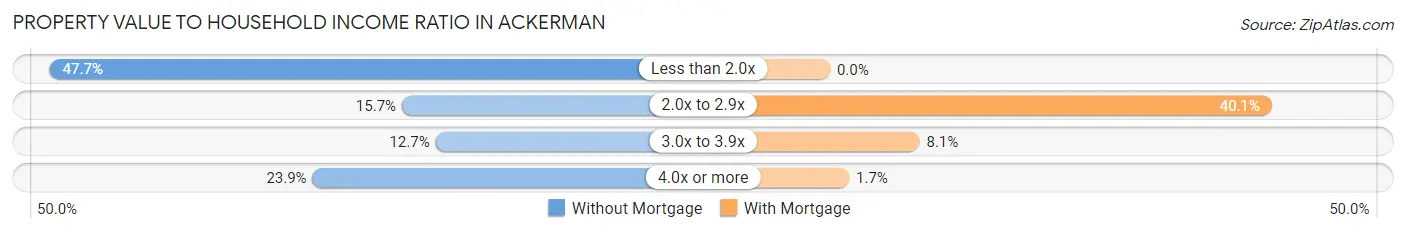
| Value-to-Income Ratio | Without Mortgage | With Mortgage |
| Less than 2.0x | 94 (47.7%) | 0 (0.0%) |
| 2.0x to 2.9x | 31 (15.7%) | 69 (40.1%) |
| 3.0x to 3.9x | 25 (12.7%) | 14 (8.1%) |
| 4.0x or more | 47 (23.9%) | 3 (1.7%) |
| Total | 197 (100.0%) | 172 (100.0%) |
Real Estate Taxes by Mortgage Status in Ackerman
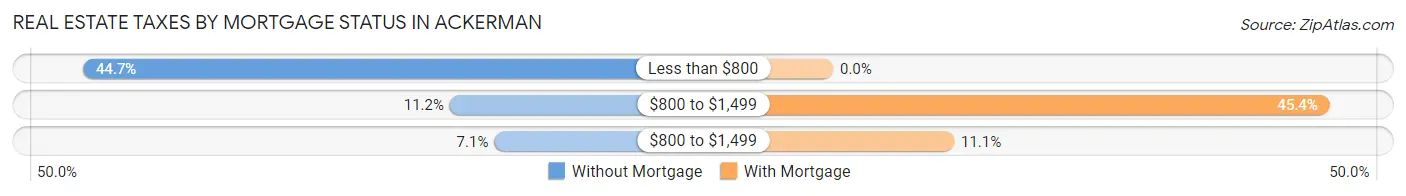
| Property Taxes | Without Mortgage | With Mortgage |
| Less than $800 | 88 (44.7%) | 0 (0.0%) |
| $800 to $1,499 | 22 (11.2%) | 78 (45.4%) |
| $800 to $1,499 | 14 (7.1%) | 19 (11.1%) |
| Total | 197 (100.0%) | 172 (100.0%) |
Health & Disability in Ackerman
Health Insurance Coverage by Age in Ackerman
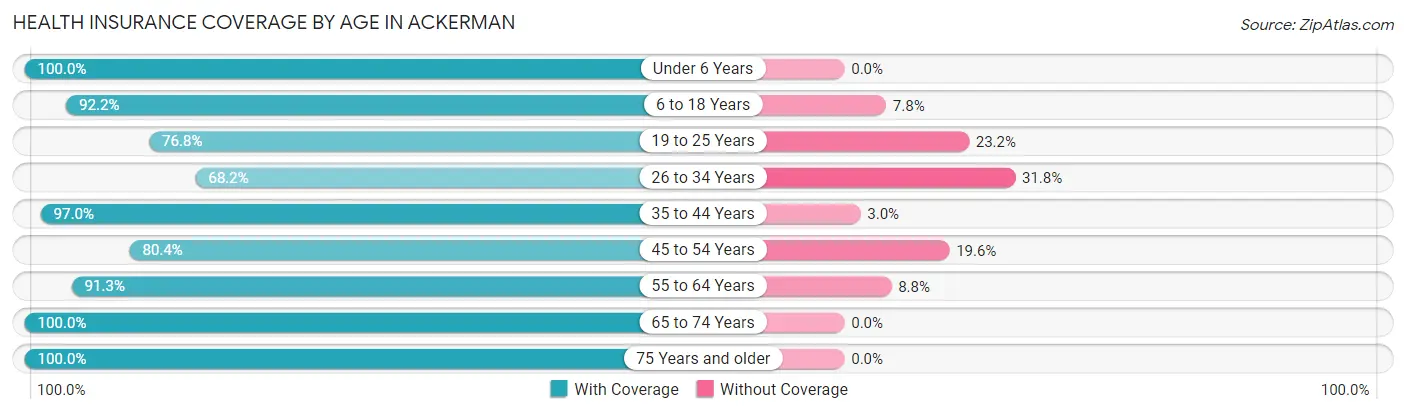
| Age Bracket | With Coverage | Without Coverage |
| Under 6 Years | 88 (100.0%) | 0 (0.0%) |
| 6 to 18 Years | 392 (92.2%) | 33 (7.8%) |
| 19 to 25 Years | 86 (76.8%) | 26 (23.2%) |
| 26 to 34 Years | 122 (68.2%) | 57 (31.8%) |
| 35 to 44 Years | 259 (97.0%) | 8 (3.0%) |
| 45 to 54 Years | 181 (80.4%) | 44 (19.6%) |
| 55 to 64 Years | 146 (91.2%) | 14 (8.7%) |
| 65 to 74 Years | 114 (100.0%) | 0 (0.0%) |
| 75 Years and older | 106 (100.0%) | 0 (0.0%) |
| Total | 1,494 (89.1%) | 182 (10.9%) |
Health Insurance Coverage by Citizenship Status in Ackerman
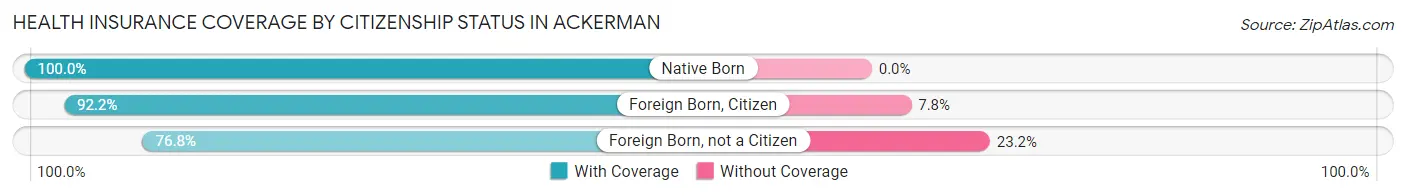
| Citizenship Status | With Coverage | Without Coverage |
| Native Born | 88 (100.0%) | 0 (0.0%) |
| Foreign Born, Citizen | 392 (92.2%) | 33 (7.8%) |
| Foreign Born, not a Citizen | 86 (76.8%) | 26 (23.2%) |
Health Insurance Coverage by Household Income in Ackerman
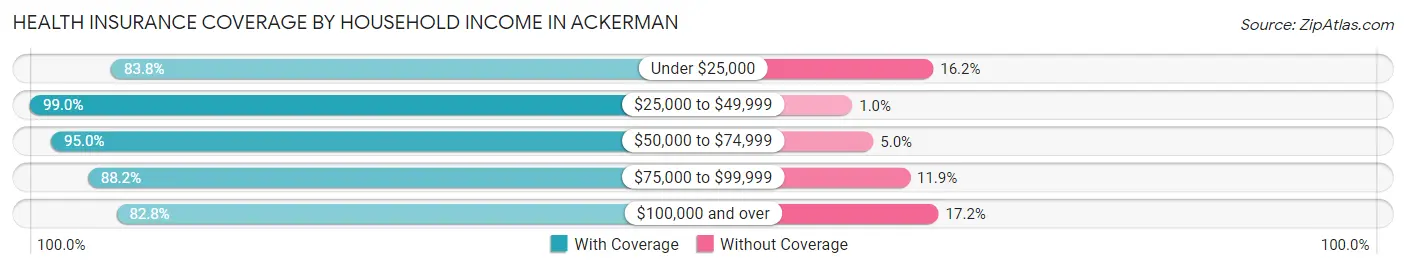
| Household Income | With Coverage | Without Coverage |
| Under $25,000 | 388 (83.8%) | 75 (16.2%) |
| $25,000 to $49,999 | 383 (99.0%) | 4 (1.0%) |
| $50,000 to $74,999 | 248 (95.0%) | 13 (5.0%) |
| $75,000 to $99,999 | 119 (88.1%) | 16 (11.8%) |
| $100,000 and over | 356 (82.8%) | 74 (17.2%) |
Public vs Private Health Insurance Coverage by Age in Ackerman
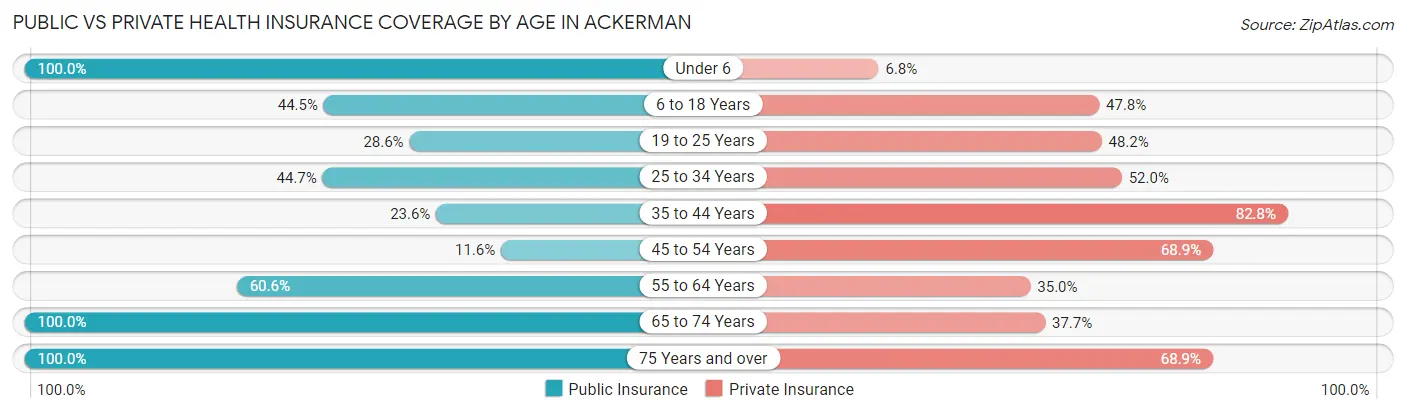
| Age Bracket | Public Insurance | Private Insurance |
| Under 6 | 88 (100.0%) | 6 (6.8%) |
| 6 to 18 Years | 189 (44.5%) | 203 (47.8%) |
| 19 to 25 Years | 32 (28.6%) | 54 (48.2%) |
| 25 to 34 Years | 80 (44.7%) | 93 (52.0%) |
| 35 to 44 Years | 63 (23.6%) | 221 (82.8%) |
| 45 to 54 Years | 26 (11.6%) | 155 (68.9%) |
| 55 to 64 Years | 97 (60.6%) | 56 (35.0%) |
| 65 to 74 Years | 114 (100.0%) | 43 (37.7%) |
| 75 Years and over | 106 (100.0%) | 73 (68.9%) |
| Total | 795 (47.4%) | 904 (53.9%) |
Disability Status by Sex by Age in Ackerman
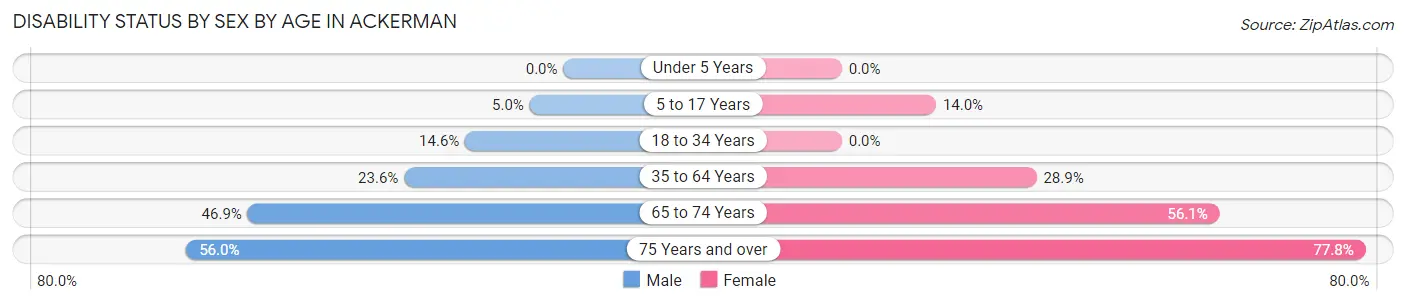
| Age Bracket | Male | Female |
| Under 5 Years | 0 (0.0%) | 0 (0.0%) |
| 5 to 17 Years | 12 (5.0%) | 26 (14.0%) |
| 18 to 34 Years | 21 (14.6%) | 0 (0.0%) |
| 35 to 64 Years | 74 (23.6%) | 98 (28.9%) |
| 65 to 74 Years | 15 (46.9%) | 46 (56.1%) |
| 75 Years and over | 14 (56.0%) | 63 (77.8%) |
Disability Class by Sex by Age in Ackerman
Disability Class: Hearing Difficulty
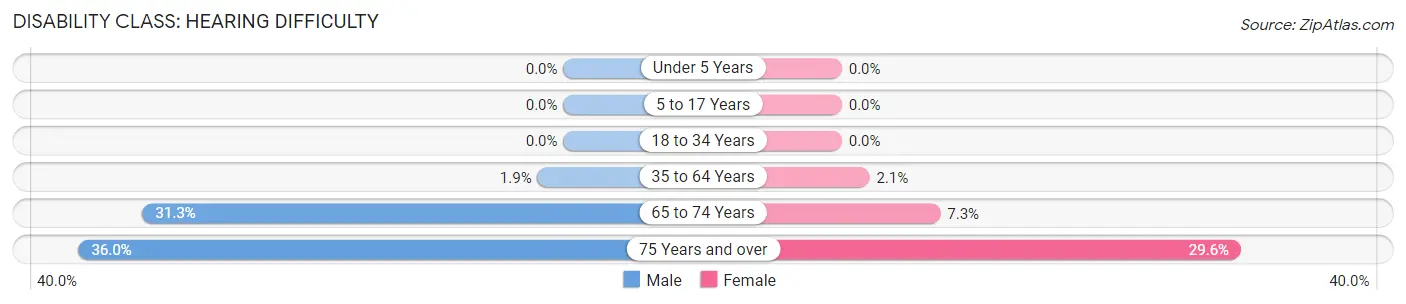
| Age Bracket | Male | Female |
| Under 5 Years | 0 (0.0%) | 0 (0.0%) |
| 5 to 17 Years | 0 (0.0%) | 0 (0.0%) |
| 18 to 34 Years | 0 (0.0%) | 0 (0.0%) |
| 35 to 64 Years | 6 (1.9%) | 7 (2.1%) |
| 65 to 74 Years | 10 (31.2%) | 6 (7.3%) |
| 75 Years and over | 9 (36.0%) | 24 (29.6%) |
Disability Class: Vision Difficulty
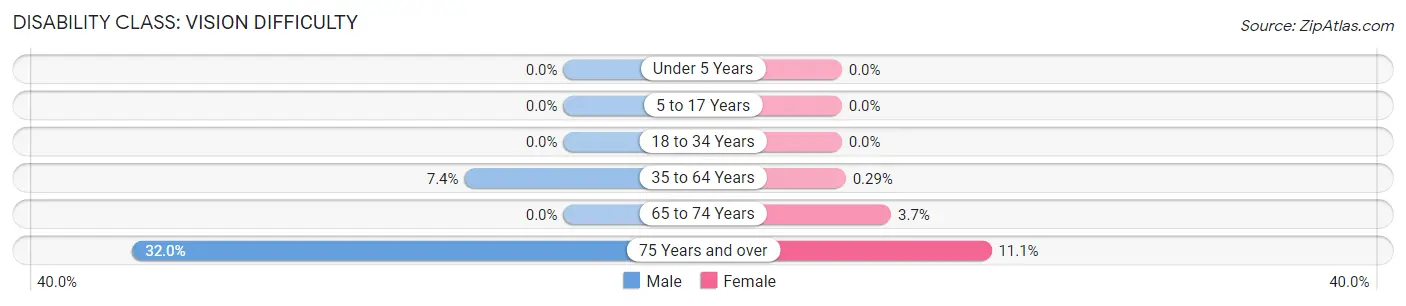
| Age Bracket | Male | Female |
| Under 5 Years | 0 (0.0%) | 0 (0.0%) |
| 5 to 17 Years | 0 (0.0%) | 0 (0.0%) |
| 18 to 34 Years | 0 (0.0%) | 0 (0.0%) |
| 35 to 64 Years | 23 (7.3%) | 1 (0.3%) |
| 65 to 74 Years | 0 (0.0%) | 3 (3.7%) |
| 75 Years and over | 8 (32.0%) | 9 (11.1%) |
Disability Class: Cognitive Difficulty
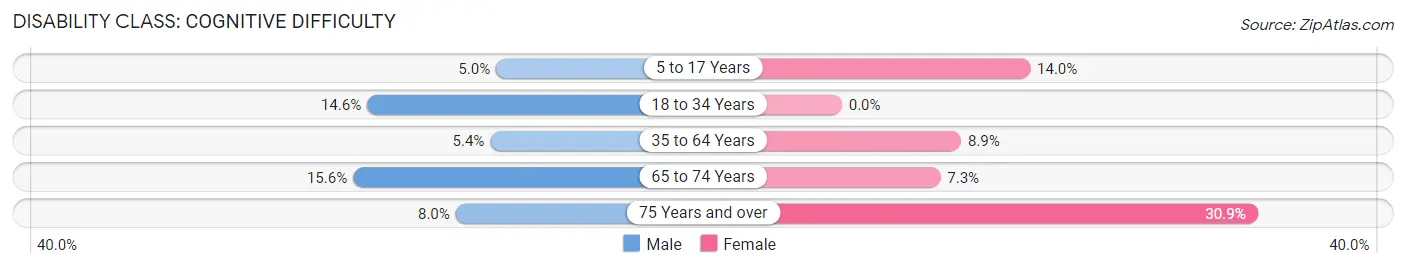
| Age Bracket | Male | Female |
| 5 to 17 Years | 12 (5.0%) | 26 (14.0%) |
| 18 to 34 Years | 21 (14.6%) | 0 (0.0%) |
| 35 to 64 Years | 17 (5.4%) | 30 (8.8%) |
| 65 to 74 Years | 5 (15.6%) | 6 (7.3%) |
| 75 Years and over | 2 (8.0%) | 25 (30.9%) |
Disability Class: Ambulatory Difficulty
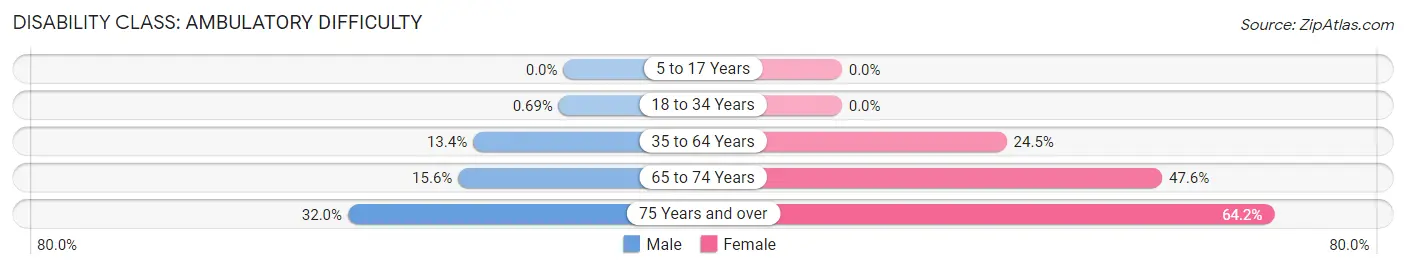
| Age Bracket | Male | Female |
| 5 to 17 Years | 0 (0.0%) | 0 (0.0%) |
| 18 to 34 Years | 1 (0.7%) | 0 (0.0%) |
| 35 to 64 Years | 42 (13.4%) | 83 (24.5%) |
| 65 to 74 Years | 5 (15.6%) | 39 (47.6%) |
| 75 Years and over | 8 (32.0%) | 52 (64.2%) |
Disability Class: Self-Care Difficulty
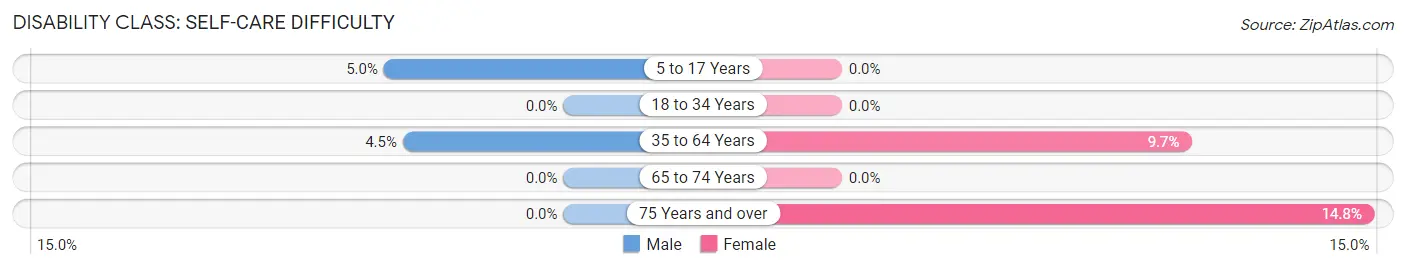
| Age Bracket | Male | Female |
| 5 to 17 Years | 12 (5.0%) | 0 (0.0%) |
| 18 to 34 Years | 0 (0.0%) | 0 (0.0%) |
| 35 to 64 Years | 14 (4.5%) | 33 (9.7%) |
| 65 to 74 Years | 0 (0.0%) | 0 (0.0%) |
| 75 Years and over | 0 (0.0%) | 12 (14.8%) |
Technology Access in Ackerman
Computing Device Access in Ackerman
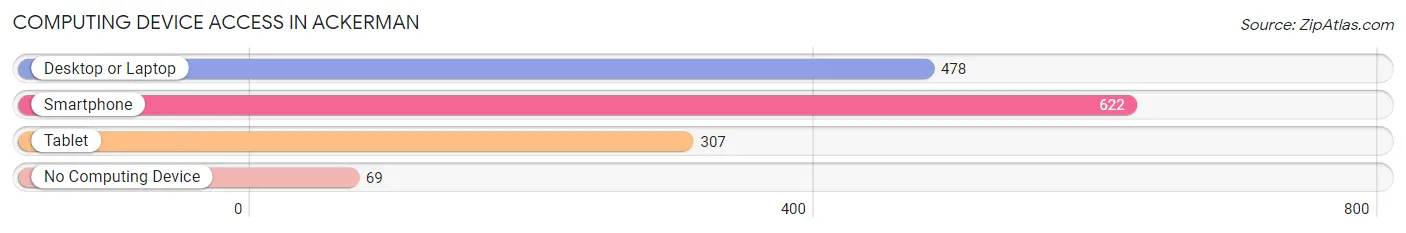
| Device Type | # Households | % Households |
| Desktop or Laptop | 478 | 68.6% |
| Smartphone | 622 | 89.2% |
| Tablet | 307 | 44.1% |
| No Computing Device | 69 | 9.9% |
| Total | 697 | 100.0% |
Internet Access in Ackerman
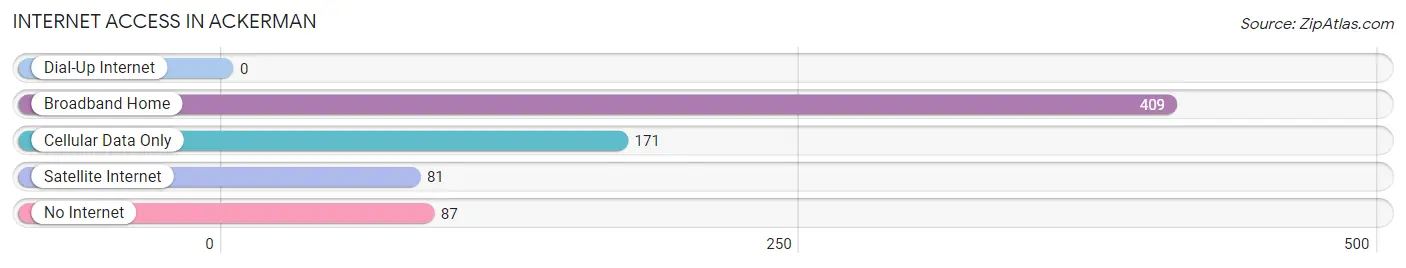
| Internet Type | # Households | % Households |
| Dial-Up Internet | 0 | 0.0% |
| Broadband Home | 409 | 58.7% |
| Cellular Data Only | 171 | 24.5% |
| Satellite Internet | 81 | 11.6% |
| No Internet | 87 | 12.5% |
| Total | 697 | 100.0% |
Ackerman Summary
Ackerman, Mississippi is a small town located in Choctaw County in the northeastern part of the state. It is situated on the banks of the Tombigbee River, about halfway between Jackson and Meridian. The town was founded in 1848 and named after a prominent local family. It has a population of about 2,000 people and is the county seat of Choctaw County.
History
Ackerman was founded in 1848 by the Ackerman family, who had moved to the area from North Carolina. The town was named after the family and was originally known as Ackermanville. The town was incorporated in 1858 and was the first town in Choctaw County.
The town was a major trading center for the area and was home to several stores, a hotel, and a post office. During the Civil War, Ackerman was a Confederate stronghold and was the site of several skirmishes. After the war, the town began to rebuild and by the late 19th century, it had become a thriving agricultural center.
Geography
Ackerman is located in the northeastern part of Mississippi, about halfway between Jackson and Meridian. It is situated on the banks of the Tombigbee River and is surrounded by rolling hills and forests. The town is located in the Black Prairie region of the state, which is known for its fertile soil and abundant wildlife.
Economy
Ackerman’s economy is largely based on agriculture. The town is home to several farms and ranches, as well as a number of small businesses. The town is also home to a number of manufacturing companies, including a furniture factory and a woodworking plant.
Demographics
As of the 2010 census, Ackerman had a population of 2,000 people. The racial makeup of the town was 79.2% White, 19.2% African American, 0.4% Native American, 0.2% Asian, and 0.9% from other races. The median household income was $25,000 and the median family income was $31,000.
Conclusion
Ackerman, Mississippi is a small town located in Choctaw County in the northeastern part of the state. It was founded in 1848 and has a population of about 2,000 people. The town’s economy is largely based on agriculture and manufacturing, and the racial makeup of the town is mostly White and African American. Ackerman is a peaceful and friendly town with a rich history and a bright future.
Common Questions
What is the Total Population of Ackerman?
Total Population of Ackerman is 1,793.
What is the Total Male Population of Ackerman?
Total Male Population of Ackerman is 855.
What is the Total Female Population of Ackerman?
Total Female Population of Ackerman is 938.
What is the Ratio of Males per 100 Females in Ackerman?
There are 91.15 Males per 100 Females in Ackerman.
What is the Ratio of Females per 100 Males in Ackerman?
There are 109.71 Females per 100 Males in Ackerman.
What is the Median Population Age in Ackerman?
Median Population Age in Ackerman is 38.5 Years.
What is the Average Family Size in Ackerman
Average Family Size in Ackerman is 3.0 People.
What is the Average Household Size in Ackerman
Average Household Size in Ackerman is 2.4 People.
What is Per Capita Income in Ackerman?
Per Capita income in Ackerman is $22,049.
What is the Median Family Income in Ackerman?
Median Family Income in Ackerman is $42,292.
What is the Median Household income in Ackerman?
Median Household Income in Ackerman is $36,230.
What is Income or Wage Gap in Ackerman?
Income or Wage Gap in Ackerman is 32.8%.
Women in Ackerman earn 67.2 cents for every dollar earned by a man.
What is Inequality or Gini Index in Ackerman?
Inequality or Gini Index in Ackerman is 0.58.
How Large is the Labor Force in Ackerman?
There are 660 People in the Labor Forcein in Ackerman.
What is the Percentage of People in the Labor Force in Ackerman?
48.1% of People are in the Labor Force in Ackerman.
What is the Unemployment Rate in Ackerman?
Unemployment Rate in Ackerman is 18.0%.