Grenada, MS
Grenada Map
Grenada Overview
12,594
TOTAL POPULATION
6,412
MALE POPULATION
6,182
FEMALE POPULATION
103.72
MALES / 100 FEMALES
96.41
FEMALES / 100 MALES
37.1
MEDIAN AGE
3.3
AVG FAMILY SIZE
2.4
AVG HOUSEHOLD SIZE
$25,764
PER CAPITA INCOME
$56,487
AVG FAMILY INCOME
$40,714
AVG HOUSEHOLD INCOME
16.6%
WAGE / INCOME GAP [ % ]
83.4¢/ $1
WAGE / INCOME GAP [ $ ]
0.51
INEQUALITY / GINI INDEX
5,744
LABOR FORCE [ PEOPLE ]
58.0%
PERCENT IN LABOR FORCE
6.3%
UNEMPLOYMENT RATE
Grenada Zip Codes
Grenada Area Codes
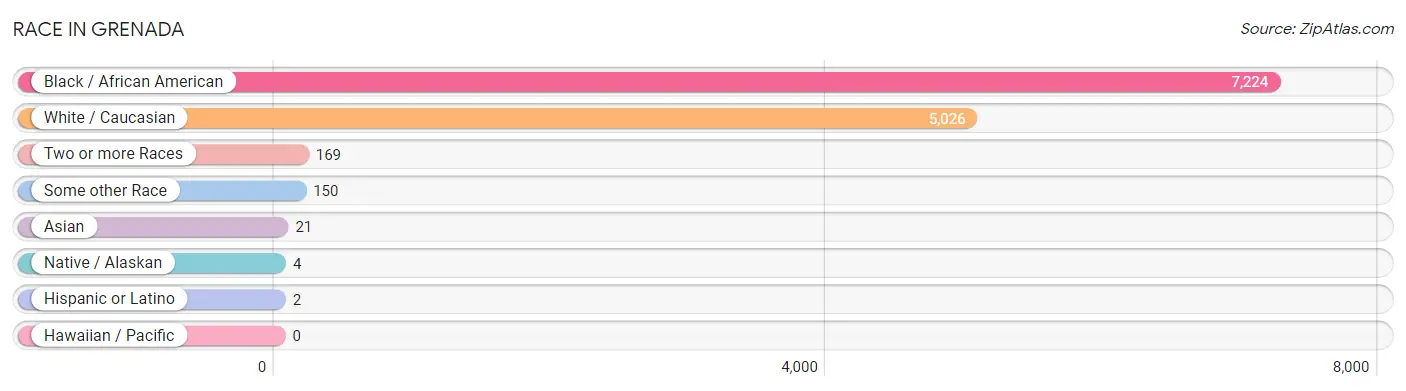
Race in Grenada
The most populous races in Grenada are Black / African American (7,224 | 57.4%), White / Caucasian (5,026 | 39.9%), and Two or more Races (169 | 1.3%).
| Race | # Population | % Population |
| Asian | 21 | 0.2% |
| Black / African American | 7,224 | 57.4% |
| Hawaiian / Pacific | 0 | 0.0% |
| Hispanic or Latino | 2 | 0.0% |
| Native / Alaskan | 4 | 0.0% |
| White / Caucasian | 5,026 | 39.9% |
| Two or more Races | 169 | 1.3% |
| Some other Race | 150 | 1.2% |
| Total | 12,594 | 100.0% |
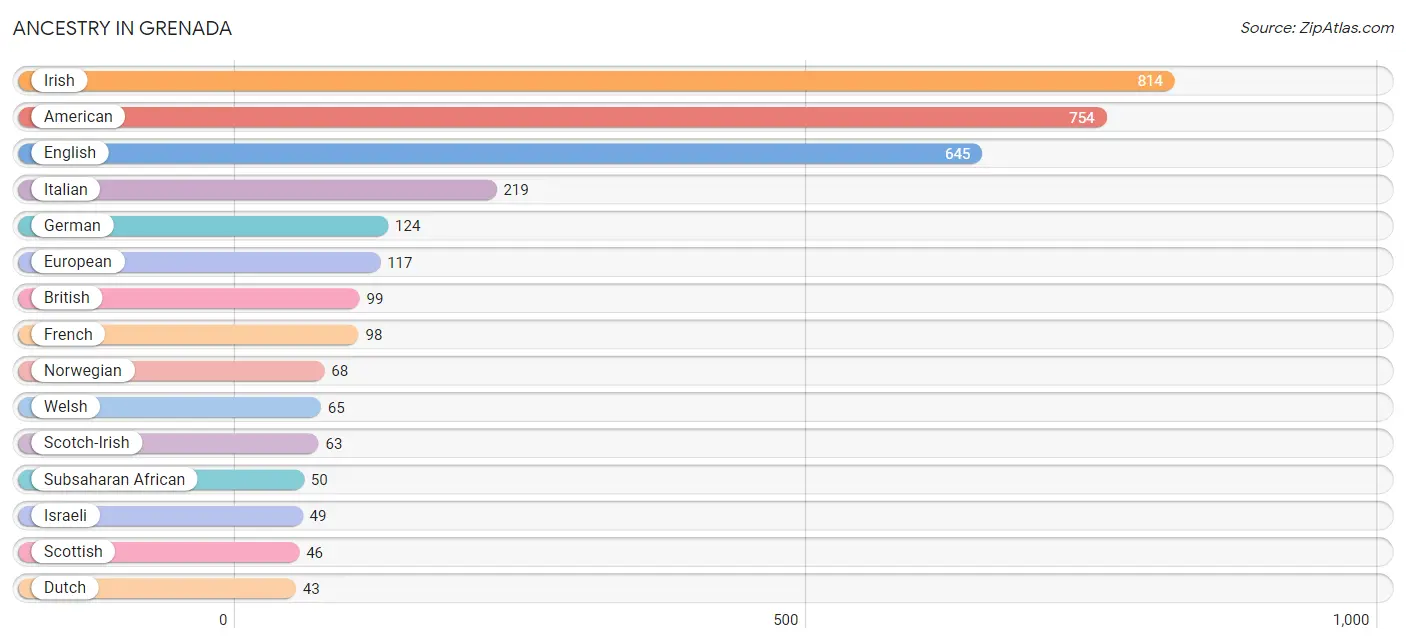
Ancestry in Grenada
The most populous ancestries reported in Grenada are Irish (814 | 6.5%), American (754 | 6.0%), English (645 | 5.1%), Italian (219 | 1.7%), and German (124 | 1.0%), together accounting for 20.3% of all Grenada residents.
| Ancestry | # Population | % Population |
| African | 31 | 0.3% |
| American | 754 | 6.0% |
| British | 99 | 0.8% |
| Cherokee | 30 | 0.2% |
| Choctaw | 21 | 0.2% |
| Dutch | 43 | 0.3% |
| English | 645 | 5.1% |
| European | 117 | 0.9% |
| French | 98 | 0.8% |
| French Canadian | 12 | 0.1% |
| German | 124 | 1.0% |
| Greek | 22 | 0.2% |
| Irish | 814 | 6.5% |
| Israeli | 49 | 0.4% |
| Italian | 219 | 1.7% |
| Nigerian | 19 | 0.2% |
| Norwegian | 68 | 0.5% |
| Polish | 17 | 0.1% |
| Scandinavian | 7 | 0.1% |
| Scotch-Irish | 63 | 0.5% |
| Scottish | 46 | 0.4% |
| Subsaharan African | 50 | 0.4% |
| Thai | 26 | 0.2% |
| Welsh | 65 | 0.5% | View All 24 Rows |
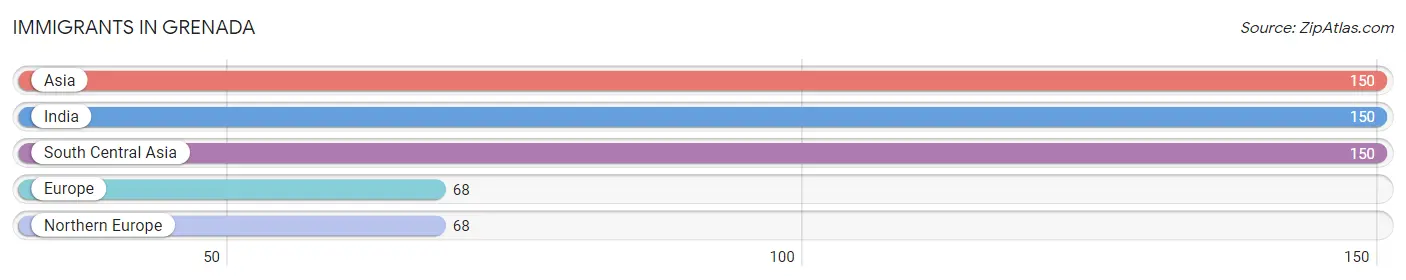
Immigrants in Grenada
The most numerous immigrant groups reported in Grenada came from Asia (150 | 1.2%), India (150 | 1.2%), South Central Asia (150 | 1.2%), Europe (68 | 0.5%), and Northern Europe (68 | 0.5%), together accounting for 4.7% of all Grenada residents.
| Immigration Origin | # Population | % Population |
| Asia | 150 | 1.2% |
| Europe | 68 | 0.5% |
| India | 150 | 1.2% |
| Northern Europe | 68 | 0.5% |
| South Central Asia | 150 | 1.2% | View All 5 Rows |
Sex and Age in Grenada
Sex and Age in Grenada
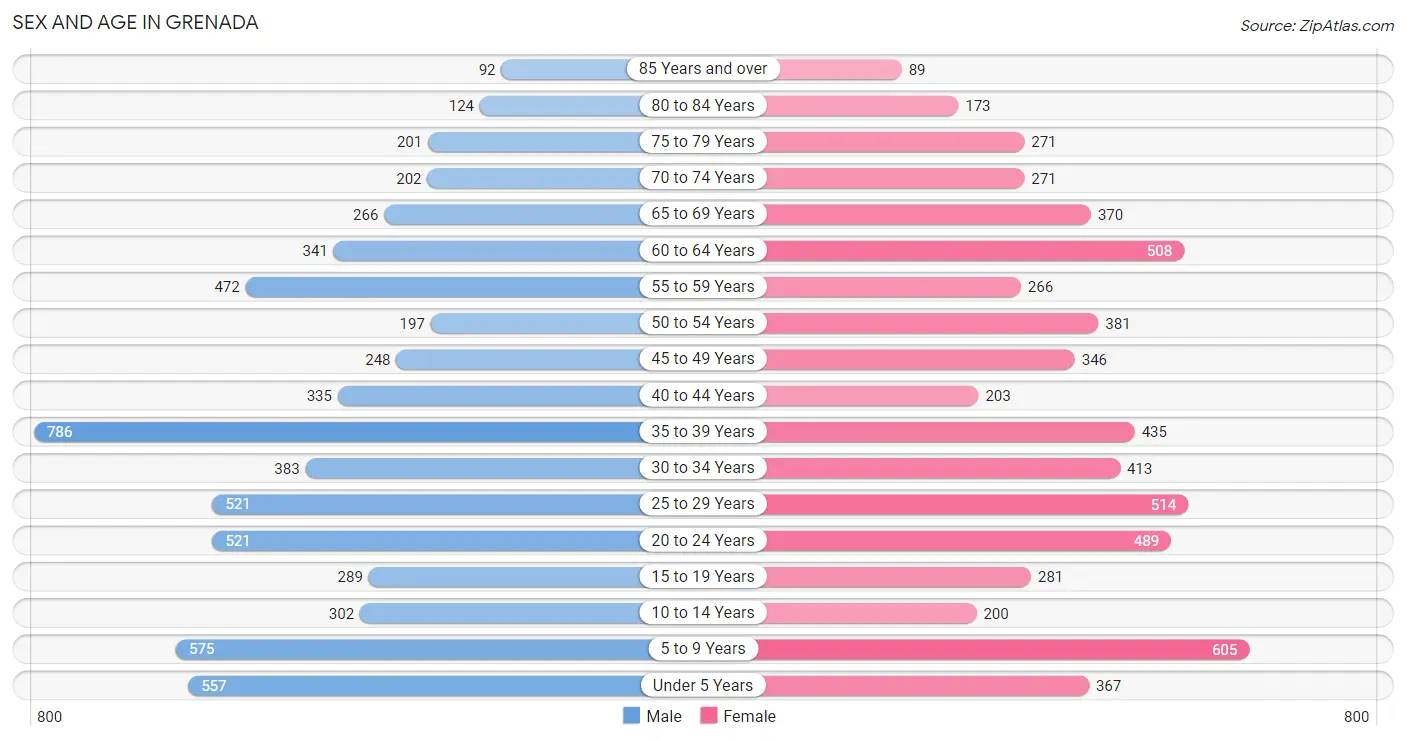
The most populous age groups in Grenada are 35 to 39 Years (786 | 12.3%) for men and 5 to 9 Years (605 | 9.8%) for women.
| Age Bracket | Male | Female |
| Under 5 Years | 557 (8.7%) | 367 (5.9%) |
| 5 to 9 Years | 575 (9.0%) | 605 (9.8%) |
| 10 to 14 Years | 302 (4.7%) | 200 (3.2%) |
| 15 to 19 Years | 289 (4.5%) | 281 (4.5%) |
| 20 to 24 Years | 521 (8.1%) | 489 (7.9%) |
| 25 to 29 Years | 521 (8.1%) | 514 (8.3%) |
| 30 to 34 Years | 383 (6.0%) | 413 (6.7%) |
| 35 to 39 Years | 786 (12.3%) | 435 (7.0%) |
| 40 to 44 Years | 335 (5.2%) | 203 (3.3%) |
| 45 to 49 Years | 248 (3.9%) | 346 (5.6%) |
| 50 to 54 Years | 197 (3.1%) | 381 (6.2%) |
| 55 to 59 Years | 472 (7.4%) | 266 (4.3%) |
| 60 to 64 Years | 341 (5.3%) | 508 (8.2%) |
| 65 to 69 Years | 266 (4.2%) | 370 (6.0%) |
| 70 to 74 Years | 202 (3.2%) | 271 (4.4%) |
| 75 to 79 Years | 201 (3.1%) | 271 (4.4%) |
| 80 to 84 Years | 124 (1.9%) | 173 (2.8%) |
| 85 Years and over | 92 (1.4%) | 89 (1.4%) |
| Total | 6,412 (100.0%) | 6,182 (100.0%) |
Families and Households in Grenada
Median Family Size in Grenada
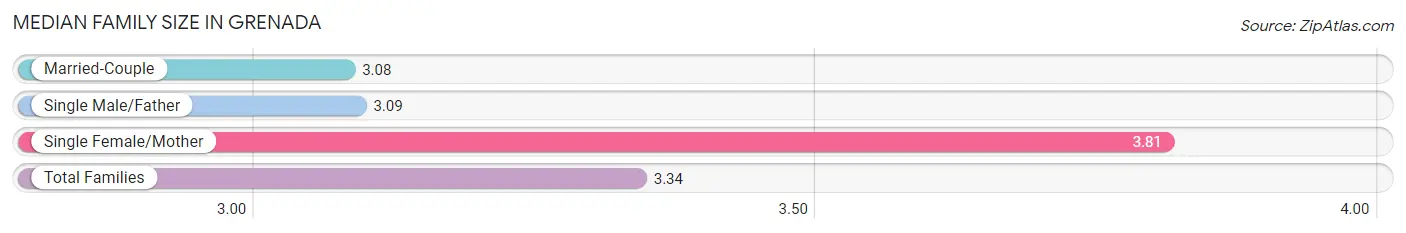
The median family size in Grenada is 3.34 persons per family, with single female/mother families (1,020 | 36.3%) accounting for the largest median family size of 3.81 persons per family. On the other hand, married-couple families (1,644 | 58.5%) represent the smallest median family size with 3.08 persons per family.
| Family Type | # Families | Family Size |
| Married-Couple | 1,644 (58.5%) | 3.08 |
| Single Male/Father | 147 (5.2%) | 3.09 |
| Single Female/Mother | 1,020 (36.3%) | 3.81 |
| Total Families | 2,811 (100.0%) | 3.34 |
Median Household Size in Grenada
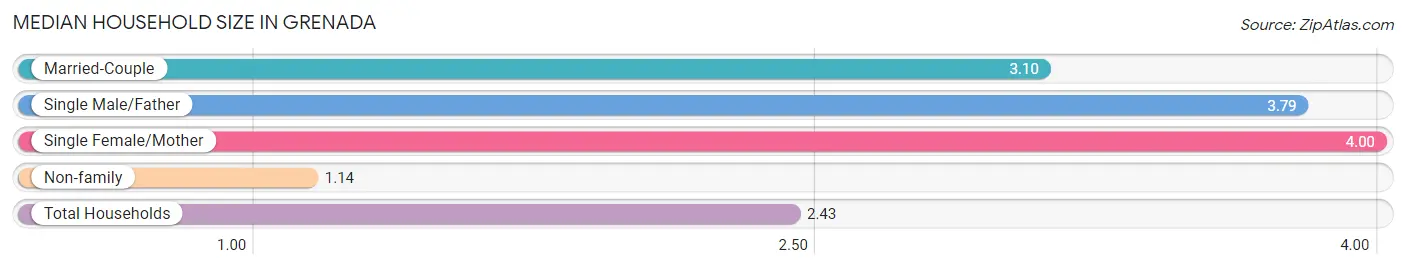
The median household size in Grenada is 2.43 persons per household, with single female/mother households (1,020 | 20.1%) accounting for the largest median household size of 4 persons per household. non-family households (2,263 | 44.6%) represent the smallest median household size with 1.14 persons per household.
| Household Type | # Households | Household Size |
| Married-Couple | 1,644 (32.4%) | 3.10 |
| Single Male/Father | 147 (2.9%) | 3.79 |
| Single Female/Mother | 1,020 (20.1%) | 4.00 |
| Non-family | 2,263 (44.6%) | 1.14 |
| Total Households | 5,074 (100.0%) | 2.43 |
Household Size by Marriage Status in Grenada
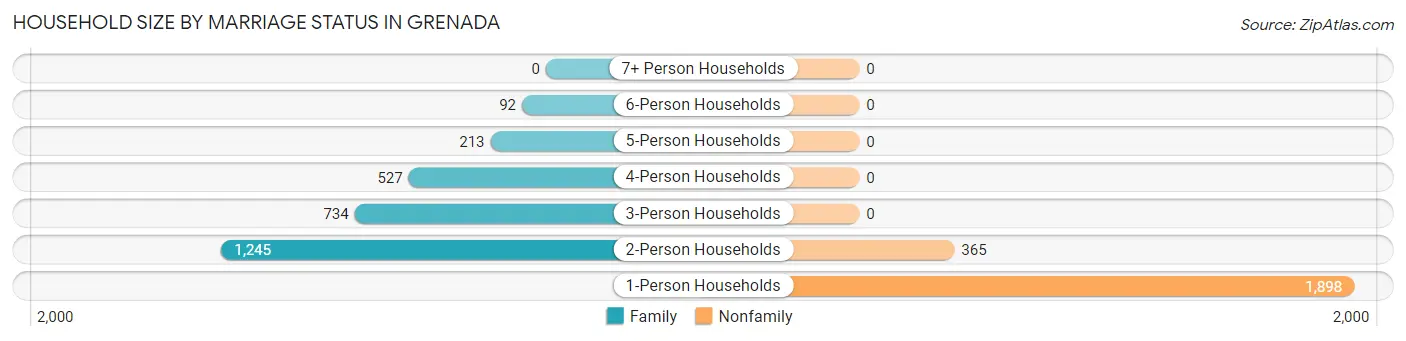
Out of a total of 5,074 households in Grenada, 2,811 (55.4%) are family households, while 2,263 (44.6%) are nonfamily households. The most numerous type of family households are 2-person households, comprising 1,245, and the most common type of nonfamily households are 1-person households, comprising 1,898.
| Household Size | Family Households | Nonfamily Households |
| 1-Person Households | - | 1,898 (37.4%) |
| 2-Person Households | 1,245 (24.5%) | 365 (7.2%) |
| 3-Person Households | 734 (14.5%) | 0 (0.0%) |
| 4-Person Households | 527 (10.4%) | 0 (0.0%) |
| 5-Person Households | 213 (4.2%) | 0 (0.0%) |
| 6-Person Households | 92 (1.8%) | 0 (0.0%) |
| 7+ Person Households | 0 (0.0%) | 0 (0.0%) |
| Total | 2,811 (55.4%) | 2,263 (44.6%) |
Female Fertility in Grenada
Fertility by Age in Grenada
Average fertility rate in Grenada is 97.0 births per 1,000 women. Women in the age bracket of 20 to 34 years have the highest fertility rate with 148.0 births per 1,000 women. Women in the age bracket of 20 to 34 years acount for 78.1% of all women with births.
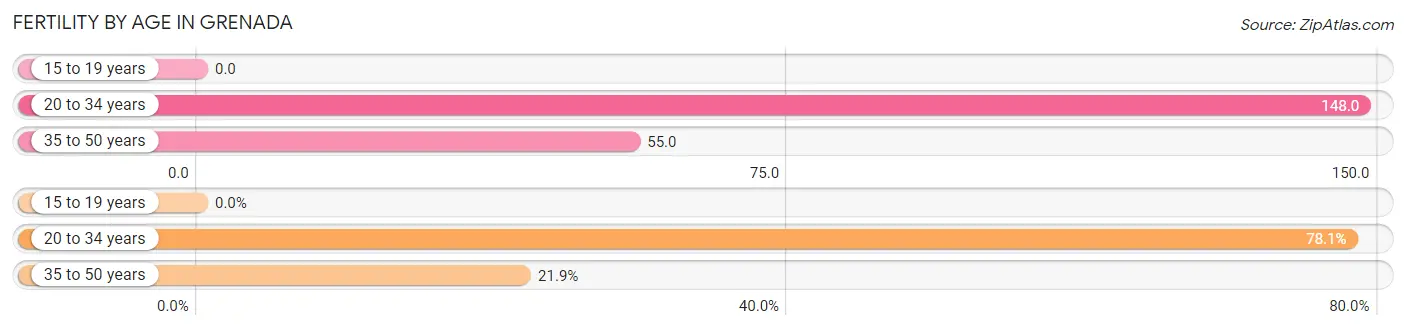
| Age Bracket | Women with Births | Births / 1,000 Women |
| 15 to 19 years | 0 (0.0%) | 0.0 |
| 20 to 34 years | 210 (78.1%) | 148.0 |
| 35 to 50 years | 59 (21.9%) | 55.0 |
| Total | 269 (100.0%) | 97.0 |
Fertility by Age by Marriage Status in Grenada
59.9% of women with births (269) in Grenada are married. The highest percentage of unmarried women with births falls into 20 to 34 years age bracket with 51.4% of them unmarried at the time of birth, while the lowest percentage of unmarried women with births belong to 35 to 50 years age bracket with 0.0% of them unmarried.
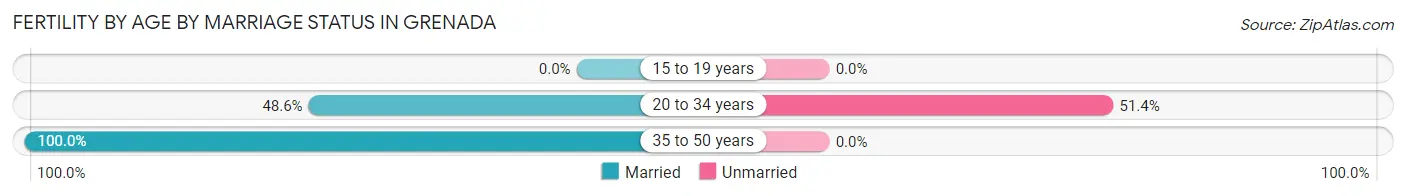
| Age Bracket | Married | Unmarried |
| 15 to 19 years | 0 (0.0%) | 0 (0.0%) |
| 20 to 34 years | 102 (48.6%) | 108 (51.4%) |
| 35 to 50 years | 59 (100.0%) | 0 (0.0%) |
| Total | 161 (59.9%) | 108 (40.2%) |
Fertility by Education in Grenada
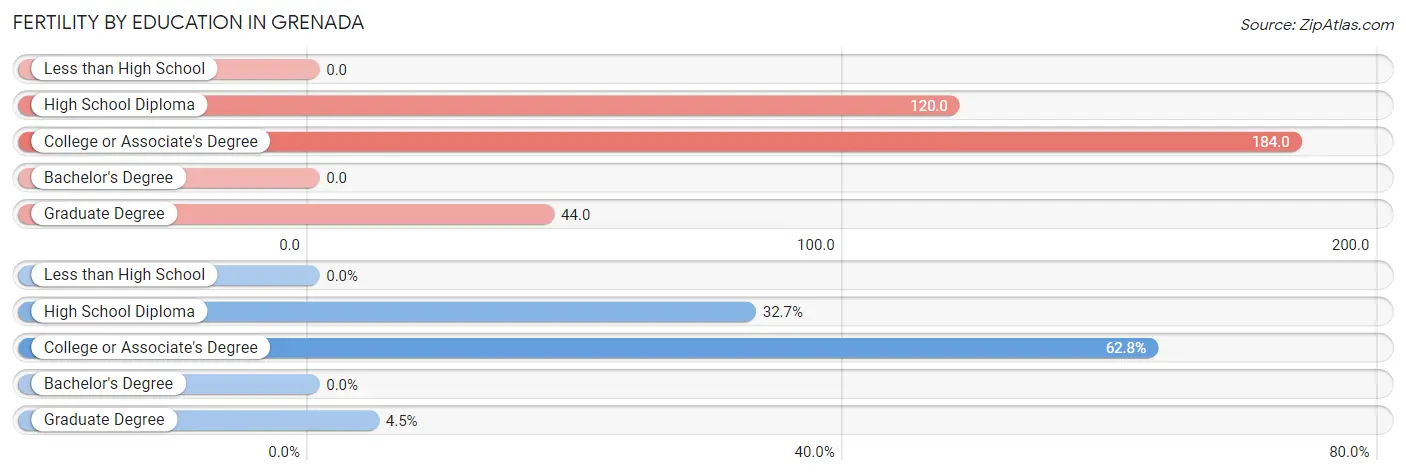
| Educational Attainment | Women with Births | Births / 1,000 Women |
| Less than High School | 0 (0.0%) | 0.0 |
| High School Diploma | 88 (32.7%) | 120.0 |
| College or Associate's Degree | 169 (62.8%) | 184.0 |
| Bachelor's Degree | 0 (0.0%) | 0.0 |
| Graduate Degree | 12 (4.5%) | 44.0 |
| Total | 269 (100.0%) | 97.0 |
Fertility by Education by Marriage Status in Grenada
40.2% of women with births in Grenada are unmarried. Women with the educational attainment of graduate degree are most likely to be married with 100.0% of them married at childbirth, while women with the educational attainment of high school diploma are least likely to be married with 67.0% of them unmarried at childbirth.
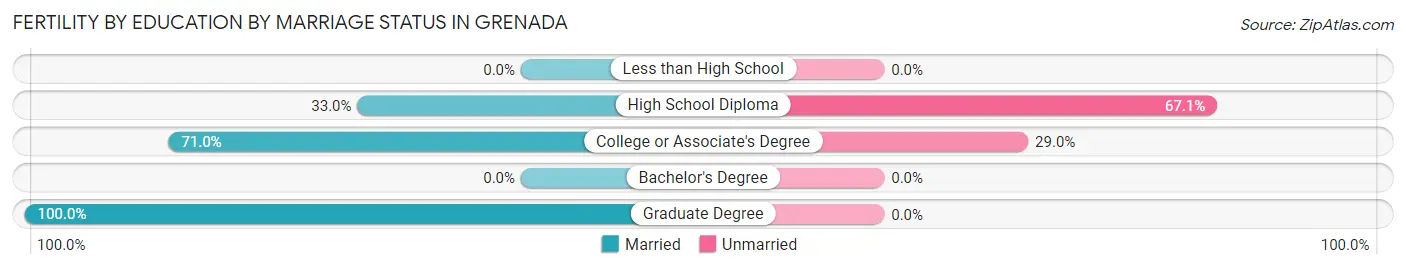
| Educational Attainment | Married | Unmarried |
| Less than High School | 0 (0.0%) | 0 (0.0%) |
| High School Diploma | 29 (33.0%) | 59 (67.0%) |
| College or Associate's Degree | 120 (71.0%) | 49 (29.0%) |
| Bachelor's Degree | 0 (0.0%) | 0 (0.0%) |
| Graduate Degree | 12 (100.0%) | 0 (0.0%) |
| Total | 161 (59.9%) | 108 (40.2%) |
Income in Grenada
Income Overview in Grenada
Per Capita Income in Grenada is $25,764, while median incomes of families and households are $56,487 and $40,714 respectively.
| Characteristic | Number | Measure |
| Per Capita Income | 12,594 | $25,764 |
| Median Family Income | 2,811 | $56,487 |
| Mean Family Income | 2,811 | $78,577 |
| Median Household Income | 5,074 | $40,714 |
| Mean Household Income | 5,074 | $60,093 |
| Income Deficit | 2,811 | $0 |
| Wage / Income Gap (%) | 12,594 | 16.63% |
| Wage / Income Gap ($) | 12,594 | 83.37¢ per $1 |
| Gini / Inequality Index | 12,594 | 0.51 |
Earnings by Sex in Grenada
Average Earnings in Grenada are $28,557, $29,750 for men and $24,802 for women, a difference of 16.6%.
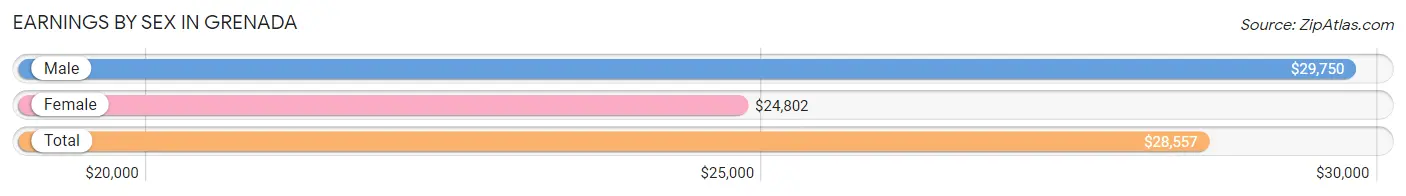
| Sex | Number | Average Earnings |
| Male | 3,094 (53.1%) | $29,750 |
| Female | 2,737 (46.9%) | $24,802 |
| Total | 5,831 (100.0%) | $28,557 |
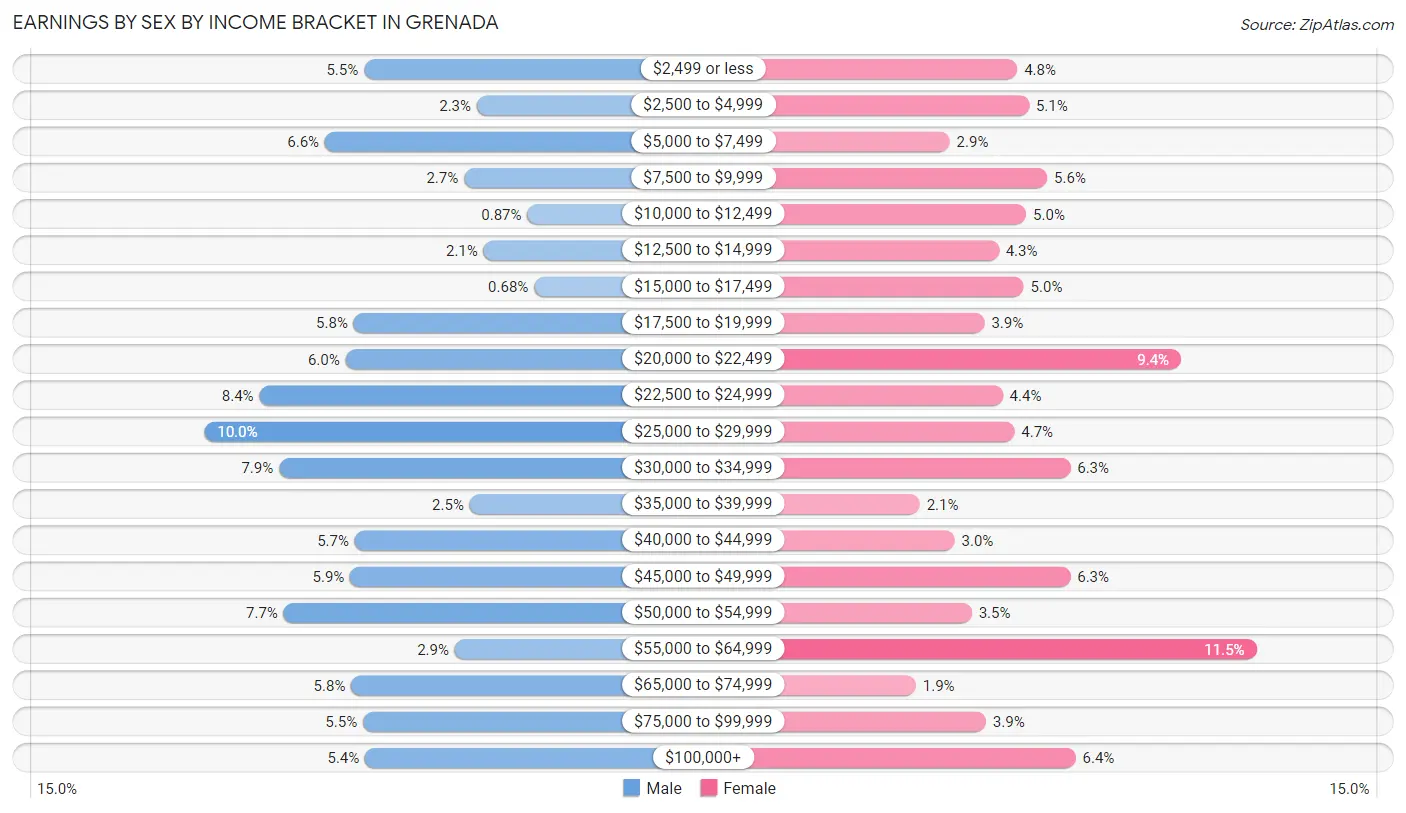
Earnings by Sex by Income Bracket in Grenada
The most common earnings brackets in Grenada are $25,000 to $29,999 for men (308 | 10.0%) and $55,000 to $64,999 for women (315 | 11.5%).
| Income | Male | Female |
| $2,499 or less | 169 (5.5%) | 131 (4.8%) |
| $2,500 to $4,999 | 71 (2.3%) | 140 (5.1%) |
| $5,000 to $7,499 | 203 (6.6%) | 79 (2.9%) |
| $7,500 to $9,999 | 82 (2.6%) | 154 (5.6%) |
| $10,000 to $12,499 | 27 (0.9%) | 138 (5.0%) |
| $12,500 to $14,999 | 65 (2.1%) | 117 (4.3%) |
| $15,000 to $17,499 | 21 (0.7%) | 136 (5.0%) |
| $17,500 to $19,999 | 178 (5.8%) | 106 (3.9%) |
| $20,000 to $22,499 | 185 (6.0%) | 257 (9.4%) |
| $22,500 to $24,999 | 260 (8.4%) | 120 (4.4%) |
| $25,000 to $29,999 | 308 (10.0%) | 129 (4.7%) |
| $30,000 to $34,999 | 243 (7.9%) | 172 (6.3%) |
| $35,000 to $39,999 | 77 (2.5%) | 56 (2.1%) |
| $40,000 to $44,999 | 177 (5.7%) | 83 (3.0%) |
| $45,000 to $49,999 | 181 (5.9%) | 172 (6.3%) |
| $50,000 to $54,999 | 239 (7.7%) | 96 (3.5%) |
| $55,000 to $64,999 | 90 (2.9%) | 315 (11.5%) |
| $65,000 to $74,999 | 180 (5.8%) | 53 (1.9%) |
| $75,000 to $99,999 | 170 (5.5%) | 107 (3.9%) |
| $100,000+ | 168 (5.4%) | 176 (6.4%) |
| Total | 3,094 (100.0%) | 2,737 (100.0%) |
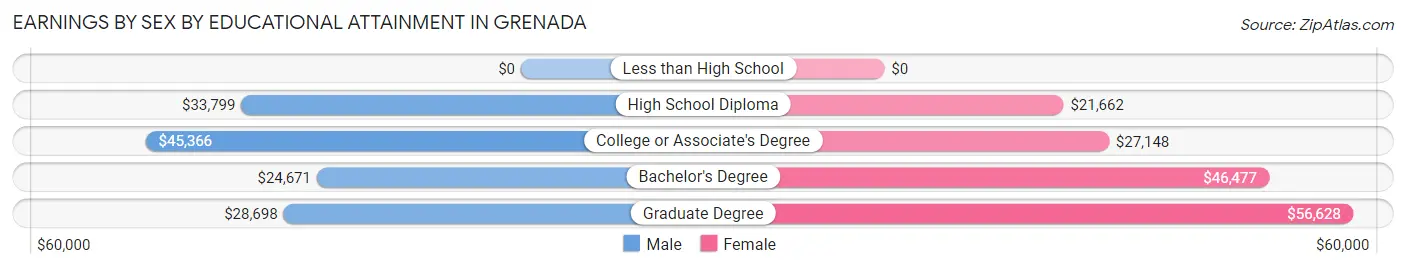
Earnings by Sex by Educational Attainment in Grenada
Average earnings in Grenada are $33,267 for men and $31,563 for women, a difference of 5.1%. Men with an educational attainment of college or associate's degree enjoy the highest average annual earnings of $45,366, while those with bachelor's degree education earn the least with $24,671. Women with an educational attainment of graduate degree earn the most with the average annual earnings of $56,628, while those with high school diploma education have the smallest earnings of $21,662.
| Educational Attainment | Male Income | Female Income |
| Less than High School | - | - |
| High School Diploma | $33,799 | $21,662 |
| College or Associate's Degree | $45,366 | $27,148 |
| Bachelor's Degree | $24,671 | $46,477 |
| Graduate Degree | $28,698 | $56,628 |
| Total | $33,267 | $31,563 |
Family Income in Grenada
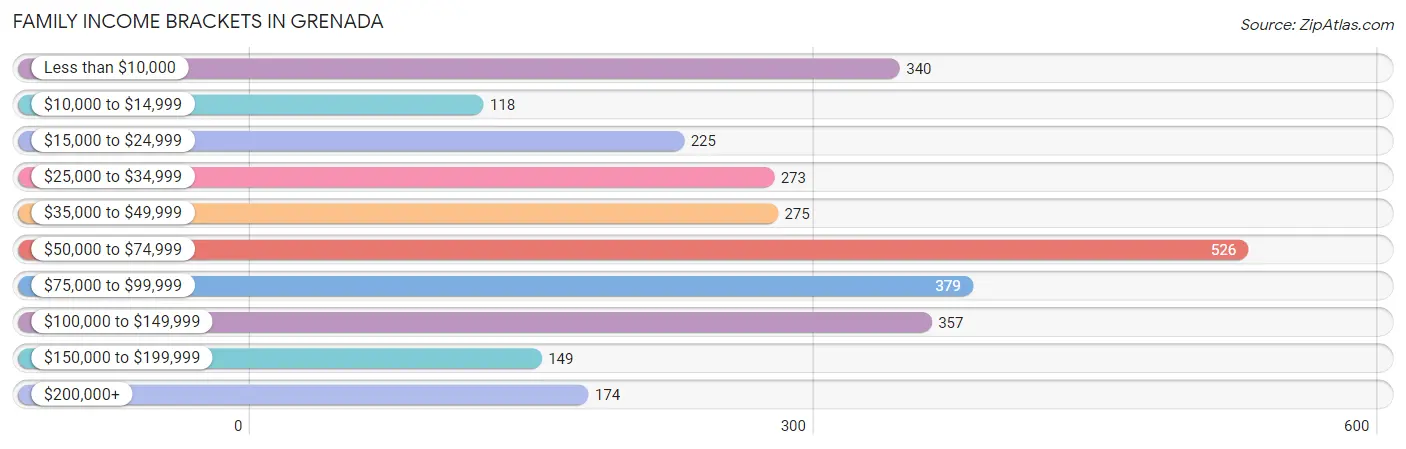
Family Income Brackets in Grenada
According to the Grenada family income data, there are 526 families falling into the $50,000 to $74,999 income range, which is the most common income bracket and makes up 18.7% of all families. Conversely, the $10,000 to $14,999 income bracket is the least frequent group with only 118 families (4.2%) belonging to this category.
| Income Bracket | # Families | % Families |
| Less than $10,000 | 340 | 12.1% |
| $10,000 to $14,999 | 118 | 4.2% |
| $15,000 to $24,999 | 225 | 8.0% |
| $25,000 to $34,999 | 273 | 9.7% |
| $35,000 to $49,999 | 275 | 9.8% |
| $50,000 to $74,999 | 526 | 18.7% |
| $75,000 to $99,999 | 379 | 13.5% |
| $100,000 to $149,999 | 357 | 12.7% |
| $150,000 to $199,999 | 149 | 5.3% |
| $200,000+ | 174 | 6.2% |
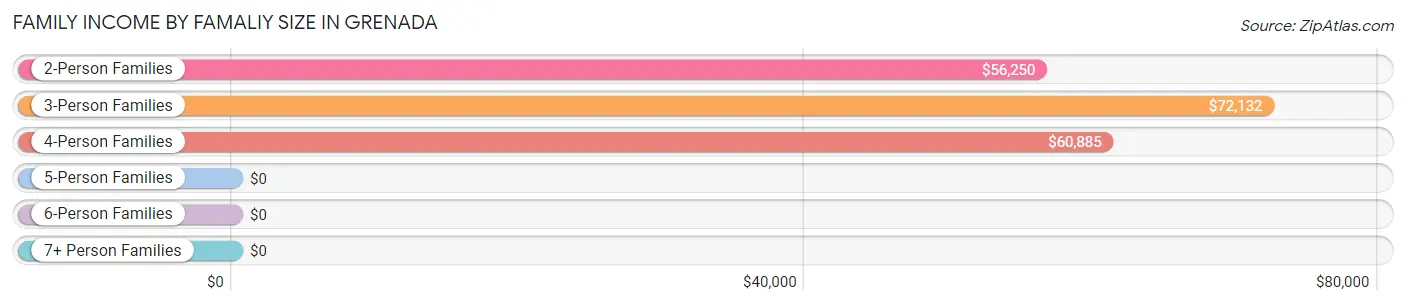
Family Income by Famaliy Size in Grenada
3-person families (649 | 23.1%) account for the highest median family income in Grenada with $72,132 per family, while 2-person families (1,362 | 48.4%) have the highest median income of $28,125 per family member.
| Income Bracket | # Families | Median Income |
| 2-Person Families | 1,362 (48.4%) | $56,250 |
| 3-Person Families | 649 (23.1%) | $72,132 |
| 4-Person Families | 539 (19.2%) | $60,885 |
| 5-Person Families | 209 (7.4%) | $0 |
| 6-Person Families | 52 (1.8%) | $0 |
| 7+ Person Families | 0 (0.0%) | $0 |
| Total | 2,811 (100.0%) | $56,487 |
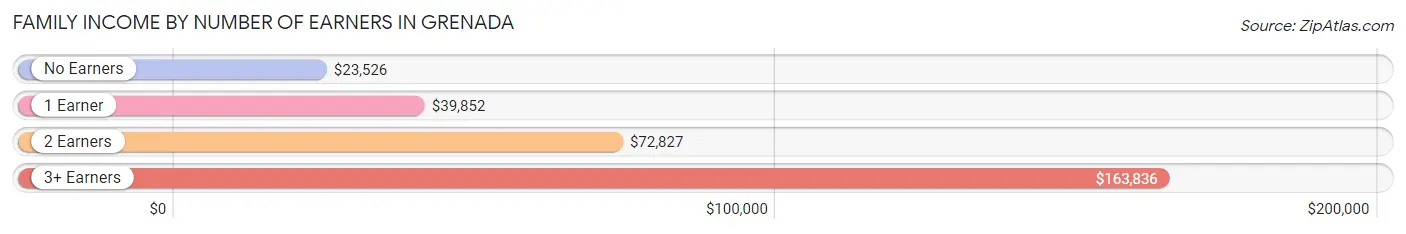
Family Income by Number of Earners in Grenada
The median family income in Grenada is $56,487, with families comprising 3+ earners (251) having the highest median family income of $163,836, while families with no earners (572) have the lowest median family income of $23,526, accounting for 8.9% and 20.3% of families, respectively.
| Number of Earners | # Families | Median Income |
| No Earners | 572 (20.3%) | $23,526 |
| 1 Earner | 999 (35.5%) | $39,852 |
| 2 Earners | 989 (35.2%) | $72,827 |
| 3+ Earners | 251 (8.9%) | $163,836 |
| Total | 2,811 (100.0%) | $56,487 |
Household Income in Grenada
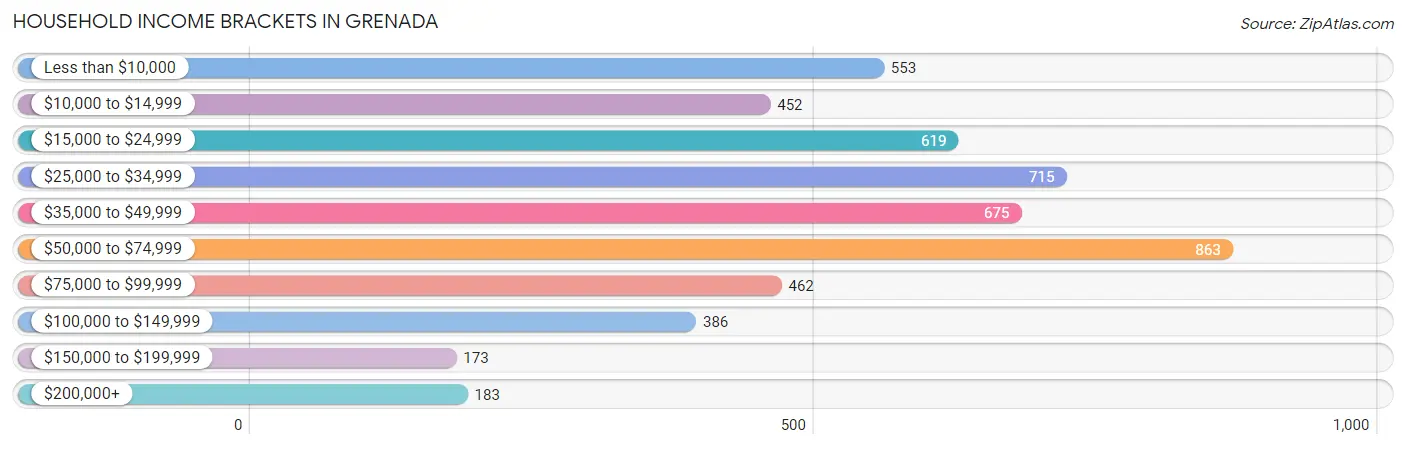
Household Income Brackets in Grenada
With 863 households falling in the category, the $50,000 to $74,999 income range is the most frequent in Grenada, accounting for 17.0% of all households. In contrast, only 173 households (3.4%) fall into the $150,000 to $199,999 income bracket, making it the least populous group.
| Income Bracket | # Households | % Households |
| Less than $10,000 | 553 | 10.9% |
| $10,000 to $14,999 | 452 | 8.9% |
| $15,000 to $24,999 | 619 | 12.2% |
| $25,000 to $34,999 | 715 | 14.1% |
| $35,000 to $49,999 | 675 | 13.3% |
| $50,000 to $74,999 | 863 | 17.0% |
| $75,000 to $99,999 | 462 | 9.1% |
| $100,000 to $149,999 | 386 | 7.6% |
| $150,000 to $199,999 | 173 | 3.4% |
| $200,000+ | 183 | 3.6% |
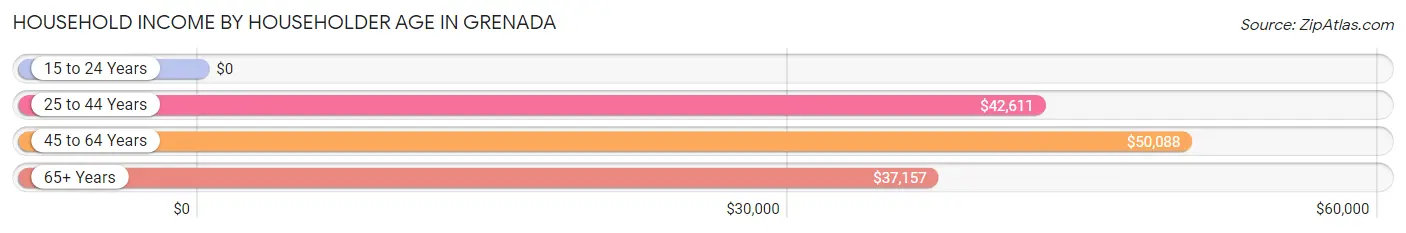
Household Income by Householder Age in Grenada
The median household income in Grenada is $40,714, with the highest median household income of $50,088 found in the 45 to 64 years age bracket for the primary householder. A total of 1,788 households (35.2%) fall into this category. Meanwhile, the 15 to 24 years age bracket for the primary householder has the lowest median household income of $0, with 200 households (3.9%) in this group.
| Income Bracket | # Households | Median Income |
| 15 to 24 Years | 200 (3.9%) | $0 |
| 25 to 44 Years | 1,716 (33.8%) | $42,611 |
| 45 to 64 Years | 1,788 (35.2%) | $50,088 |
| 65+ Years | 1,370 (27.0%) | $37,157 |
| Total | 5,074 (100.0%) | $40,714 |
Poverty in Grenada
Income Below Poverty by Sex and Age in Grenada
With 24.8% poverty level for males and 29.0% for females among the residents of Grenada, 15 year old males and 15 year old females are the most vulnerable to poverty, with 54 males (100.0%) and 31 females (100.0%) in their respective age groups living below the poverty level.
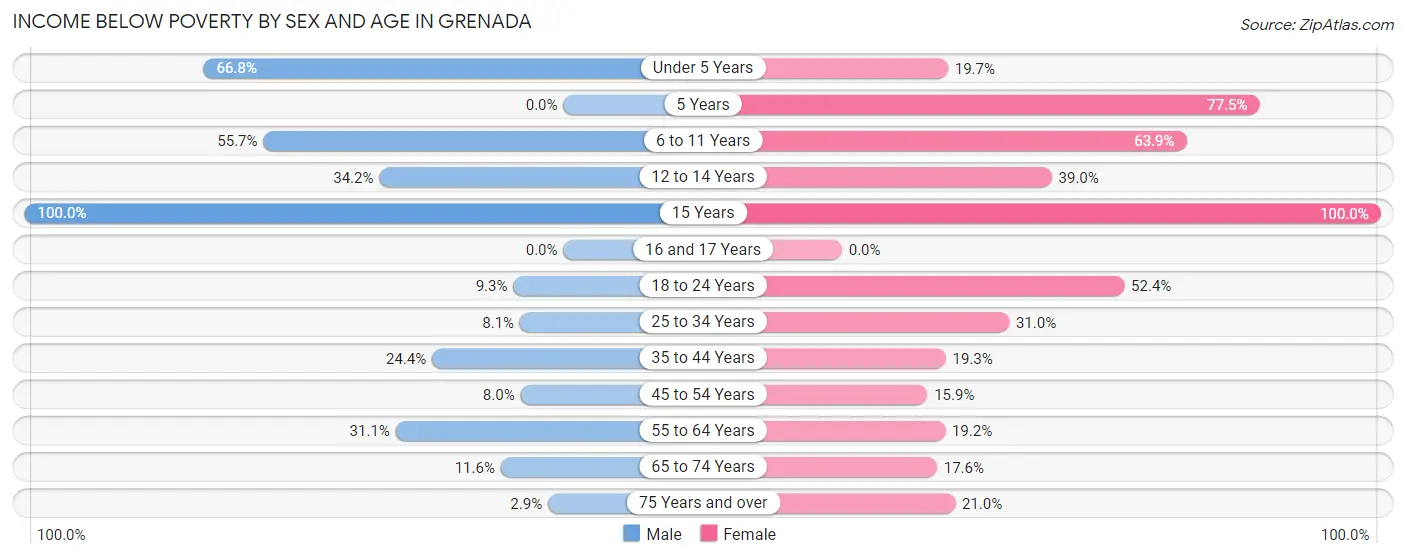
| Age Bracket | Male | Female |
| Under 5 Years | 372 (66.8%) | 71 (19.7%) |
| 5 Years | 0 (0.0%) | 93 (77.5%) |
| 6 to 11 Years | 343 (55.7%) | 328 (63.9%) |
| 12 to 14 Years | 41 (34.2%) | 67 (39.0%) |
| 15 Years | 54 (100.0%) | 31 (100.0%) |
| 16 and 17 Years | 0 (0.0%) | 0 (0.0%) |
| 18 to 24 Years | 59 (9.3%) | 294 (52.4%) |
| 25 to 34 Years | 70 (8.1%) | 287 (31.0%) |
| 35 to 44 Years | 266 (24.4%) | 121 (19.3%) |
| 45 to 54 Years | 34 (8.0%) | 114 (15.9%) |
| 55 to 64 Years | 250 (31.1%) | 144 (19.2%) |
| 65 to 74 Years | 53 (11.6%) | 110 (17.6%) |
| 75 Years and over | 11 (2.9%) | 103 (21.0%) |
| Total | 1,553 (24.8%) | 1,763 (29.0%) |
Income Above Poverty by Sex and Age in Grenada
According to the poverty statistics in Grenada, males aged 5 years and females aged 16 and 17 years are the age groups that are most secure financially, with 100.0% of males and 100.0% of females in these age groups living above the poverty line.
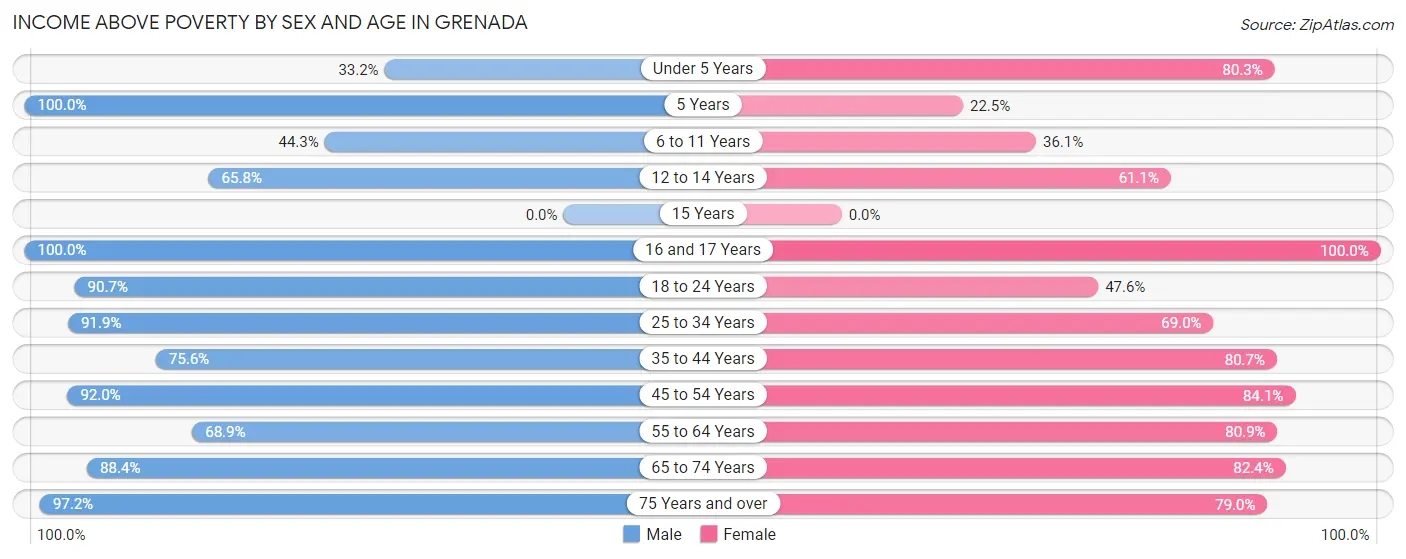
| Age Bracket | Male | Female |
| Under 5 Years | 185 (33.2%) | 290 (80.3%) |
| 5 Years | 141 (100.0%) | 27 (22.5%) |
| 6 to 11 Years | 273 (44.3%) | 185 (36.1%) |
| 12 to 14 Years | 79 (65.8%) | 105 (61.1%) |
| 15 Years | 0 (0.0%) | 0 (0.0%) |
| 16 and 17 Years | 95 (100.0%) | 175 (100.0%) |
| 18 to 24 Years | 576 (90.7%) | 267 (47.6%) |
| 25 to 34 Years | 798 (91.9%) | 638 (69.0%) |
| 35 to 44 Years | 825 (75.6%) | 507 (80.7%) |
| 45 to 54 Years | 393 (92.0%) | 605 (84.1%) |
| 55 to 64 Years | 553 (68.9%) | 608 (80.8%) |
| 65 to 74 Years | 403 (88.4%) | 514 (82.4%) |
| 75 Years and over | 375 (97.2%) | 387 (79.0%) |
| Total | 4,696 (75.1%) | 4,308 (71.0%) |
Income Below Poverty Among Married-Couple Families in Grenada
The poverty statistics for married-couple families in Grenada show that 7.9% or 130 of the total 1,644 families live below the poverty line. Families with 1 or 2 children have the highest poverty rate of 20.8%, comprising of 100 families. On the other hand, families with no children have the lowest poverty rate of 2.0%, which includes 22 families.
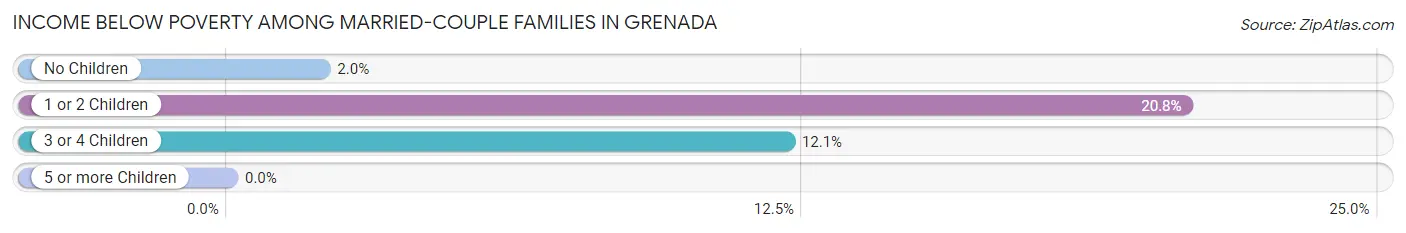
| Children | Above Poverty | Below Poverty |
| No Children | 1,075 (98.0%) | 22 (2.0%) |
| 1 or 2 Children | 381 (79.2%) | 100 (20.8%) |
| 3 or 4 Children | 58 (87.9%) | 8 (12.1%) |
| 5 or more Children | 0 (0.0%) | 0 (0.0%) |
| Total | 1,514 (92.1%) | 130 (7.9%) |
Income Below Poverty Among Single-Parent Households in Grenada
According to the poverty data in Grenada, 29.9% or 44 single-father households and 44.6% or 455 single-mother households are living below the poverty line. Among single-father households, those with 3 or 4 children have the highest poverty rate, with 21 households (100.0%) experiencing poverty. Likewise, among single-mother households, those with 3 or 4 children have the highest poverty rate, with 158 households (100.0%) falling below the poverty line.
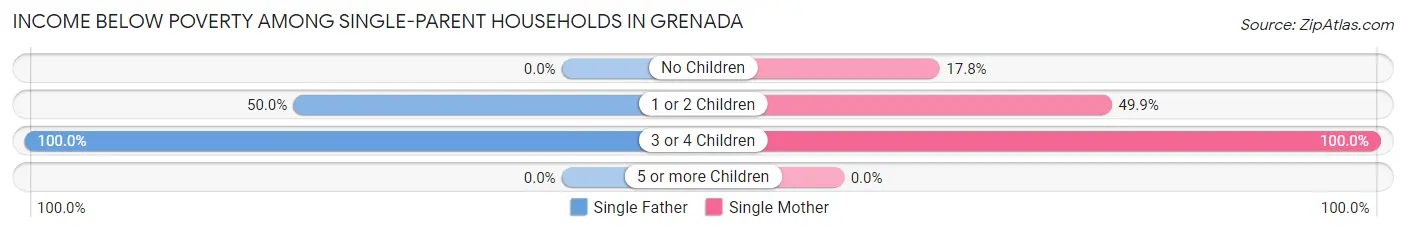
| Children | Single Father | Single Mother |
| No Children | 0 (0.0%) | 74 (17.8%) |
| 1 or 2 Children | 23 (50.0%) | 223 (49.9%) |
| 3 or 4 Children | 21 (100.0%) | 158 (100.0%) |
| 5 or more Children | 0 (0.0%) | 0 (0.0%) |
| Total | 44 (29.9%) | 455 (44.6%) |
Income Below Poverty Among Married-Couple vs Single-Parent Households in Grenada
The poverty data for Grenada shows that 130 of the married-couple family households (7.9%) and 499 of the single-parent households (42.8%) are living below the poverty level. Within the married-couple family households, those with 1 or 2 children have the highest poverty rate, with 100 households (20.8%) falling below the poverty line. Among the single-parent households, those with 3 or 4 children have the highest poverty rate, with 179 household (100.0%) living below poverty.
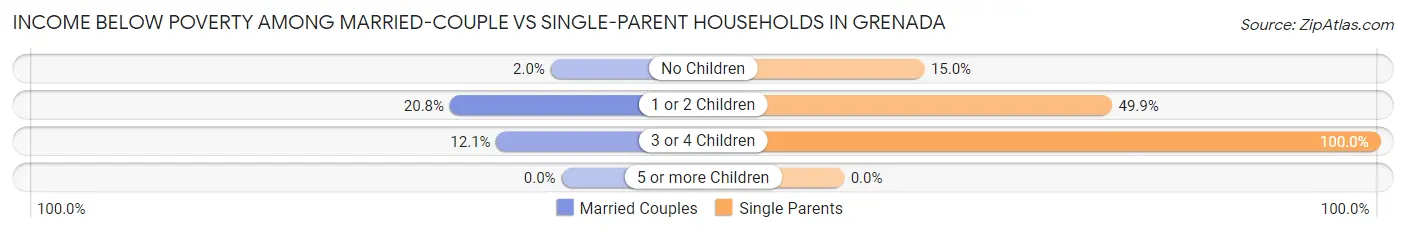
| Children | Married-Couple Families | Single-Parent Households |
| No Children | 22 (2.0%) | 74 (14.9%) |
| 1 or 2 Children | 100 (20.8%) | 246 (49.9%) |
| 3 or 4 Children | 8 (12.1%) | 179 (100.0%) |
| 5 or more Children | 0 (0.0%) | 0 (0.0%) |
| Total | 130 (7.9%) | 499 (42.8%) |
Employment Characteristics in Grenada
Employment by Class of Employer in Grenada
Among the 5,276 employed individuals in Grenada, private company employees (3,382 | 64.1%), local government employees (577 | 10.9%), and state government employees (470 | 8.9%) make up the most common classes of employment.
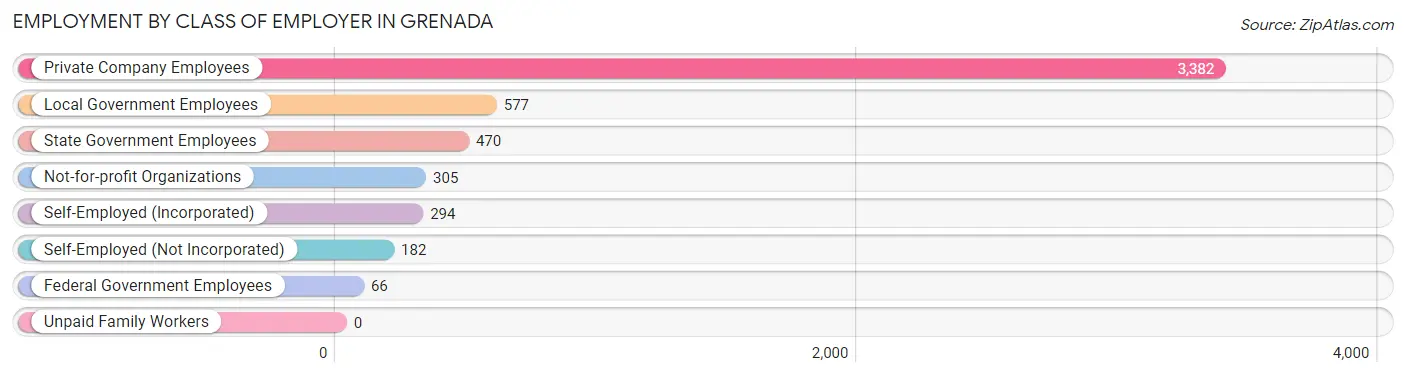
| Employer Class | # Employees | % Employees |
| Private Company Employees | 3,382 | 64.1% |
| Self-Employed (Incorporated) | 294 | 5.6% |
| Self-Employed (Not Incorporated) | 182 | 3.5% |
| Not-for-profit Organizations | 305 | 5.8% |
| Local Government Employees | 577 | 10.9% |
| State Government Employees | 470 | 8.9% |
| Federal Government Employees | 66 | 1.3% |
| Unpaid Family Workers | 0 | 0.0% |
| Total | 5,276 | 100.0% |
Employment Status by Age in Grenada
According to the labor force statistics for Grenada, out of the total population over 16 years of age (9,903), 58.0% or 5,744 individuals are in the labor force, with 6.3% or 362 of them unemployed. The age group with the highest labor force participation rate is 25 to 29 years, with 81.3% or 841 individuals in the labor force. Within the labor force, the 16 to 19 years age range has the highest percentage of unemployed individuals, with 28.1% or 39 of them being unemployed.
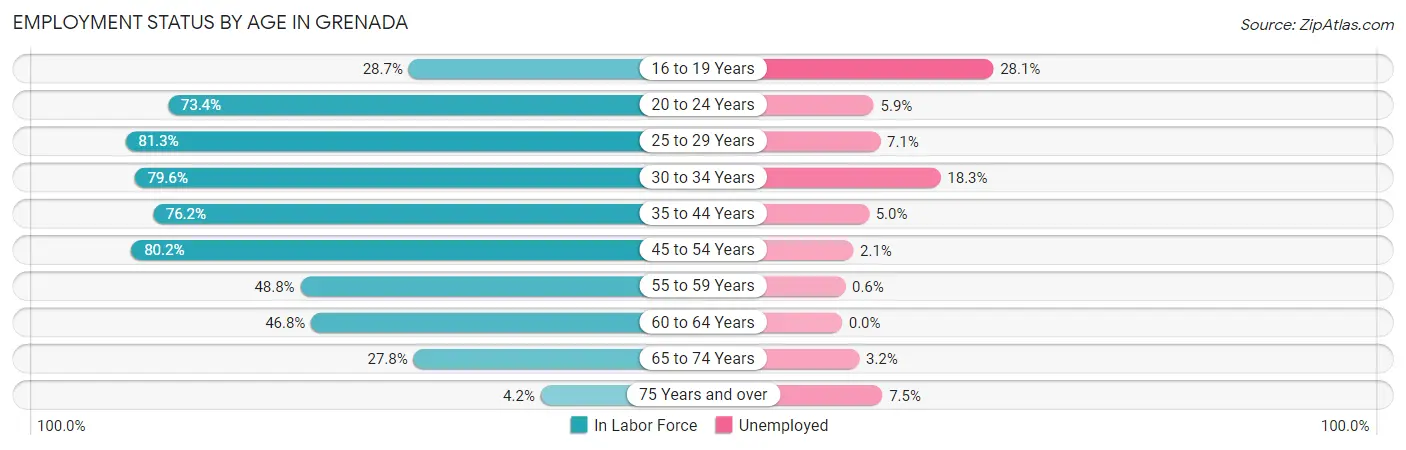
| Age Bracket | In Labor Force | Unemployed |
| 16 to 19 Years | 139 (28.7%) | 39 (28.1%) |
| 20 to 24 Years | 741 (73.4%) | 44 (5.9%) |
| 25 to 29 Years | 841 (81.3%) | 60 (7.1%) |
| 30 to 34 Years | 634 (79.6%) | 116 (18.3%) |
| 35 to 44 Years | 1,340 (76.2%) | 67 (5.0%) |
| 45 to 54 Years | 940 (80.2%) | 20 (2.1%) |
| 55 to 59 Years | 360 (48.8%) | 2 (0.6%) |
| 60 to 64 Years | 397 (46.8%) | 0 (0.0%) |
| 65 to 74 Years | 308 (27.8%) | 10 (3.2%) |
| 75 Years and over | 40 (4.2%) | 3 (7.5%) |
| Total | 5,744 (58.0%) | 362 (6.3%) |
Employment Status by Educational Attainment in Grenada
According to labor force statistics for Grenada, 71.1% of individuals (4,514) out of the total population between 25 and 64 years of age (6,349) are in the labor force, with 5.9% or 266 of them being unemployed. The group with the highest labor force participation rate are those with the educational attainment of bachelor's degree or higher, with 87.4% or 1,360 individuals in the labor force. Within the labor force, individuals with less than high school education have the highest percentage of unemployment, with 19.4% or 57 of them being unemployed.
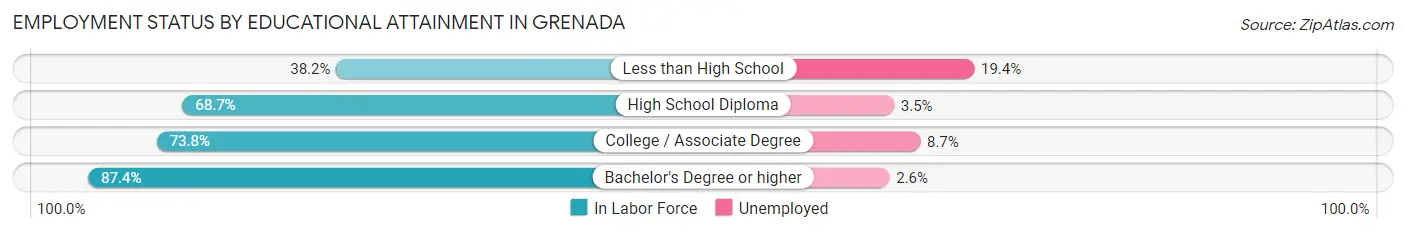
| Educational Attainment | In Labor Force | Unemployed |
| Less than High School | 294 (38.2%) | 149 (19.4%) |
| High School Diploma | 1,470 (68.7%) | 75 (3.5%) |
| College / Associate Degree | 1,390 (73.8%) | 164 (8.7%) |
| Bachelor's Degree or higher | 1,360 (87.4%) | 40 (2.6%) |
| Total | 4,514 (71.1%) | 375 (5.9%) |
Employment Occupations by Sex in Grenada
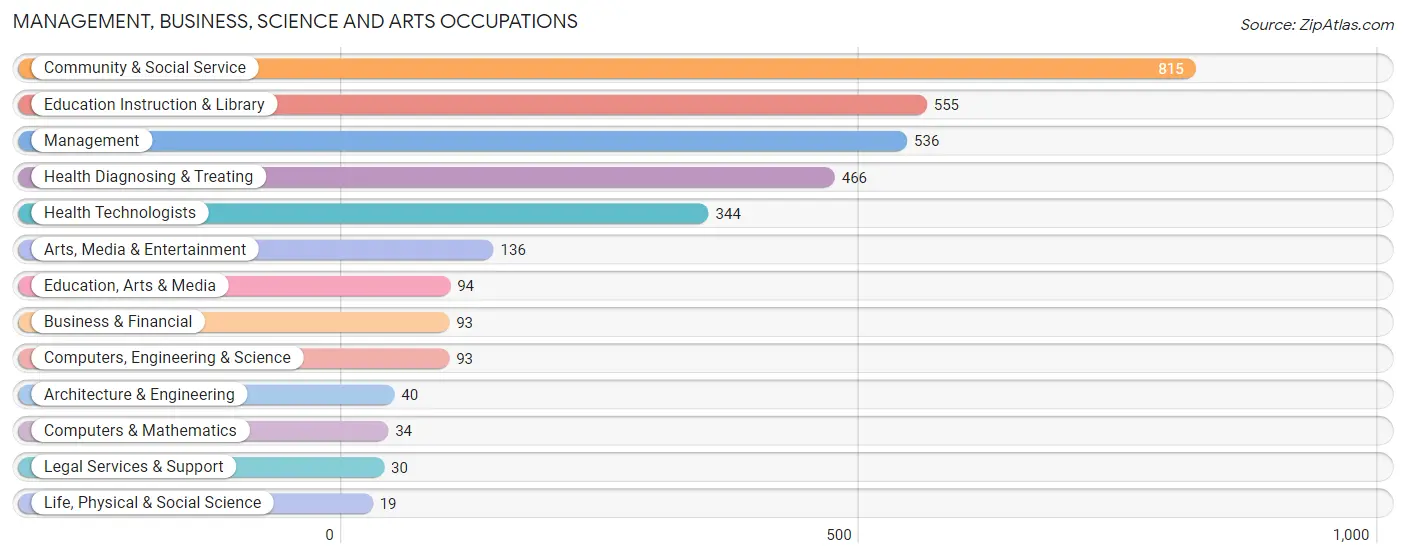
Management, Business, Science and Arts Occupations
The most common Management, Business, Science and Arts occupations in Grenada are Community & Social Service (815 | 15.1%), Education Instruction & Library (555 | 10.3%), Management (536 | 10.0%), Health Diagnosing & Treating (466 | 8.7%), and Health Technologists (344 | 6.4%).
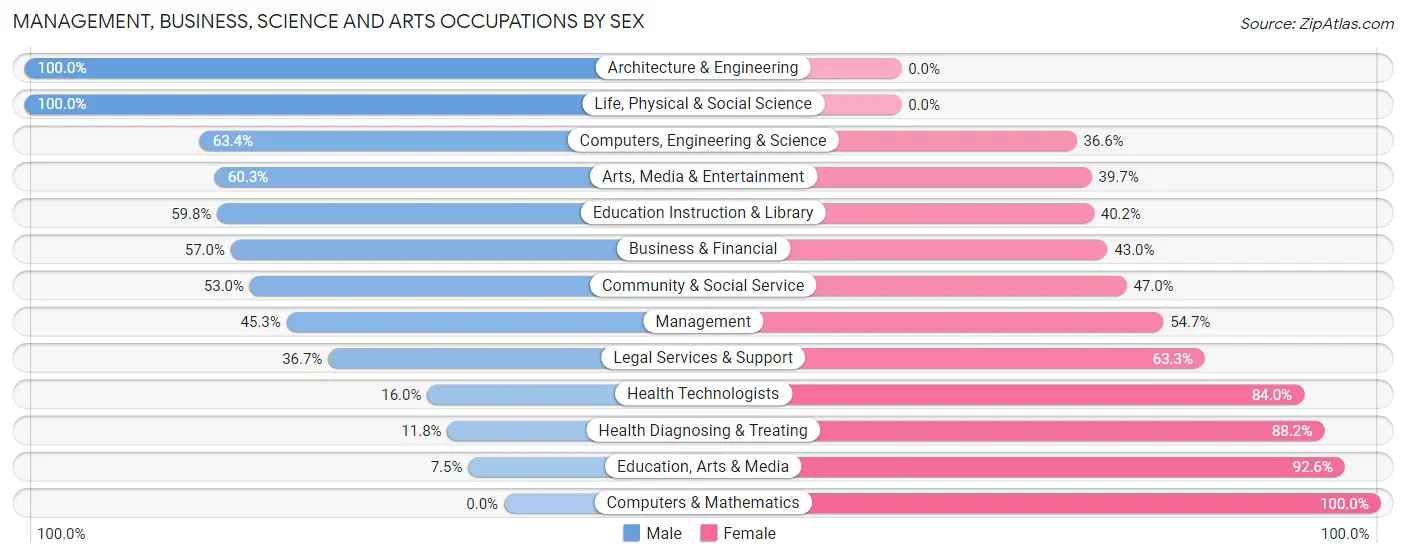
Management, Business, Science and Arts Occupations by Sex
Within the Management, Business, Science and Arts occupations in Grenada, the most male-oriented occupations are Architecture & Engineering (100.0%), Life, Physical & Social Science (100.0%), and Computers, Engineering & Science (63.4%), while the most female-oriented occupations are Computers & Mathematics (100.0%), Education, Arts & Media (92.5%), and Health Diagnosing & Treating (88.2%).
| Occupation | Male | Female |
| Management | 243 (45.3%) | 293 (54.7%) |
| Business & Financial | 53 (57.0%) | 40 (43.0%) |
| Computers, Engineering & Science | 59 (63.4%) | 34 (36.6%) |
| Computers & Mathematics | 0 (0.0%) | 34 (100.0%) |
| Architecture & Engineering | 40 (100.0%) | 0 (0.0%) |
| Life, Physical & Social Science | 19 (100.0%) | 0 (0.0%) |
| Community & Social Service | 432 (53.0%) | 383 (47.0%) |
| Education, Arts & Media | 7 (7.4%) | 87 (92.5%) |
| Legal Services & Support | 11 (36.7%) | 19 (63.3%) |
| Education Instruction & Library | 332 (59.8%) | 223 (40.2%) |
| Arts, Media & Entertainment | 82 (60.3%) | 54 (39.7%) |
| Health Diagnosing & Treating | 55 (11.8%) | 411 (88.2%) |
| Health Technologists | 55 (16.0%) | 289 (84.0%) |
| Total (Category) | 842 (42.0%) | 1,161 (58.0%) |
| Total (Overall) | 2,898 (53.9%) | 2,482 (46.1%) |
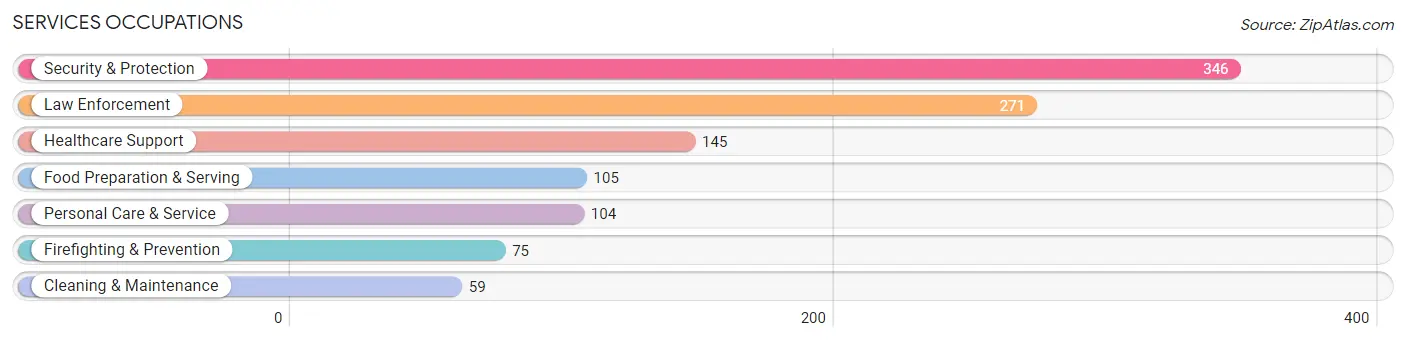
Services Occupations
The most common Services occupations in Grenada are Security & Protection (346 | 6.4%), Law Enforcement (271 | 5.0%), Healthcare Support (145 | 2.7%), Food Preparation & Serving (105 | 1.9%), and Personal Care & Service (104 | 1.9%).
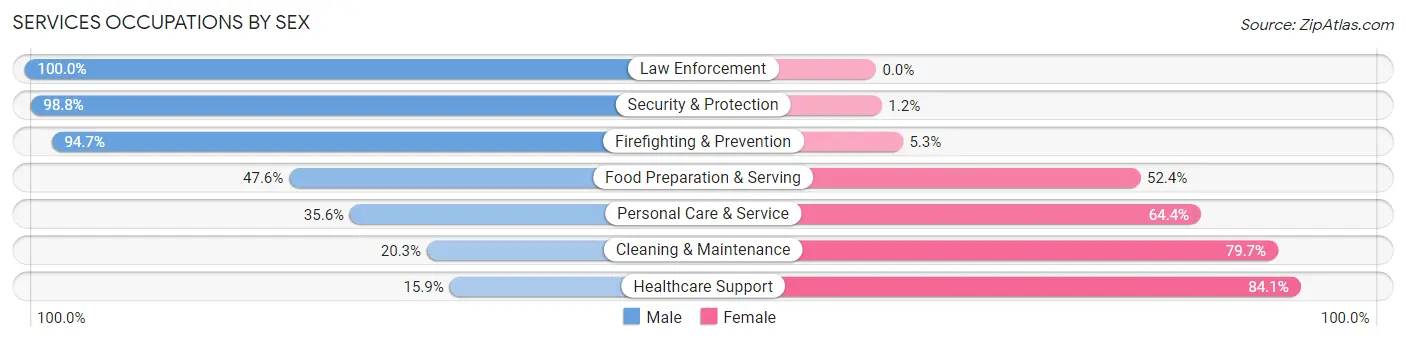
Services Occupations by Sex
Within the Services occupations in Grenada, the most male-oriented occupations are Law Enforcement (100.0%), Security & Protection (98.8%), and Firefighting & Prevention (94.7%), while the most female-oriented occupations are Healthcare Support (84.1%), Cleaning & Maintenance (79.7%), and Personal Care & Service (64.4%).
| Occupation | Male | Female |
| Healthcare Support | 23 (15.9%) | 122 (84.1%) |
| Security & Protection | 342 (98.8%) | 4 (1.2%) |
| Firefighting & Prevention | 71 (94.7%) | 4 (5.3%) |
| Law Enforcement | 271 (100.0%) | 0 (0.0%) |
| Food Preparation & Serving | 50 (47.6%) | 55 (52.4%) |
| Cleaning & Maintenance | 12 (20.3%) | 47 (79.7%) |
| Personal Care & Service | 37 (35.6%) | 67 (64.4%) |
| Total (Category) | 464 (61.1%) | 295 (38.9%) |
| Total (Overall) | 2,898 (53.9%) | 2,482 (46.1%) |
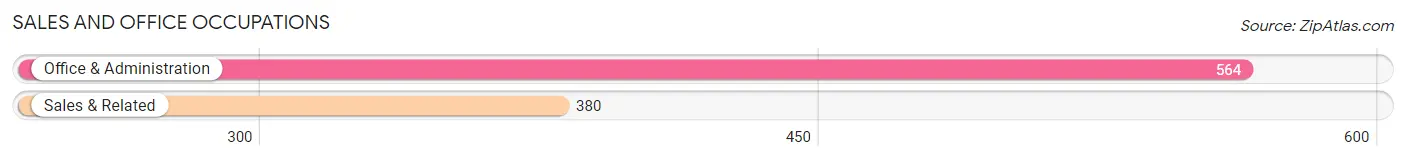
Sales and Office Occupations
The most common Sales and Office occupations in Grenada are Office & Administration (564 | 10.5%), and Sales & Related (380 | 7.1%).
Sales and Office Occupations by Sex
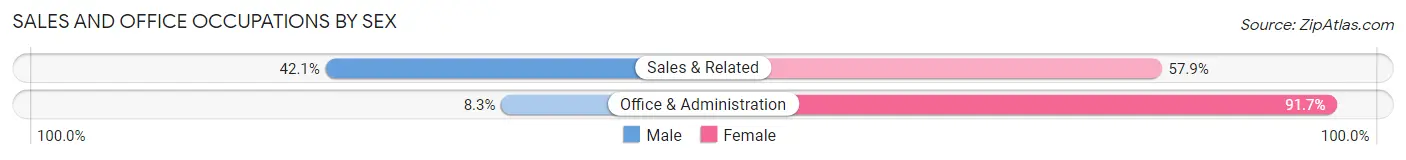
| Occupation | Male | Female |
| Sales & Related | 160 (42.1%) | 220 (57.9%) |
| Office & Administration | 47 (8.3%) | 517 (91.7%) |
| Total (Category) | 207 (21.9%) | 737 (78.1%) |
| Total (Overall) | 2,898 (53.9%) | 2,482 (46.1%) |
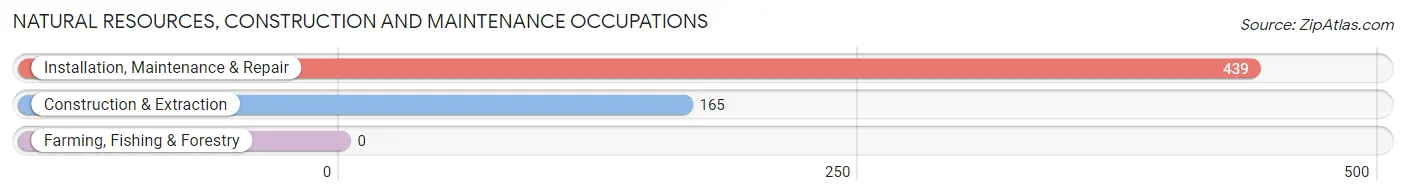
Natural Resources, Construction and Maintenance Occupations
The most common Natural Resources, Construction and Maintenance occupations in Grenada are Installation, Maintenance & Repair (439 | 8.2%), and Construction & Extraction (165 | 3.1%).
Natural Resources, Construction and Maintenance Occupations by Sex
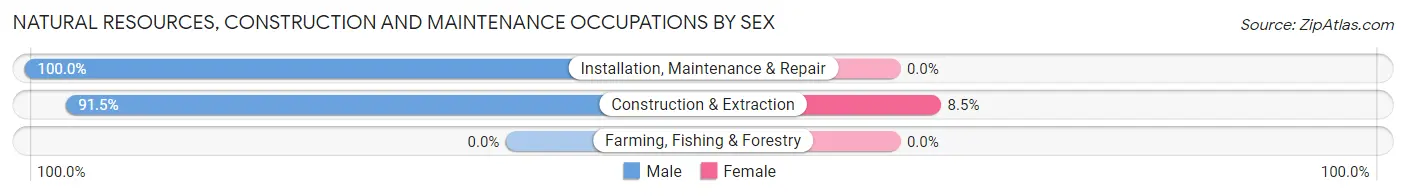
| Occupation | Male | Female |
| Farming, Fishing & Forestry | 0 (0.0%) | 0 (0.0%) |
| Construction & Extraction | 151 (91.5%) | 14 (8.5%) |
| Installation, Maintenance & Repair | 439 (100.0%) | 0 (0.0%) |
| Total (Category) | 590 (97.7%) | 14 (2.3%) |
| Total (Overall) | 2,898 (53.9%) | 2,482 (46.1%) |
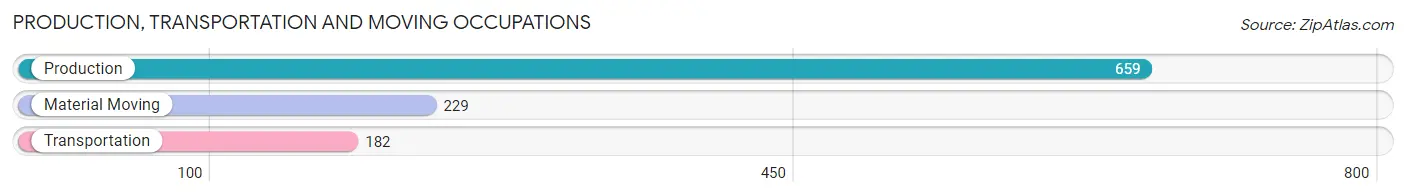
Production, Transportation and Moving Occupations
The most common Production, Transportation and Moving occupations in Grenada are Production (659 | 12.2%), Material Moving (229 | 4.3%), and Transportation (182 | 3.4%).
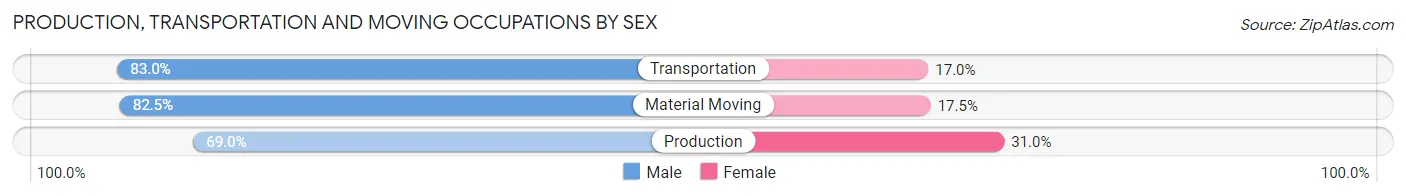
Production, Transportation and Moving Occupations by Sex
| Occupation | Male | Female |
| Production | 455 (69.0%) | 204 (31.0%) |
| Transportation | 151 (83.0%) | 31 (17.0%) |
| Material Moving | 189 (82.5%) | 40 (17.5%) |
| Total (Category) | 795 (74.3%) | 275 (25.7%) |
| Total (Overall) | 2,898 (53.9%) | 2,482 (46.1%) |
Employment Industries by Sex in Grenada
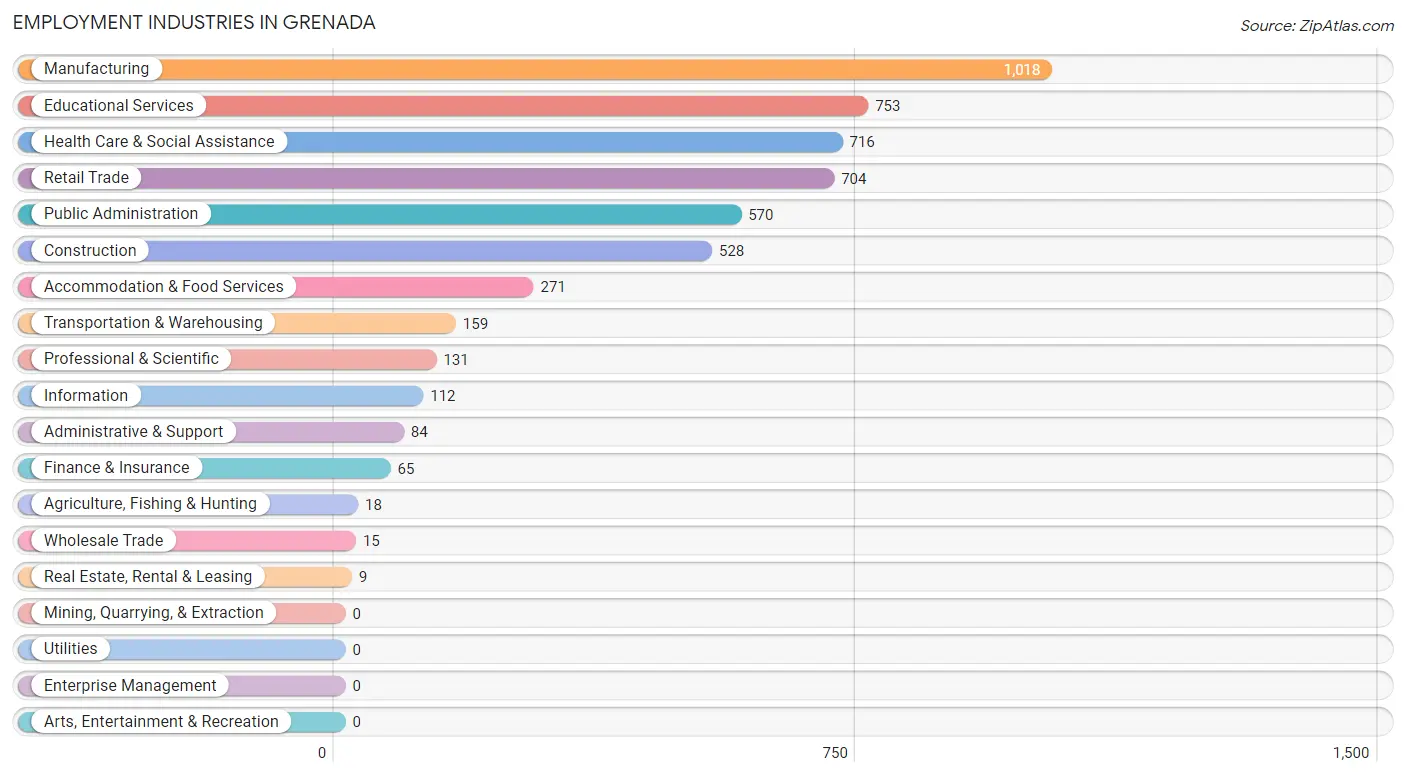
Employment Industries in Grenada
The major employment industries in Grenada include Manufacturing (1,018 | 18.9%), Educational Services (753 | 14.0%), Health Care & Social Assistance (716 | 13.3%), Retail Trade (704 | 13.1%), and Public Administration (570 | 10.6%).
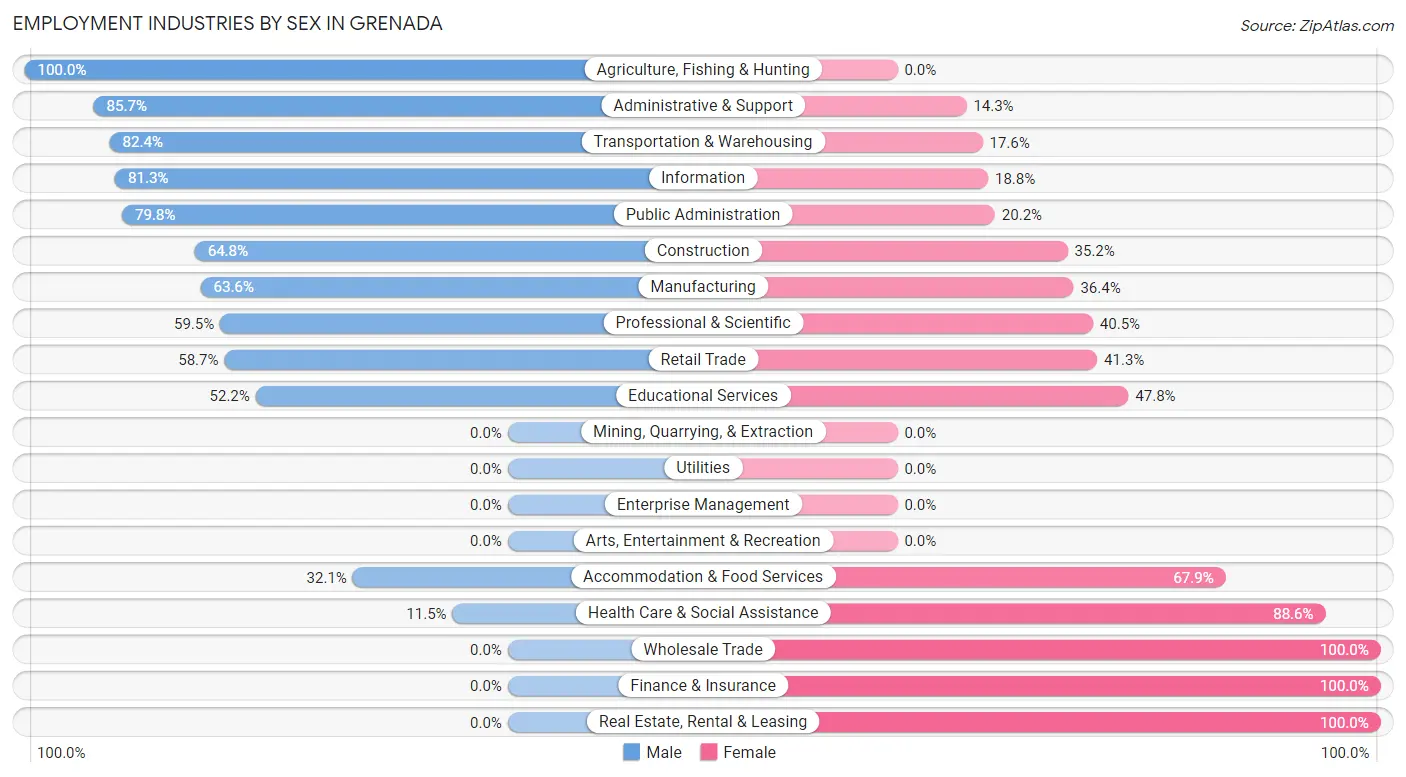
Employment Industries by Sex in Grenada
The Grenada industries that see more men than women are Agriculture, Fishing & Hunting (100.0%), Administrative & Support (85.7%), and Transportation & Warehousing (82.4%), whereas the industries that tend to have a higher number of women are Wholesale Trade (100.0%), Finance & Insurance (100.0%), and Real Estate, Rental & Leasing (100.0%).
| Industry | Male | Female |
| Agriculture, Fishing & Hunting | 18 (100.0%) | 0 (0.0%) |
| Mining, Quarrying, & Extraction | 0 (0.0%) | 0 (0.0%) |
| Construction | 342 (64.8%) | 186 (35.2%) |
| Manufacturing | 647 (63.6%) | 371 (36.4%) |
| Wholesale Trade | 0 (0.0%) | 15 (100.0%) |
| Retail Trade | 413 (58.7%) | 291 (41.3%) |
| Transportation & Warehousing | 131 (82.4%) | 28 (17.6%) |
| Utilities | 0 (0.0%) | 0 (0.0%) |
| Information | 91 (81.2%) | 21 (18.8%) |
| Finance & Insurance | 0 (0.0%) | 65 (100.0%) |
| Real Estate, Rental & Leasing | 0 (0.0%) | 9 (100.0%) |
| Professional & Scientific | 78 (59.5%) | 53 (40.5%) |
| Enterprise Management | 0 (0.0%) | 0 (0.0%) |
| Administrative & Support | 72 (85.7%) | 12 (14.3%) |
| Educational Services | 393 (52.2%) | 360 (47.8%) |
| Health Care & Social Assistance | 82 (11.5%) | 634 (88.5%) |
| Arts, Entertainment & Recreation | 0 (0.0%) | 0 (0.0%) |
| Accommodation & Food Services | 87 (32.1%) | 184 (67.9%) |
| Public Administration | 455 (79.8%) | 115 (20.2%) |
| Total | 2,898 (53.9%) | 2,482 (46.1%) |
Education in Grenada
School Enrollment in Grenada
The most common levels of schooling among the 3,231 students in Grenada are elementary school (798 | 24.7%), high school (490 | 15.2%), and graduate / professional (469 | 14.5%).
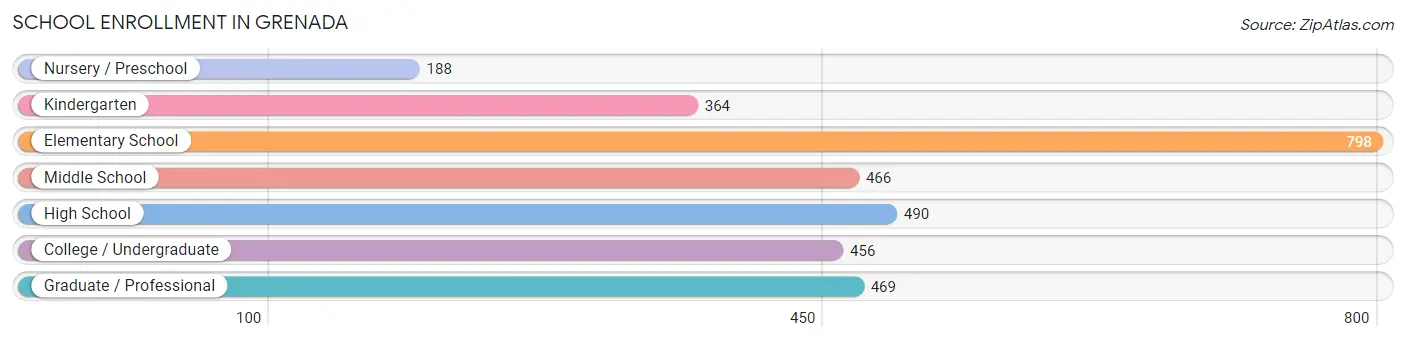
| School Level | # Students | % Students |
| Nursery / Preschool | 188 | 5.8% |
| Kindergarten | 364 | 11.3% |
| Elementary School | 798 | 24.7% |
| Middle School | 466 | 14.4% |
| High School | 490 | 15.2% |
| College / Undergraduate | 456 | 14.1% |
| Graduate / Professional | 469 | 14.5% |
| Total | 3,231 | 100.0% |
School Enrollment by Age by Funding Source in Grenada
Out of a total of 3,231 students who are enrolled in schools in Grenada, 249 (7.7%) attend a private institution, while the remaining 2,982 (92.3%) are enrolled in public schools. The age group of 18 to 19 year olds has the highest likelihood of being enrolled in private schools, with 54 (32.7% in the age bracket) enrolled. Conversely, the age group of 10 to 14 year olds has the lowest likelihood of being enrolled in a private school, with 468 (100.0% in the age bracket) attending a public institution.
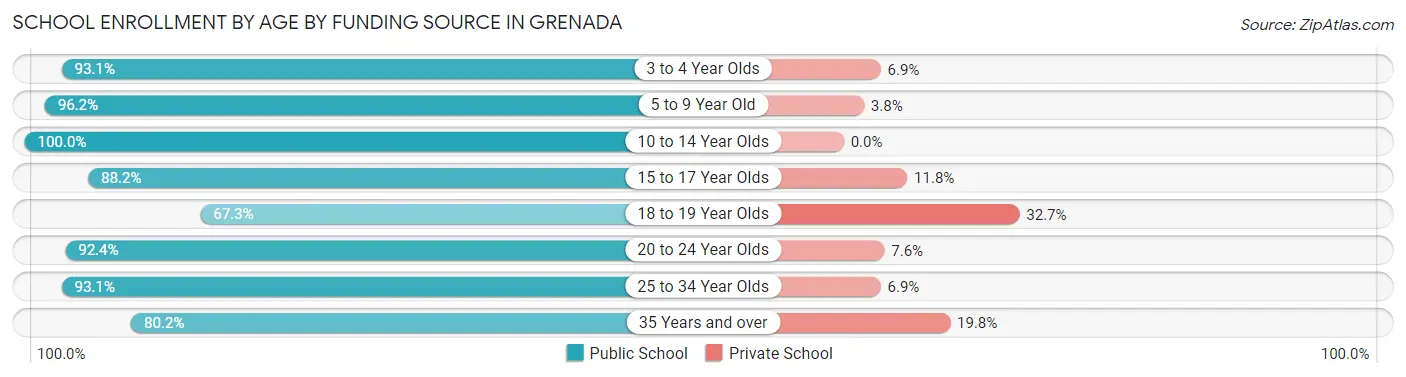
| Age Bracket | Public School | Private School |
| 3 to 4 Year Olds | 149 (93.1%) | 11 (6.9%) |
| 5 to 9 Year Old | 1,098 (96.2%) | 43 (3.8%) |
| 10 to 14 Year Olds | 468 (100.0%) | 0 (0.0%) |
| 15 to 17 Year Olds | 313 (88.2%) | 42 (11.8%) |
| 18 to 19 Year Olds | 111 (67.3%) | 54 (32.7%) |
| 20 to 24 Year Olds | 244 (92.4%) | 20 (7.6%) |
| 25 to 34 Year Olds | 406 (93.1%) | 30 (6.9%) |
| 35 Years and over | 194 (80.2%) | 48 (19.8%) |
| Total | 2,982 (92.3%) | 249 (7.7%) |
Educational Attainment by Field of Study in Grenada
Science & technology (431 | 19.9%), arts & humanities (402 | 18.6%), education (366 | 16.9%), business (364 | 16.8%), and bio, nature & agricultural (219 | 10.1%) are the most common fields of study among 2,166 individuals in Grenada who have obtained a bachelor's degree or higher.
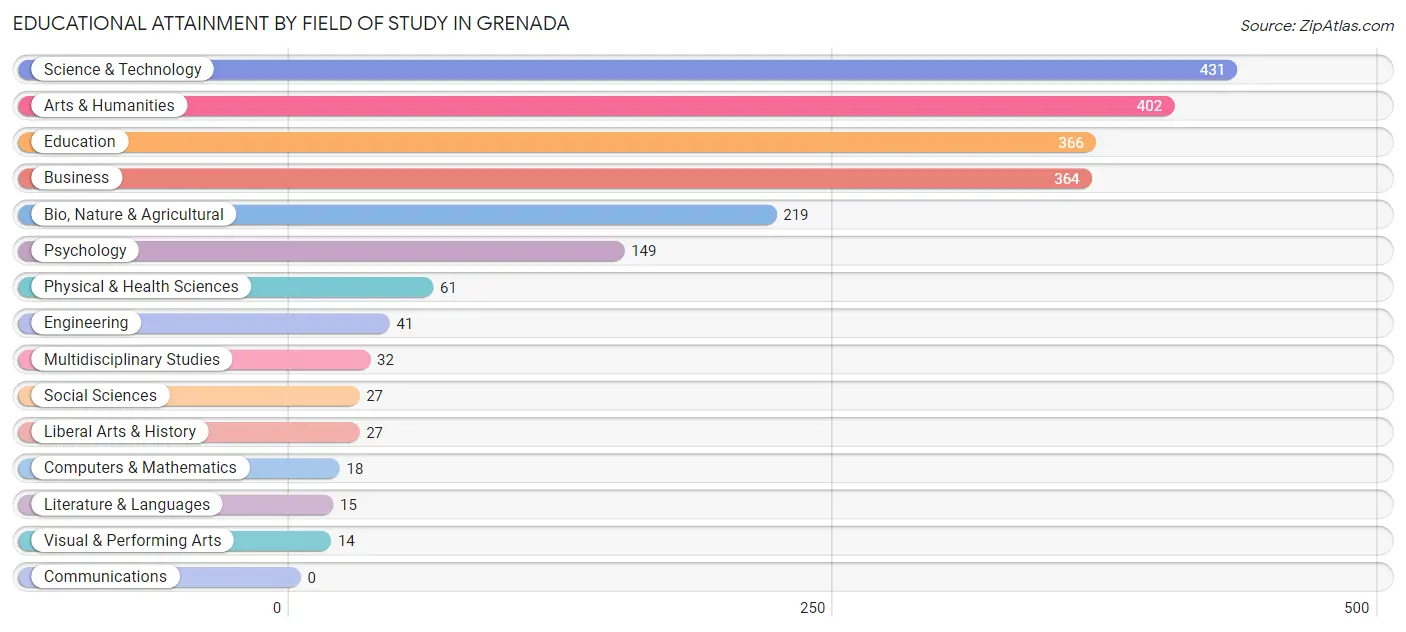
| Field of Study | # Graduates | % Graduates |
| Computers & Mathematics | 18 | 0.8% |
| Bio, Nature & Agricultural | 219 | 10.1% |
| Physical & Health Sciences | 61 | 2.8% |
| Psychology | 149 | 6.9% |
| Social Sciences | 27 | 1.3% |
| Engineering | 41 | 1.9% |
| Multidisciplinary Studies | 32 | 1.5% |
| Science & Technology | 431 | 19.9% |
| Business | 364 | 16.8% |
| Education | 366 | 16.9% |
| Literature & Languages | 15 | 0.7% |
| Liberal Arts & History | 27 | 1.3% |
| Visual & Performing Arts | 14 | 0.6% |
| Communications | 0 | 0.0% |
| Arts & Humanities | 402 | 18.6% |
| Total | 2,166 | 100.0% |
Transportation & Commute in Grenada
Vehicle Availability by Sex in Grenada
The most prevalent vehicle ownership categories in Grenada are males with 2 vehicles (1,237, accounting for 43.5%) and females with 2 vehicles (826, making up 50.8%).
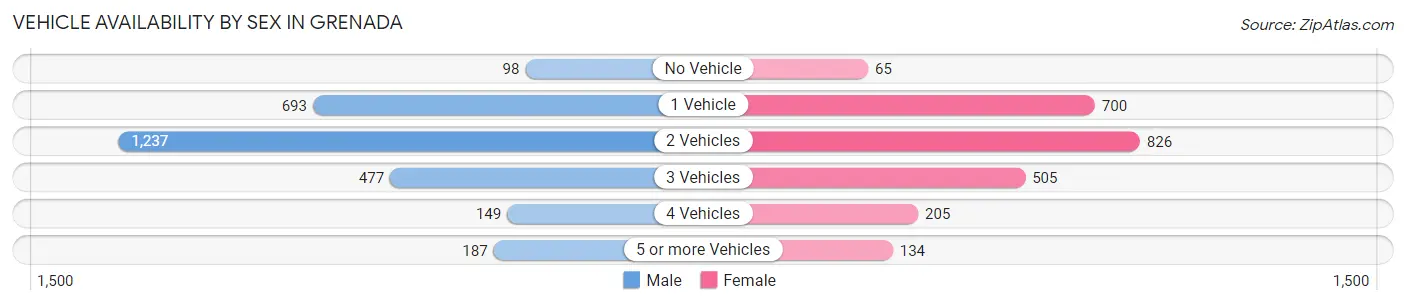
| Vehicles Available | Male | Female |
| No Vehicle | 98 (3.5%) | 65 (2.7%) |
| 1 Vehicle | 693 (24.4%) | 700 (28.7%) |
| 2 Vehicles | 1,237 (43.5%) | 826 (33.9%) |
| 3 Vehicles | 477 (16.8%) | 505 (20.7%) |
| 4 Vehicles | 149 (5.2%) | 205 (8.4%) |
| 5 or more Vehicles | 187 (6.6%) | 134 (5.5%) |
| Total | 2,841 (100.0%) | 2,435 (100.0%) |
Commute Time in Grenada
The most frequently occuring commute durations in Grenada are 5 to 9 minutes (1,870 commuters, 35.9%), 10 to 14 minutes (1,400 commuters, 26.9%), and 20 to 24 minutes (399 commuters, 7.7%).
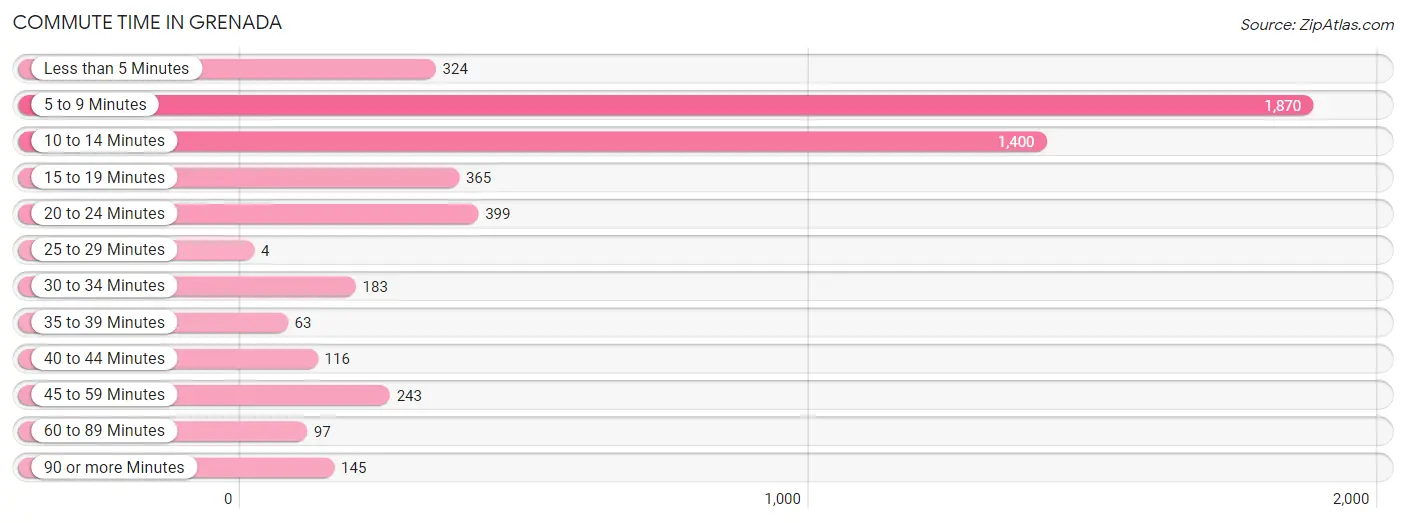
| Commute Time | # Commuters | % Commuters |
| Less than 5 Minutes | 324 | 6.2% |
| 5 to 9 Minutes | 1,870 | 35.9% |
| 10 to 14 Minutes | 1,400 | 26.9% |
| 15 to 19 Minutes | 365 | 7.0% |
| 20 to 24 Minutes | 399 | 7.7% |
| 25 to 29 Minutes | 4 | 0.1% |
| 30 to 34 Minutes | 183 | 3.5% |
| 35 to 39 Minutes | 63 | 1.2% |
| 40 to 44 Minutes | 116 | 2.2% |
| 45 to 59 Minutes | 243 | 4.7% |
| 60 to 89 Minutes | 97 | 1.9% |
| 90 or more Minutes | 145 | 2.8% |
Commute Time by Sex in Grenada
The most common commute times in Grenada are 5 to 9 minutes (921 commuters, 32.6%) for males and 5 to 9 minutes (949 commuters, 39.8%) for females.
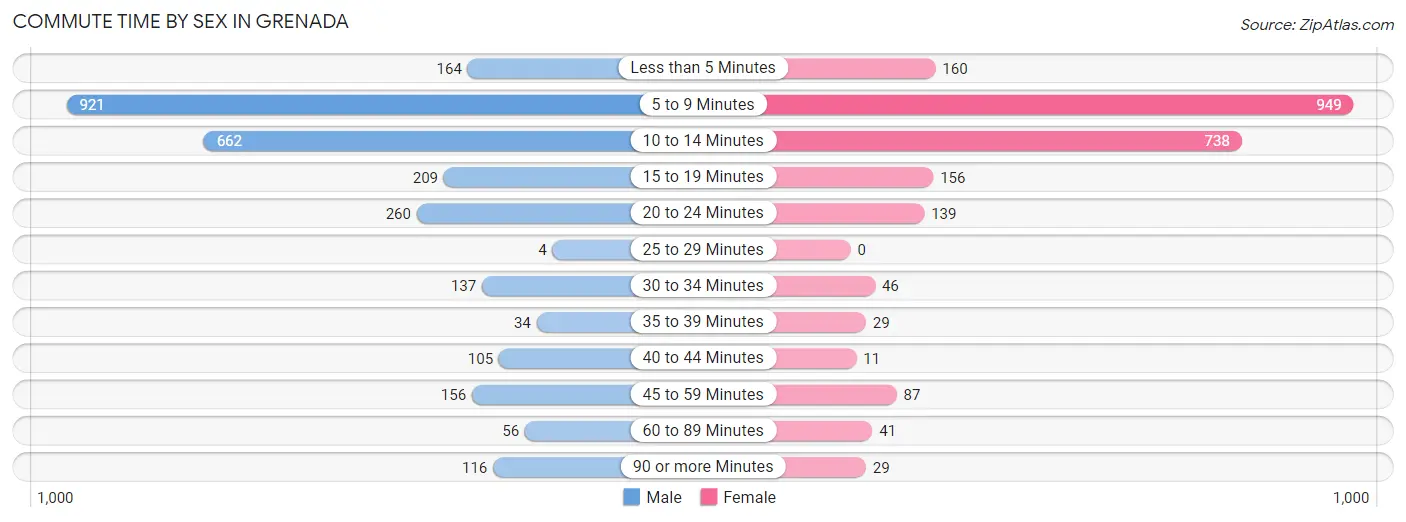
| Commute Time | Male | Female |
| Less than 5 Minutes | 164 (5.8%) | 160 (6.7%) |
| 5 to 9 Minutes | 921 (32.6%) | 949 (39.8%) |
| 10 to 14 Minutes | 662 (23.4%) | 738 (30.9%) |
| 15 to 19 Minutes | 209 (7.4%) | 156 (6.5%) |
| 20 to 24 Minutes | 260 (9.2%) | 139 (5.8%) |
| 25 to 29 Minutes | 4 (0.1%) | 0 (0.0%) |
| 30 to 34 Minutes | 137 (4.9%) | 46 (1.9%) |
| 35 to 39 Minutes | 34 (1.2%) | 29 (1.2%) |
| 40 to 44 Minutes | 105 (3.7%) | 11 (0.5%) |
| 45 to 59 Minutes | 156 (5.5%) | 87 (3.6%) |
| 60 to 89 Minutes | 56 (2.0%) | 41 (1.7%) |
| 90 or more Minutes | 116 (4.1%) | 29 (1.2%) |
Time of Departure to Work by Sex in Grenada
The most frequent times of departure to work in Grenada are 7:30 AM to 7:59 AM (412, 14.6%) for males and 7:30 AM to 7:59 AM (522, 21.9%) for females.
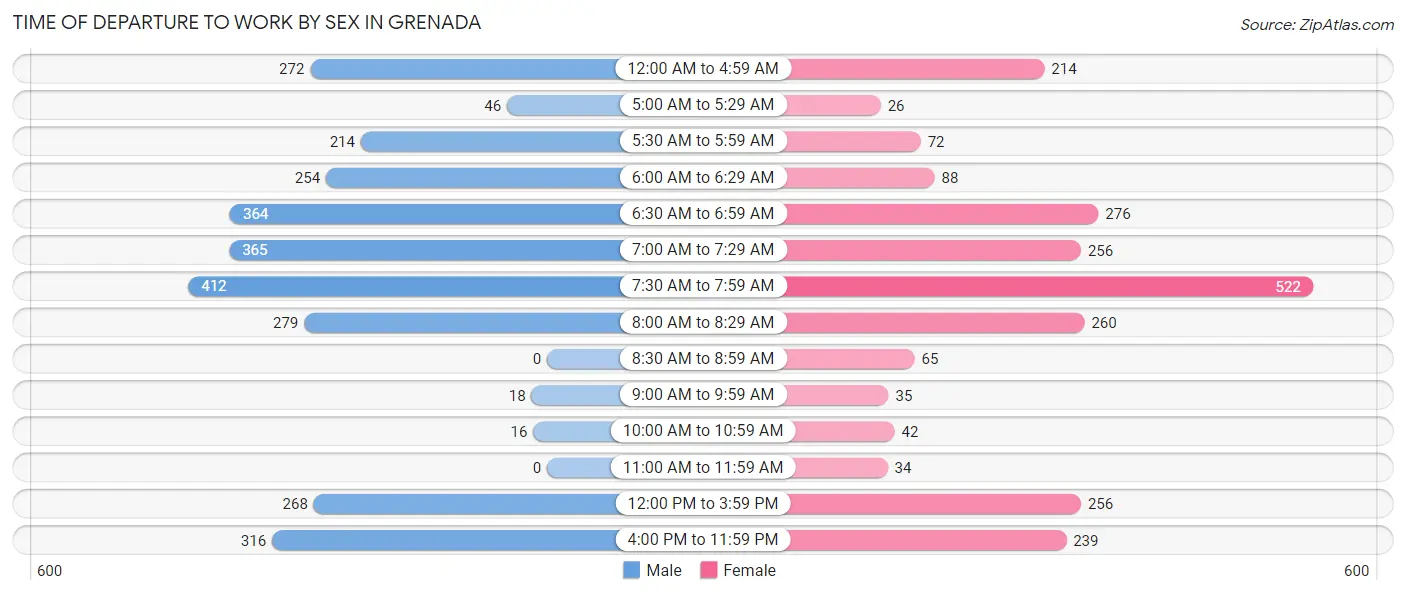
| Time of Departure | Male | Female |
| 12:00 AM to 4:59 AM | 272 (9.6%) | 214 (9.0%) |
| 5:00 AM to 5:29 AM | 46 (1.6%) | 26 (1.1%) |
| 5:30 AM to 5:59 AM | 214 (7.6%) | 72 (3.0%) |
| 6:00 AM to 6:29 AM | 254 (9.0%) | 88 (3.7%) |
| 6:30 AM to 6:59 AM | 364 (12.9%) | 276 (11.6%) |
| 7:00 AM to 7:29 AM | 365 (12.9%) | 256 (10.7%) |
| 7:30 AM to 7:59 AM | 412 (14.6%) | 522 (21.9%) |
| 8:00 AM to 8:29 AM | 279 (9.9%) | 260 (10.9%) |
| 8:30 AM to 8:59 AM | 0 (0.0%) | 65 (2.7%) |
| 9:00 AM to 9:59 AM | 18 (0.6%) | 35 (1.5%) |
| 10:00 AM to 10:59 AM | 16 (0.6%) | 42 (1.8%) |
| 11:00 AM to 11:59 AM | 0 (0.0%) | 34 (1.4%) |
| 12:00 PM to 3:59 PM | 268 (9.5%) | 256 (10.7%) |
| 4:00 PM to 11:59 PM | 316 (11.2%) | 239 (10.0%) |
| Total | 2,824 (100.0%) | 2,385 (100.0%) |
Housing Occupancy in Grenada
Occupancy by Ownership in Grenada
Of the total 5,074 dwellings in Grenada, owner-occupied units account for 3,010 (59.3%), while renter-occupied units make up 2,064 (40.7%).
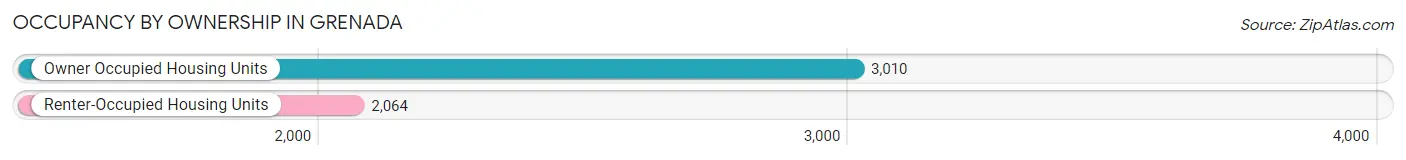
| Occupancy | # Housing Units | % Housing Units |
| Owner Occupied Housing Units | 3,010 | 59.3% |
| Renter-Occupied Housing Units | 2,064 | 40.7% |
| Total Occupied Housing Units | 5,074 | 100.0% |
Occupancy by Household Size in Grenada
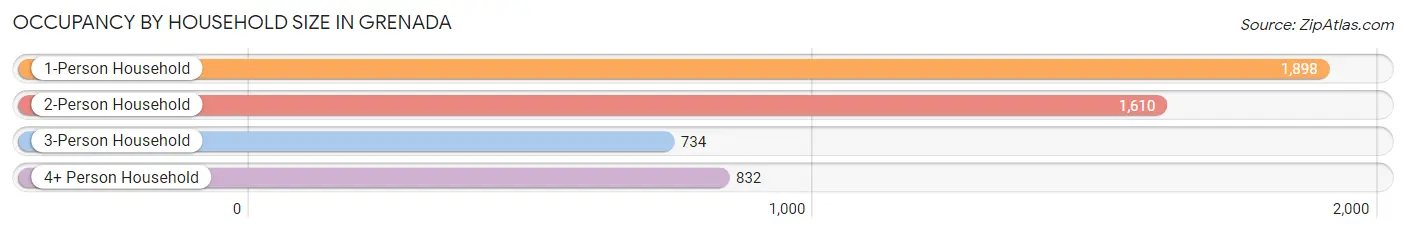
| Household Size | # Housing Units | % Housing Units |
| 1-Person Household | 1,898 | 37.4% |
| 2-Person Household | 1,610 | 31.7% |
| 3-Person Household | 734 | 14.5% |
| 4+ Person Household | 832 | 16.4% |
| Total Housing Units | 5,074 | 100.0% |
Occupancy by Ownership by Household Size in Grenada
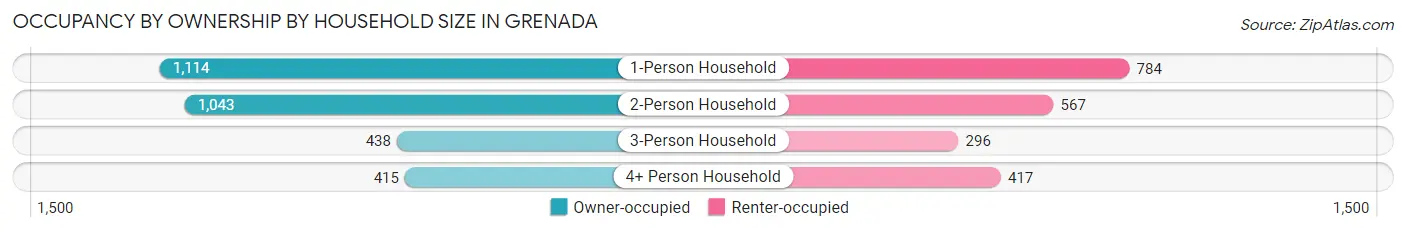
| Household Size | Owner-occupied | Renter-occupied |
| 1-Person Household | 1,114 (58.7%) | 784 (41.3%) |
| 2-Person Household | 1,043 (64.8%) | 567 (35.2%) |
| 3-Person Household | 438 (59.7%) | 296 (40.3%) |
| 4+ Person Household | 415 (49.9%) | 417 (50.1%) |
| Total Housing Units | 3,010 (59.3%) | 2,064 (40.7%) |
Occupancy by Educational Attainment in Grenada
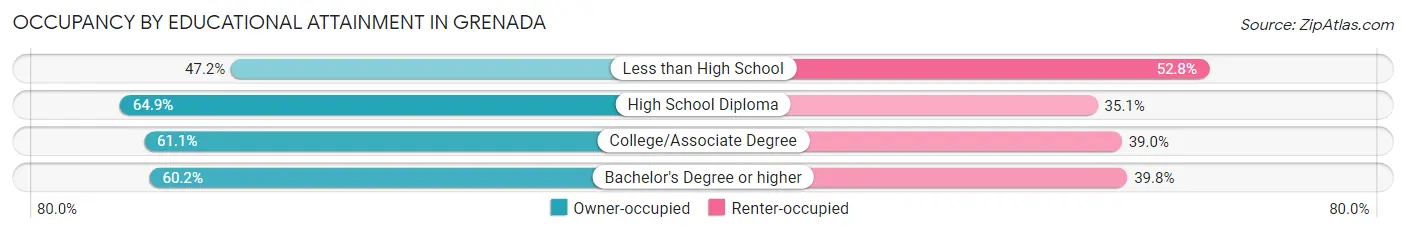
| Household Size | Owner-occupied | Renter-occupied |
| Less than High School | 462 (47.2%) | 516 (52.8%) |
| High School Diploma | 981 (64.9%) | 531 (35.1%) |
| College/Associate Degree | 840 (61.1%) | 536 (39.0%) |
| Bachelor's Degree or higher | 727 (60.2%) | 481 (39.8%) |
Occupancy by Age of Householder in Grenada
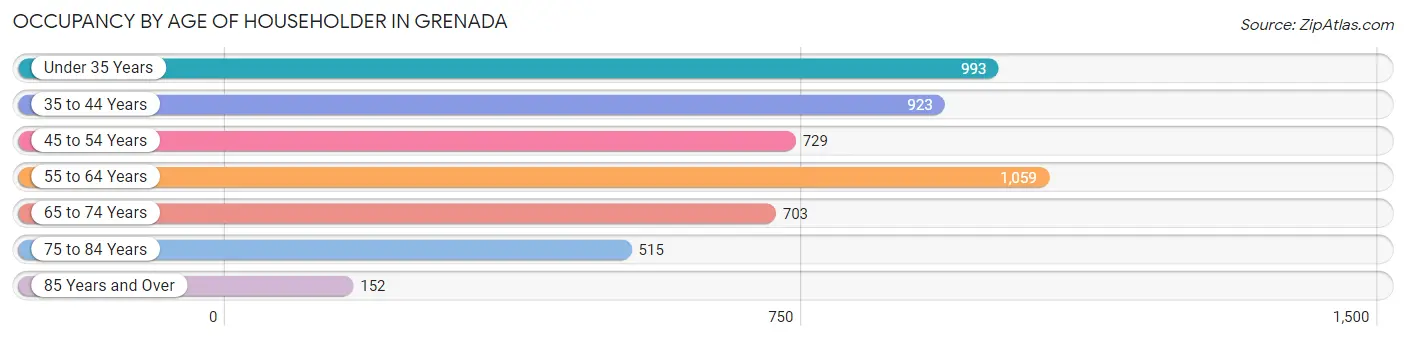
| Age Bracket | # Households | % Households |
| Under 35 Years | 993 | 19.6% |
| 35 to 44 Years | 923 | 18.2% |
| 45 to 54 Years | 729 | 14.4% |
| 55 to 64 Years | 1,059 | 20.9% |
| 65 to 74 Years | 703 | 13.9% |
| 75 to 84 Years | 515 | 10.2% |
| 85 Years and Over | 152 | 3.0% |
| Total | 5,074 | 100.0% |
Housing Finances in Grenada
Median Income by Occupancy in Grenada
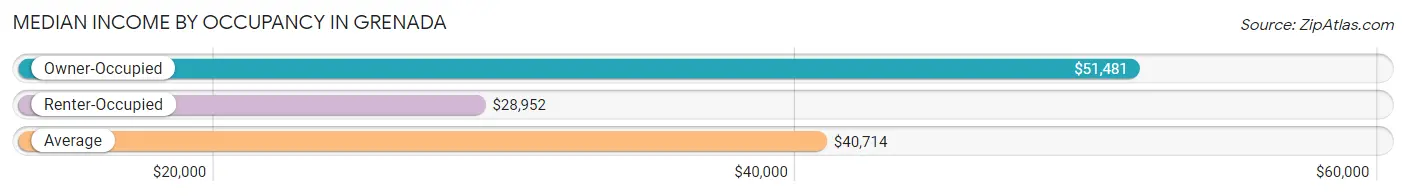
| Occupancy Type | # Households | Median Income |
| Owner-Occupied | 3,010 (59.3%) | $51,481 |
| Renter-Occupied | 2,064 (40.7%) | $28,952 |
| Average | 5,074 (100.0%) | $40,714 |
Occupancy by Householder Income Bracket in Grenada
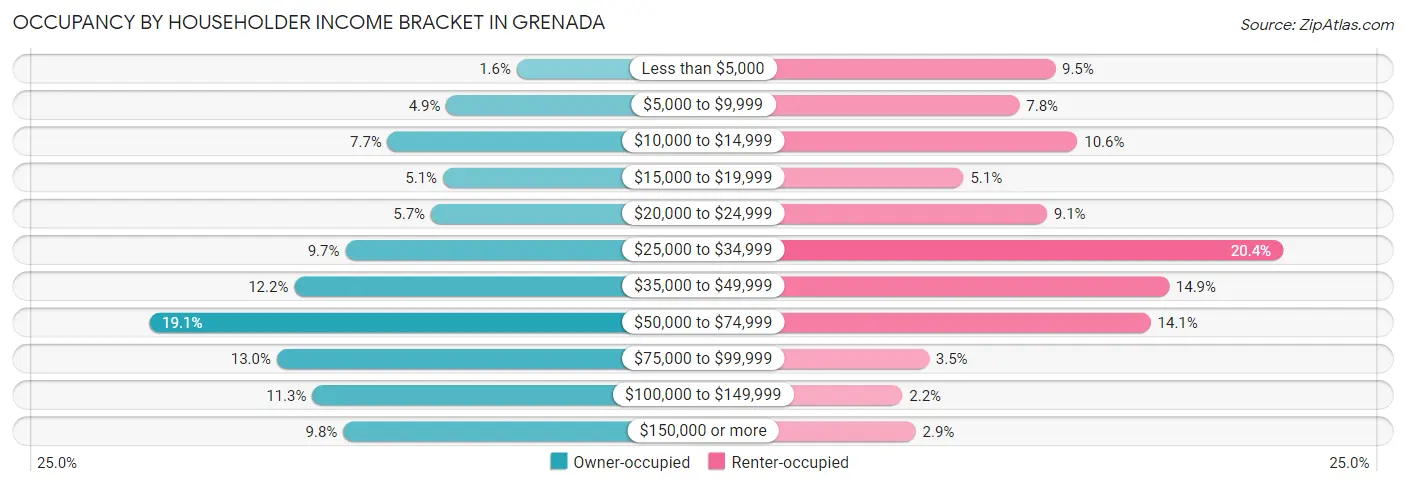
| Income Bracket | Owner-occupied | Renter-occupied |
| Less than $5,000 | 47 (1.6%) | 196 (9.5%) |
| $5,000 to $9,999 | 148 (4.9%) | 161 (7.8%) |
| $10,000 to $14,999 | 232 (7.7%) | 218 (10.6%) |
| $15,000 to $19,999 | 153 (5.1%) | 106 (5.1%) |
| $20,000 to $24,999 | 170 (5.7%) | 188 (9.1%) |
| $25,000 to $34,999 | 293 (9.7%) | 420 (20.3%) |
| $35,000 to $49,999 | 366 (12.2%) | 308 (14.9%) |
| $50,000 to $74,999 | 574 (19.1%) | 290 (14.1%) |
| $75,000 to $99,999 | 391 (13.0%) | 72 (3.5%) |
| $100,000 to $149,999 | 340 (11.3%) | 46 (2.2%) |
| $150,000 or more | 296 (9.8%) | 59 (2.9%) |
| Total | 3,010 (100.0%) | 2,064 (100.0%) |
Monthly Housing Cost Tiers in Grenada
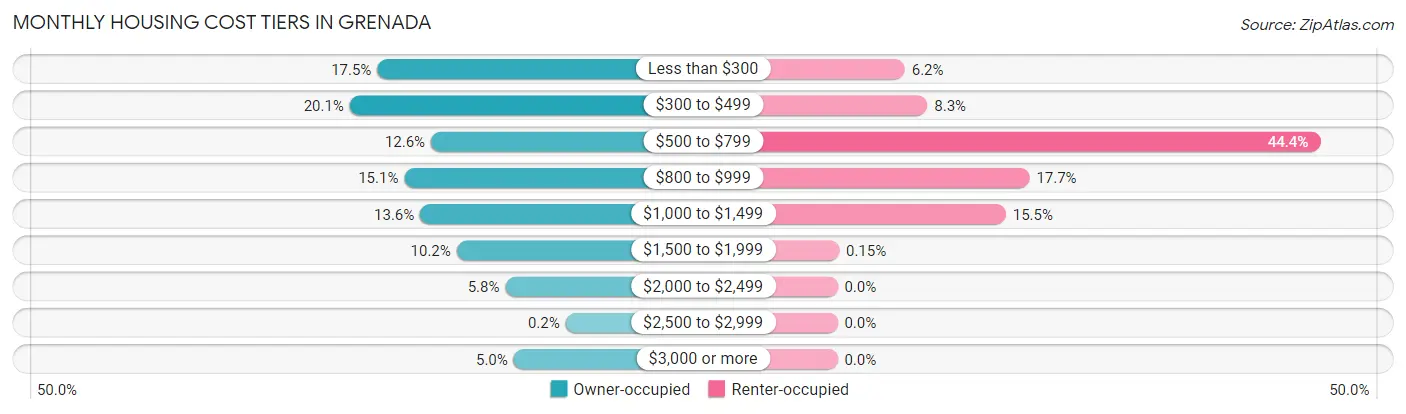
| Monthly Cost | Owner-occupied | Renter-occupied |
| Less than $300 | 528 (17.5%) | 128 (6.2%) |
| $300 to $499 | 604 (20.1%) | 171 (8.3%) |
| $500 to $799 | 379 (12.6%) | 917 (44.4%) |
| $800 to $999 | 453 (15.0%) | 365 (17.7%) |
| $1,000 to $1,499 | 409 (13.6%) | 320 (15.5%) |
| $1,500 to $1,999 | 308 (10.2%) | 3 (0.2%) |
| $2,000 to $2,499 | 173 (5.8%) | 0 (0.0%) |
| $2,500 to $2,999 | 6 (0.2%) | 0 (0.0%) |
| $3,000 or more | 150 (5.0%) | 0 (0.0%) |
| Total | 3,010 (100.0%) | 2,064 (100.0%) |
Physical Housing Characteristics in Grenada
Housing Structures in Grenada
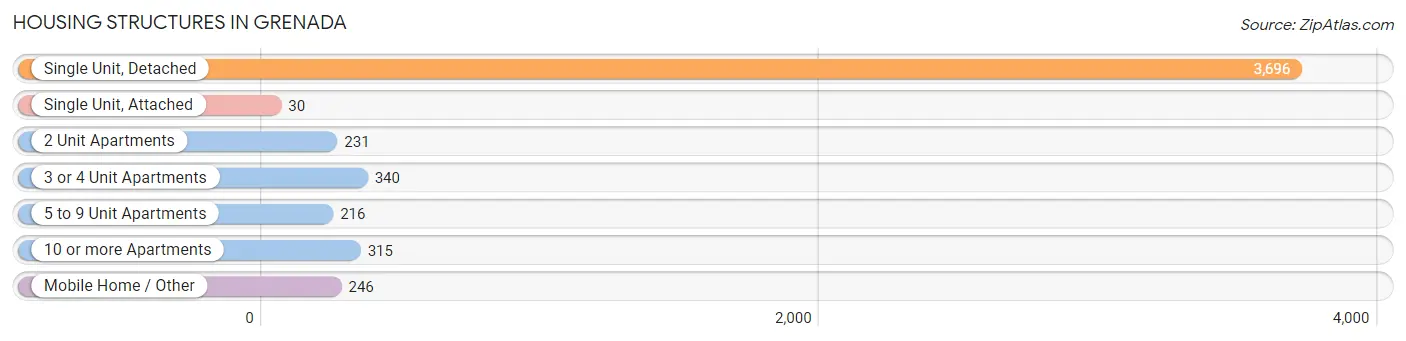
| Structure Type | # Housing Units | % Housing Units |
| Single Unit, Detached | 3,696 | 72.8% |
| Single Unit, Attached | 30 | 0.6% |
| 2 Unit Apartments | 231 | 4.5% |
| 3 or 4 Unit Apartments | 340 | 6.7% |
| 5 to 9 Unit Apartments | 216 | 4.3% |
| 10 or more Apartments | 315 | 6.2% |
| Mobile Home / Other | 246 | 4.9% |
| Total | 5,074 | 100.0% |
Housing Structures by Occupancy in Grenada
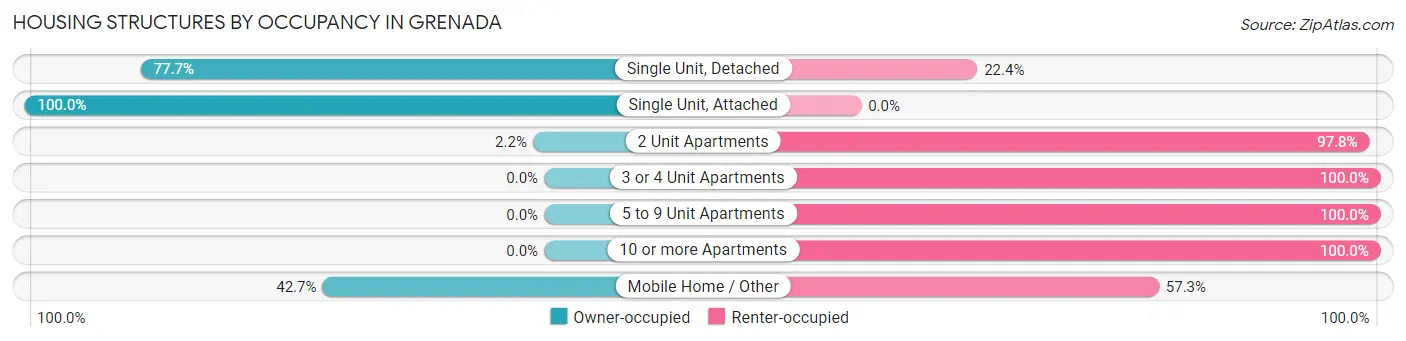
| Structure Type | Owner-occupied | Renter-occupied |
| Single Unit, Detached | 2,870 (77.6%) | 826 (22.4%) |
| Single Unit, Attached | 30 (100.0%) | 0 (0.0%) |
| 2 Unit Apartments | 5 (2.2%) | 226 (97.8%) |
| 3 or 4 Unit Apartments | 0 (0.0%) | 340 (100.0%) |
| 5 to 9 Unit Apartments | 0 (0.0%) | 216 (100.0%) |
| 10 or more Apartments | 0 (0.0%) | 315 (100.0%) |
| Mobile Home / Other | 105 (42.7%) | 141 (57.3%) |
| Total | 3,010 (59.3%) | 2,064 (40.7%) |
Housing Structures by Number of Rooms in Grenada
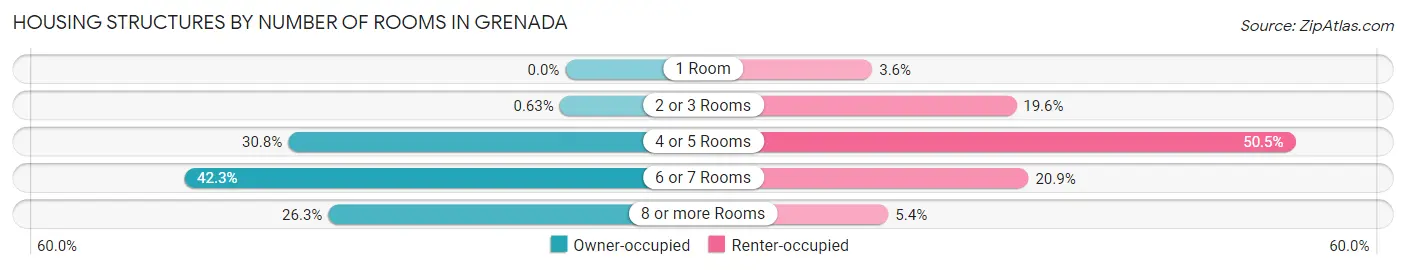
| Number of Rooms | Owner-occupied | Renter-occupied |
| 1 Room | 0 (0.0%) | 74 (3.6%) |
| 2 or 3 Rooms | 19 (0.6%) | 404 (19.6%) |
| 4 or 5 Rooms | 926 (30.8%) | 1,043 (50.5%) |
| 6 or 7 Rooms | 1,273 (42.3%) | 432 (20.9%) |
| 8 or more Rooms | 792 (26.3%) | 111 (5.4%) |
| Total | 3,010 (100.0%) | 2,064 (100.0%) |
Housing Structure by Heating Type in Grenada
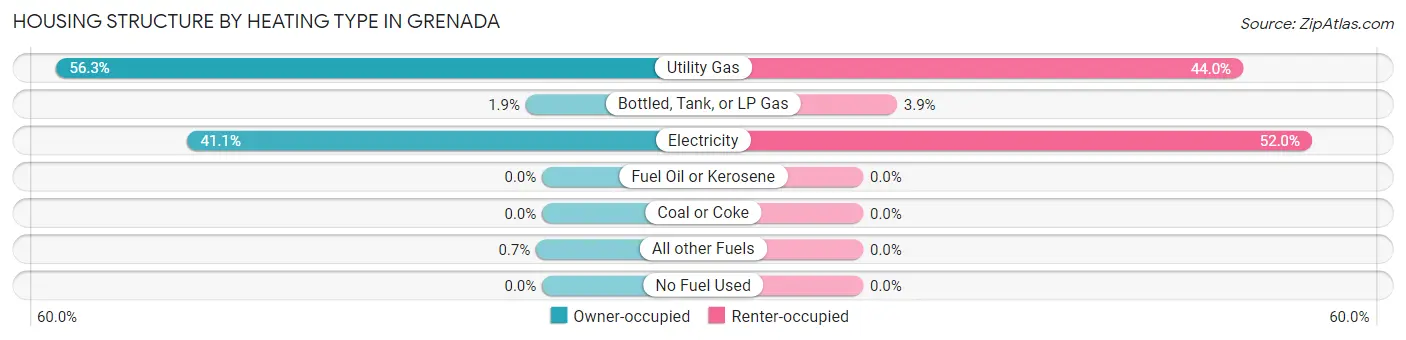
| Heating Type | Owner-occupied | Renter-occupied |
| Utility Gas | 1,695 (56.3%) | 909 (44.0%) |
| Bottled, Tank, or LP Gas | 57 (1.9%) | 81 (3.9%) |
| Electricity | 1,237 (41.1%) | 1,074 (52.0%) |
| Fuel Oil or Kerosene | 0 (0.0%) | 0 (0.0%) |
| Coal or Coke | 0 (0.0%) | 0 (0.0%) |
| All other Fuels | 21 (0.7%) | 0 (0.0%) |
| No Fuel Used | 0 (0.0%) | 0 (0.0%) |
| Total | 3,010 (100.0%) | 2,064 (100.0%) |
Household Vehicle Usage in Grenada
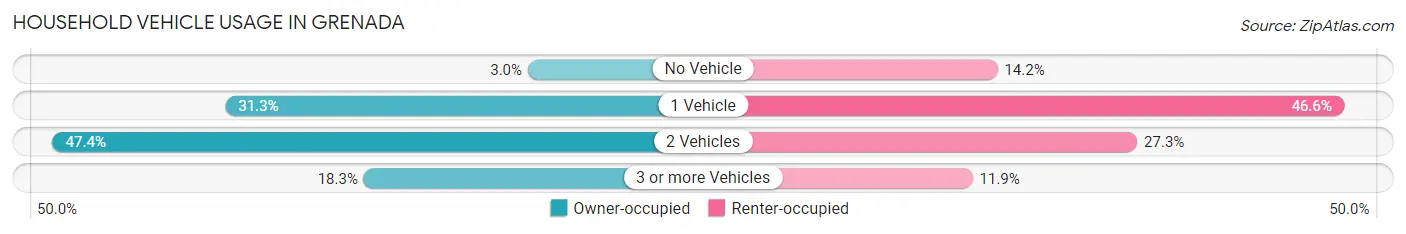
| Vehicles per Household | Owner-occupied | Renter-occupied |
| No Vehicle | 91 (3.0%) | 294 (14.2%) |
| 1 Vehicle | 941 (31.3%) | 961 (46.6%) |
| 2 Vehicles | 1,426 (47.4%) | 563 (27.3%) |
| 3 or more Vehicles | 552 (18.3%) | 246 (11.9%) |
| Total | 3,010 (100.0%) | 2,064 (100.0%) |
Real Estate & Mortgages in Grenada
Real Estate and Mortgage Overview in Grenada
| Characteristic | Without Mortgage | With Mortgage |
| Housing Units | 1,266 | 1,744 |
| Median Property Value | $87,500 | $183,000 |
| Median Household Income | $35,196 | $284 |
| Monthly Housing Costs | $362 | $150 |
| Real Estate Taxes | $926 | $286 |
Property Value by Mortgage Status in Grenada
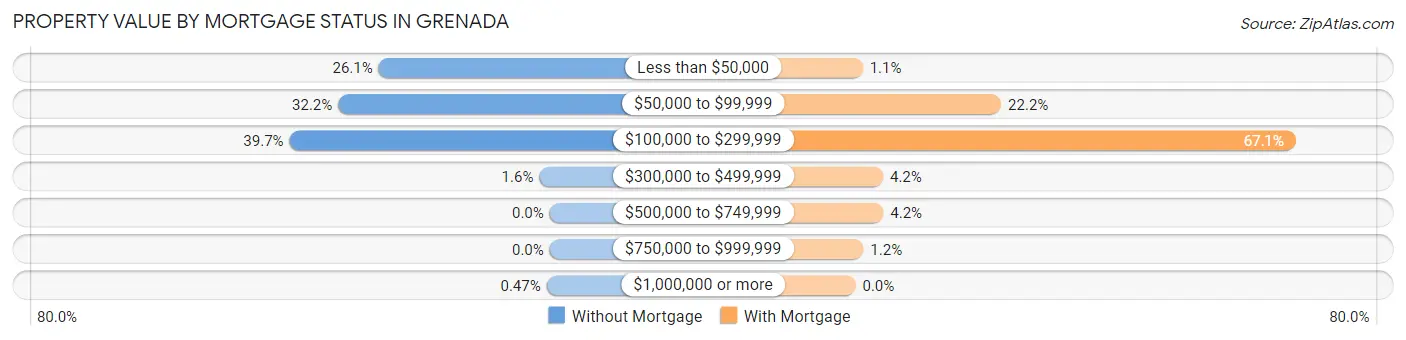
| Property Value | Without Mortgage | With Mortgage |
| Less than $50,000 | 330 (26.1%) | 19 (1.1%) |
| $50,000 to $99,999 | 408 (32.2%) | 387 (22.2%) |
| $100,000 to $299,999 | 502 (39.7%) | 1,170 (67.1%) |
| $300,000 to $499,999 | 20 (1.6%) | 73 (4.2%) |
| $500,000 to $749,999 | 0 (0.0%) | 74 (4.2%) |
| $750,000 to $999,999 | 0 (0.0%) | 21 (1.2%) |
| $1,000,000 or more | 6 (0.5%) | 0 (0.0%) |
| Total | 1,266 (100.0%) | 1,744 (100.0%) |
Household Income by Mortgage Status in Grenada
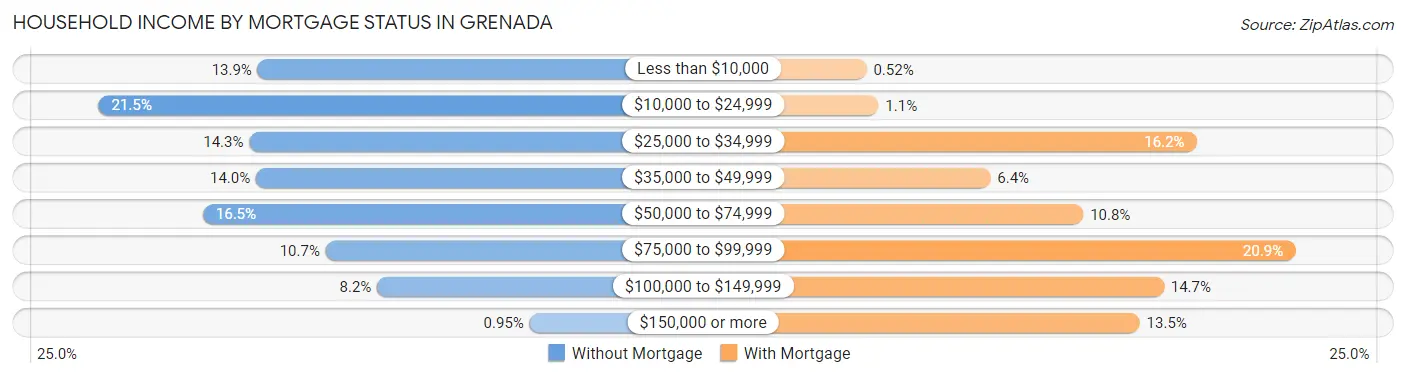
| Household Income | Without Mortgage | With Mortgage |
| Less than $10,000 | 176 (13.9%) | 9 (0.5%) |
| $10,000 to $24,999 | 272 (21.5%) | 19 (1.1%) |
| $25,000 to $34,999 | 181 (14.3%) | 283 (16.2%) |
| $35,000 to $49,999 | 177 (14.0%) | 112 (6.4%) |
| $50,000 to $74,999 | 209 (16.5%) | 189 (10.8%) |
| $75,000 to $99,999 | 135 (10.7%) | 365 (20.9%) |
| $100,000 to $149,999 | 104 (8.2%) | 256 (14.7%) |
| $150,000 or more | 12 (0.9%) | 236 (13.5%) |
| Total | 1,266 (100.0%) | 1,744 (100.0%) |
Property Value to Household Income Ratio in Grenada
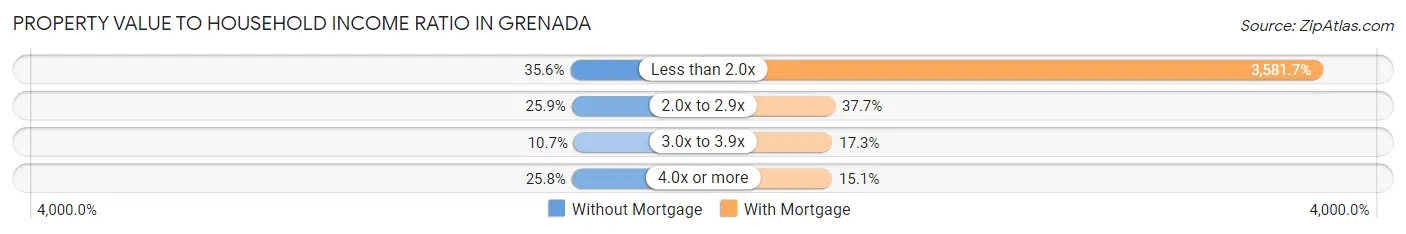
| Value-to-Income Ratio | Without Mortgage | With Mortgage |
| Less than 2.0x | 450 (35.5%) | 62,465 (3,581.7%) |
| 2.0x to 2.9x | 328 (25.9%) | 658 (37.7%) |
| 3.0x to 3.9x | 135 (10.7%) | 302 (17.3%) |
| 4.0x or more | 326 (25.8%) | 263 (15.1%) |
| Total | 1,266 (100.0%) | 1,744 (100.0%) |
Real Estate Taxes by Mortgage Status in Grenada
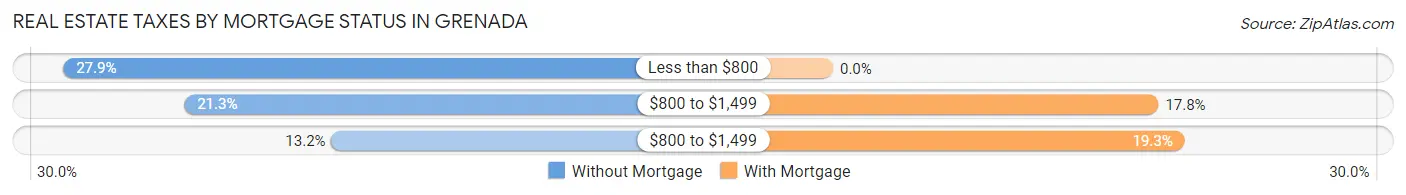
| Property Taxes | Without Mortgage | With Mortgage |
| Less than $800 | 353 (27.9%) | 0 (0.0%) |
| $800 to $1,499 | 269 (21.2%) | 311 (17.8%) |
| $800 to $1,499 | 167 (13.2%) | 336 (19.3%) |
| Total | 1,266 (100.0%) | 1,744 (100.0%) |
Health & Disability in Grenada
Health Insurance Coverage by Age in Grenada
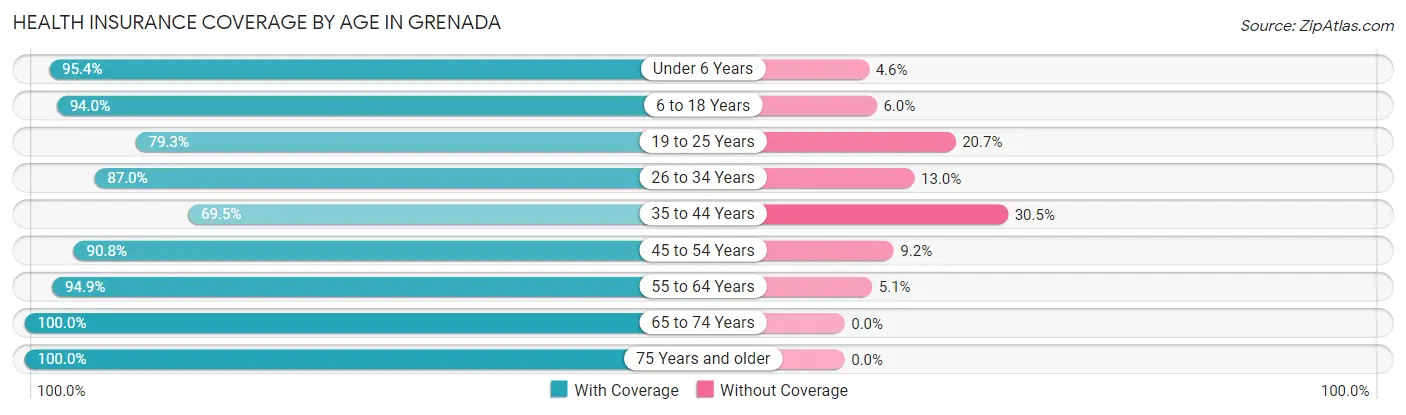
| Age Bracket | With Coverage | Without Coverage |
| Under 6 Years | 1,131 (95.4%) | 54 (4.6%) |
| 6 to 18 Years | 1,785 (94.0%) | 114 (6.0%) |
| 19 to 25 Years | 1,012 (79.3%) | 264 (20.7%) |
| 26 to 34 Years | 1,383 (87.0%) | 207 (13.0%) |
| 35 to 44 Years | 1,195 (69.5%) | 524 (30.5%) |
| 45 to 54 Years | 1,041 (90.8%) | 105 (9.2%) |
| 55 to 64 Years | 1,475 (94.9%) | 80 (5.1%) |
| 65 to 74 Years | 1,080 (100.0%) | 0 (0.0%) |
| 75 Years and older | 876 (100.0%) | 0 (0.0%) |
| Total | 10,978 (89.1%) | 1,348 (10.9%) |
Health Insurance Coverage by Citizenship Status in Grenada
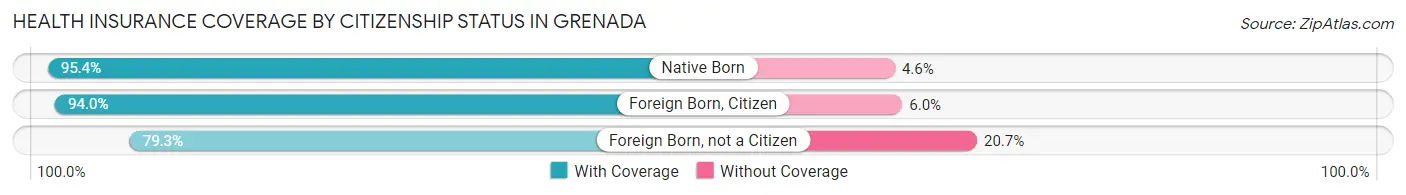
| Citizenship Status | With Coverage | Without Coverage |
| Native Born | 1,131 (95.4%) | 54 (4.6%) |
| Foreign Born, Citizen | 1,785 (94.0%) | 114 (6.0%) |
| Foreign Born, not a Citizen | 1,012 (79.3%) | 264 (20.7%) |
Health Insurance Coverage by Household Income in Grenada
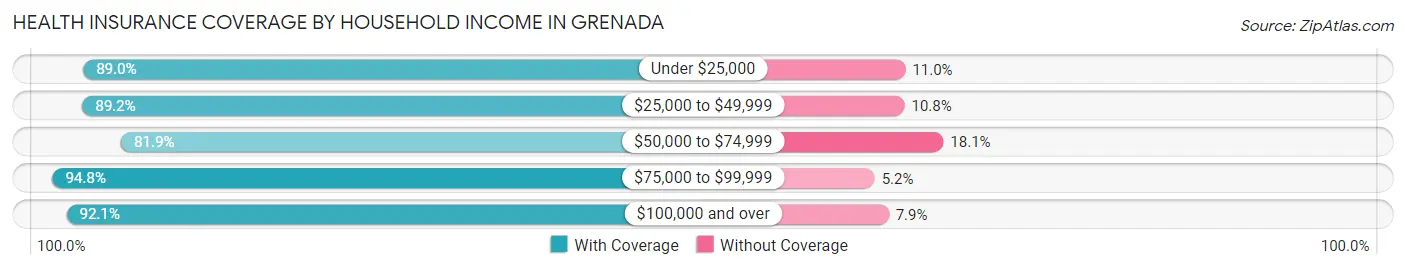
| Household Income | With Coverage | Without Coverage |
| Under $25,000 | 2,852 (89.0%) | 352 (11.0%) |
| $25,000 to $49,999 | 2,935 (89.2%) | 356 (10.8%) |
| $50,000 to $74,999 | 1,724 (81.9%) | 381 (18.1%) |
| $75,000 to $99,999 | 1,214 (94.8%) | 67 (5.2%) |
| $100,000 and over | 2,252 (92.1%) | 192 (7.9%) |
Public vs Private Health Insurance Coverage by Age in Grenada
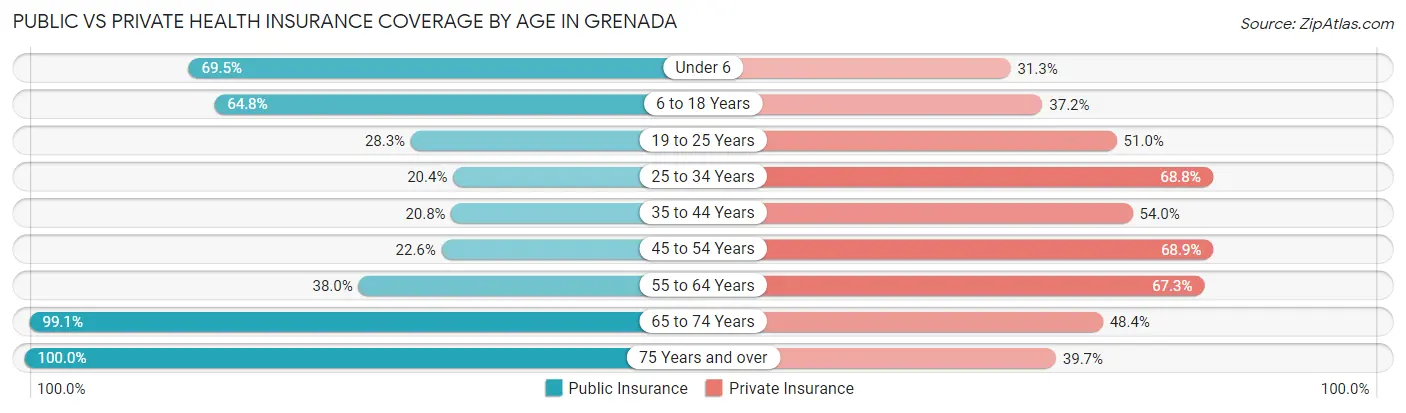
| Age Bracket | Public Insurance | Private Insurance |
| Under 6 | 824 (69.5%) | 371 (31.3%) |
| 6 to 18 Years | 1,230 (64.8%) | 707 (37.2%) |
| 19 to 25 Years | 361 (28.3%) | 651 (51.0%) |
| 25 to 34 Years | 325 (20.4%) | 1,094 (68.8%) |
| 35 to 44 Years | 357 (20.8%) | 928 (54.0%) |
| 45 to 54 Years | 259 (22.6%) | 790 (68.9%) |
| 55 to 64 Years | 591 (38.0%) | 1,046 (67.3%) |
| 65 to 74 Years | 1,070 (99.1%) | 523 (48.4%) |
| 75 Years and over | 876 (100.0%) | 348 (39.7%) |
| Total | 5,893 (47.8%) | 6,458 (52.4%) |
Disability Status by Sex by Age in Grenada
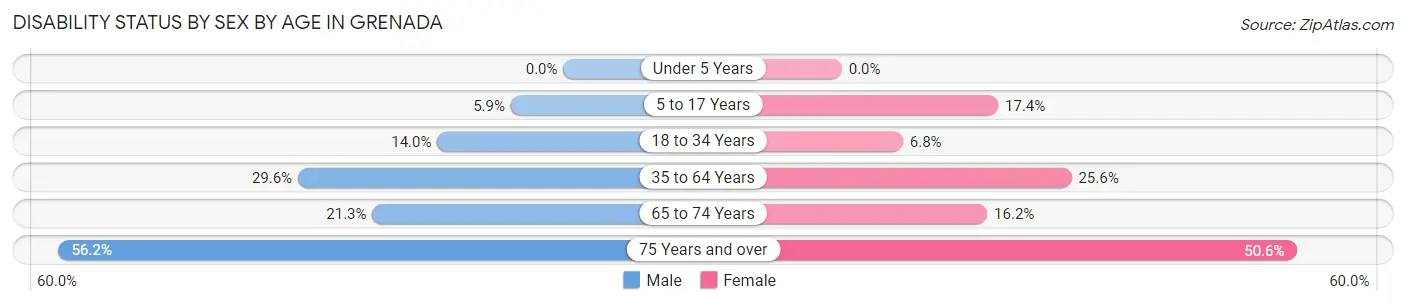
| Age Bracket | Male | Female |
| Under 5 Years | 0 (0.0%) | 0 (0.0%) |
| 5 to 17 Years | 60 (5.9%) | 176 (17.4%) |
| 18 to 34 Years | 211 (14.0%) | 101 (6.8%) |
| 35 to 64 Years | 686 (29.6%) | 537 (25.6%) |
| 65 to 74 Years | 97 (21.3%) | 101 (16.2%) |
| 75 Years and over | 217 (56.2%) | 248 (50.6%) |
Disability Class by Sex by Age in Grenada
Disability Class: Hearing Difficulty
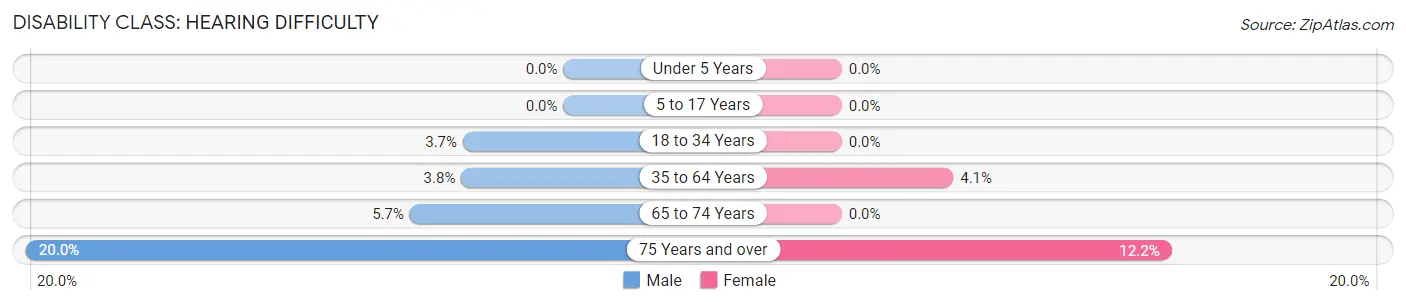
| Age Bracket | Male | Female |
| Under 5 Years | 0 (0.0%) | 0 (0.0%) |
| 5 to 17 Years | 0 (0.0%) | 0 (0.0%) |
| 18 to 34 Years | 56 (3.7%) | 0 (0.0%) |
| 35 to 64 Years | 88 (3.8%) | 87 (4.1%) |
| 65 to 74 Years | 26 (5.7%) | 0 (0.0%) |
| 75 Years and over | 77 (20.0%) | 60 (12.2%) |
Disability Class: Vision Difficulty
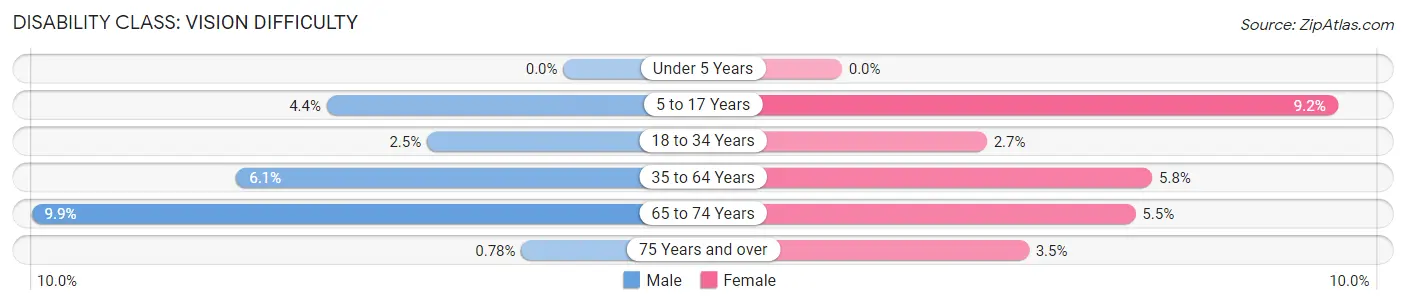
| Age Bracket | Male | Female |
| Under 5 Years | 0 (0.0%) | 0 (0.0%) |
| 5 to 17 Years | 45 (4.4%) | 93 (9.2%) |
| 18 to 34 Years | 38 (2.5%) | 40 (2.7%) |
| 35 to 64 Years | 141 (6.1%) | 121 (5.8%) |
| 65 to 74 Years | 45 (9.9%) | 34 (5.4%) |
| 75 Years and over | 3 (0.8%) | 17 (3.5%) |
Disability Class: Cognitive Difficulty
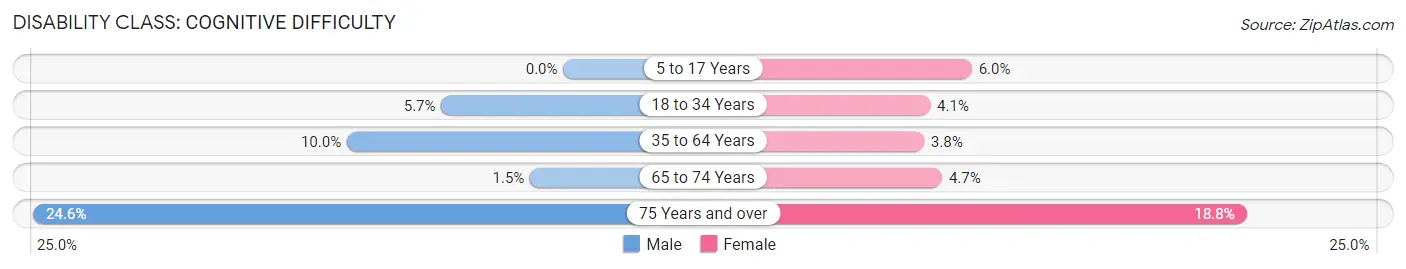
| Age Bracket | Male | Female |
| 5 to 17 Years | 0 (0.0%) | 61 (6.0%) |
| 18 to 34 Years | 85 (5.7%) | 61 (4.1%) |
| 35 to 64 Years | 233 (10.0%) | 80 (3.8%) |
| 65 to 74 Years | 7 (1.5%) | 29 (4.6%) |
| 75 Years and over | 95 (24.6%) | 92 (18.8%) |
Disability Class: Ambulatory Difficulty
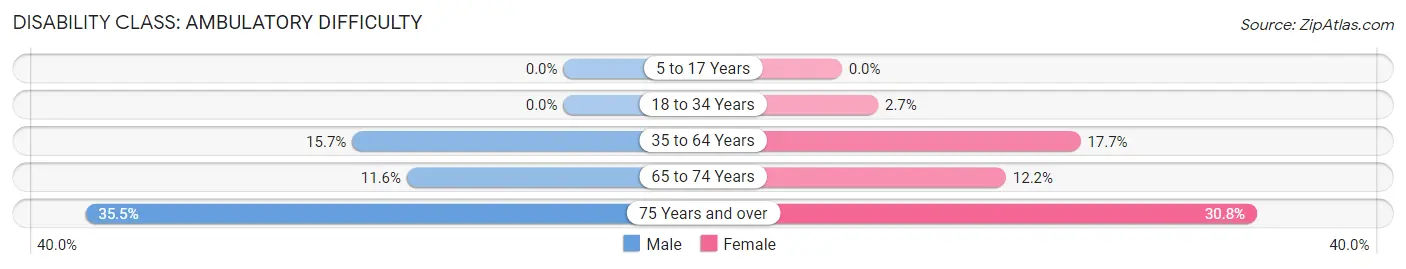
| Age Bracket | Male | Female |
| 5 to 17 Years | 0 (0.0%) | 0 (0.0%) |
| 18 to 34 Years | 0 (0.0%) | 40 (2.7%) |
| 35 to 64 Years | 364 (15.7%) | 372 (17.7%) |
| 65 to 74 Years | 53 (11.6%) | 76 (12.2%) |
| 75 Years and over | 137 (35.5%) | 151 (30.8%) |
Disability Class: Self-Care Difficulty
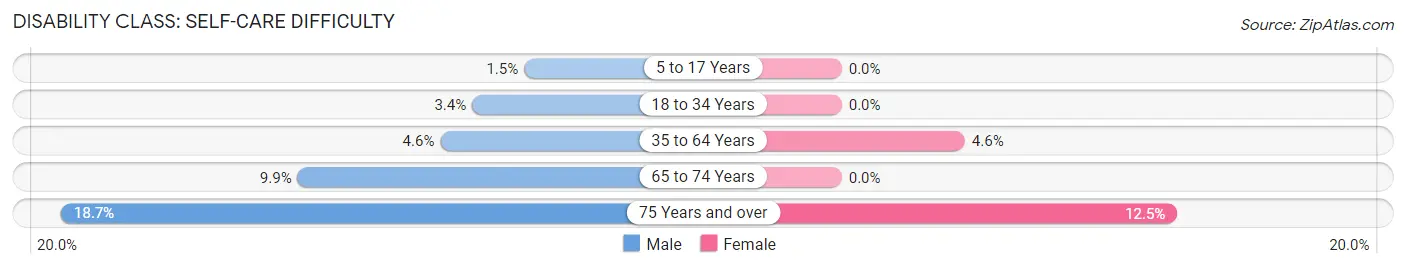
| Age Bracket | Male | Female |
| 5 to 17 Years | 15 (1.5%) | 0 (0.0%) |
| 18 to 34 Years | 51 (3.4%) | 0 (0.0%) |
| 35 to 64 Years | 106 (4.6%) | 96 (4.6%) |
| 65 to 74 Years | 45 (9.9%) | 0 (0.0%) |
| 75 Years and over | 72 (18.6%) | 61 (12.4%) |
Technology Access in Grenada
Computing Device Access in Grenada
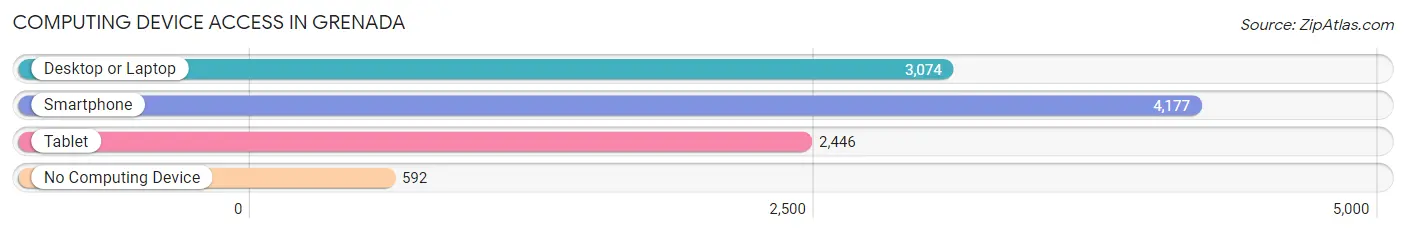
| Device Type | # Households | % Households |
| Desktop or Laptop | 3,074 | 60.6% |
| Smartphone | 4,177 | 82.3% |
| Tablet | 2,446 | 48.2% |
| No Computing Device | 592 | 11.7% |
| Total | 5,074 | 100.0% |
Internet Access in Grenada
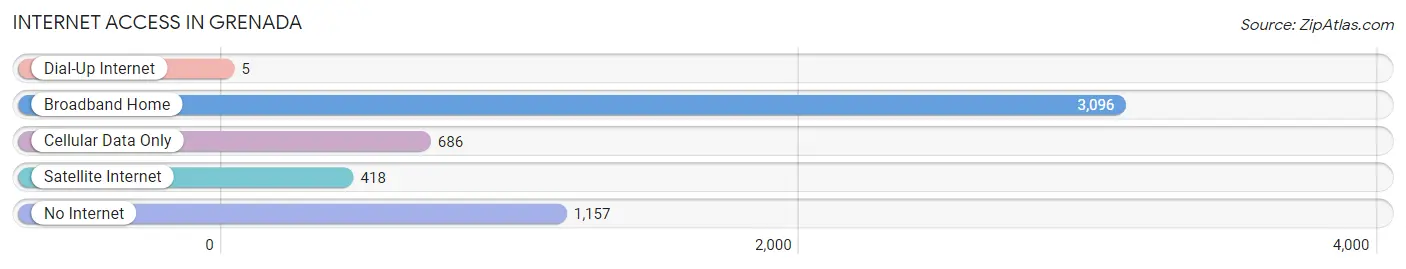
| Internet Type | # Households | % Households |
| Dial-Up Internet | 5 | 0.1% |
| Broadband Home | 3,096 | 61.0% |
| Cellular Data Only | 686 | 13.5% |
| Satellite Internet | 418 | 8.2% |
| No Internet | 1,157 | 22.8% |
| Total | 5,074 | 100.0% |
Grenada Summary
Grenada is a city located in the state of Mississippi, United States. It is the county seat of Grenada County and is located in the north-central part of the state. The city is situated on the banks of the Yalobusha River and is home to a population of 13,092 people as of the 2010 census.
Geography
Grenada is located at 33°45'N 89°50'W, in the north-central part of Mississippi. It is situated on the banks of the Yalobusha River, which flows through the city. The city is located in the Yazoo-Mississippi Delta region and is surrounded by rolling hills and forests. The city has a total area of 10.2 square miles, of which 10.1 square miles is land and 0.1 square miles is water.
History
Grenada was founded in 1836 and was named after the Spanish word for pomegranate. The city was originally a trading post and was the site of a major battle during the Civil War. After the war, the city experienced a period of growth and development, becoming an important center for cotton production and processing. The city was also home to a number of educational institutions, including the Grenada Female College, which was founded in 1851.
Economy
Grenada’s economy is largely based on agriculture and manufacturing. The city is home to a number of agricultural businesses, including cotton gins, grain elevators, and feed mills. The city is also home to a number of manufacturing companies, including furniture makers, automotive parts manufacturers, and food processing plants. The city is also home to a number of retail stores, restaurants, and other businesses.
Demographics
As of the 2010 census, the population of Grenada was 13,092. The racial makeup of the city was 57.2% African American, 37.7% White, 0.3% Native American, 0.7% Asian, 0.1% Pacific Islander, and 4.0% from other races. The median household income was $27,945 and the median family income was $35,945. The per capita income was $17,845.
Conclusion
Grenada is a city located in the state of Mississippi, United States. It is the county seat of Grenada County and is located in the north-central part of the state. The city is situated on the banks of the Yalobusha River and is home to a population of 13,092 people as of the 2010 census. The city’s economy is largely based on agriculture and manufacturing, and the city is home to a number of retail stores, restaurants, and other businesses. The racial makeup of the city was 57.2% African American, 37.7% White, 0.3% Native American, 0.7% Asian, 0.1% Pacific Islander, and 4.0% from other races. The median household income was $27,945 and the median family income was $35,945.
Common Questions
What is the Total Population of Grenada?
Total Population of Grenada is 12,594.
What is the Total Male Population of Grenada?
Total Male Population of Grenada is 6,412.
What is the Total Female Population of Grenada?
Total Female Population of Grenada is 6,182.
What is the Ratio of Males per 100 Females in Grenada?
There are 103.72 Males per 100 Females in Grenada.
What is the Ratio of Females per 100 Males in Grenada?
There are 96.41 Females per 100 Males in Grenada.
What is the Median Population Age in Grenada?
Median Population Age in Grenada is 37.1 Years.
What is the Average Family Size in Grenada
Average Family Size in Grenada is 3.3 People.
What is the Average Household Size in Grenada
Average Household Size in Grenada is 2.4 People.
What is Per Capita Income in Grenada?
Per Capita income in Grenada is $25,764.
What is the Median Family Income in Grenada?
Median Family Income in Grenada is $56,487.
What is the Median Household income in Grenada?
Median Household Income in Grenada is $40,714.
What is Income or Wage Gap in Grenada?
Income or Wage Gap in Grenada is 16.6%.
Women in Grenada earn 83.4 cents for every dollar earned by a man.
What is Inequality or Gini Index in Grenada?
Inequality or Gini Index in Grenada is 0.51.
How Large is the Labor Force in Grenada?
There are 5,744 People in the Labor Forcein in Grenada.
What is the Percentage of People in the Labor Force in Grenada?
58.0% of People are in the Labor Force in Grenada.
What is the Unemployment Rate in Grenada?
Unemployment Rate in Grenada is 6.3%.