Mississippi State, MS
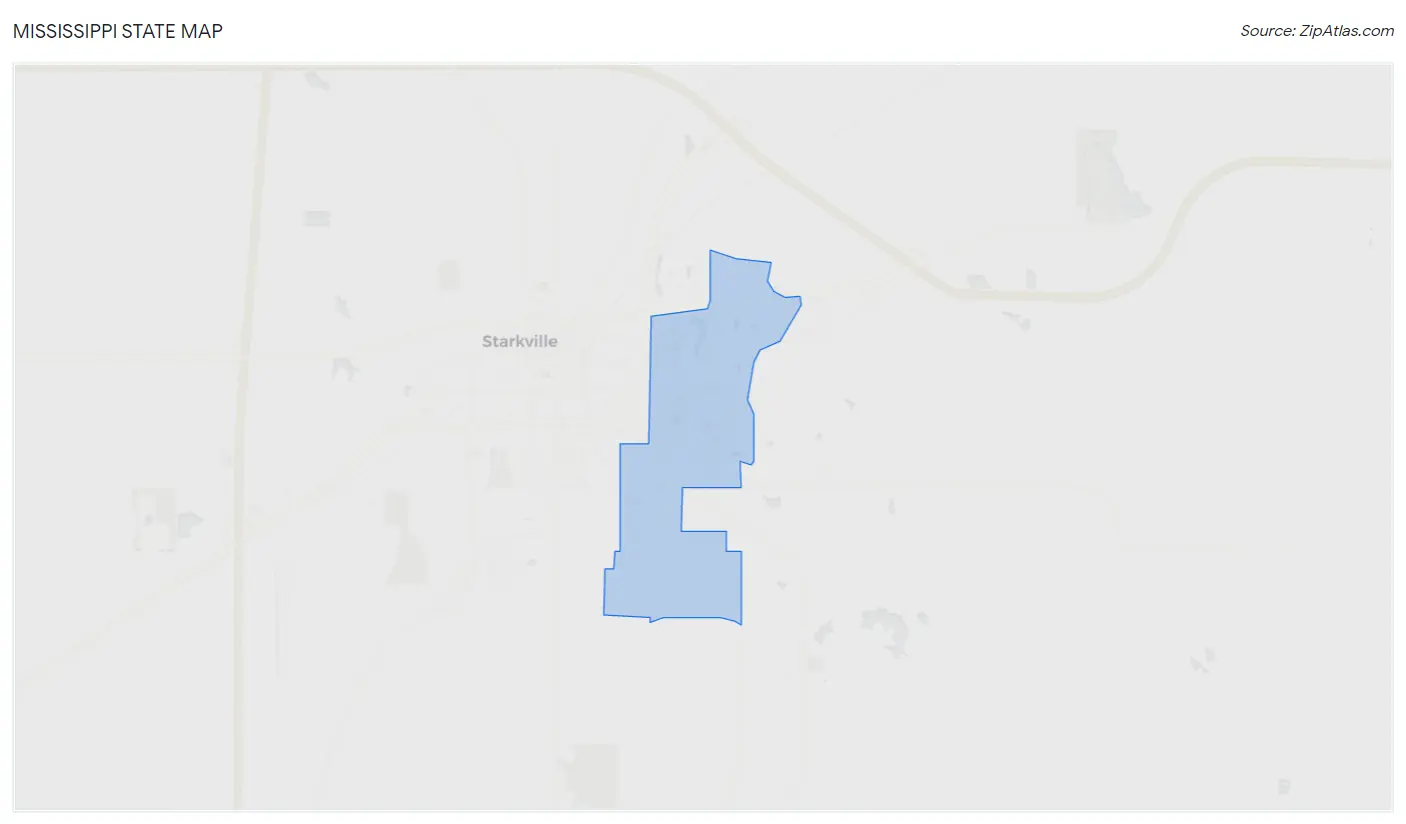
Mississippi State Map
Mississippi State Overview
4,095
TOTAL POPULATION
1,433
MALE POPULATION
2,662
FEMALE POPULATION
53.83
MALES / 100 FEMALES
185.76
FEMALES / 100 MALES
19.3
MEDIAN AGE
2.2
AVG FAMILY SIZE
1.1
AVG HOUSEHOLD SIZE
$7,326
PER CAPITA INCOME
22.3%
WAGE / INCOME GAP [ % ]
77.7¢/ $1
WAGE / INCOME GAP [ $ ]
0.02
INEQUALITY / GINI INDEX
1,114
LABOR FORCE [ PEOPLE ]
27.2%
PERCENT IN LABOR FORCE
10.9%
UNEMPLOYMENT RATE
Mississippi State Zip Codes
Mississippi State Area Codes
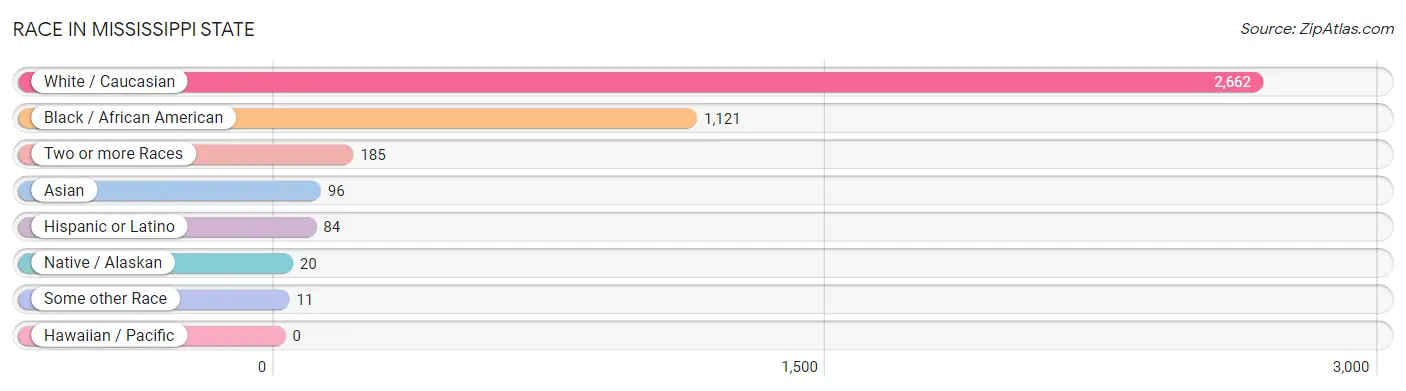
Race in Mississippi State
The most populous races in Mississippi State are White / Caucasian (2,662 | 65.0%), Black / African American (1,121 | 27.4%), and Two or more Races (185 | 4.5%).
| Race | # Population | % Population |
| Asian | 96 | 2.3% |
| Black / African American | 1,121 | 27.4% |
| Hawaiian / Pacific | 0 | 0.0% |
| Hispanic or Latino | 84 | 2.1% |
| Native / Alaskan | 20 | 0.5% |
| White / Caucasian | 2,662 | 65.0% |
| Two or more Races | 185 | 4.5% |
| Some other Race | 11 | 0.3% |
| Total | 4,095 | 100.0% |
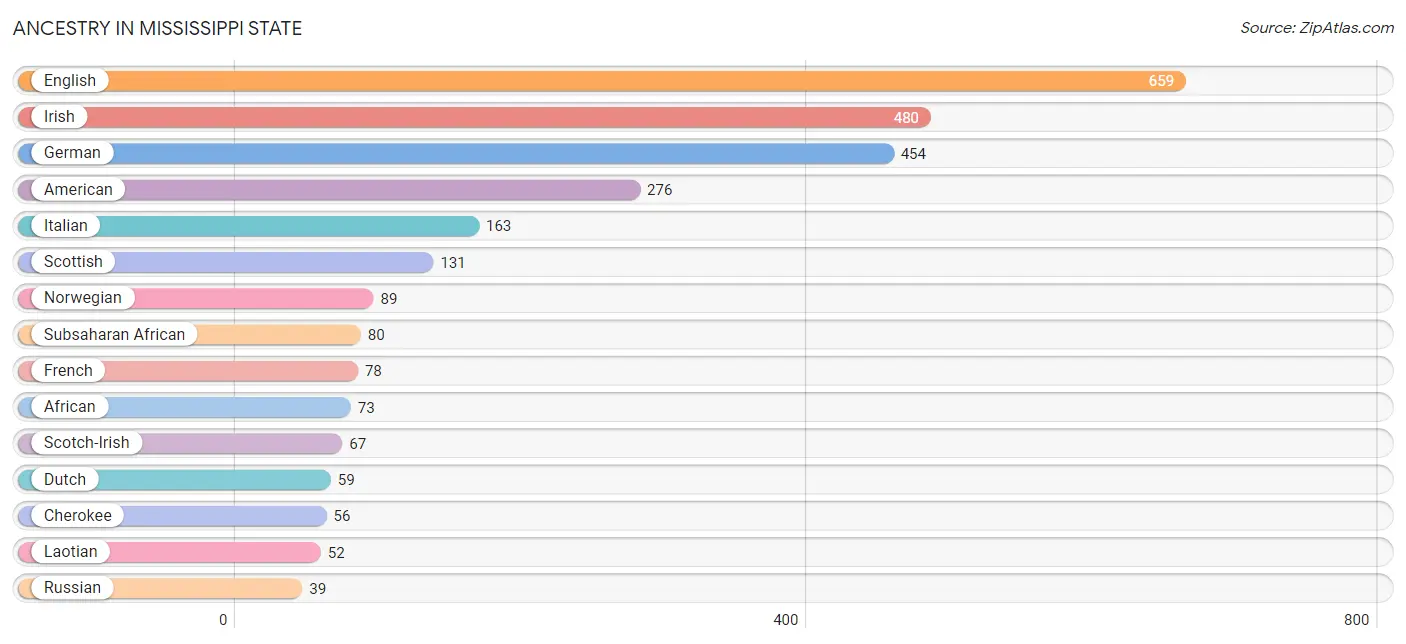
Ancestry in Mississippi State
The most populous ancestries reported in Mississippi State are English (659 | 16.1%), Irish (480 | 11.7%), German (454 | 11.1%), American (276 | 6.7%), and Italian (163 | 4.0%), together accounting for 49.6% of all Mississippi State residents.
| Ancestry | # Population | % Population |
| African | 73 | 1.8% |
| American | 276 | 6.7% |
| Apache | 7 | 0.2% |
| Arab | 19 | 0.5% |
| Bhutanese | 10 | 0.2% |
| Brazilian | 4 | 0.1% |
| British | 4 | 0.1% |
| Burmese | 28 | 0.7% |
| Central American | 11 | 0.3% |
| Cherokee | 56 | 1.4% |
| Choctaw | 37 | 0.9% |
| Colombian | 8 | 0.2% |
| Comanche | 9 | 0.2% |
| Croatian | 9 | 0.2% |
| Czech | 7 | 0.2% |
| Danish | 10 | 0.2% |
| Dominican | 9 | 0.2% |
| Dutch | 59 | 1.4% |
| English | 659 | 16.1% |
| European | 32 | 0.8% |
| French | 78 | 1.9% |
| German | 454 | 11.1% |
| Greek | 7 | 0.2% |
| Honduran | 11 | 0.3% |
| Indian (Asian) | 17 | 0.4% |
| Irish | 480 | 11.7% |
| Italian | 163 | 4.0% |
| Korean | 20 | 0.5% |
| Laotian | 52 | 1.3% |
| Lebanese | 12 | 0.3% |
| Mexican | 31 | 0.8% |
| Northern European | 14 | 0.3% |
| Norwegian | 89 | 2.2% |
| Peruvian | 20 | 0.5% |
| Polish | 38 | 0.9% |
| Puerto Rican | 5 | 0.1% |
| Russian | 39 | 0.9% |
| Scandinavian | 6 | 0.2% |
| Scotch-Irish | 67 | 1.6% |
| Scottish | 131 | 3.2% |
| South American | 28 | 0.7% |
| Sri Lankan | 34 | 0.8% |
| Subsaharan African | 80 | 1.9% |
| Thai | 37 | 0.9% |
| Ukrainian | 16 | 0.4% |
| Vietnamese | 4 | 0.1% |
| Welsh | 7 | 0.2% | View All 47 Rows |
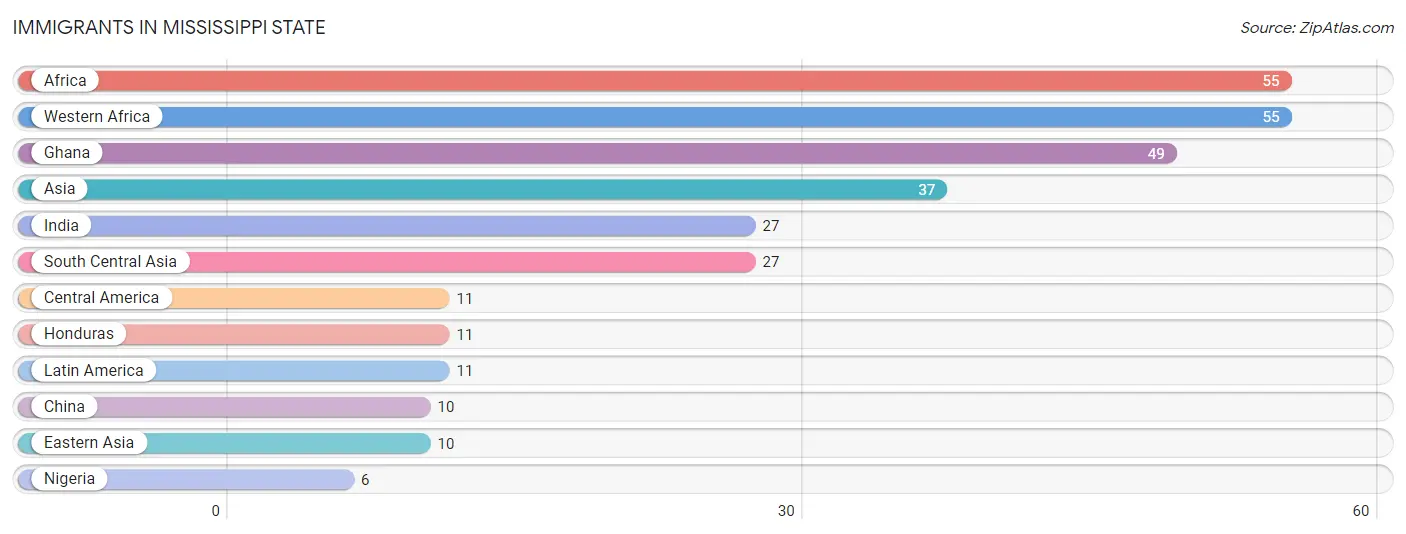
Immigrants in Mississippi State
The most numerous immigrant groups reported in Mississippi State came from Africa (55 | 1.3%), Western Africa (55 | 1.3%), Ghana (49 | 1.2%), Asia (37 | 0.9%), and India (27 | 0.7%), together accounting for 5.4% of all Mississippi State residents.
| Immigration Origin | # Population | % Population |
| Africa | 55 | 1.3% |
| Asia | 37 | 0.9% |
| Central America | 11 | 0.3% |
| China | 10 | 0.2% |
| Eastern Asia | 10 | 0.2% |
| Ghana | 49 | 1.2% |
| Honduras | 11 | 0.3% |
| India | 27 | 0.7% |
| Latin America | 11 | 0.3% |
| Nigeria | 6 | 0.2% |
| South Central Asia | 27 | 0.7% |
| Western Africa | 55 | 1.3% | View All 12 Rows |
Sex and Age in Mississippi State
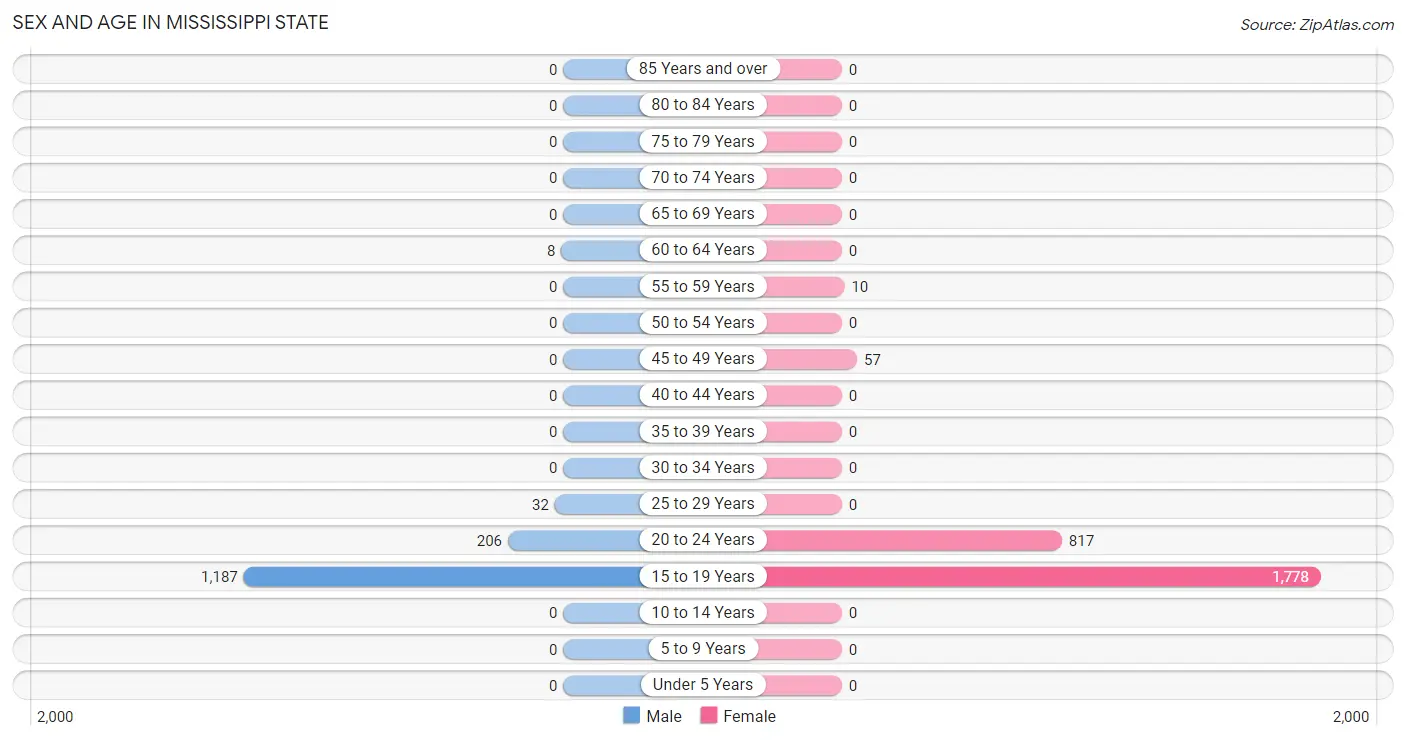
Sex and Age in Mississippi State
The most populous age groups in Mississippi State are 15 to 19 Years (1,187 | 82.8%) for men and 15 to 19 Years (1,778 | 66.8%) for women.
| Age Bracket | Male | Female |
| Under 5 Years | 0 (0.0%) | 0 (0.0%) |
| 5 to 9 Years | 0 (0.0%) | 0 (0.0%) |
| 10 to 14 Years | 0 (0.0%) | 0 (0.0%) |
| 15 to 19 Years | 1,187 (82.8%) | 1,778 (66.8%) |
| 20 to 24 Years | 206 (14.4%) | 817 (30.7%) |
| 25 to 29 Years | 32 (2.2%) | 0 (0.0%) |
| 30 to 34 Years | 0 (0.0%) | 0 (0.0%) |
| 35 to 39 Years | 0 (0.0%) | 0 (0.0%) |
| 40 to 44 Years | 0 (0.0%) | 0 (0.0%) |
| 45 to 49 Years | 0 (0.0%) | 57 (2.1%) |
| 50 to 54 Years | 0 (0.0%) | 0 (0.0%) |
| 55 to 59 Years | 0 (0.0%) | 10 (0.4%) |
| 60 to 64 Years | 8 (0.6%) | 0 (0.0%) |
| 65 to 69 Years | 0 (0.0%) | 0 (0.0%) |
| 70 to 74 Years | 0 (0.0%) | 0 (0.0%) |
| 75 to 79 Years | 0 (0.0%) | 0 (0.0%) |
| 80 to 84 Years | 0 (0.0%) | 0 (0.0%) |
| 85 Years and over | 0 (0.0%) | 0 (0.0%) |
| Total | 1,433 (100.0%) | 2,662 (100.0%) |
Families and Households in Mississippi State
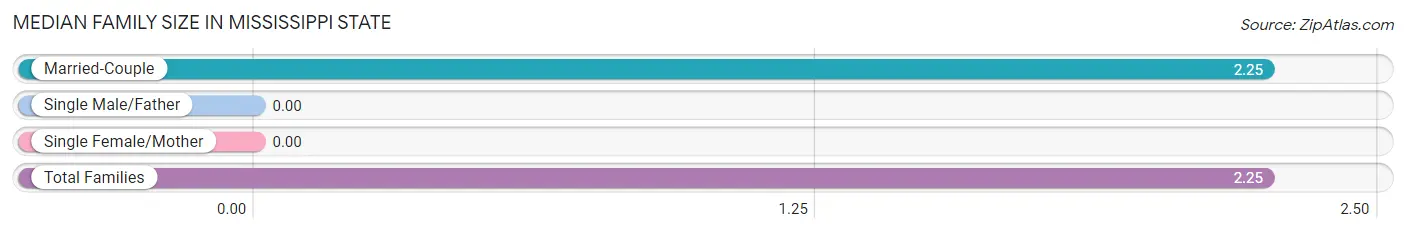
Median Family Size in Mississippi State
| Family Type | # Families | Family Size |
| Married-Couple | 8 (100.0%) | 2.25 |
| Single Male/Father | 0 (0.0%) | - |
| Single Female/Mother | 0 (0.0%) | - |
| Total Families | 8 (100.0%) | 2.25 |
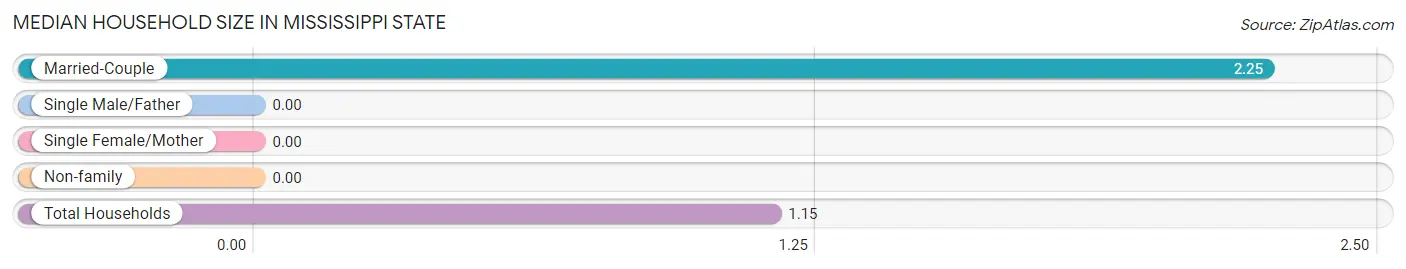
Median Household Size in Mississippi State
| Household Type | # Households | Household Size |
| Married-Couple | 8 (12.3%) | 2.25 |
| Single Male/Father | 0 (0.0%) | - |
| Single Female/Mother | 0 (0.0%) | - |
| Non-family | 57 (87.7%) | - |
| Total Households | 65 (100.0%) | 1.15 |
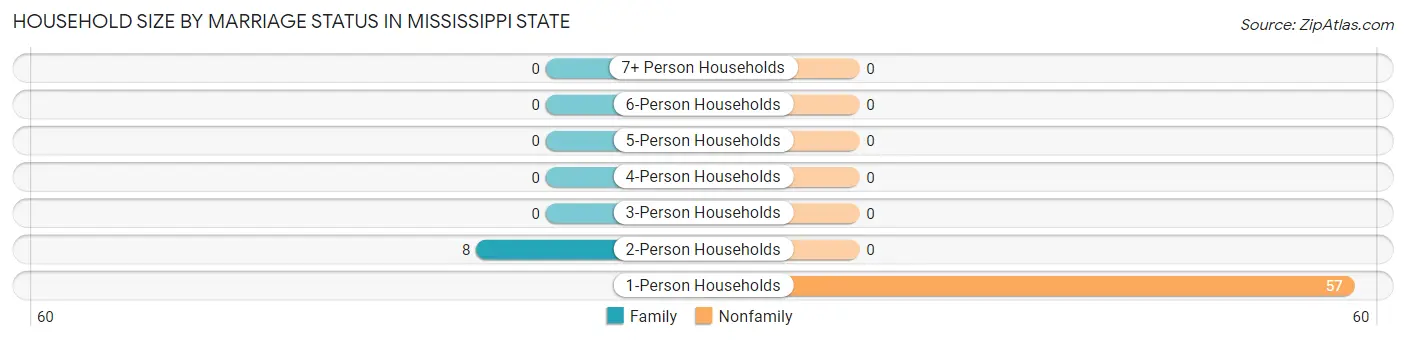
Household Size by Marriage Status in Mississippi State
Out of a total of 65 households in Mississippi State, 8 (12.3%) are family households, while 57 (87.7%) are nonfamily households. The most numerous type of family households are 2-person households, comprising 8, and the most common type of nonfamily households are 1-person households, comprising 57.
| Household Size | Family Households | Nonfamily Households |
| 1-Person Households | - | 57 (87.7%) |
| 2-Person Households | 8 (12.3%) | 0 (0.0%) |
| 3-Person Households | 0 (0.0%) | 0 (0.0%) |
| 4-Person Households | 0 (0.0%) | 0 (0.0%) |
| 5-Person Households | 0 (0.0%) | 0 (0.0%) |
| 6-Person Households | 0 (0.0%) | 0 (0.0%) |
| 7+ Person Households | 0 (0.0%) | 0 (0.0%) |
| Total | 8 (12.3%) | 57 (87.7%) |
Female Fertility in Mississippi State
Fertility by Age in Mississippi State
| Age Bracket | Women with Births | Births / 1,000 Women |
| 15 to 19 years | 0 (0.0%) | 0.0 |
| 20 to 34 years | 0 (0.0%) | 0.0 |
| 35 to 50 years | 0 (0.0%) | 0.0 |
| Total | 0 (0.0%) | 0.0 |
Fertility by Age by Marriage Status in Mississippi State
| Age Bracket | Married | Unmarried |
| 15 to 19 years | 0 (0.0%) | 0 (0.0%) |
| 20 to 34 years | 0 (0.0%) | 0 (0.0%) |
| 35 to 50 years | 0 (0.0%) | 0 (0.0%) |
| Total | 0 (0.0%) | 0 (0.0%) |
Fertility by Education in Mississippi State
| Educational Attainment | Women with Births | Births / 1,000 Women |
| Less than High School | 0 (0.0%) | 0.0 |
| High School Diploma | 0 (0.0%) | 0.0 |
| College or Associate's Degree | 0 (0.0%) | 0.0 |
| Bachelor's Degree | 0 (0.0%) | 0.0 |
| Graduate Degree | 0 (0.0%) | 0.0 |
| Total | 0 (0.0%) | 0.0 |
Fertility by Education by Marriage Status in Mississippi State
| Educational Attainment | Married | Unmarried |
| Less than High School | 0 (0.0%) | 0 (0.0%) |
| High School Diploma | 0 (0.0%) | 0 (0.0%) |
| College or Associate's Degree | 0 (0.0%) | 0 (0.0%) |
| Bachelor's Degree | 0 (0.0%) | 0 (0.0%) |
| Graduate Degree | 0 (0.0%) | 0 (0.0%) |
| Total | 0 (0.0%) | 0 (0.0%) |
Income in Mississippi State
Income Overview in Mississippi State
| Characteristic | Number | Measure |
| Per Capita Income | 4,095 | $7,326 |
| Median Family Income | 8 | $0 |
| Mean Family Income | 8 | $0 |
| Median Household Income | 65 | $0 |
| Mean Household Income | 65 | $0 |
| Income Deficit | 8 | $0 |
| Wage / Income Gap (%) | 4,095 | 22.32% |
| Wage / Income Gap ($) | 4,095 | 77.68¢ per $1 |
| Gini / Inequality Index | 4,095 | 0.02 |
Earnings by Sex in Mississippi State
Average Earnings in Mississippi State are $4,369, $3,720 for men and $4,789 for women, a difference of 22.3%.
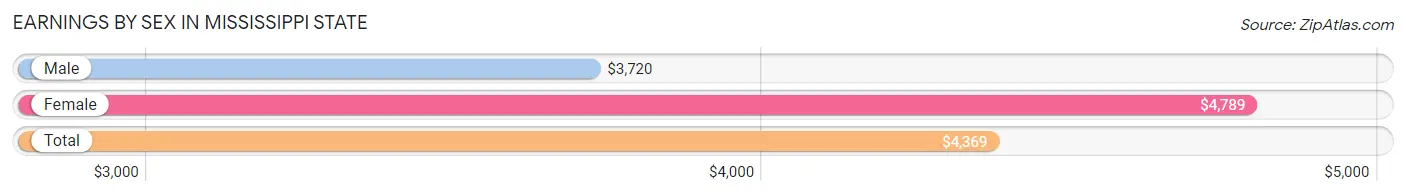
| Sex | Number | Average Earnings |
| Male | 921 (30.2%) | $3,720 |
| Female | 2,127 (69.8%) | $4,789 |
| Total | 3,048 (100.0%) | $4,369 |
Earnings by Sex by Income Bracket in Mississippi State
The most common earnings brackets in Mississippi State are $2,499 or less for men (320 | 34.7%) and $2,499 or less for women (656 | 30.8%).
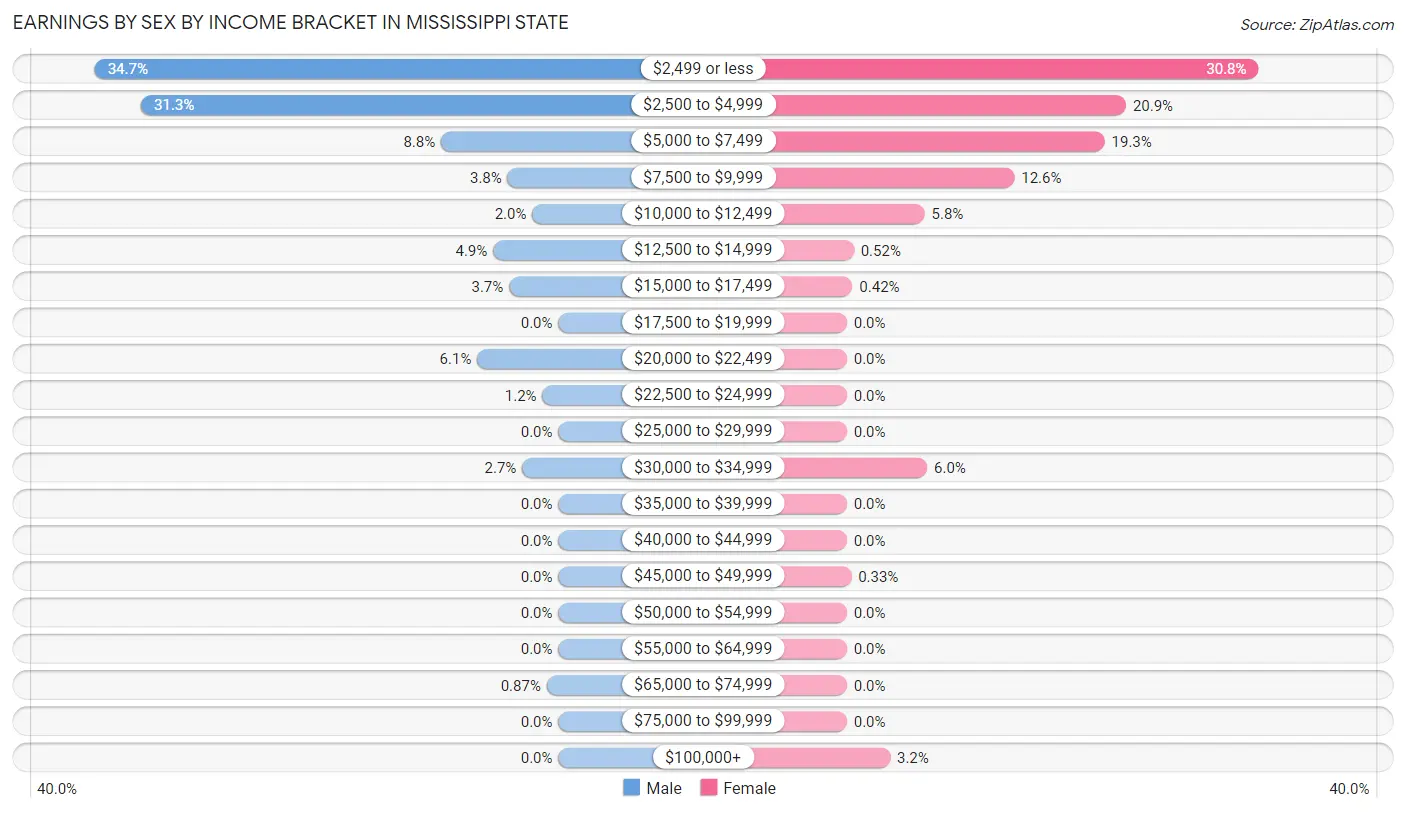
| Income | Male | Female |
| $2,499 or less | 320 (34.7%) | 656 (30.8%) |
| $2,500 to $4,999 | 288 (31.3%) | 445 (20.9%) |
| $5,000 to $7,499 | 81 (8.8%) | 411 (19.3%) |
| $7,500 to $9,999 | 35 (3.8%) | 267 (12.6%) |
| $10,000 to $12,499 | 18 (1.9%) | 124 (5.8%) |
| $12,500 to $14,999 | 45 (4.9%) | 11 (0.5%) |
| $15,000 to $17,499 | 34 (3.7%) | 9 (0.4%) |
| $17,500 to $19,999 | 0 (0.0%) | 0 (0.0%) |
| $20,000 to $22,499 | 56 (6.1%) | 0 (0.0%) |
| $22,500 to $24,999 | 11 (1.2%) | 0 (0.0%) |
| $25,000 to $29,999 | 0 (0.0%) | 0 (0.0%) |
| $30,000 to $34,999 | 25 (2.7%) | 128 (6.0%) |
| $35,000 to $39,999 | 0 (0.0%) | 0 (0.0%) |
| $40,000 to $44,999 | 0 (0.0%) | 0 (0.0%) |
| $45,000 to $49,999 | 0 (0.0%) | 7 (0.3%) |
| $50,000 to $54,999 | 0 (0.0%) | 0 (0.0%) |
| $55,000 to $64,999 | 0 (0.0%) | 0 (0.0%) |
| $65,000 to $74,999 | 8 (0.9%) | 0 (0.0%) |
| $75,000 to $99,999 | 0 (0.0%) | 0 (0.0%) |
| $100,000+ | 0 (0.0%) | 69 (3.2%) |
| Total | 921 (100.0%) | 2,127 (100.0%) |
Earnings by Sex by Educational Attainment in Mississippi State
| Educational Attainment | Male Income | Female Income |
| Less than High School | - | - |
| High School Diploma | - | - |
| College or Associate's Degree | - | - |
| Bachelor's Degree | - | - |
| Graduate Degree | - | - |
| Total | - | - |
Family Income in Mississippi State
Family Income Brackets in Mississippi State
According to the Mississippi State family income data, there are 8 families falling into the $100,000 to $149,999 income range, which is the most common income bracket and makes up 100.0% of all families.
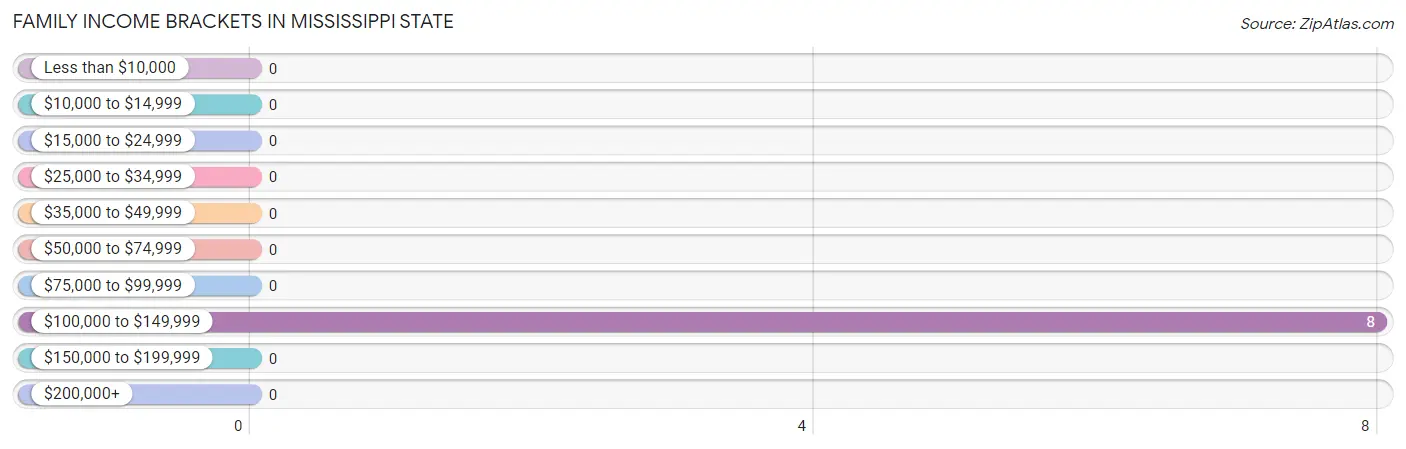
| Income Bracket | # Families | % Families |
| Less than $10,000 | 0 | 0.0% |
| $10,000 to $14,999 | 0 | 0.0% |
| $15,000 to $24,999 | 0 | 0.0% |
| $25,000 to $34,999 | 0 | 0.0% |
| $35,000 to $49,999 | 0 | 0.0% |
| $50,000 to $74,999 | 0 | 0.0% |
| $75,000 to $99,999 | 0 | 0.0% |
| $100,000 to $149,999 | 8 | 100.0% |
| $150,000 to $199,999 | 0 | 0.0% |
| $200,000+ | 0 | 0.0% |
Family Income by Famaliy Size in Mississippi State
| Income Bracket | # Families | Median Income |
| 2-Person Families | 8 (100.0%) | $0 |
| 3-Person Families | 0 (0.0%) | $0 |
| 4-Person Families | 0 (0.0%) | $0 |
| 5-Person Families | 0 (0.0%) | $0 |
| 6-Person Families | 0 (0.0%) | $0 |
| 7+ Person Families | 0 (0.0%) | $0 |
| Total | 8 (100.0%) | $0 |
Family Income by Number of Earners in Mississippi State
| Number of Earners | # Families | Median Income |
| No Earners | 0 (0.0%) | $0 |
| 1 Earner | 0 (0.0%) | $0 |
| 2 Earners | 8 (100.0%) | $0 |
| 3+ Earners | 0 (0.0%) | $0 |
| Total | 8 (100.0%) | $0 |
Household Income in Mississippi State
Household Income Brackets in Mississippi State
With 65 households falling in the category, the $100,000 to $149,999 income range is the most frequent in Mississippi State, accounting for 100.0% of all households.
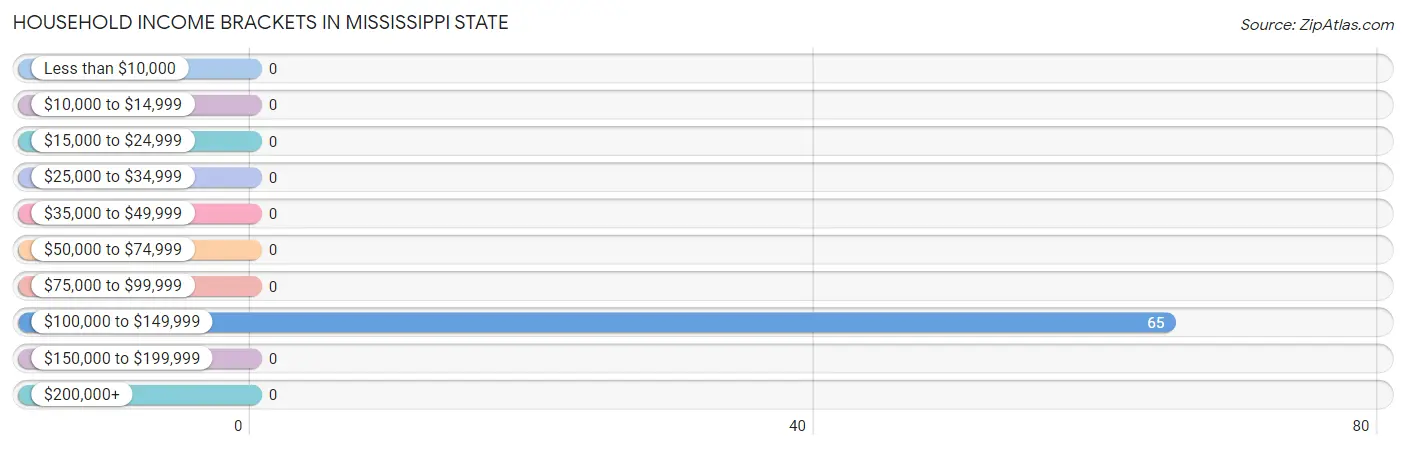
| Income Bracket | # Households | % Households |
| Less than $10,000 | 0 | 0.0% |
| $10,000 to $14,999 | 0 | 0.0% |
| $15,000 to $24,999 | 0 | 0.0% |
| $25,000 to $34,999 | 0 | 0.0% |
| $35,000 to $49,999 | 0 | 0.0% |
| $50,000 to $74,999 | 0 | 0.0% |
| $75,000 to $99,999 | 0 | 0.0% |
| $100,000 to $149,999 | 65 | 100.0% |
| $150,000 to $199,999 | 0 | 0.0% |
| $200,000+ | 0 | 0.0% |
Household Income by Householder Age in Mississippi State
| Income Bracket | # Households | Median Income |
| 15 to 24 Years | 0 (0.0%) | $0 |
| 25 to 44 Years | 0 (0.0%) | $0 |
| 45 to 64 Years | 65 (100.0%) | $0 |
| 65+ Years | 0 (0.0%) | $0 |
| Total | 65 (100.0%) | $0 |
Poverty in Mississippi State
Income Below Poverty by Sex and Age in Mississippi State
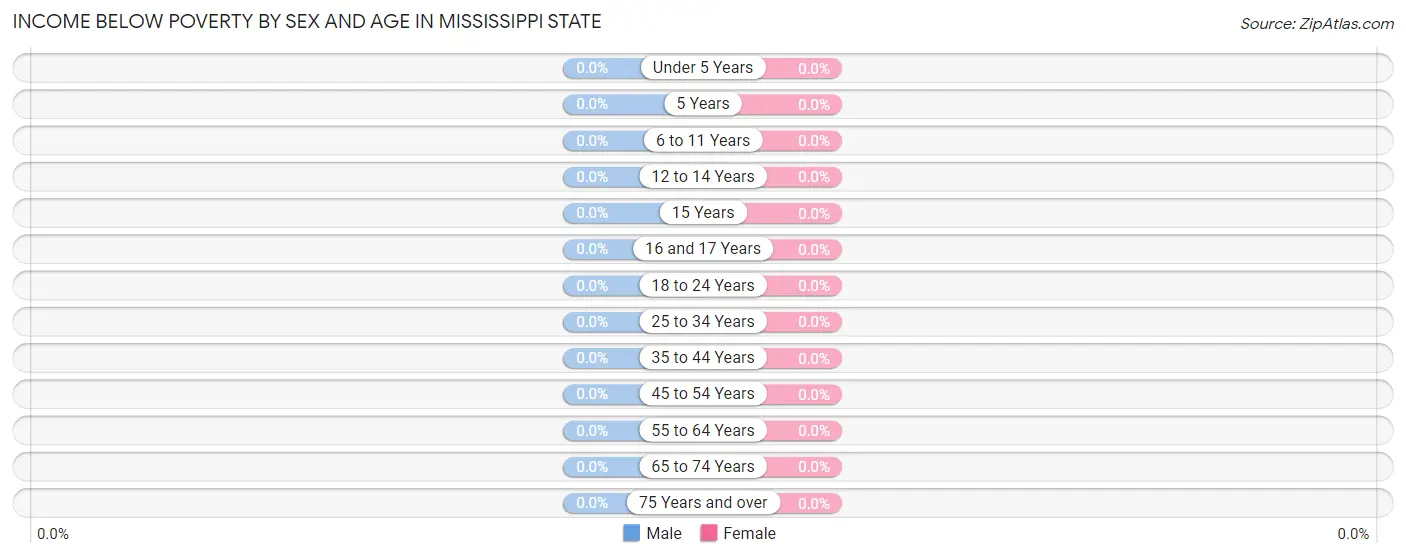
| Age Bracket | Male | Female |
| Under 5 Years | 0 (0.0%) | 0 (0.0%) |
| 5 Years | 0 (0.0%) | 0 (0.0%) |
| 6 to 11 Years | 0 (0.0%) | 0 (0.0%) |
| 12 to 14 Years | 0 (0.0%) | 0 (0.0%) |
| 15 Years | 0 (0.0%) | 0 (0.0%) |
| 16 and 17 Years | 0 (0.0%) | 0 (0.0%) |
| 18 to 24 Years | 0 (0.0%) | 0 (0.0%) |
| 25 to 34 Years | 0 (0.0%) | 0 (0.0%) |
| 35 to 44 Years | 0 (0.0%) | 0 (0.0%) |
| 45 to 54 Years | 0 (0.0%) | 0 (0.0%) |
| 55 to 64 Years | 0 (0.0%) | 0 (0.0%) |
| 65 to 74 Years | 0 (0.0%) | 0 (0.0%) |
| 75 Years and over | 0 (0.0%) | 0 (0.0%) |
| Total | 0 (0.0%) | 0 (0.0%) |
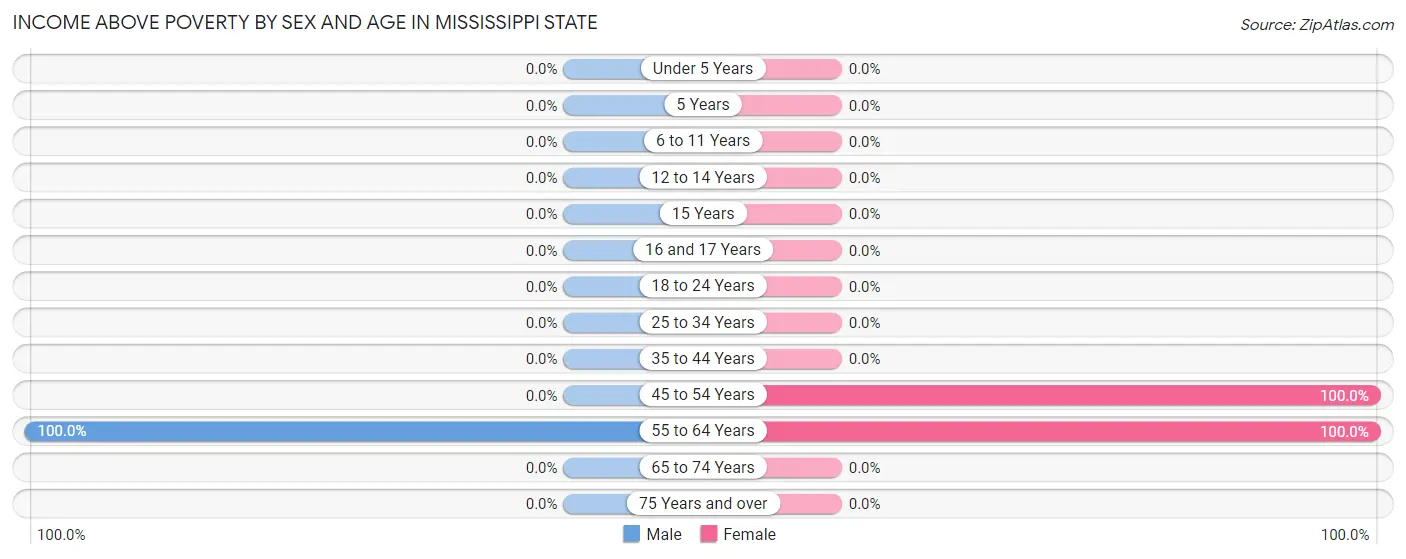
Income Above Poverty by Sex and Age in Mississippi State
According to the poverty statistics in Mississippi State, males aged 55 to 64 years and females aged 45 to 54 years are the age groups that are most secure financially, with 100.0% of males and 100.0% of females in these age groups living above the poverty line.
| Age Bracket | Male | Female |
| Under 5 Years | 0 (0.0%) | 0 (0.0%) |
| 5 Years | 0 (0.0%) | 0 (0.0%) |
| 6 to 11 Years | 0 (0.0%) | 0 (0.0%) |
| 12 to 14 Years | 0 (0.0%) | 0 (0.0%) |
| 15 Years | 0 (0.0%) | 0 (0.0%) |
| 16 and 17 Years | 0 (0.0%) | 0 (0.0%) |
| 18 to 24 Years | 0 (0.0%) | 0 (0.0%) |
| 25 to 34 Years | 0 (0.0%) | 0 (0.0%) |
| 35 to 44 Years | 0 (0.0%) | 0 (0.0%) |
| 45 to 54 Years | 0 (0.0%) | 57 (100.0%) |
| 55 to 64 Years | 8 (100.0%) | 10 (100.0%) |
| 65 to 74 Years | 0 (0.0%) | 0 (0.0%) |
| 75 Years and over | 0 (0.0%) | 0 (0.0%) |
| Total | 8 (100.0%) | 67 (100.0%) |
Income Below Poverty Among Married-Couple Families in Mississippi State
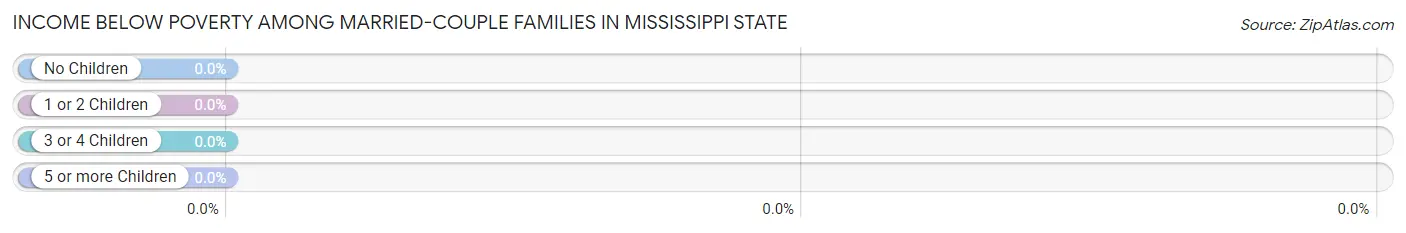
| Children | Above Poverty | Below Poverty |
| No Children | 8 (100.0%) | 0 (0.0%) |
| 1 or 2 Children | 0 (0.0%) | 0 (0.0%) |
| 3 or 4 Children | 0 (0.0%) | 0 (0.0%) |
| 5 or more Children | 0 (0.0%) | 0 (0.0%) |
| Total | 8 (100.0%) | 0 (0.0%) |
Income Below Poverty Among Single-Parent Households in Mississippi State
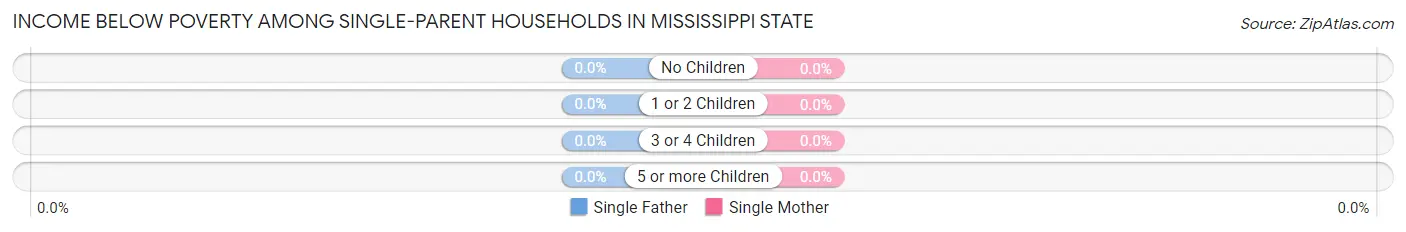
| Children | Single Father | Single Mother |
| No Children | 0 (0.0%) | 0 (0.0%) |
| 1 or 2 Children | 0 (0.0%) | 0 (0.0%) |
| 3 or 4 Children | 0 (0.0%) | 0 (0.0%) |
| 5 or more Children | 0 (0.0%) | 0 (0.0%) |
| Total | 0 (0.0%) | 0 (0.0%) |
Income Below Poverty Among Married-Couple vs Single-Parent Households in Mississippi State
| Children | Married-Couple Families | Single-Parent Households |
| No Children | 0 (0.0%) | 0 (0.0%) |
| 1 or 2 Children | 0 (0.0%) | 0 (0.0%) |
| 3 or 4 Children | 0 (0.0%) | 0 (0.0%) |
| 5 or more Children | 0 (0.0%) | 0 (0.0%) |
| Total | 0 (0.0%) | 0 (0.0%) |
Employment Characteristics in Mississippi State
Employment by Class of Employer in Mississippi State
Among the 942 employed individuals in Mississippi State, private company employees (528 | 56.0%), state government employees (346 | 36.7%), and not-for-profit organizations (31 | 3.3%) make up the most common classes of employment.
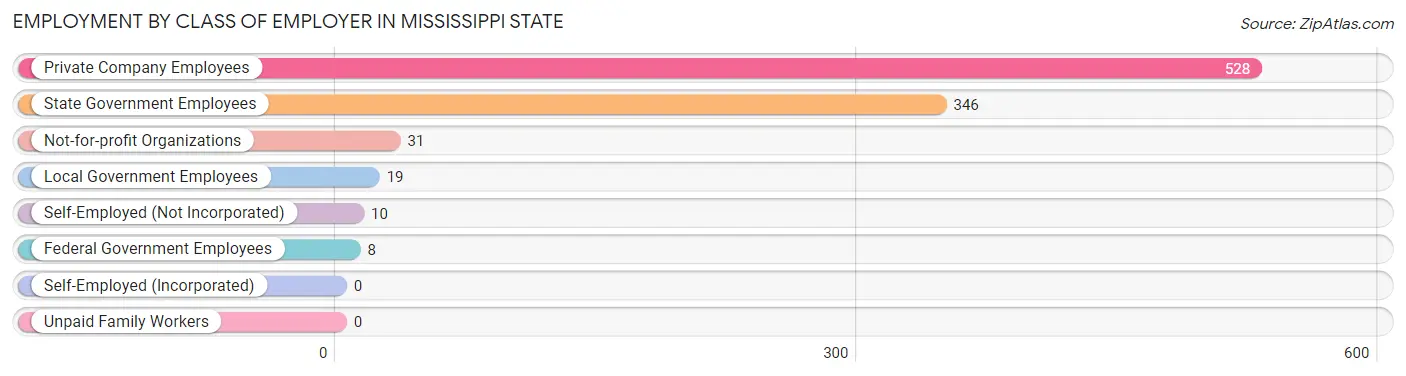
| Employer Class | # Employees | % Employees |
| Private Company Employees | 528 | 56.0% |
| Self-Employed (Incorporated) | 0 | 0.0% |
| Self-Employed (Not Incorporated) | 10 | 1.1% |
| Not-for-profit Organizations | 31 | 3.3% |
| Local Government Employees | 19 | 2.0% |
| State Government Employees | 346 | 36.7% |
| Federal Government Employees | 8 | 0.9% |
| Unpaid Family Workers | 0 | 0.0% |
| Total | 942 | 100.0% |
Employment Status by Age in Mississippi State
According to the labor force statistics for Mississippi State, out of the total population over 16 years of age (4,095), 27.2% or 1,114 individuals are in the labor force, with 10.9% or 121 of them unemployed. The age group with the highest labor force participation rate is 45 to 54 years, with 100.0% or 57 individuals in the labor force. Within the labor force, the 25 to 29 years age range has the highest percentage of unemployed individuals, with 100.0% or 15 of them being unemployed.
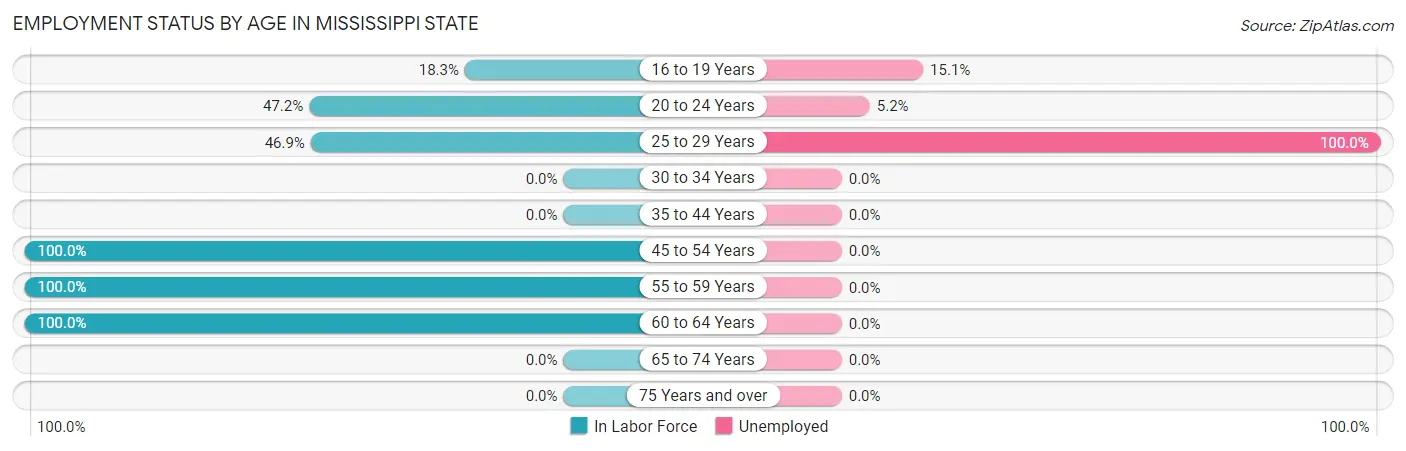
| Age Bracket | In Labor Force | Unemployed |
| 16 to 19 Years | 543 (18.3%) | 82 (15.1%) |
| 20 to 24 Years | 483 (47.2%) | 25 (5.2%) |
| 25 to 29 Years | 15 (46.9%) | 15 (100.0%) |
| 30 to 34 Years | 0 (0.0%) | 0 (0.0%) |
| 35 to 44 Years | 0 (0.0%) | 0 (0.0%) |
| 45 to 54 Years | 57 (100.0%) | 0 (0.0%) |
| 55 to 59 Years | 10 (100.0%) | 0 (0.0%) |
| 60 to 64 Years | 8 (100.0%) | 0 (0.0%) |
| 65 to 74 Years | 0 (0.0%) | 0 (0.0%) |
| 75 Years and over | 0 (0.0%) | 0 (0.0%) |
| Total | 1,114 (27.2%) | 121 (10.9%) |
Employment Status by Educational Attainment in Mississippi State
According to labor force statistics for Mississippi State, 84.1% of individuals (90) out of the total population between 25 and 64 years of age (107) are in the labor force, with 16.7% or 15 of them being unemployed. The group with the highest labor force participation rate are those with the educational attainment of bachelor's degree or higher, with 100.0% or 75 individuals in the labor force. Within the labor force, individuals with college / associate degree education have the highest percentage of unemployment, with 100.0% or 15 of them being unemployed.
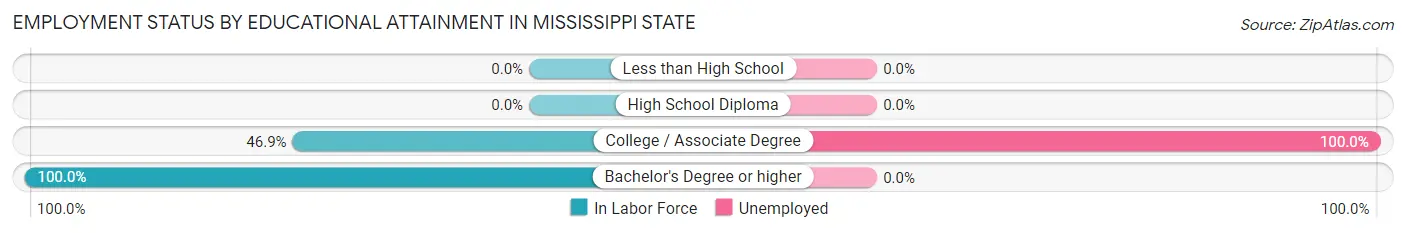
| Educational Attainment | In Labor Force | Unemployed |
| Less than High School | 0 (0.0%) | 0 (0.0%) |
| High School Diploma | 0 (0.0%) | 0 (0.0%) |
| College / Associate Degree | 15 (46.9%) | 32 (100.0%) |
| Bachelor's Degree or higher | 75 (100.0%) | 0 (0.0%) |
| Total | 90 (84.1%) | 18 (16.7%) |
Employment Occupations by Sex in Mississippi State
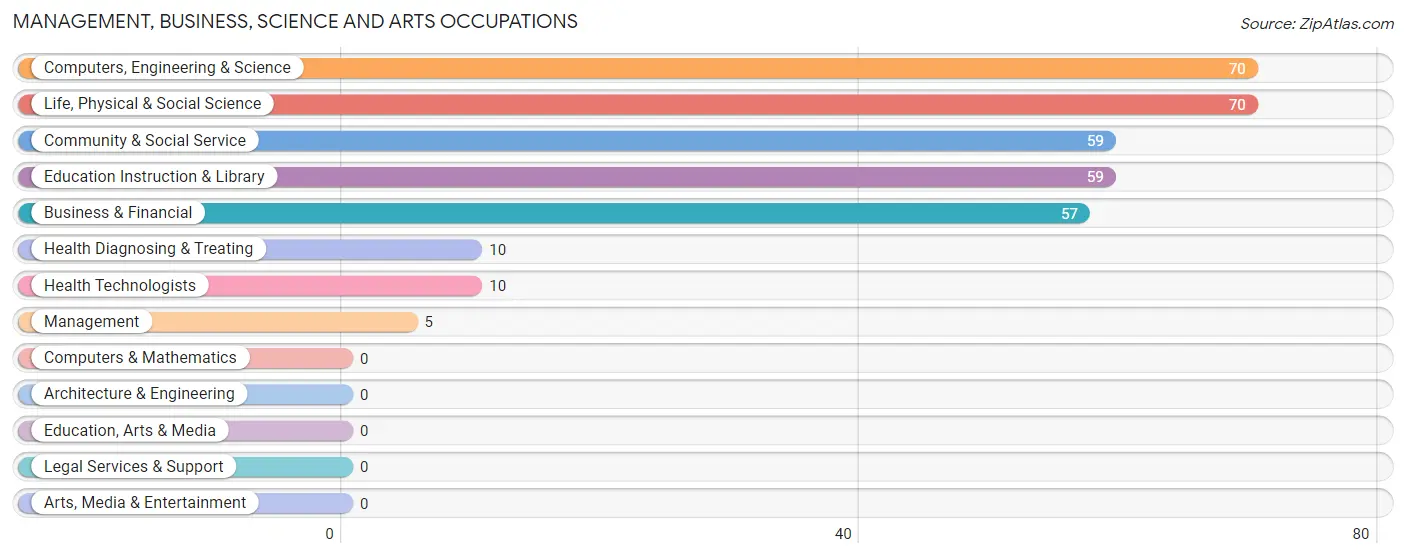
Management, Business, Science and Arts Occupations
The most common Management, Business, Science and Arts occupations in Mississippi State are Computers, Engineering & Science (70 | 7.0%), Life, Physical & Social Science (70 | 7.0%), Community & Social Service (59 | 5.9%), Education Instruction & Library (59 | 5.9%), and Business & Financial (57 | 5.7%).
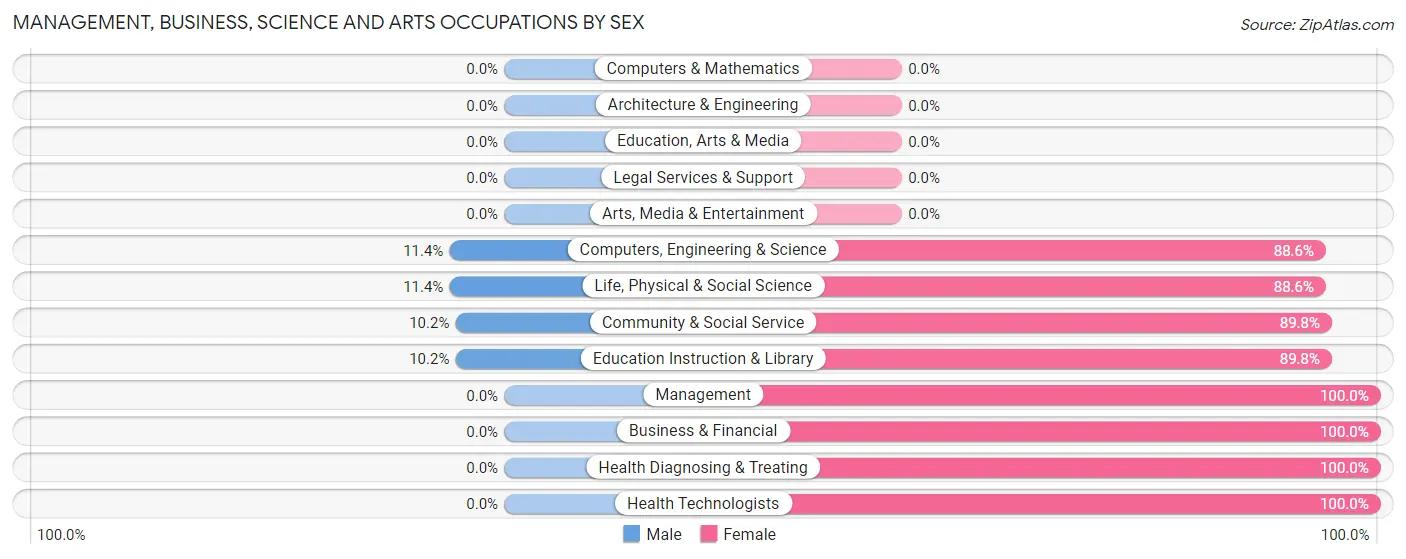
Management, Business, Science and Arts Occupations by Sex
Within the Management, Business, Science and Arts occupations in Mississippi State, the most male-oriented occupations are Computers, Engineering & Science (11.4%), Life, Physical & Social Science (11.4%), and Community & Social Service (10.2%), while the most female-oriented occupations are Management (100.0%), Business & Financial (100.0%), and Health Diagnosing & Treating (100.0%).
| Occupation | Male | Female |
| Management | 0 (0.0%) | 5 (100.0%) |
| Business & Financial | 0 (0.0%) | 57 (100.0%) |
| Computers, Engineering & Science | 8 (11.4%) | 62 (88.6%) |
| Computers & Mathematics | 0 (0.0%) | 0 (0.0%) |
| Architecture & Engineering | 0 (0.0%) | 0 (0.0%) |
| Life, Physical & Social Science | 8 (11.4%) | 62 (88.6%) |
| Community & Social Service | 6 (10.2%) | 53 (89.8%) |
| Education, Arts & Media | 0 (0.0%) | 0 (0.0%) |
| Legal Services & Support | 0 (0.0%) | 0 (0.0%) |
| Education Instruction & Library | 6 (10.2%) | 53 (89.8%) |
| Arts, Media & Entertainment | 0 (0.0%) | 0 (0.0%) |
| Health Diagnosing & Treating | 0 (0.0%) | 10 (100.0%) |
| Health Technologists | 0 (0.0%) | 10 (100.0%) |
| Total (Category) | 14 (7.0%) | 187 (93.0%) |
| Total (Overall) | 214 (21.5%) | 779 (78.4%) |
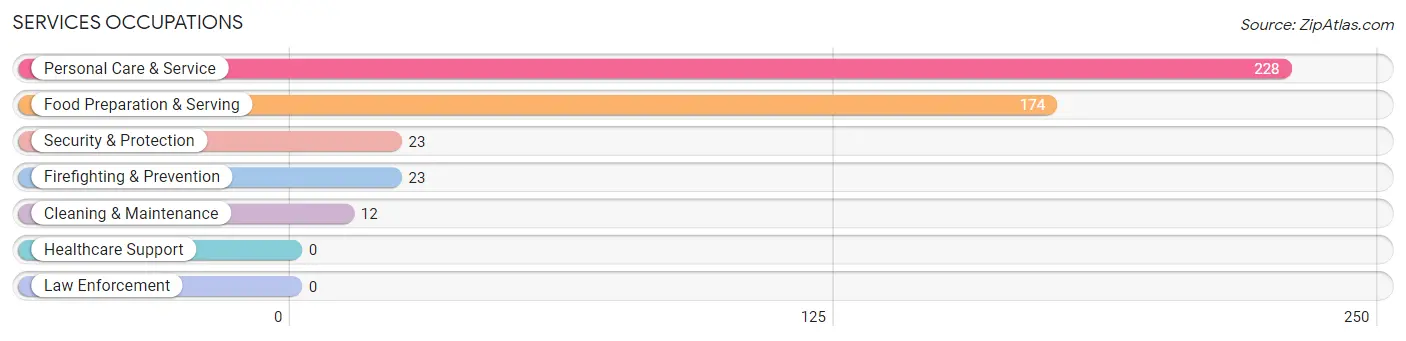
Services Occupations
The most common Services occupations in Mississippi State are Personal Care & Service (228 | 23.0%), Food Preparation & Serving (174 | 17.5%), Security & Protection (23 | 2.3%), Firefighting & Prevention (23 | 2.3%), and Cleaning & Maintenance (12 | 1.2%).
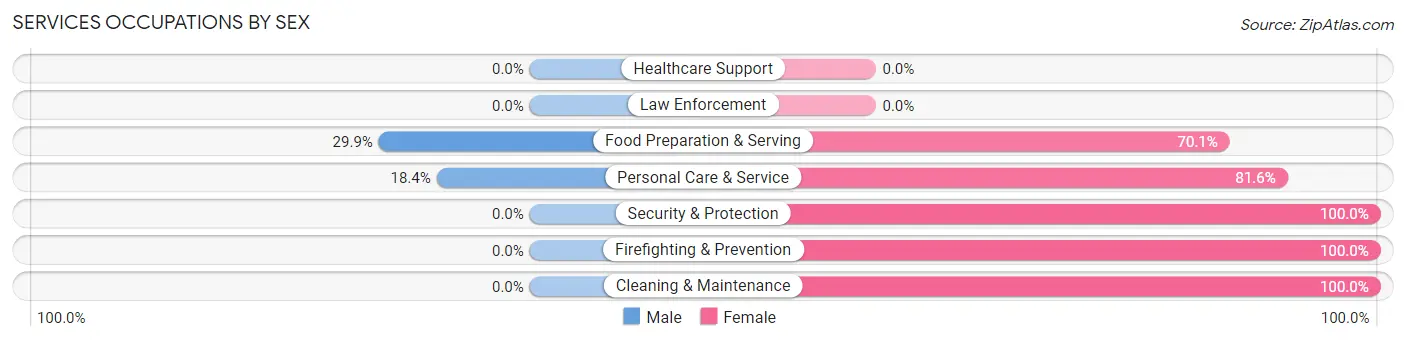
Services Occupations by Sex
Within the Services occupations in Mississippi State, the most male-oriented occupations are Food Preparation & Serving (29.9%), and Personal Care & Service (18.4%), while the most female-oriented occupations are Security & Protection (100.0%), Firefighting & Prevention (100.0%), and Cleaning & Maintenance (100.0%).
| Occupation | Male | Female |
| Healthcare Support | 0 (0.0%) | 0 (0.0%) |
| Security & Protection | 0 (0.0%) | 23 (100.0%) |
| Firefighting & Prevention | 0 (0.0%) | 23 (100.0%) |
| Law Enforcement | 0 (0.0%) | 0 (0.0%) |
| Food Preparation & Serving | 52 (29.9%) | 122 (70.1%) |
| Cleaning & Maintenance | 0 (0.0%) | 12 (100.0%) |
| Personal Care & Service | 42 (18.4%) | 186 (81.6%) |
| Total (Category) | 94 (21.5%) | 343 (78.5%) |
| Total (Overall) | 214 (21.5%) | 779 (78.4%) |
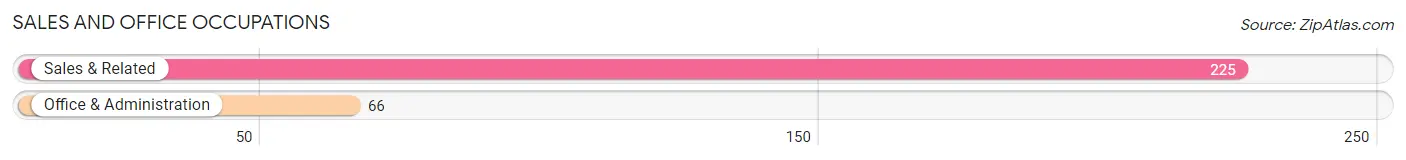
Sales and Office Occupations
The most common Sales and Office occupations in Mississippi State are Sales & Related (225 | 22.7%), and Office & Administration (66 | 6.7%).
Sales and Office Occupations by Sex
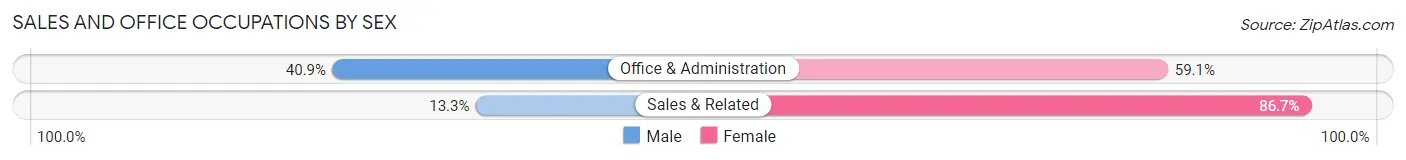
| Occupation | Male | Female |
| Sales & Related | 30 (13.3%) | 195 (86.7%) |
| Office & Administration | 27 (40.9%) | 39 (59.1%) |
| Total (Category) | 57 (19.6%) | 234 (80.4%) |
| Total (Overall) | 214 (21.5%) | 779 (78.4%) |
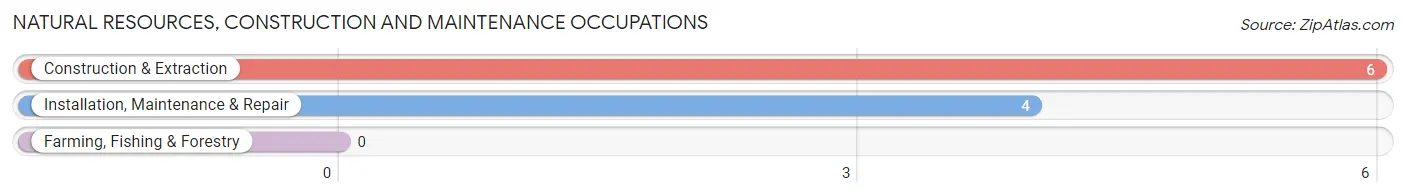
Natural Resources, Construction and Maintenance Occupations
The most common Natural Resources, Construction and Maintenance occupations in Mississippi State are Construction & Extraction (6 | 0.6%), and Installation, Maintenance & Repair (4 | 0.4%).
Natural Resources, Construction and Maintenance Occupations by Sex
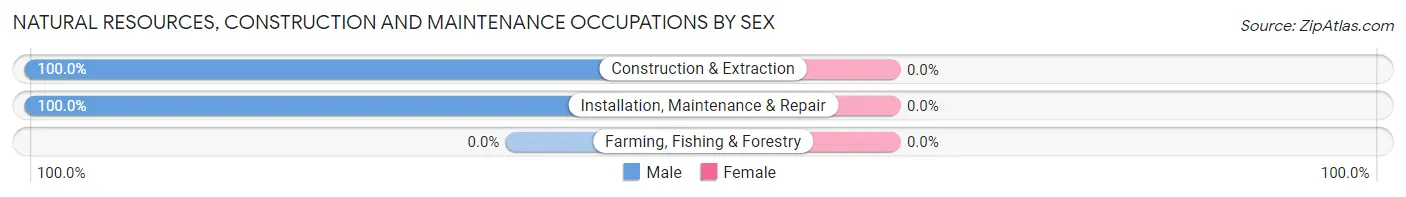
| Occupation | Male | Female |
| Farming, Fishing & Forestry | 0 (0.0%) | 0 (0.0%) |
| Construction & Extraction | 6 (100.0%) | 0 (0.0%) |
| Installation, Maintenance & Repair | 4 (100.0%) | 0 (0.0%) |
| Total (Category) | 10 (100.0%) | 0 (0.0%) |
| Total (Overall) | 214 (21.5%) | 779 (78.4%) |
Production, Transportation and Moving Occupations
The most common Production, Transportation and Moving occupations in Mississippi State are Material Moving (47 | 4.7%), and Production (7 | 0.7%).
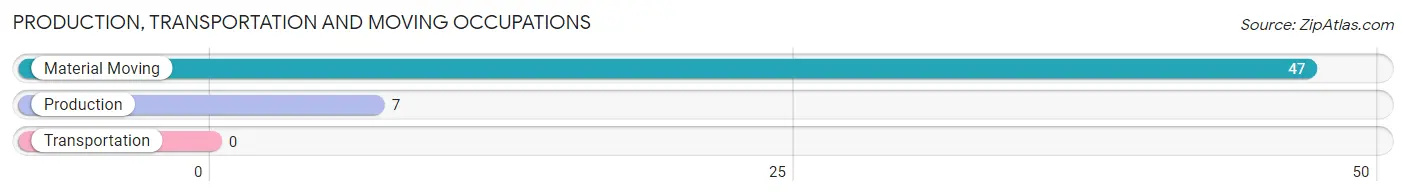
Production, Transportation and Moving Occupations by Sex
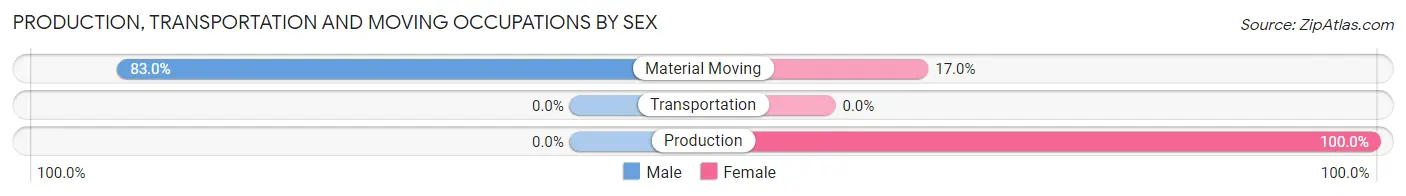
| Occupation | Male | Female |
| Production | 0 (0.0%) | 7 (100.0%) |
| Transportation | 0 (0.0%) | 0 (0.0%) |
| Material Moving | 39 (83.0%) | 8 (17.0%) |
| Total (Category) | 39 (72.2%) | 15 (27.8%) |
| Total (Overall) | 214 (21.5%) | 779 (78.4%) |
Employment Industries by Sex in Mississippi State
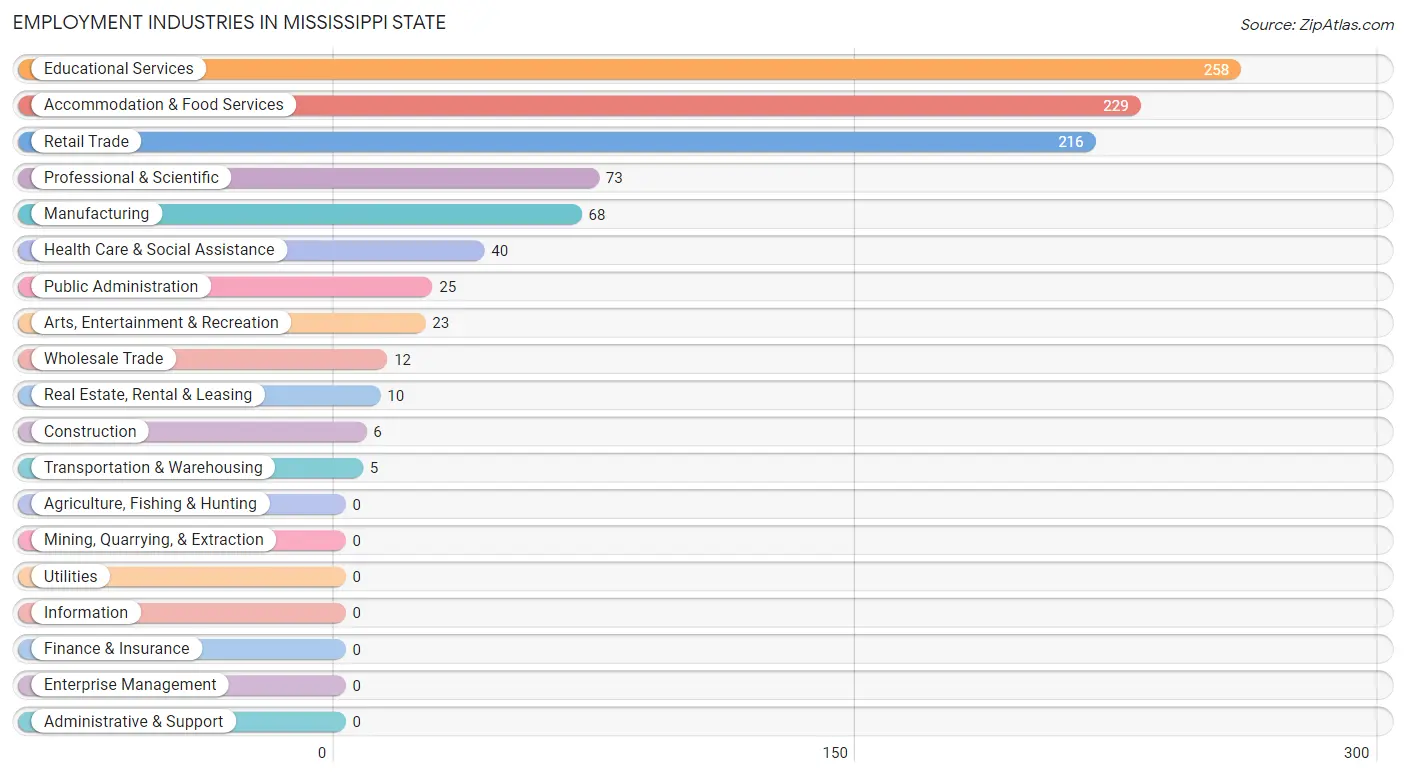
Employment Industries in Mississippi State
The major employment industries in Mississippi State include Educational Services (258 | 26.0%), Accommodation & Food Services (229 | 23.1%), Retail Trade (216 | 21.7%), Professional & Scientific (73 | 7.3%), and Manufacturing (68 | 6.9%).
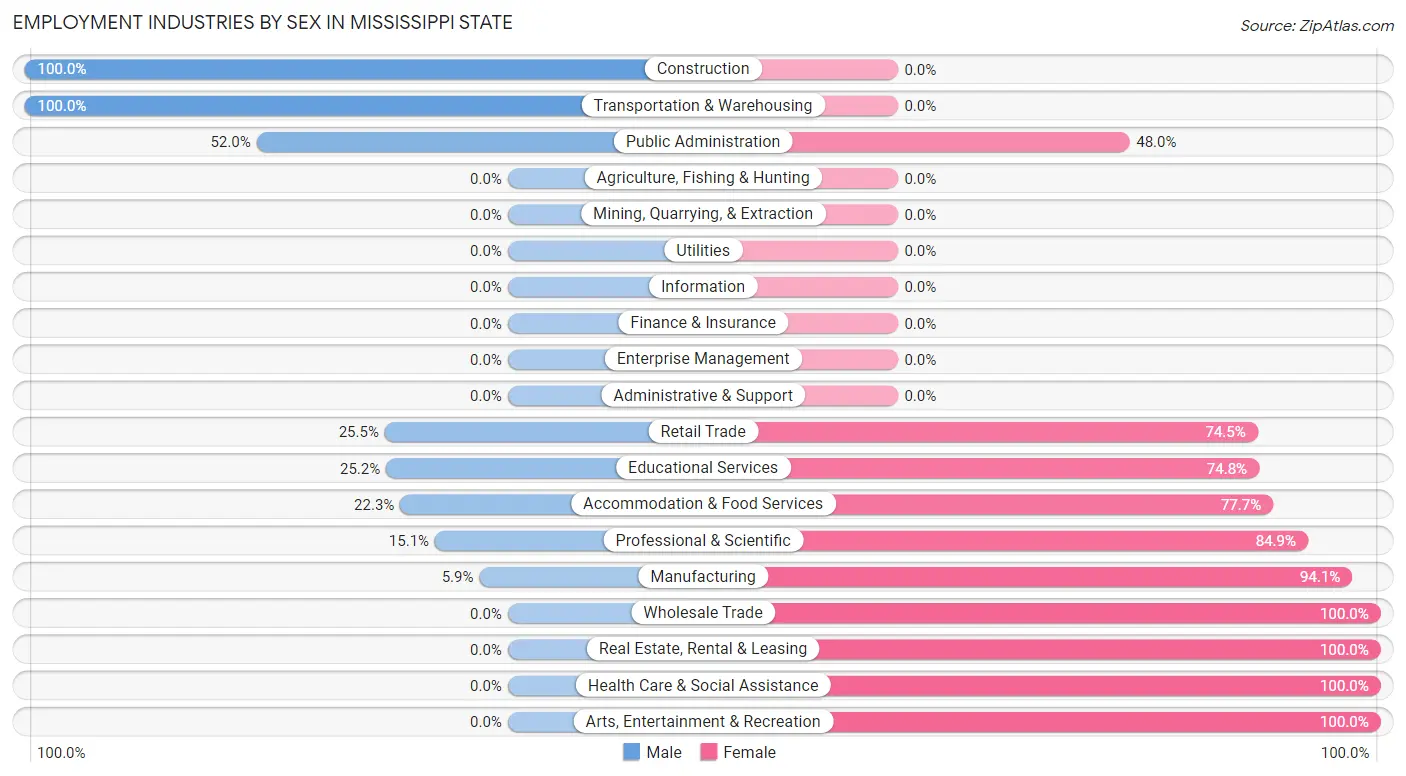
Employment Industries by Sex in Mississippi State
The Mississippi State industries that see more men than women are Construction (100.0%), Transportation & Warehousing (100.0%), and Public Administration (52.0%), whereas the industries that tend to have a higher number of women are Wholesale Trade (100.0%), Real Estate, Rental & Leasing (100.0%), and Health Care & Social Assistance (100.0%).
| Industry | Male | Female |
| Agriculture, Fishing & Hunting | 0 (0.0%) | 0 (0.0%) |
| Mining, Quarrying, & Extraction | 0 (0.0%) | 0 (0.0%) |
| Construction | 6 (100.0%) | 0 (0.0%) |
| Manufacturing | 4 (5.9%) | 64 (94.1%) |
| Wholesale Trade | 0 (0.0%) | 12 (100.0%) |
| Retail Trade | 55 (25.5%) | 161 (74.5%) |
| Transportation & Warehousing | 5 (100.0%) | 0 (0.0%) |
| Utilities | 0 (0.0%) | 0 (0.0%) |
| Information | 0 (0.0%) | 0 (0.0%) |
| Finance & Insurance | 0 (0.0%) | 0 (0.0%) |
| Real Estate, Rental & Leasing | 0 (0.0%) | 10 (100.0%) |
| Professional & Scientific | 11 (15.1%) | 62 (84.9%) |
| Enterprise Management | 0 (0.0%) | 0 (0.0%) |
| Administrative & Support | 0 (0.0%) | 0 (0.0%) |
| Educational Services | 65 (25.2%) | 193 (74.8%) |
| Health Care & Social Assistance | 0 (0.0%) | 40 (100.0%) |
| Arts, Entertainment & Recreation | 0 (0.0%) | 23 (100.0%) |
| Accommodation & Food Services | 51 (22.3%) | 178 (77.7%) |
| Public Administration | 13 (52.0%) | 12 (48.0%) |
| Total | 214 (21.5%) | 779 (78.4%) |
Education in Mississippi State
School Enrollment in Mississippi State
The most common levels of schooling among the 4,020 students in Mississippi State are college / undergraduate (4,010 | 99.8%), and graduate / professional (10 | 0.3%).
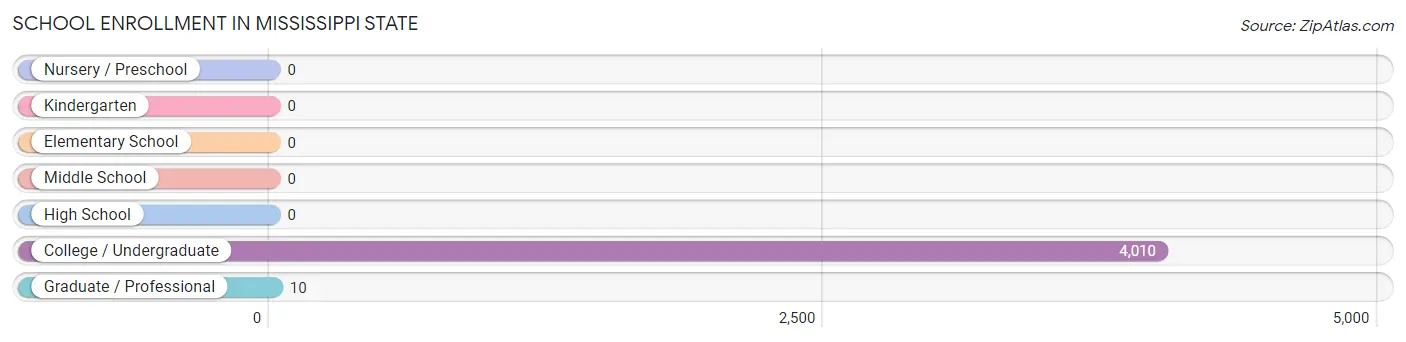
| School Level | # Students | % Students |
| Nursery / Preschool | 0 | 0.0% |
| Kindergarten | 0 | 0.0% |
| Elementary School | 0 | 0.0% |
| Middle School | 0 | 0.0% |
| High School | 0 | 0.0% |
| College / Undergraduate | 4,010 | 99.8% |
| Graduate / Professional | 10 | 0.3% |
| Total | 4,020 | 100.0% |
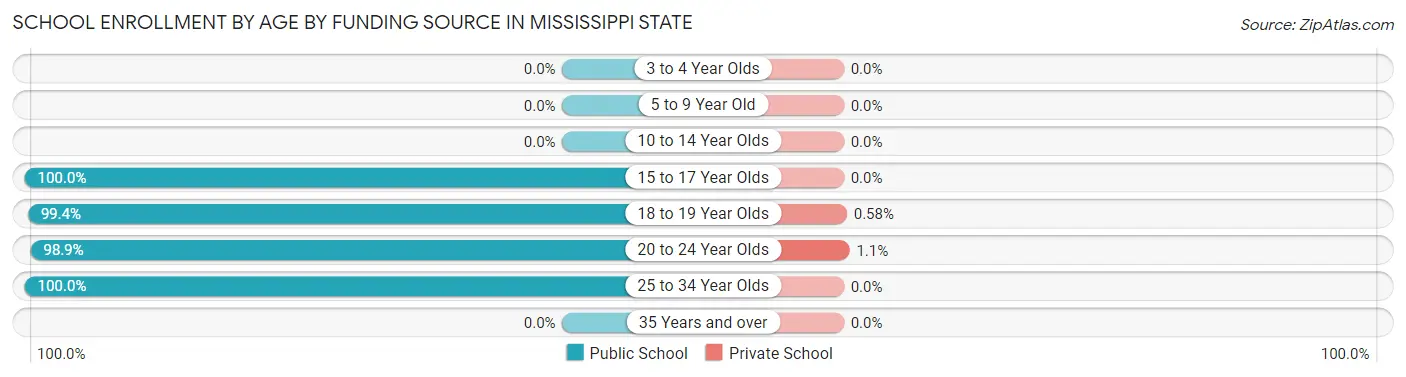
School Enrollment by Age by Funding Source in Mississippi State
Out of a total of 4,020 students who are enrolled in schools in Mississippi State, 28 (0.7%) attend a private institution, while the remaining 3,992 (99.3%) are enrolled in public schools. The age group of 20 to 24 year olds has the highest likelihood of being enrolled in private schools, with 11 (1.1% in the age bracket) enrolled. Conversely, the age group of 15 to 17 year olds has the lowest likelihood of being enrolled in a private school, with 54 (100.0% in the age bracket) attending a public institution.
| Age Bracket | Public School | Private School |
| 3 to 4 Year Olds | 0 (0.0%) | 0 (0.0%) |
| 5 to 9 Year Old | 0 (0.0%) | 0 (0.0%) |
| 10 to 14 Year Olds | 0 (0.0%) | 0 (0.0%) |
| 15 to 17 Year Olds | 54 (100.0%) | 0 (0.0%) |
| 18 to 19 Year Olds | 2,894 (99.4%) | 17 (0.6%) |
| 20 to 24 Year Olds | 1,012 (98.9%) | 11 (1.1%) |
| 25 to 34 Year Olds | 32 (100.0%) | 0 (0.0%) |
| 35 Years and over | 0 (0.0%) | 0 (0.0%) |
| Total | 3,992 (99.3%) | 28 (0.7%) |
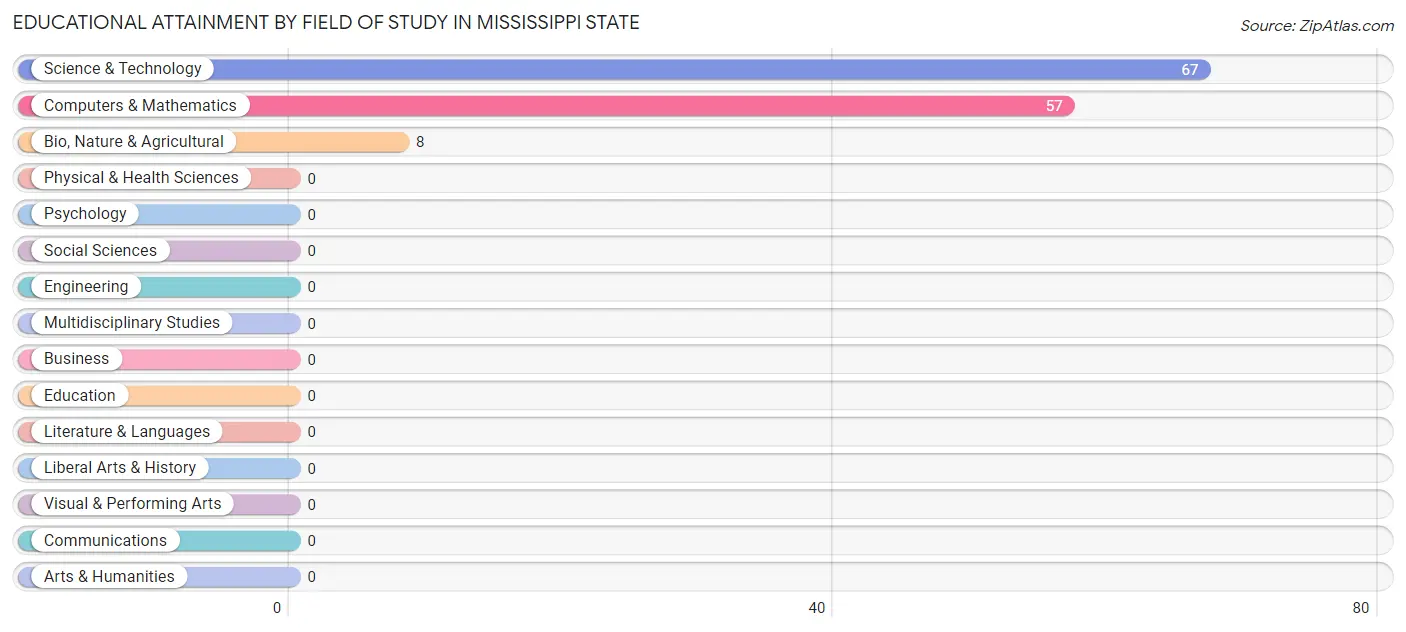
Educational Attainment by Field of Study in Mississippi State
Science & technology (67 | 50.8%), computers & mathematics (57 | 43.2%), and bio, nature & agricultural (8 | 6.1%) are the most common fields of study among 132 individuals in Mississippi State who have obtained a bachelor's degree or higher.
| Field of Study | # Graduates | % Graduates |
| Computers & Mathematics | 57 | 43.2% |
| Bio, Nature & Agricultural | 8 | 6.1% |
| Physical & Health Sciences | 0 | 0.0% |
| Psychology | 0 | 0.0% |
| Social Sciences | 0 | 0.0% |
| Engineering | 0 | 0.0% |
| Multidisciplinary Studies | 0 | 0.0% |
| Science & Technology | 67 | 50.8% |
| Business | 0 | 0.0% |
| Education | 0 | 0.0% |
| Literature & Languages | 0 | 0.0% |
| Liberal Arts & History | 0 | 0.0% |
| Visual & Performing Arts | 0 | 0.0% |
| Communications | 0 | 0.0% |
| Arts & Humanities | 0 | 0.0% |
| Total | 132 | 100.0% |
Transportation & Commute in Mississippi State
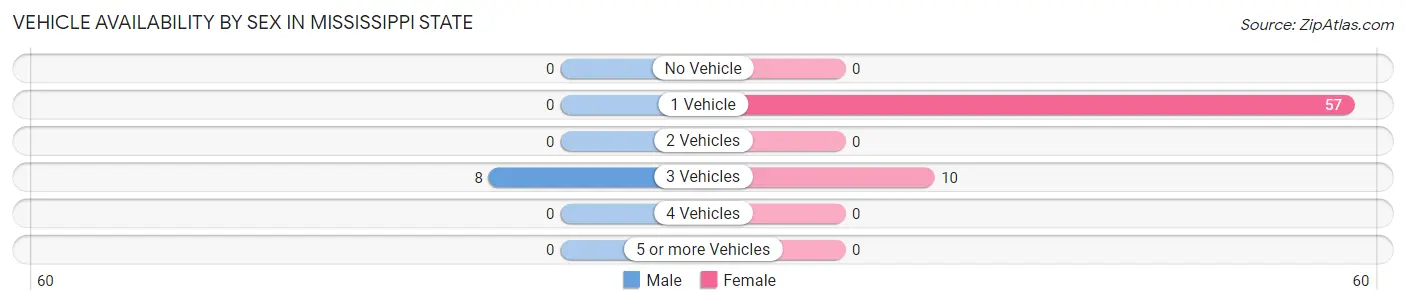
Vehicle Availability by Sex in Mississippi State
The most prevalent vehicle ownership categories in Mississippi State are males with 3 vehicles (8, accounting for 100.0%) and females with 3 vehicles (10, making up 11.9%).
| Vehicles Available | Male | Female |
| No Vehicle | 0 (0.0%) | 0 (0.0%) |
| 1 Vehicle | 0 (0.0%) | 57 (85.1%) |
| 2 Vehicles | 0 (0.0%) | 0 (0.0%) |
| 3 Vehicles | 8 (100.0%) | 10 (14.9%) |
| 4 Vehicles | 0 (0.0%) | 0 (0.0%) |
| 5 or more Vehicles | 0 (0.0%) | 0 (0.0%) |
| Total | 8 (100.0%) | 67 (100.0%) |
Commute Time in Mississippi State
The most frequently occuring commute durations in Mississippi State are 10 to 14 minutes (358 commuters, 44.9%), 5 to 9 minutes (167 commuters, 20.9%), and 15 to 19 minutes (119 commuters, 14.9%).
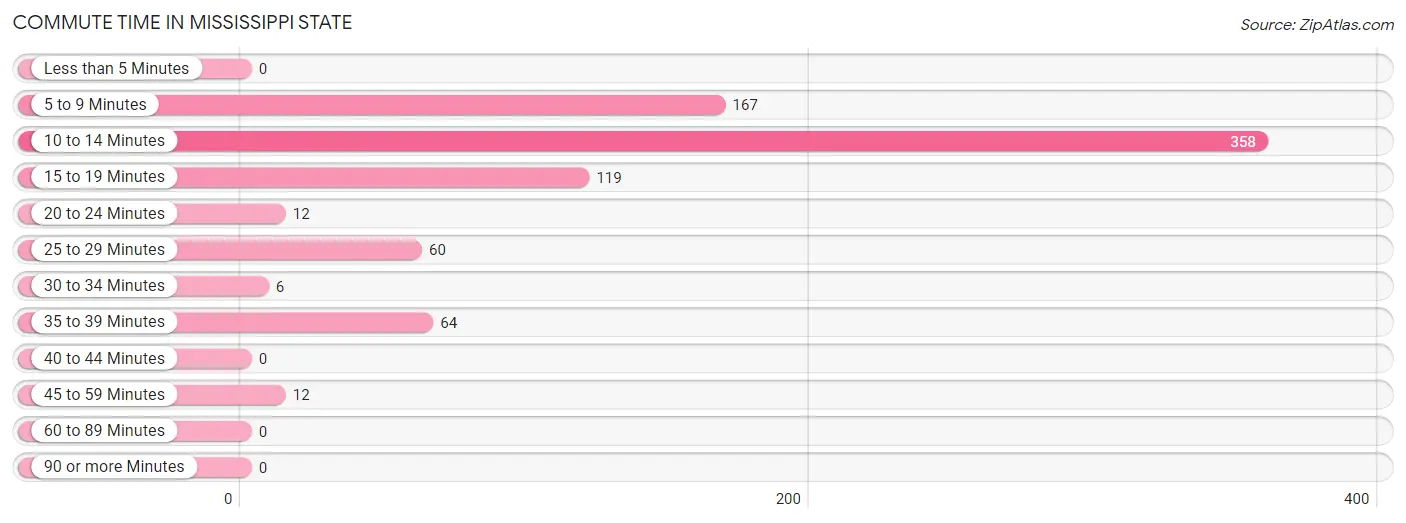
| Commute Time | # Commuters | % Commuters |
| Less than 5 Minutes | 0 | 0.0% |
| 5 to 9 Minutes | 167 | 20.9% |
| 10 to 14 Minutes | 358 | 44.9% |
| 15 to 19 Minutes | 119 | 14.9% |
| 20 to 24 Minutes | 12 | 1.5% |
| 25 to 29 Minutes | 60 | 7.5% |
| 30 to 34 Minutes | 6 | 0.7% |
| 35 to 39 Minutes | 64 | 8.0% |
| 40 to 44 Minutes | 0 | 0.0% |
| 45 to 59 Minutes | 12 | 1.5% |
| 60 to 89 Minutes | 0 | 0.0% |
| 90 or more Minutes | 0 | 0.0% |
Commute Time by Sex in Mississippi State
The most common commute times in Mississippi State are 10 to 14 minutes (91 commuters, 59.5%) for males and 10 to 14 minutes (267 commuters, 41.4%) for females.
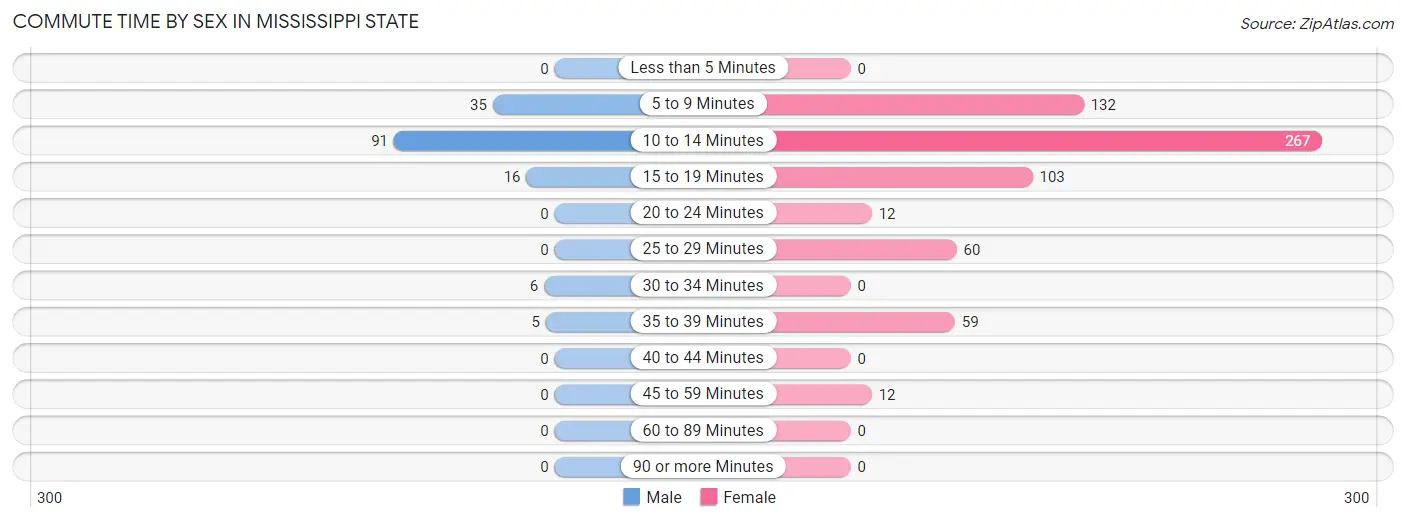
| Commute Time | Male | Female |
| Less than 5 Minutes | 0 (0.0%) | 0 (0.0%) |
| 5 to 9 Minutes | 35 (22.9%) | 132 (20.5%) |
| 10 to 14 Minutes | 91 (59.5%) | 267 (41.4%) |
| 15 to 19 Minutes | 16 (10.5%) | 103 (16.0%) |
| 20 to 24 Minutes | 0 (0.0%) | 12 (1.9%) |
| 25 to 29 Minutes | 0 (0.0%) | 60 (9.3%) |
| 30 to 34 Minutes | 6 (3.9%) | 0 (0.0%) |
| 35 to 39 Minutes | 5 (3.3%) | 59 (9.1%) |
| 40 to 44 Minutes | 0 (0.0%) | 0 (0.0%) |
| 45 to 59 Minutes | 0 (0.0%) | 12 (1.9%) |
| 60 to 89 Minutes | 0 (0.0%) | 0 (0.0%) |
| 90 or more Minutes | 0 (0.0%) | 0 (0.0%) |
Time of Departure to Work by Sex in Mississippi State
The most frequent times of departure to work in Mississippi State are 4:00 PM to 11:59 PM (46, 30.1%) for males and 12:00 PM to 3:59 PM (228, 35.3%) for females.
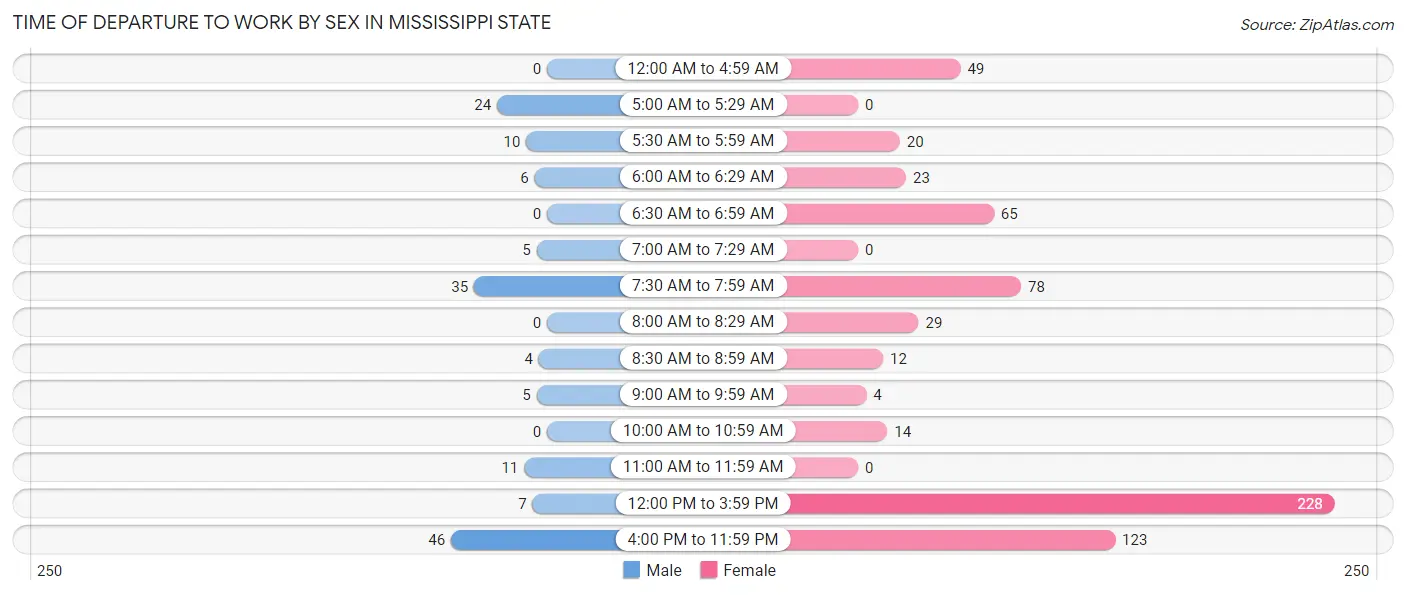
| Time of Departure | Male | Female |
| 12:00 AM to 4:59 AM | 0 (0.0%) | 49 (7.6%) |
| 5:00 AM to 5:29 AM | 24 (15.7%) | 0 (0.0%) |
| 5:30 AM to 5:59 AM | 10 (6.5%) | 20 (3.1%) |
| 6:00 AM to 6:29 AM | 6 (3.9%) | 23 (3.6%) |
| 6:30 AM to 6:59 AM | 0 (0.0%) | 65 (10.1%) |
| 7:00 AM to 7:29 AM | 5 (3.3%) | 0 (0.0%) |
| 7:30 AM to 7:59 AM | 35 (22.9%) | 78 (12.1%) |
| 8:00 AM to 8:29 AM | 0 (0.0%) | 29 (4.5%) |
| 8:30 AM to 8:59 AM | 4 (2.6%) | 12 (1.9%) |
| 9:00 AM to 9:59 AM | 5 (3.3%) | 4 (0.6%) |
| 10:00 AM to 10:59 AM | 0 (0.0%) | 14 (2.2%) |
| 11:00 AM to 11:59 AM | 11 (7.2%) | 0 (0.0%) |
| 12:00 PM to 3:59 PM | 7 (4.6%) | 228 (35.3%) |
| 4:00 PM to 11:59 PM | 46 (30.1%) | 123 (19.1%) |
| Total | 153 (100.0%) | 645 (100.0%) |
Housing Occupancy in Mississippi State
Occupancy by Ownership in Mississippi State
Of the total 65 dwellings in Mississippi State, owner-occupied units account for 8 (12.3%), while renter-occupied units make up 57 (87.7%).
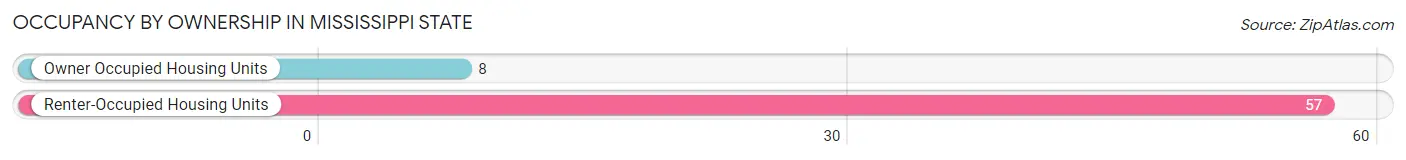
| Occupancy | # Housing Units | % Housing Units |
| Owner Occupied Housing Units | 8 | 12.3% |
| Renter-Occupied Housing Units | 57 | 87.7% |
| Total Occupied Housing Units | 65 | 100.0% |
Occupancy by Household Size in Mississippi State
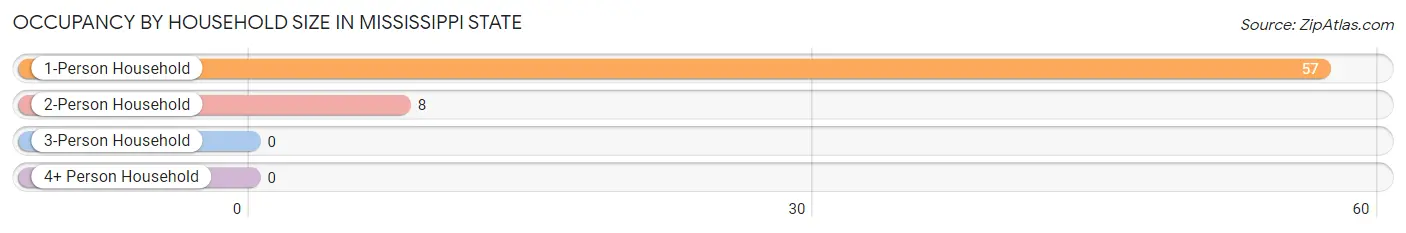
| Household Size | # Housing Units | % Housing Units |
| 1-Person Household | 57 | 87.7% |
| 2-Person Household | 8 | 12.3% |
| 3-Person Household | 0 | 0.0% |
| 4+ Person Household | 0 | 0.0% |
| Total Housing Units | 65 | 100.0% |
Occupancy by Ownership by Household Size in Mississippi State
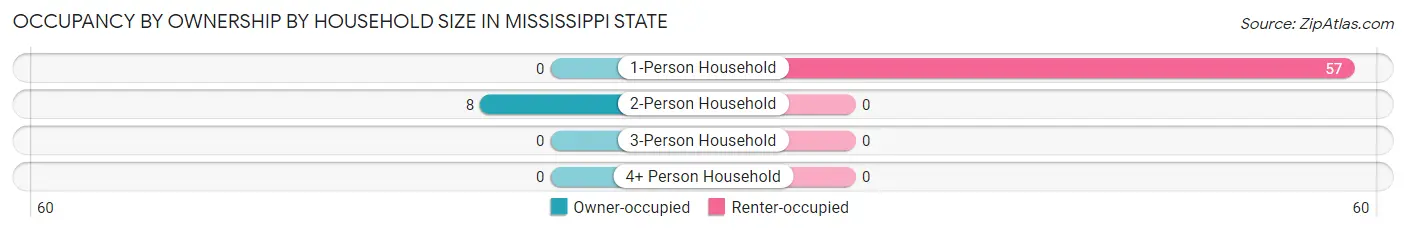
| Household Size | Owner-occupied | Renter-occupied |
| 1-Person Household | 0 (0.0%) | 57 (100.0%) |
| 2-Person Household | 8 (100.0%) | 0 (0.0%) |
| 3-Person Household | 0 (0.0%) | 0 (0.0%) |
| 4+ Person Household | 0 (0.0%) | 0 (0.0%) |
| Total Housing Units | 8 (12.3%) | 57 (87.7%) |
Occupancy by Educational Attainment in Mississippi State
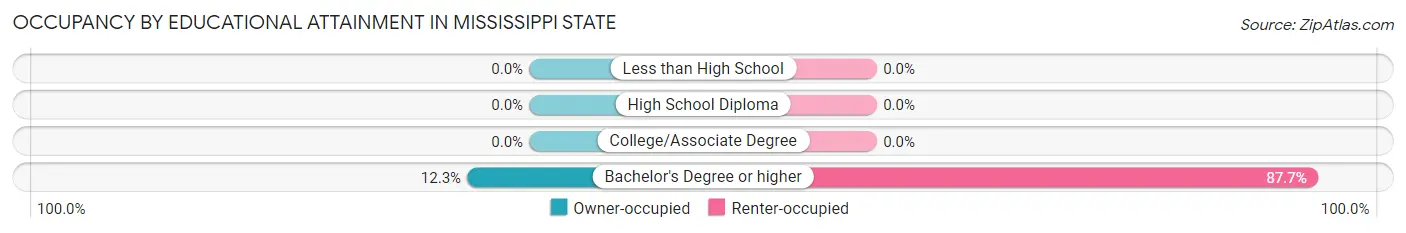
| Household Size | Owner-occupied | Renter-occupied |
| Less than High School | 0 (0.0%) | 0 (0.0%) |
| High School Diploma | 0 (0.0%) | 0 (0.0%) |
| College/Associate Degree | 0 (0.0%) | 0 (0.0%) |
| Bachelor's Degree or higher | 8 (12.3%) | 57 (87.7%) |
Occupancy by Age of Householder in Mississippi State
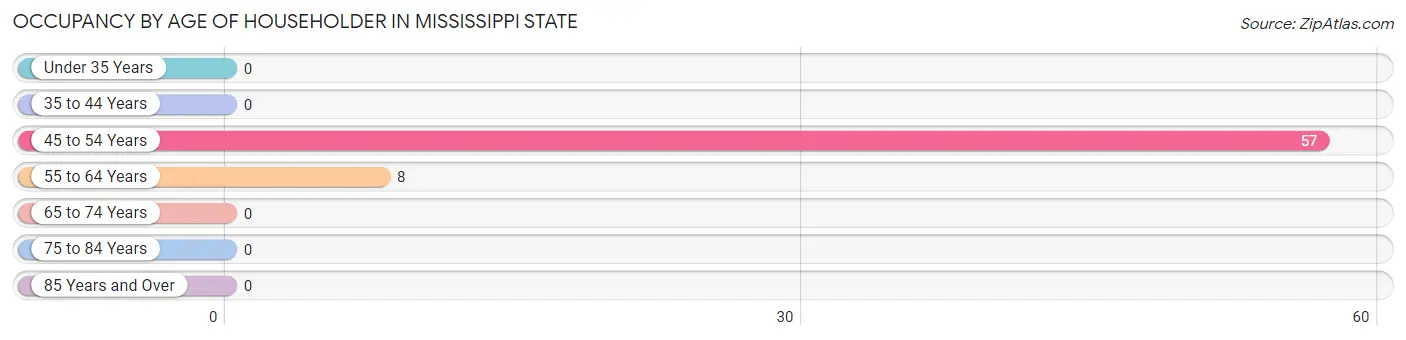
| Age Bracket | # Households | % Households |
| Under 35 Years | 0 | 0.0% |
| 35 to 44 Years | 0 | 0.0% |
| 45 to 54 Years | 57 | 87.7% |
| 55 to 64 Years | 8 | 12.3% |
| 65 to 74 Years | 0 | 0.0% |
| 75 to 84 Years | 0 | 0.0% |
| 85 Years and Over | 0 | 0.0% |
| Total | 65 | 100.0% |
Housing Finances in Mississippi State
Median Income by Occupancy in Mississippi State
| Occupancy Type | # Households | Median Income |
| Owner-Occupied | 8 (12.3%) | $0 |
| Renter-Occupied | 57 (87.7%) | $0 |
| Average | 65 (100.0%) | $0 |
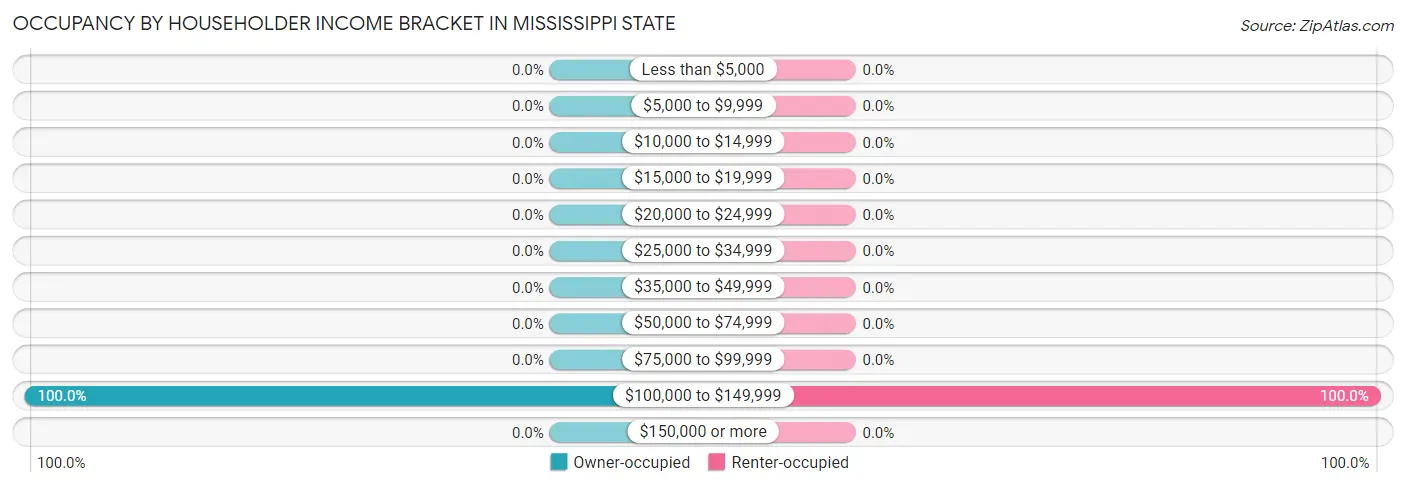
Occupancy by Householder Income Bracket in Mississippi State
| Income Bracket | Owner-occupied | Renter-occupied |
| Less than $5,000 | 0 (0.0%) | 0 (0.0%) |
| $5,000 to $9,999 | 0 (0.0%) | 0 (0.0%) |
| $10,000 to $14,999 | 0 (0.0%) | 0 (0.0%) |
| $15,000 to $19,999 | 0 (0.0%) | 0 (0.0%) |
| $20,000 to $24,999 | 0 (0.0%) | 0 (0.0%) |
| $25,000 to $34,999 | 0 (0.0%) | 0 (0.0%) |
| $35,000 to $49,999 | 0 (0.0%) | 0 (0.0%) |
| $50,000 to $74,999 | 0 (0.0%) | 0 (0.0%) |
| $75,000 to $99,999 | 0 (0.0%) | 0 (0.0%) |
| $100,000 to $149,999 | 8 (100.0%) | 57 (100.0%) |
| $150,000 or more | 0 (0.0%) | 0 (0.0%) |
| Total | 8 (100.0%) | 57 (100.0%) |
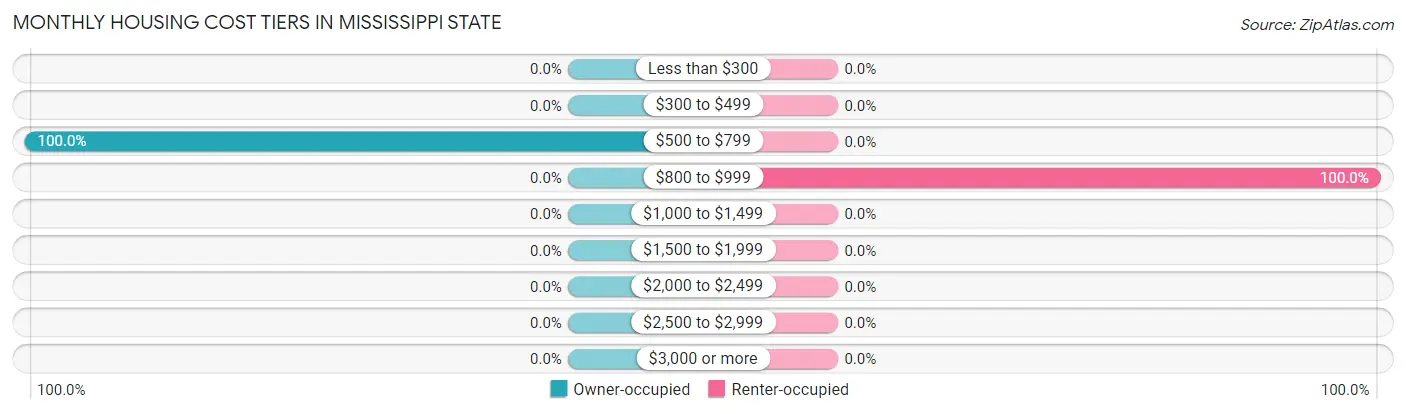
Monthly Housing Cost Tiers in Mississippi State
| Monthly Cost | Owner-occupied | Renter-occupied |
| Less than $300 | 0 (0.0%) | 0 (0.0%) |
| $300 to $499 | 0 (0.0%) | 0 (0.0%) |
| $500 to $799 | 8 (100.0%) | 0 (0.0%) |
| $800 to $999 | 0 (0.0%) | 57 (100.0%) |
| $1,000 to $1,499 | 0 (0.0%) | 0 (0.0%) |
| $1,500 to $1,999 | 0 (0.0%) | 0 (0.0%) |
| $2,000 to $2,499 | 0 (0.0%) | 0 (0.0%) |
| $2,500 to $2,999 | 0 (0.0%) | 0 (0.0%) |
| $3,000 or more | 0 (0.0%) | 0 (0.0%) |
| Total | 8 (100.0%) | 57 (100.0%) |
Physical Housing Characteristics in Mississippi State
Housing Structures in Mississippi State
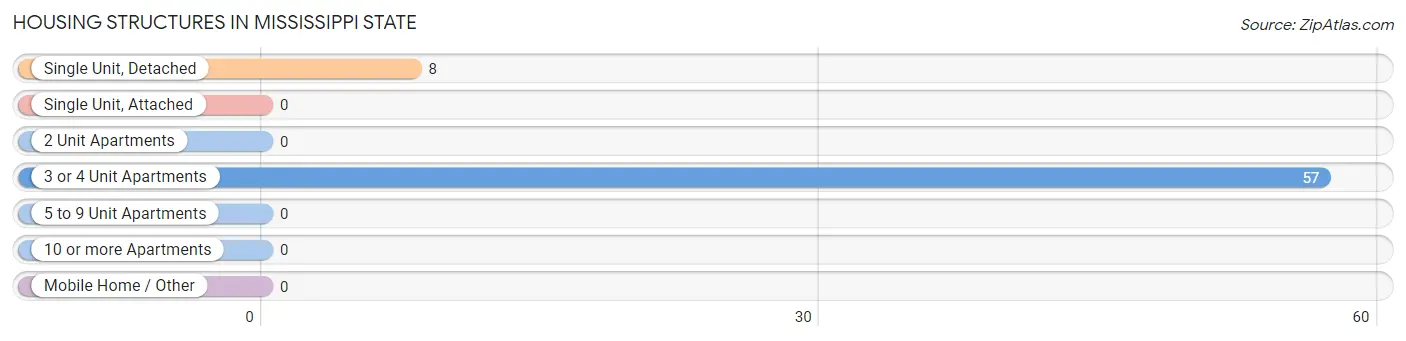
| Structure Type | # Housing Units | % Housing Units |
| Single Unit, Detached | 8 | 12.3% |
| Single Unit, Attached | 0 | 0.0% |
| 2 Unit Apartments | 0 | 0.0% |
| 3 or 4 Unit Apartments | 57 | 87.7% |
| 5 to 9 Unit Apartments | 0 | 0.0% |
| 10 or more Apartments | 0 | 0.0% |
| Mobile Home / Other | 0 | 0.0% |
| Total | 65 | 100.0% |
Housing Structures by Occupancy in Mississippi State
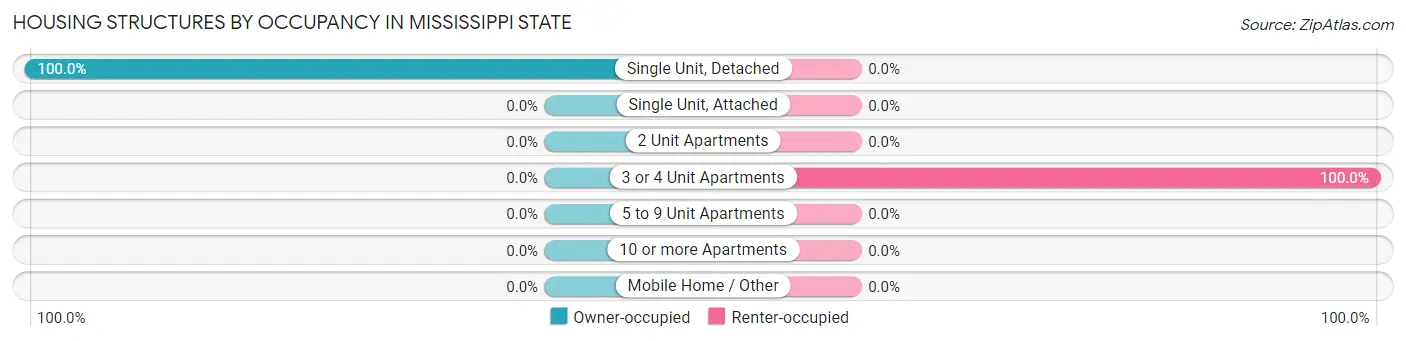
| Structure Type | Owner-occupied | Renter-occupied |
| Single Unit, Detached | 8 (100.0%) | 0 (0.0%) |
| Single Unit, Attached | 0 (0.0%) | 0 (0.0%) |
| 2 Unit Apartments | 0 (0.0%) | 0 (0.0%) |
| 3 or 4 Unit Apartments | 0 (0.0%) | 57 (100.0%) |
| 5 to 9 Unit Apartments | 0 (0.0%) | 0 (0.0%) |
| 10 or more Apartments | 0 (0.0%) | 0 (0.0%) |
| Mobile Home / Other | 0 (0.0%) | 0 (0.0%) |
| Total | 8 (12.3%) | 57 (87.7%) |
Housing Structures by Number of Rooms in Mississippi State
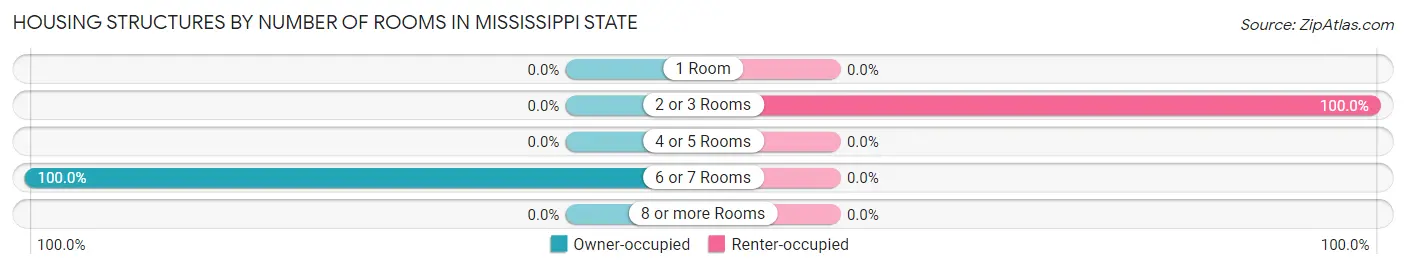
| Number of Rooms | Owner-occupied | Renter-occupied |
| 1 Room | 0 (0.0%) | 0 (0.0%) |
| 2 or 3 Rooms | 0 (0.0%) | 57 (100.0%) |
| 4 or 5 Rooms | 0 (0.0%) | 0 (0.0%) |
| 6 or 7 Rooms | 8 (100.0%) | 0 (0.0%) |
| 8 or more Rooms | 0 (0.0%) | 0 (0.0%) |
| Total | 8 (100.0%) | 57 (100.0%) |
Housing Structure by Heating Type in Mississippi State
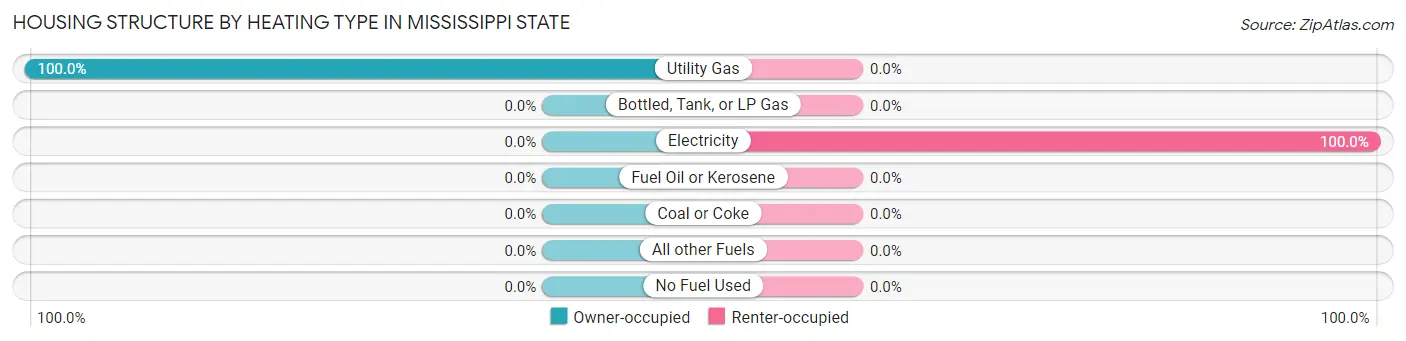
| Heating Type | Owner-occupied | Renter-occupied |
| Utility Gas | 8 (100.0%) | 0 (0.0%) |
| Bottled, Tank, or LP Gas | 0 (0.0%) | 0 (0.0%) |
| Electricity | 0 (0.0%) | 57 (100.0%) |
| Fuel Oil or Kerosene | 0 (0.0%) | 0 (0.0%) |
| Coal or Coke | 0 (0.0%) | 0 (0.0%) |
| All other Fuels | 0 (0.0%) | 0 (0.0%) |
| No Fuel Used | 0 (0.0%) | 0 (0.0%) |
| Total | 8 (100.0%) | 57 (100.0%) |
Household Vehicle Usage in Mississippi State
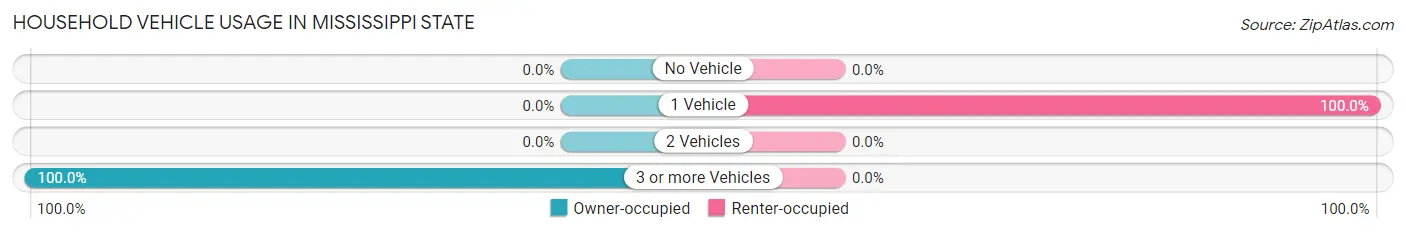
| Vehicles per Household | Owner-occupied | Renter-occupied |
| No Vehicle | 0 (0.0%) | 0 (0.0%) |
| 1 Vehicle | 0 (0.0%) | 57 (100.0%) |
| 2 Vehicles | 0 (0.0%) | 0 (0.0%) |
| 3 or more Vehicles | 8 (100.0%) | 0 (0.0%) |
| Total | 8 (100.0%) | 57 (100.0%) |
Real Estate & Mortgages in Mississippi State
Real Estate and Mortgage Overview in Mississippi State
| Characteristic | Without Mortgage | With Mortgage |
| Housing Units | 8 | 0 |
| Median Property Value | - | - |
| Median Household Income | - | - |
| Monthly Housing Costs | - | - |
| Real Estate Taxes | - | - |
Property Value by Mortgage Status in Mississippi State
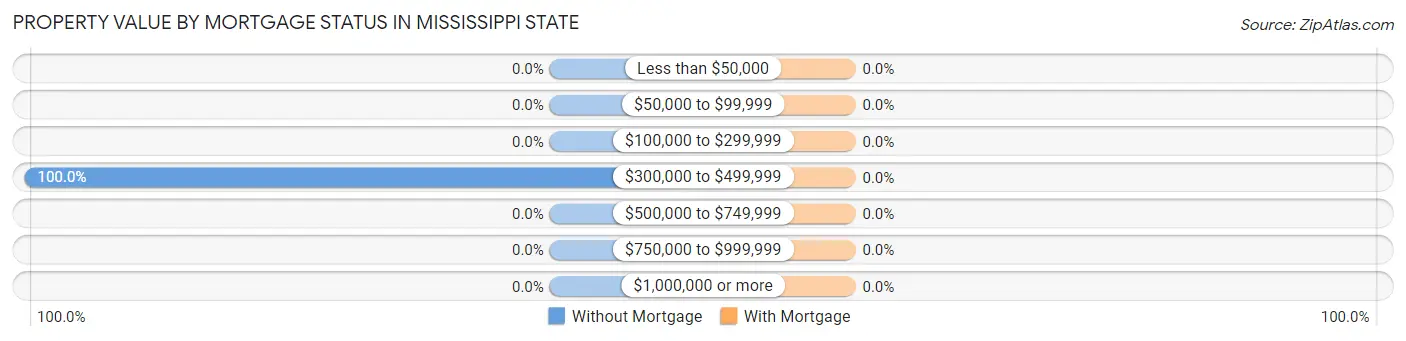
| Property Value | Without Mortgage | With Mortgage |
| Less than $50,000 | 0 (0.0%) | 0 (0.0%) |
| $50,000 to $99,999 | 0 (0.0%) | 0 (0.0%) |
| $100,000 to $299,999 | 0 (0.0%) | 0 (0.0%) |
| $300,000 to $499,999 | 8 (100.0%) | 0 (0.0%) |
| $500,000 to $749,999 | 0 (0.0%) | 0 (0.0%) |
| $750,000 to $999,999 | 0 (0.0%) | 0 (0.0%) |
| $1,000,000 or more | 0 (0.0%) | 0 (0.0%) |
| Total | 8 (100.0%) | 0 (0.0%) |
Household Income by Mortgage Status in Mississippi State
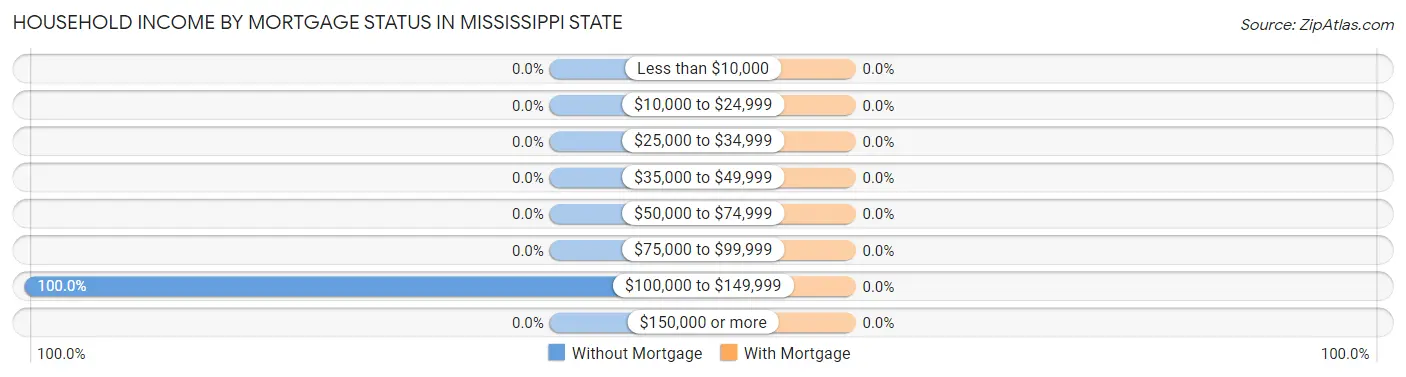
| Household Income | Without Mortgage | With Mortgage |
| Less than $10,000 | 0 (0.0%) | 0 (0.0%) |
| $10,000 to $24,999 | 0 (0.0%) | 0 (0.0%) |
| $25,000 to $34,999 | 0 (0.0%) | 0 (0.0%) |
| $35,000 to $49,999 | 0 (0.0%) | 0 (0.0%) |
| $50,000 to $74,999 | 0 (0.0%) | 0 (0.0%) |
| $75,000 to $99,999 | 0 (0.0%) | 0 (0.0%) |
| $100,000 to $149,999 | 8 (100.0%) | 0 (0.0%) |
| $150,000 or more | 0 (0.0%) | 0 (0.0%) |
| Total | 8 (100.0%) | 0 (0.0%) |
Property Value to Household Income Ratio in Mississippi State
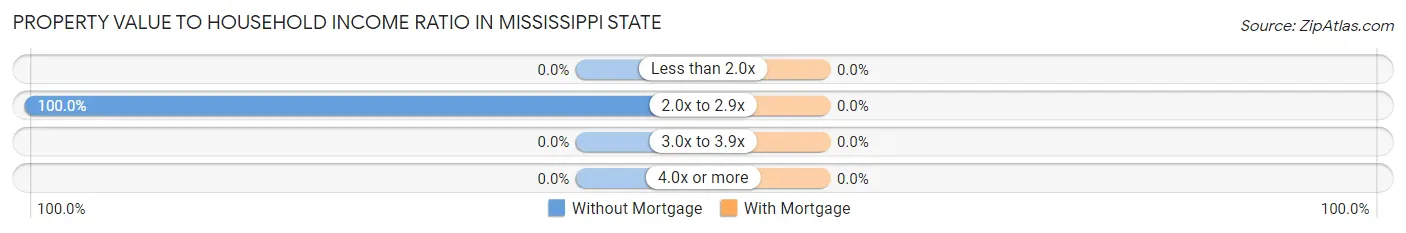
| Value-to-Income Ratio | Without Mortgage | With Mortgage |
| Less than 2.0x | 0 (0.0%) | 0 (0.0%) |
| 2.0x to 2.9x | 8 (100.0%) | 0 (0.0%) |
| 3.0x to 3.9x | 0 (0.0%) | 0 (0.0%) |
| 4.0x or more | 0 (0.0%) | 0 (0.0%) |
| Total | 8 (100.0%) | 0 (0.0%) |
Real Estate Taxes by Mortgage Status in Mississippi State
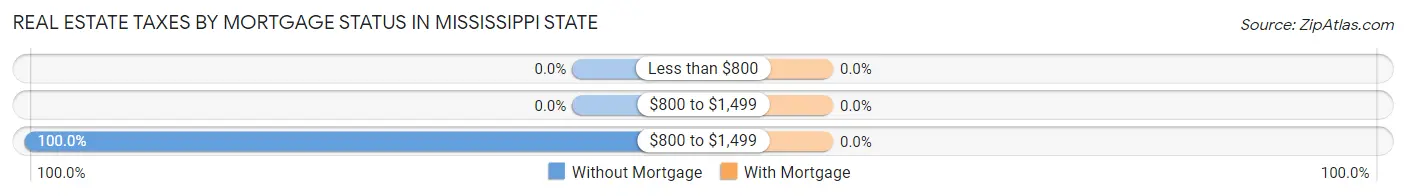
| Property Taxes | Without Mortgage | With Mortgage |
| Less than $800 | 0 (0.0%) | 0 (0.0%) |
| $800 to $1,499 | 0 (0.0%) | 0 (0.0%) |
| $800 to $1,499 | 8 (100.0%) | 0 (0.0%) |
| Total | 8 (100.0%) | 0 (0.0%) |
Health & Disability in Mississippi State
Health Insurance Coverage by Age in Mississippi State
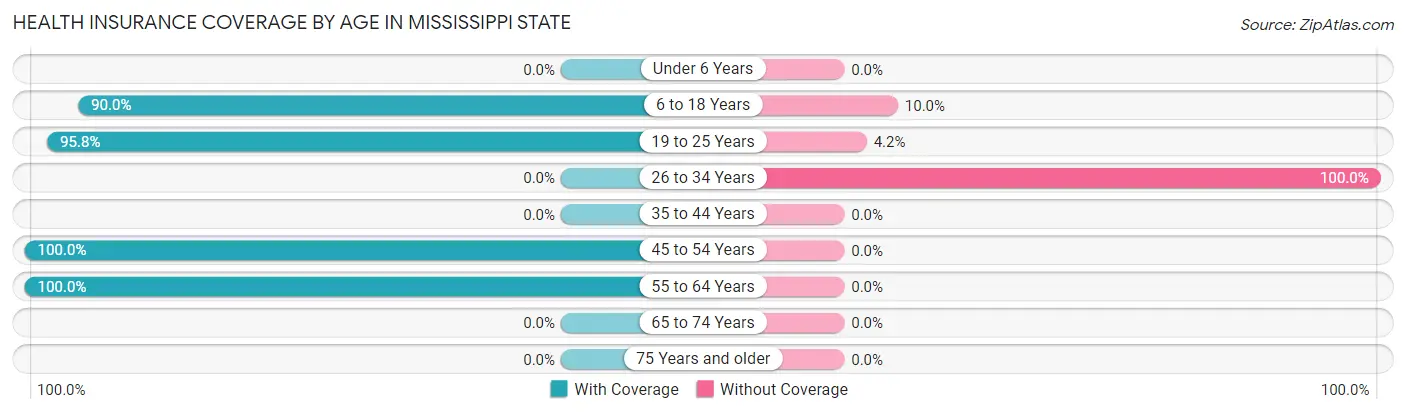
| Age Bracket | With Coverage | Without Coverage |
| Under 6 Years | 0 (0.0%) | 0 (0.0%) |
| 6 to 18 Years | 1,496 (90.0%) | 166 (10.0%) |
| 19 to 25 Years | 2,245 (95.8%) | 98 (4.2%) |
| 26 to 34 Years | 0 (0.0%) | 15 (100.0%) |
| 35 to 44 Years | 0 (0.0%) | 0 (0.0%) |
| 45 to 54 Years | 57 (100.0%) | 0 (0.0%) |
| 55 to 64 Years | 18 (100.0%) | 0 (0.0%) |
| 65 to 74 Years | 0 (0.0%) | 0 (0.0%) |
| 75 Years and older | 0 (0.0%) | 0 (0.0%) |
| Total | 3,816 (93.2%) | 279 (6.8%) |
Health Insurance Coverage by Citizenship Status in Mississippi State
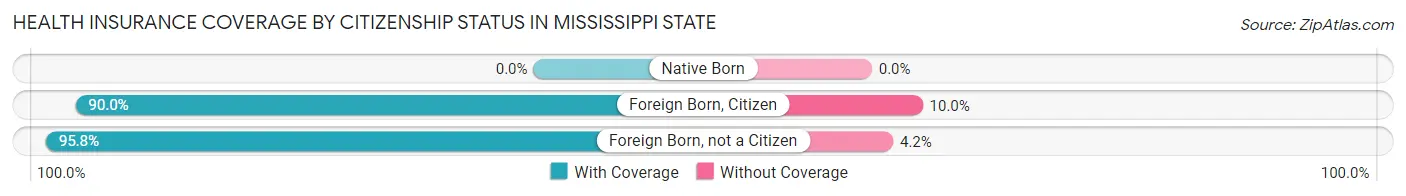
| Citizenship Status | With Coverage | Without Coverage |
| Native Born | 0 (0.0%) | 0 (0.0%) |
| Foreign Born, Citizen | 1,496 (90.0%) | 166 (10.0%) |
| Foreign Born, not a Citizen | 2,245 (95.8%) | 98 (4.2%) |
Health Insurance Coverage by Household Income in Mississippi State
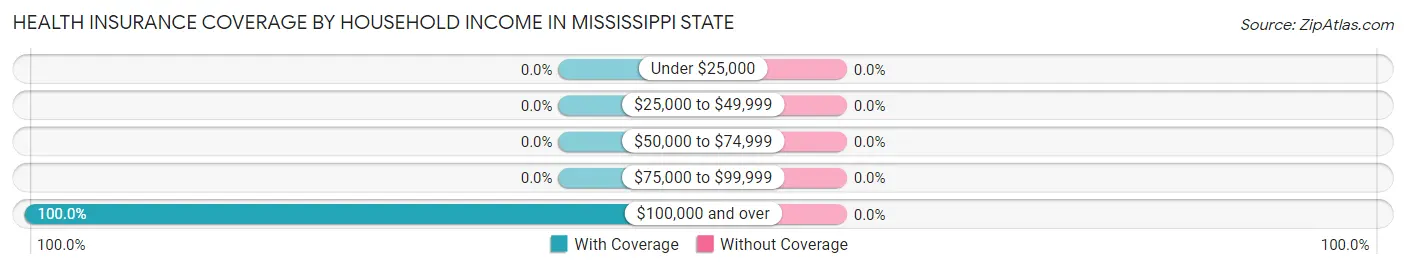
| Household Income | With Coverage | Without Coverage |
| Under $25,000 | 0 (0.0%) | 0 (0.0%) |
| $25,000 to $49,999 | 0 (0.0%) | 0 (0.0%) |
| $50,000 to $74,999 | 0 (0.0%) | 0 (0.0%) |
| $75,000 to $99,999 | 0 (0.0%) | 0 (0.0%) |
| $100,000 and over | 75 (100.0%) | 0 (0.0%) |
Public vs Private Health Insurance Coverage by Age in Mississippi State
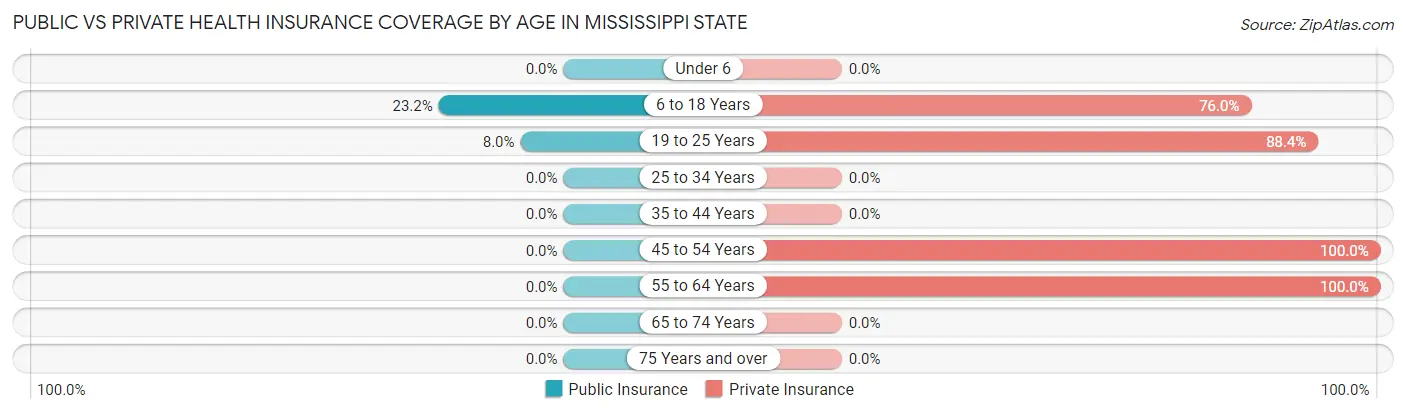
| Age Bracket | Public Insurance | Private Insurance |
| Under 6 | 0 (0.0%) | 0 (0.0%) |
| 6 to 18 Years | 385 (23.2%) | 1,263 (76.0%) |
| 19 to 25 Years | 187 (8.0%) | 2,072 (88.4%) |
| 25 to 34 Years | 0 (0.0%) | 0 (0.0%) |
| 35 to 44 Years | 0 (0.0%) | 0 (0.0%) |
| 45 to 54 Years | 0 (0.0%) | 57 (100.0%) |
| 55 to 64 Years | 0 (0.0%) | 18 (100.0%) |
| 65 to 74 Years | 0 (0.0%) | 0 (0.0%) |
| 75 Years and over | 0 (0.0%) | 0 (0.0%) |
| Total | 572 (14.0%) | 3,410 (83.3%) |
Disability Status by Sex by Age in Mississippi State
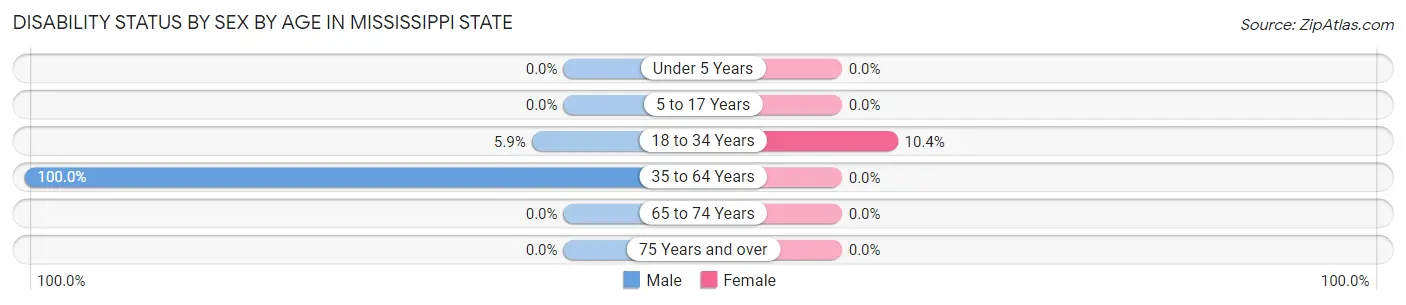
| Age Bracket | Male | Female |
| Under 5 Years | 0 (0.0%) | 0 (0.0%) |
| 5 to 17 Years | 0 (0.0%) | 0 (0.0%) |
| 18 to 34 Years | 82 (5.9%) | 267 (10.3%) |
| 35 to 64 Years | 8 (100.0%) | 0 (0.0%) |
| 65 to 74 Years | 0 (0.0%) | 0 (0.0%) |
| 75 Years and over | 0 (0.0%) | 0 (0.0%) |
Disability Class by Sex by Age in Mississippi State
Disability Class: Hearing Difficulty
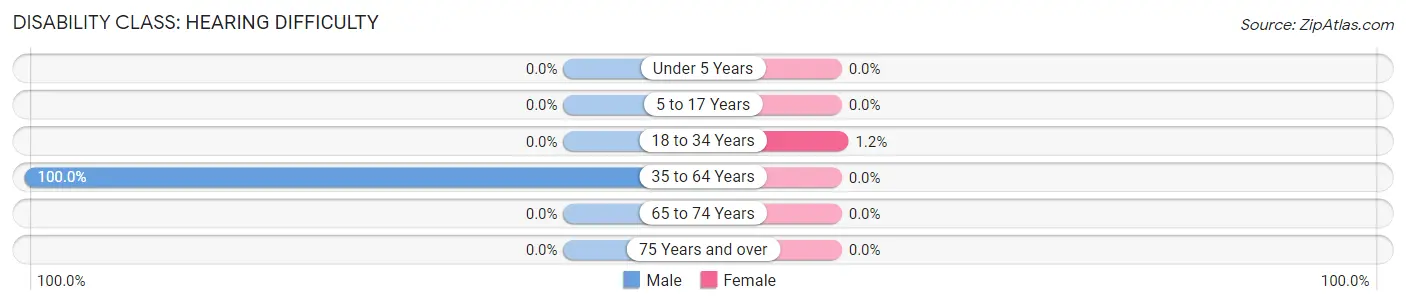
| Age Bracket | Male | Female |
| Under 5 Years | 0 (0.0%) | 0 (0.0%) |
| 5 to 17 Years | 0 (0.0%) | 0 (0.0%) |
| 18 to 34 Years | 0 (0.0%) | 32 (1.2%) |
| 35 to 64 Years | 8 (100.0%) | 0 (0.0%) |
| 65 to 74 Years | 0 (0.0%) | 0 (0.0%) |
| 75 Years and over | 0 (0.0%) | 0 (0.0%) |
Disability Class: Vision Difficulty
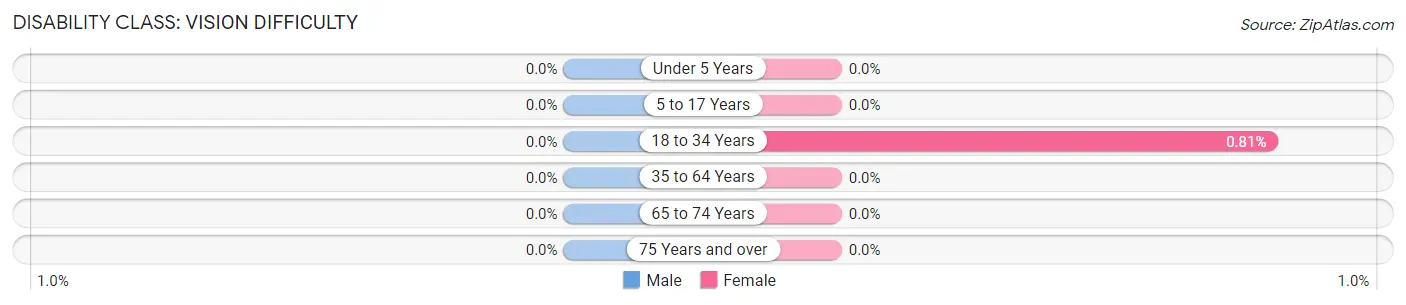
| Age Bracket | Male | Female |
| Under 5 Years | 0 (0.0%) | 0 (0.0%) |
| 5 to 17 Years | 0 (0.0%) | 0 (0.0%) |
| 18 to 34 Years | 0 (0.0%) | 21 (0.8%) |
| 35 to 64 Years | 0 (0.0%) | 0 (0.0%) |
| 65 to 74 Years | 0 (0.0%) | 0 (0.0%) |
| 75 Years and over | 0 (0.0%) | 0 (0.0%) |
Disability Class: Cognitive Difficulty
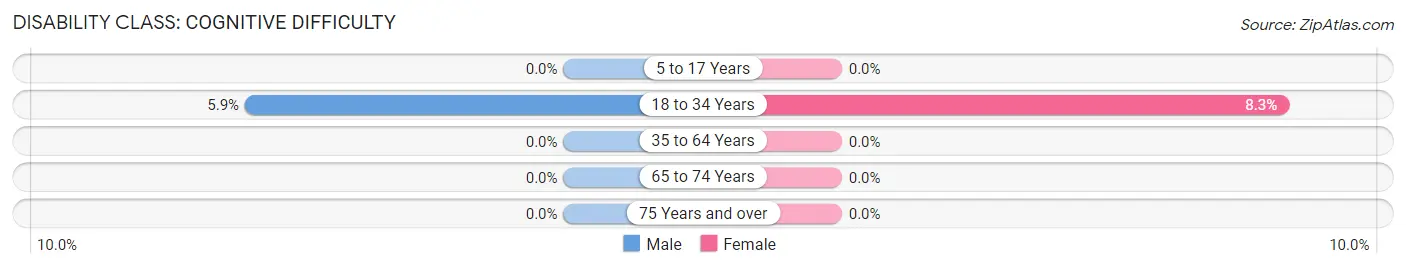
| Age Bracket | Male | Female |
| 5 to 17 Years | 0 (0.0%) | 0 (0.0%) |
| 18 to 34 Years | 82 (5.9%) | 214 (8.3%) |
| 35 to 64 Years | 0 (0.0%) | 0 (0.0%) |
| 65 to 74 Years | 0 (0.0%) | 0 (0.0%) |
| 75 Years and over | 0 (0.0%) | 0 (0.0%) |
Disability Class: Ambulatory Difficulty
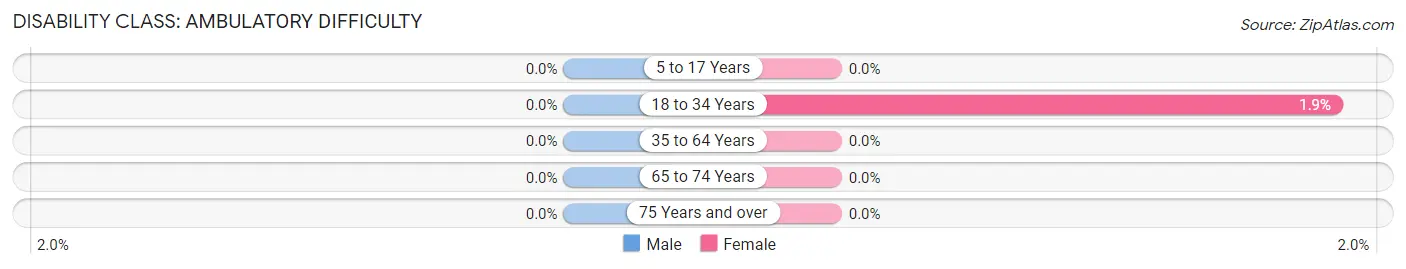
| Age Bracket | Male | Female |
| 5 to 17 Years | 0 (0.0%) | 0 (0.0%) |
| 18 to 34 Years | 0 (0.0%) | 48 (1.9%) |
| 35 to 64 Years | 0 (0.0%) | 0 (0.0%) |
| 65 to 74 Years | 0 (0.0%) | 0 (0.0%) |
| 75 Years and over | 0 (0.0%) | 0 (0.0%) |
Disability Class: Self-Care Difficulty
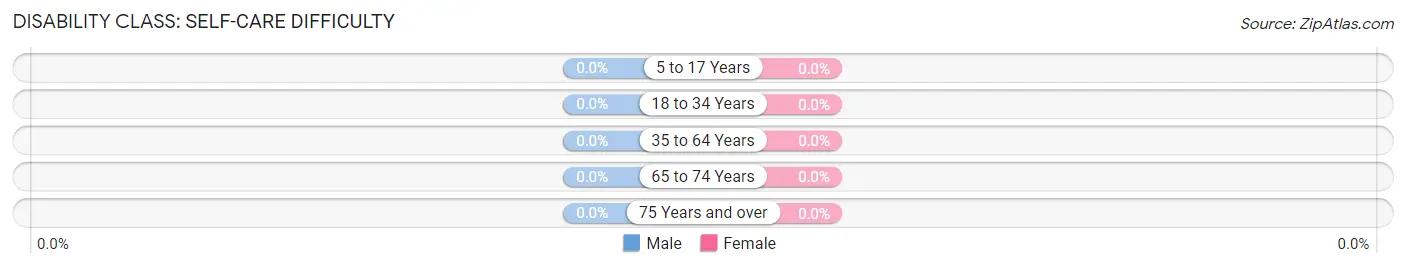
| Age Bracket | Male | Female |
| 5 to 17 Years | 0 (0.0%) | 0 (0.0%) |
| 18 to 34 Years | 0 (0.0%) | 0 (0.0%) |
| 35 to 64 Years | 0 (0.0%) | 0 (0.0%) |
| 65 to 74 Years | 0 (0.0%) | 0 (0.0%) |
| 75 Years and over | 0 (0.0%) | 0 (0.0%) |
Technology Access in Mississippi State
Computing Device Access in Mississippi State
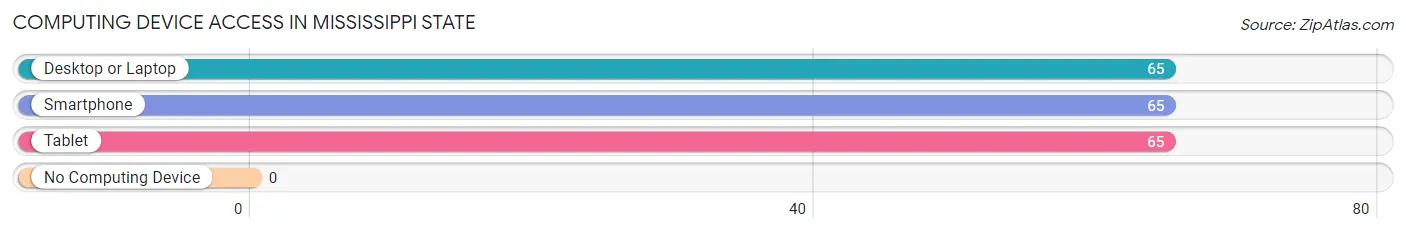
| Device Type | # Households | % Households |
| Desktop or Laptop | 65 | 100.0% |
| Smartphone | 65 | 100.0% |
| Tablet | 65 | 100.0% |
| No Computing Device | 0 | 0.0% |
| Total | 65 | 100.0% |
Internet Access in Mississippi State
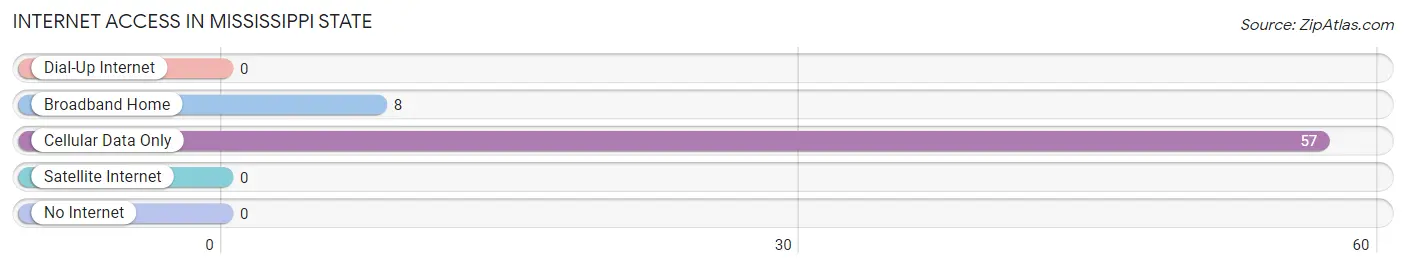
| Internet Type | # Households | % Households |
| Dial-Up Internet | 0 | 0.0% |
| Broadband Home | 8 | 12.3% |
| Cellular Data Only | 57 | 87.7% |
| Satellite Internet | 0 | 0.0% |
| No Internet | 0 | 0.0% |
| Total | 65 | 100.0% |
Mississippi State Summary
Mississippi State, MS is a city located in Oktibbeha County, Mississippi. It is the county seat of Oktibbeha County and is home to Mississippi State University. The city has a population of 23,640 according to the 2010 census.
History
Mississippi State, MS was founded in 1821 as a trading post. The city was originally known as LeFleur’s Bluff, named after the French-Canadian trader who established the post. In 1826, the city was renamed Mississippi State and became the county seat of Oktibbeha County.
In 1878, the city was chosen as the site of the newly established Mississippi State University. The university was established as a land-grant college and was the first public university in the state.
Geography
Mississippi State, MS is located in the northeastern part of the state, about 80 miles northeast of Jackson, the state capital. The city is situated on the banks of the Tombigbee River and is surrounded by rolling hills and forests.
The city has a total area of 8.3 square miles, of which 8.2 square miles is land and 0.1 square miles is water. The city has a humid subtropical climate, with hot, humid summers and mild winters.
Economy
Mississippi State, MS is home to Mississippi State University, which is the largest employer in the city. Other major employers in the city include the Oktibbeha County School District, the Mississippi Department of Transportation, and the Mississippi Department of Corrections.
The city also has a thriving retail sector, with several shopping centers and malls located in the city. The city is also home to several manufacturing companies, including furniture and automotive parts manufacturers.
Demographics
According to the 2010 census, the population of Mississippi State, MS was 23,640. The racial makeup of the city was 68.3% White, 28.2% African American, 0.3% Native American, 1.2% Asian, 0.1% Pacific Islander, 0.7% from other races, and 1.4% from two or more races. Hispanic or Latino of any race were 2.2% of the population.
The median income for a household in the city was $30,945, and the median income for a family was $41,945. The per capita income for the city was $17,845. About 17.2% of families and 24.2% of the population were below the poverty line, including 33.2% of those under age 18 and 11.2% of those age 65 or over.
Common Questions
What is the Total Population of Mississippi State?
Total Population of Mississippi State is 4,095.
What is the Total Male Population of Mississippi State?
Total Male Population of Mississippi State is 1,433.
What is the Total Female Population of Mississippi State?
Total Female Population of Mississippi State is 2,662.
What is the Ratio of Males per 100 Females in Mississippi State?
There are 53.83 Males per 100 Females in Mississippi State.
What is the Ratio of Females per 100 Males in Mississippi State?
There are 185.76 Females per 100 Males in Mississippi State.
What is the Median Population Age in Mississippi State?
Median Population Age in Mississippi State is 19.3 Years.
What is the Average Family Size in Mississippi State
Average Family Size in Mississippi State is 2.2 People.
What is the Average Household Size in Mississippi State
Average Household Size in Mississippi State is 1.1 People.
What is Per Capita Income in Mississippi State?
Per Capita income in Mississippi State is $7,326.
What is Income or Wage Gap in Mississippi State?
Income or Wage Gap in Mississippi State is 22.3%.
Women in Mississippi State earn 77.7 cents for every dollar earned by a man.
What is Inequality or Gini Index in Mississippi State?
Inequality or Gini Index in Mississippi State is 0.02.
How Large is the Labor Force in Mississippi State?
There are 1,114 People in the Labor Forcein in Mississippi State.
What is the Percentage of People in the Labor Force in Mississippi State?
27.2% of People are in the Labor Force in Mississippi State.
What is the Unemployment Rate in Mississippi State?
Unemployment Rate in Mississippi State is 10.9%.