Zip Codes with the Highest Percentage of Population Employed in Health Diagnosing & Treating in Springfield, MO
RELATED REPORTS & OPTIONS
Health Diagnosing & Treating
Springfield
Compare Zip Codes
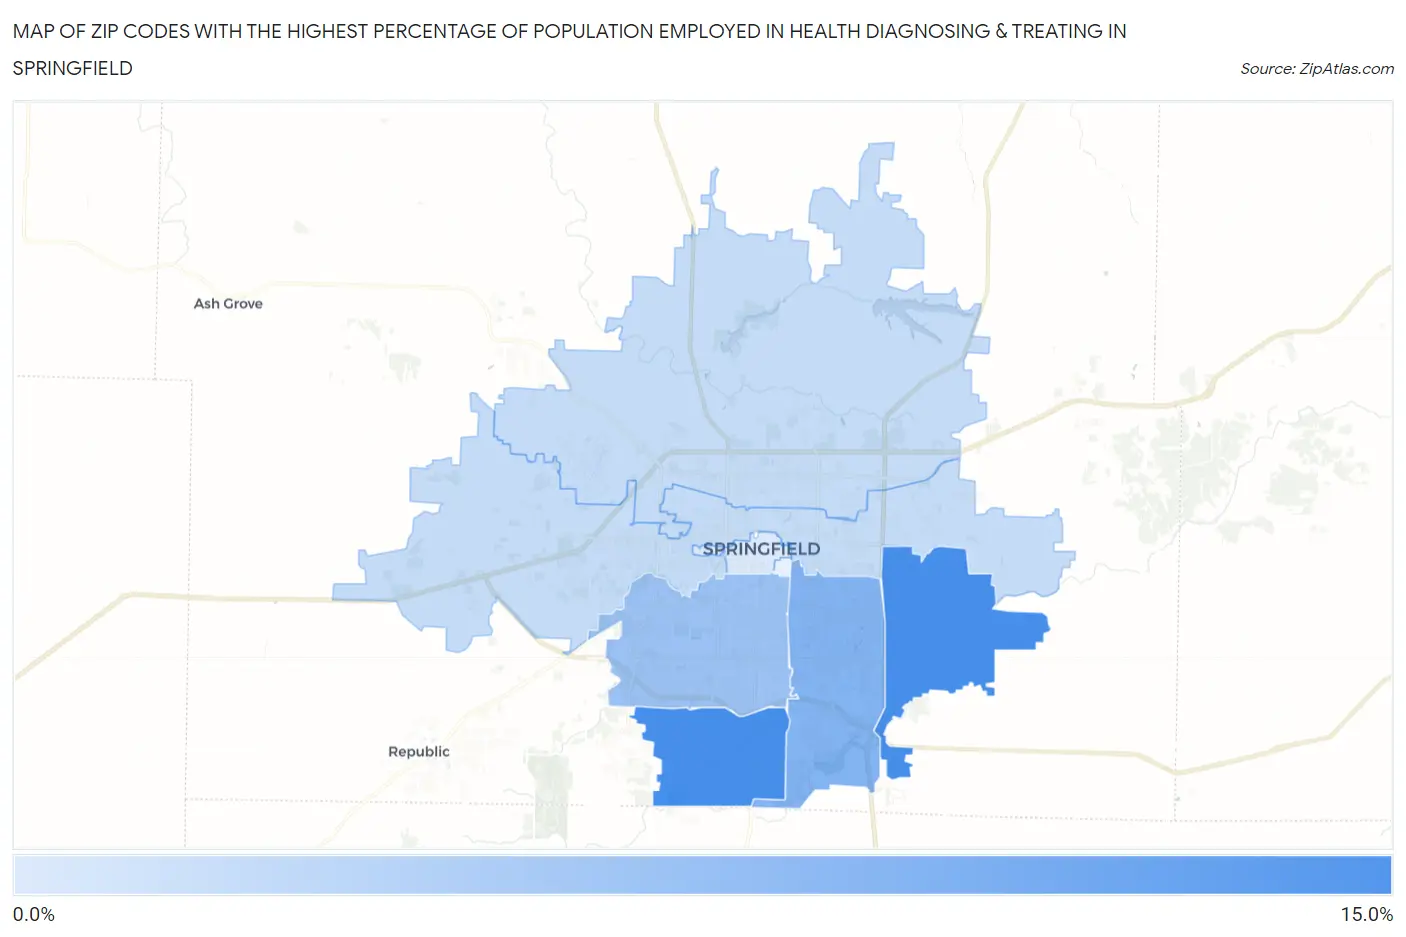
Map of Zip Codes with the Highest Percentage of Population Employed in Health Diagnosing & Treating in Springfield
0.0%
15.0%
Zip Codes with the Highest Percentage of Population Employed in Health Diagnosing & Treating in Springfield, MO
| Zip Code | % Employed | vs State | vs National | |
| 1. | 65810 | 11.7% | 6.9%(+4.82)#88 | 6.2%(+5.49)#2,367 |
| 2. | 65809 | 11.7% | 6.9%(+4.80)#89 | 6.2%(+5.47)#2,377 |
| 3. | 65804 | 8.4% | 6.9%(+1.44)#218 | 6.2%(+2.11)#6,631 |
| 4. | 65807 | 6.9% | 6.9%(-0.017)#344 | 6.2%(+0.653)#10,682 |
| 5. | 65802 | 4.8% | 6.9%(-2.16)#563 | 6.2%(-1.49)#18,666 |
| 6. | 65803 | 4.7% | 6.9%(-2.25)#569 | 6.2%(-1.58)#18,992 |
| 7. | 65806 | 3.5% | 6.9%(-3.43)#689 | 6.2%(-2.76)#22,962 |
1
Common Questions
What are the Top 5 Zip Codes with the Highest Percentage of Population Employed in Health Diagnosing & Treating in Springfield, MO?
Top 5 Zip Codes with the Highest Percentage of Population Employed in Health Diagnosing & Treating in Springfield, MO are:
What zip code has the Highest Percentage of Population Employed in Health Diagnosing & Treating in Springfield, MO?
65810 has the Highest Percentage of Population Employed in Health Diagnosing & Treating in Springfield, MO with 11.7%.
What is the Percentage of Population Employed in Health Diagnosing & Treating in Springfield, MO?
Percentage of Population Employed in Health Diagnosing & Treating in Springfield is 5.8%.
What is the Percentage of Population Employed in Health Diagnosing & Treating in Missouri?
Percentage of Population Employed in Health Diagnosing & Treating in Missouri is 6.9%.
What is the Percentage of Population Employed in Health Diagnosing & Treating in the United States?
Percentage of Population Employed in Health Diagnosing & Treating in the United States is 6.2%.