Zip Codes with the Highest Percentage of Population Employed in Life, Physical & Social Science in Springfield, MO
RELATED REPORTS & OPTIONS
Life, Physical & Social Science
Springfield
Compare Zip Codes
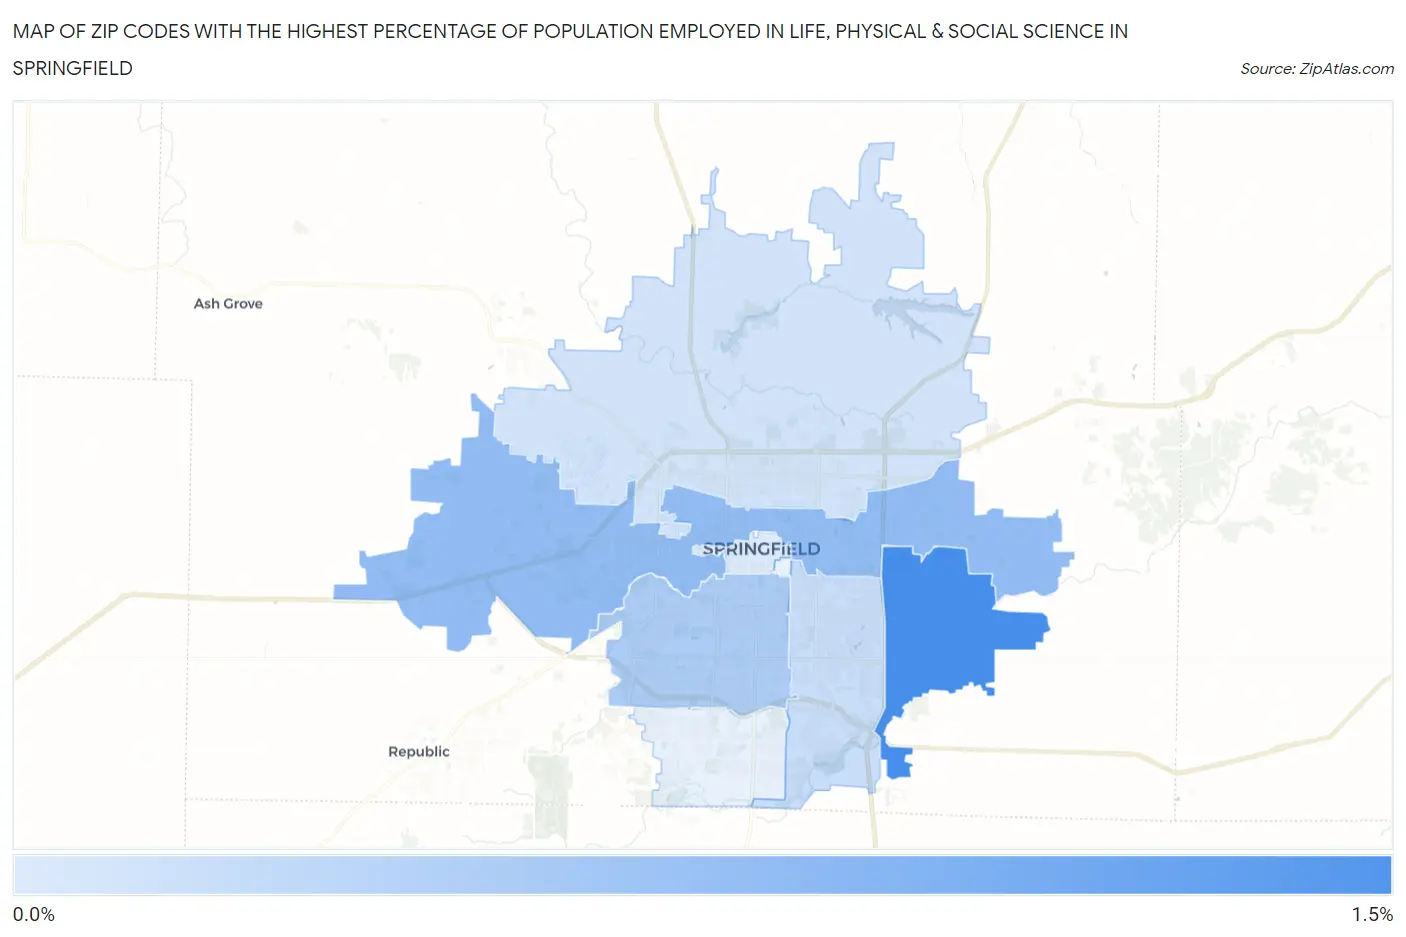
Map of Zip Codes with the Highest Percentage of Population Employed in Life, Physical & Social Science in Springfield
0.0%
1.5%
Zip Codes with the Highest Percentage of Population Employed in Life, Physical & Social Science in Springfield, MO
| Zip Code | % Employed | vs State | vs National | |
| 1. | 65809 | 1.5% | 0.98%(+0.475)#126 | 1.1%(+0.366)#5,880 |
| 2. | 65802 | 0.96% | 0.98%(-0.022)#211 | 1.1%(-0.131)#9,411 |
| 3. | 65807 | 0.79% | 0.98%(-0.195)#238 | 1.1%(-0.304)#11,127 |
| 4. | 65804 | 0.60% | 0.98%(-0.387)#294 | 1.1%(-0.495)#13,357 |
| 5. | 65803 | 0.55% | 0.98%(-0.436)#312 | 1.1%(-0.545)#13,957 |
| 6. | 65806 | 0.46% | 0.98%(-0.519)#335 | 1.1%(-0.628)#14,977 |
1
Common Questions
What are the Top 5 Zip Codes with the Highest Percentage of Population Employed in Life, Physical & Social Science in Springfield, MO?
Top 5 Zip Codes with the Highest Percentage of Population Employed in Life, Physical & Social Science in Springfield, MO are:
What zip code has the Highest Percentage of Population Employed in Life, Physical & Social Science in Springfield, MO?
65809 has the Highest Percentage of Population Employed in Life, Physical & Social Science in Springfield, MO with 1.5%.
What is the Percentage of Population Employed in Life, Physical & Social Science in Springfield, MO?
Percentage of Population Employed in Life, Physical & Social Science in Springfield is 0.61%.
What is the Percentage of Population Employed in Life, Physical & Social Science in Missouri?
Percentage of Population Employed in Life, Physical & Social Science in Missouri is 0.98%.
What is the Percentage of Population Employed in Life, Physical & Social Science in the United States?
Percentage of Population Employed in Life, Physical & Social Science in the United States is 1.1%.