Zip Codes with the Highest Percentage of Population Employed in Health Diagnosing & Treating in Waterford, MI
RELATED REPORTS & OPTIONS
Health Diagnosing & Treating
Waterford
Compare Zip Codes
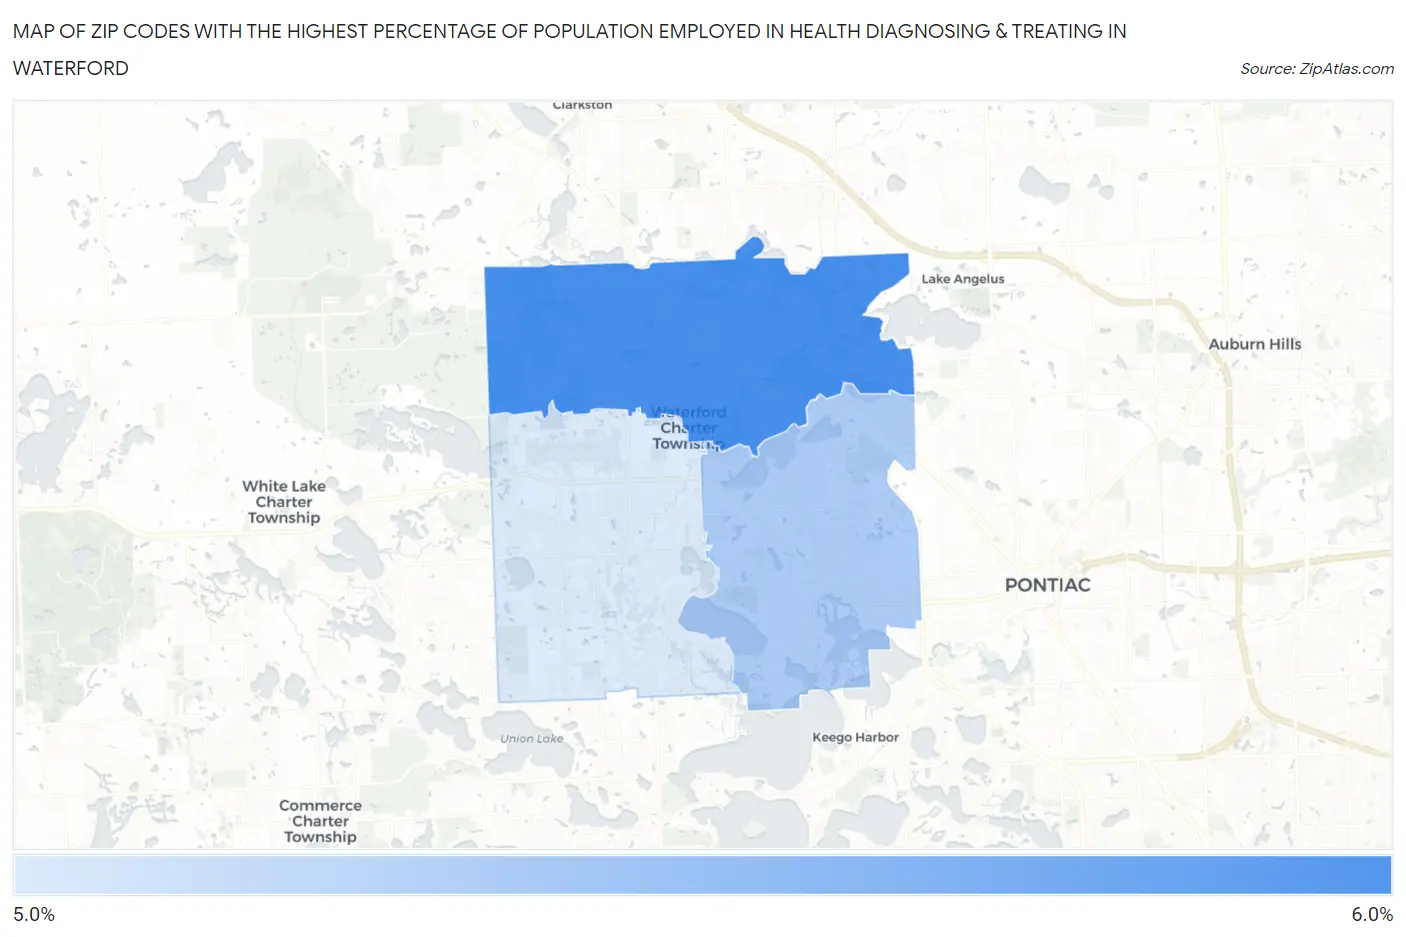
Map of Zip Codes with the Highest Percentage of Population Employed in Health Diagnosing & Treating in Waterford
0.0%
6.0%
Zip Codes with the Highest Percentage of Population Employed in Health Diagnosing & Treating in Waterford, MI
| Zip Code | % Employed | vs State | vs National | |
| 1. | 48329 | 5.5% | 6.6%(-1.15)#512 | 6.2%(-0.749)#15,804 |
| 2. | 48328 | 5.3% | 6.6%(-1.31)#540 | 6.2%(-0.908)#16,406 |
| 3. | 48327 | 5.3% | 6.6%(-1.38)#552 | 6.2%(-0.982)#16,685 |
1
Common Questions
What are the Top Zip Codes with the Highest Percentage of Population Employed in Health Diagnosing & Treating in Waterford, MI?
Top Zip Codes with the Highest Percentage of Population Employed in Health Diagnosing & Treating in Waterford, MI are:
What zip code has the Highest Percentage of Population Employed in Health Diagnosing & Treating in Waterford, MI?
48329 has the Highest Percentage of Population Employed in Health Diagnosing & Treating in Waterford, MI with 5.5%.
What is the Percentage of Population Employed in Health Diagnosing & Treating in Michigan?
Percentage of Population Employed in Health Diagnosing & Treating in Michigan is 6.6%.
What is the Percentage of Population Employed in Health Diagnosing & Treating in the United States?
Percentage of Population Employed in Health Diagnosing & Treating in the United States is 6.2%.