Zip Codes with the Highest Percentage of Population with a Degree in Arts and Humanities in Utica, MI
RELATED REPORTS & OPTIONS
Arts and Humanities
Utica
Compare Zip Codes
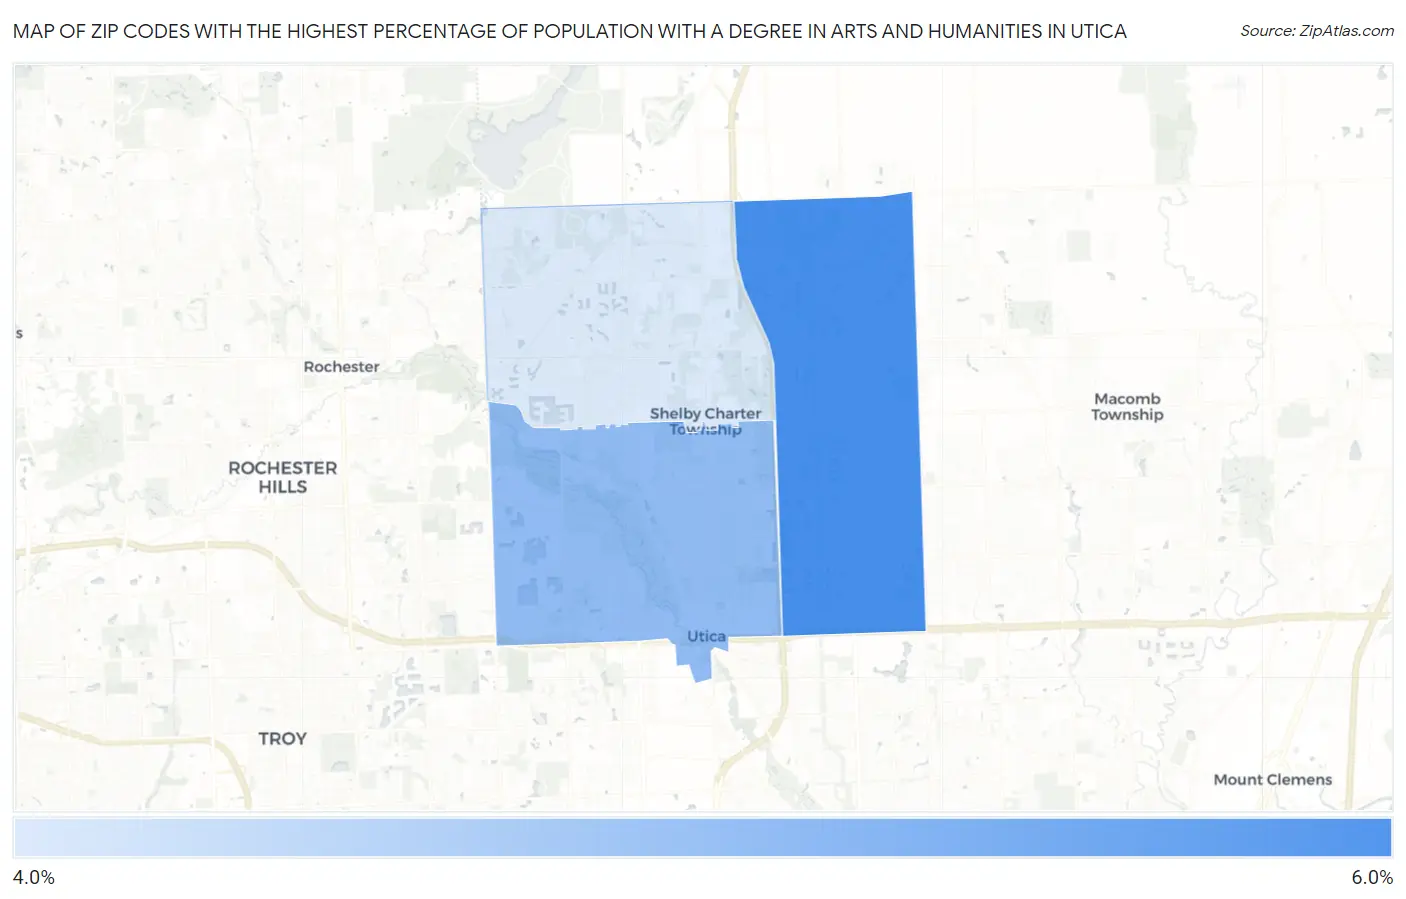
Map of Zip Codes with the Highest Percentage of Population with a Degree in Arts and Humanities in Utica
0.0%
6.0%
Zip Codes with the Highest Percentage of Population with a Degree in Arts and Humanities in Utica, MI
| Zip Code | % Graduates | vs State | vs National | |
| 1. | 48315 | 5.7% | 6.8%(-1.14)#642 | 6.0%(-0.325)#15,630 |
| 2. | 48317 | 5.1% | 6.8%(-1.71)#687 | 6.0%(-0.898)#17,304 |
| 3. | 48316 | 4.5% | 6.8%(-2.30)#739 | 6.0%(-1.49)#18,978 |
1
Common Questions
What are the Top Zip Codes with the Highest Percentage of Population with a Degree in Arts and Humanities in Utica, MI?
Top Zip Codes with the Highest Percentage of Population with a Degree in Arts and Humanities in Utica, MI are:
What zip code has the Highest Percentage of Population with a Degree in Arts and Humanities in Utica, MI?
48315 has the Highest Percentage of Population with a Degree in Arts and Humanities in Utica, MI with 5.7%.
What is the Percentage of Population with a Degree in Arts and Humanities in Utica, MI?
Percentage of Population with a Degree in Arts and Humanities in Utica is 5.2%.
What is the Percentage of Population with a Degree in Arts and Humanities in Michigan?
Percentage of Population with a Degree in Arts and Humanities in Michigan is 6.8%.
What is the Percentage of Population with a Degree in Arts and Humanities in the United States?
Percentage of Population with a Degree in Arts and Humanities in the United States is 6.0%.