Zip Codes with the Highest Percentage of Population with a Degree in Computers and Mathematics in Utica, MI
RELATED REPORTS & OPTIONS
Computers and Mathematics
Utica
Compare Zip Codes
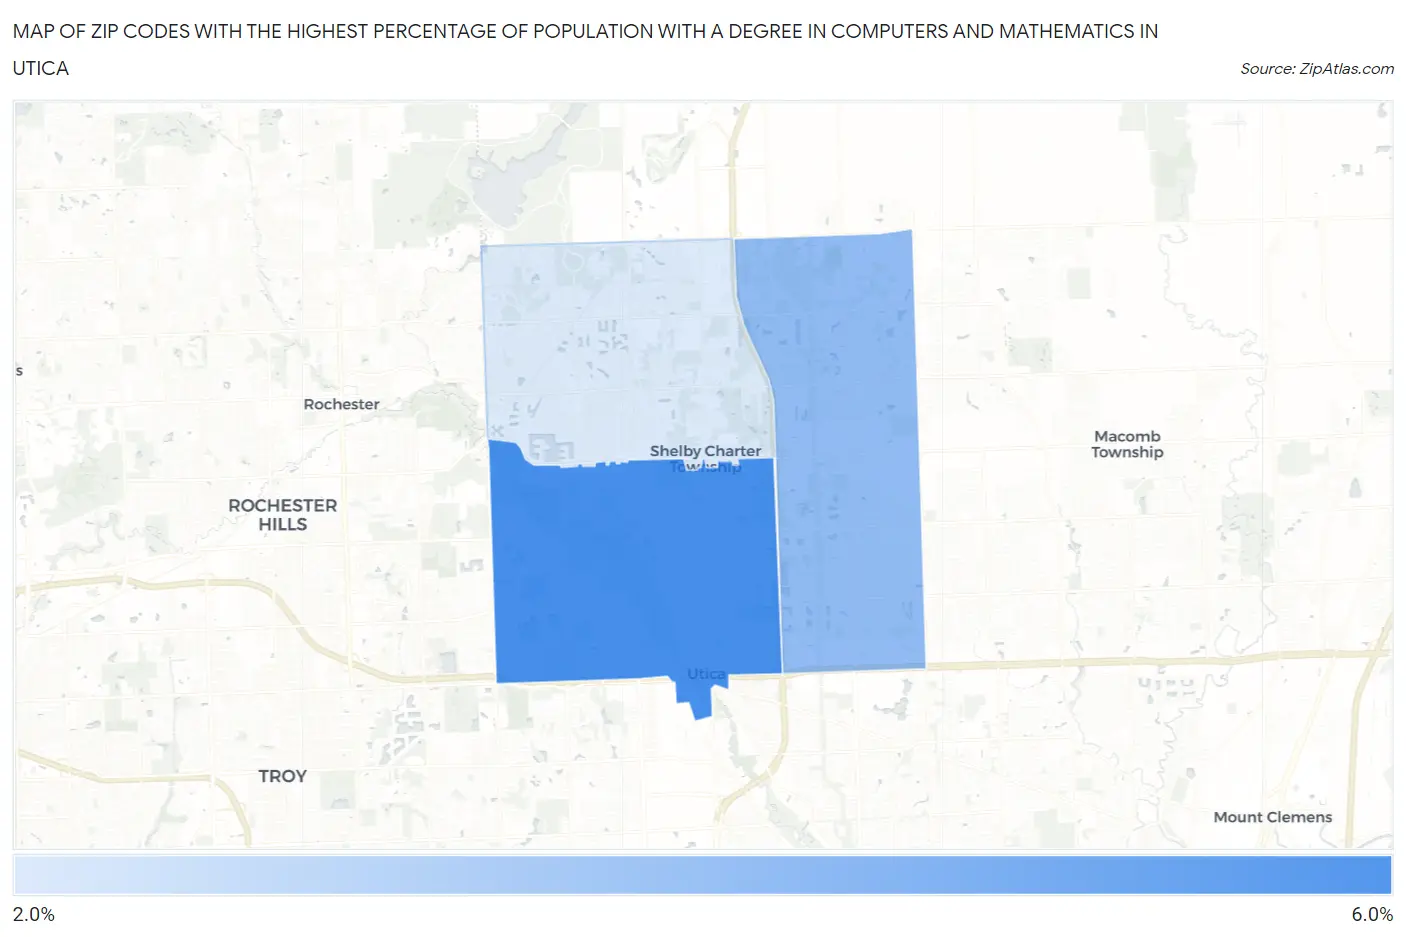
Map of Zip Codes with the Highest Percentage of Population with a Degree in Computers and Mathematics in Utica
0.0%
6.0%
Zip Codes with the Highest Percentage of Population with a Degree in Computers and Mathematics in Utica, MI
| Zip Code | % Graduates | vs State | vs National | |
| 1. | 48317 | 5.3% | 4.2%(+1.04)#196 | 4.9%(+0.372)#6,836 |
| 2. | 48315 | 3.7% | 4.2%(-0.540)#373 | 4.9%(-1.20)#11,575 |
| 3. | 48316 | 2.1% | 4.2%(-2.11)#620 | 4.9%(-2.77)#17,230 |
1
Common Questions
What are the Top Zip Codes with the Highest Percentage of Population with a Degree in Computers and Mathematics in Utica, MI?
Top Zip Codes with the Highest Percentage of Population with a Degree in Computers and Mathematics in Utica, MI are:
What zip code has the Highest Percentage of Population with a Degree in Computers and Mathematics in Utica, MI?
48317 has the Highest Percentage of Population with a Degree in Computers and Mathematics in Utica, MI with 5.3%.
What is the Percentage of Population with a Degree in Computers and Mathematics in Utica, MI?
Percentage of Population with a Degree in Computers and Mathematics in Utica is 1.4%.
What is the Percentage of Population with a Degree in Computers and Mathematics in Michigan?
Percentage of Population with a Degree in Computers and Mathematics in Michigan is 4.2%.
What is the Percentage of Population with a Degree in Computers and Mathematics in the United States?
Percentage of Population with a Degree in Computers and Mathematics in the United States is 4.9%.