Zip Codes with the Highest Percentage of Population with a Degree in Science and Engineering in Utica, MI
RELATED REPORTS & OPTIONS
Science and Engineering
Utica
Compare Zip Codes
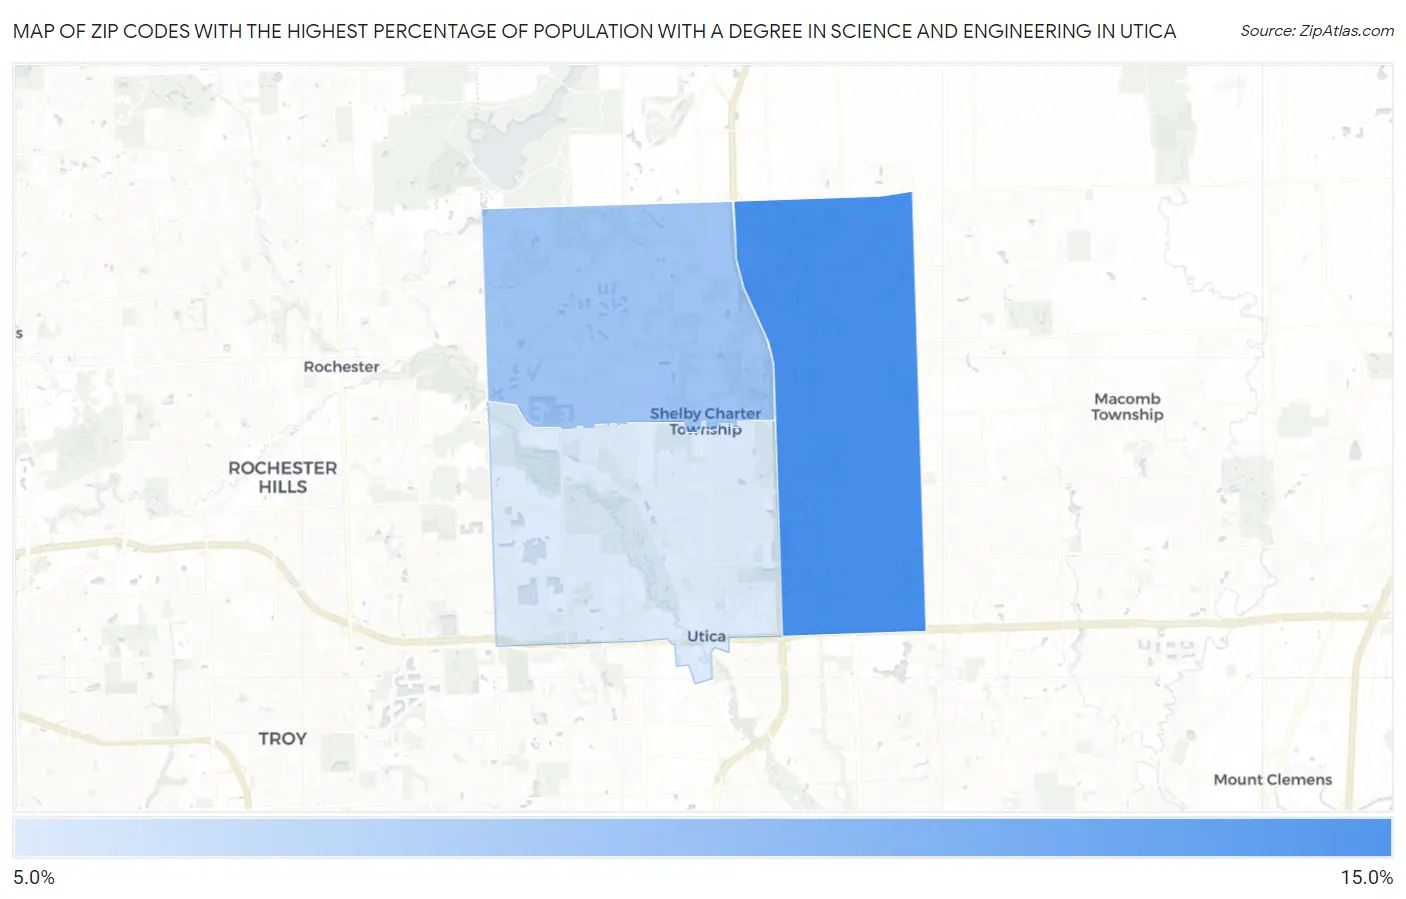
Map of Zip Codes with the Highest Percentage of Population with a Degree in Science and Engineering in Utica
0.0%
15.0%
Zip Codes with the Highest Percentage of Population with a Degree in Science and Engineering in Utica, MI
| Zip Code | % Graduates | vs State | vs National | |
| 1. | 48315 | 12.6% | 11.2%(+1.46)#366 | 9.8%(+2.84)#9,816 |
| 2. | 48316 | 12.4% | 11.2%(+1.22)#382 | 9.8%(+2.60)#10,230 |
| 3. | 48317 | 12.2% | 11.2%(+1.04)#396 | 9.8%(+2.42)#10,519 |
1
Common Questions
What are the Top Zip Codes with the Highest Percentage of Population with a Degree in Science and Engineering in Utica, MI?
Top Zip Codes with the Highest Percentage of Population with a Degree in Science and Engineering in Utica, MI are:
What zip code has the Highest Percentage of Population with a Degree in Science and Engineering in Utica, MI?
48315 has the Highest Percentage of Population with a Degree in Science and Engineering in Utica, MI with 12.6%.
What is the Percentage of Population with a Degree in Science and Engineering in Utica, MI?
Percentage of Population with a Degree in Science and Engineering in Utica is 9.7%.
What is the Percentage of Population with a Degree in Science and Engineering in Michigan?
Percentage of Population with a Degree in Science and Engineering in Michigan is 11.2%.
What is the Percentage of Population with a Degree in Science and Engineering in the United States?
Percentage of Population with a Degree in Science and Engineering in the United States is 9.8%.