Zip Codes with the Highest Percentage of Population Employed in Installation, Maintenance & Repair in Utica, MI
RELATED REPORTS & OPTIONS
Installation, Maintenance & Repair
Utica
Compare Zip Codes
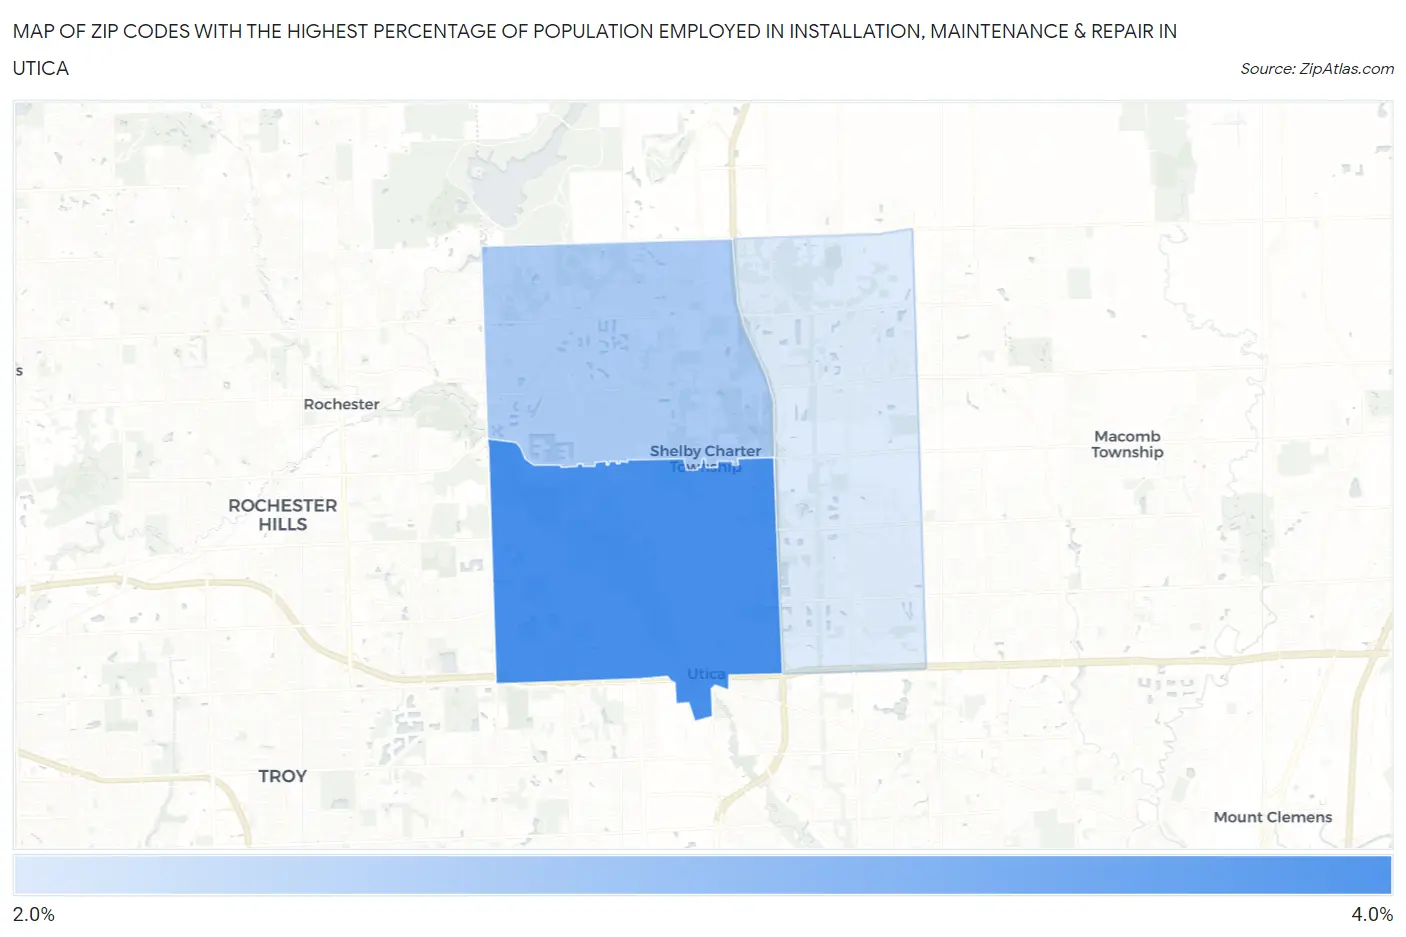
Map of Zip Codes with the Highest Percentage of Population Employed in Installation, Maintenance & Repair in Utica
0.0%
4.0%
Zip Codes with the Highest Percentage of Population Employed in Installation, Maintenance & Repair in Utica, MI
| Zip Code | % Employed | vs State | vs National | |
| 1. | 48317 | 3.1% | 3.1%(+0.001)#589 | 3.1%(+0.032)#16,523 |
| 2. | 48316 | 2.6% | 3.1%(-0.476)#668 | 3.1%(-0.444)#18,959 |
| 3. | 48315 | 2.4% | 3.1%(-0.727)#703 | 3.1%(-0.695)#20,203 |
1
Common Questions
What are the Top Zip Codes with the Highest Percentage of Population Employed in Installation, Maintenance & Repair in Utica, MI?
Top Zip Codes with the Highest Percentage of Population Employed in Installation, Maintenance & Repair in Utica, MI are:
What zip code has the Highest Percentage of Population Employed in Installation, Maintenance & Repair in Utica, MI?
48317 has the Highest Percentage of Population Employed in Installation, Maintenance & Repair in Utica, MI with 3.1%.
What is the Percentage of Population Employed in Installation, Maintenance & Repair in Utica, MI?
Percentage of Population Employed in Installation, Maintenance & Repair in Utica is 3.0%.
What is the Percentage of Population Employed in Installation, Maintenance & Repair in Michigan?
Percentage of Population Employed in Installation, Maintenance & Repair in Michigan is 3.1%.
What is the Percentage of Population Employed in Installation, Maintenance & Repair in the United States?
Percentage of Population Employed in Installation, Maintenance & Repair in the United States is 3.1%.