Zip Codes with the Highest Percentage of Population with a Degree in Arts and Humanities in Livonia, MI
RELATED REPORTS & OPTIONS
Arts and Humanities
Livonia
Compare Zip Codes
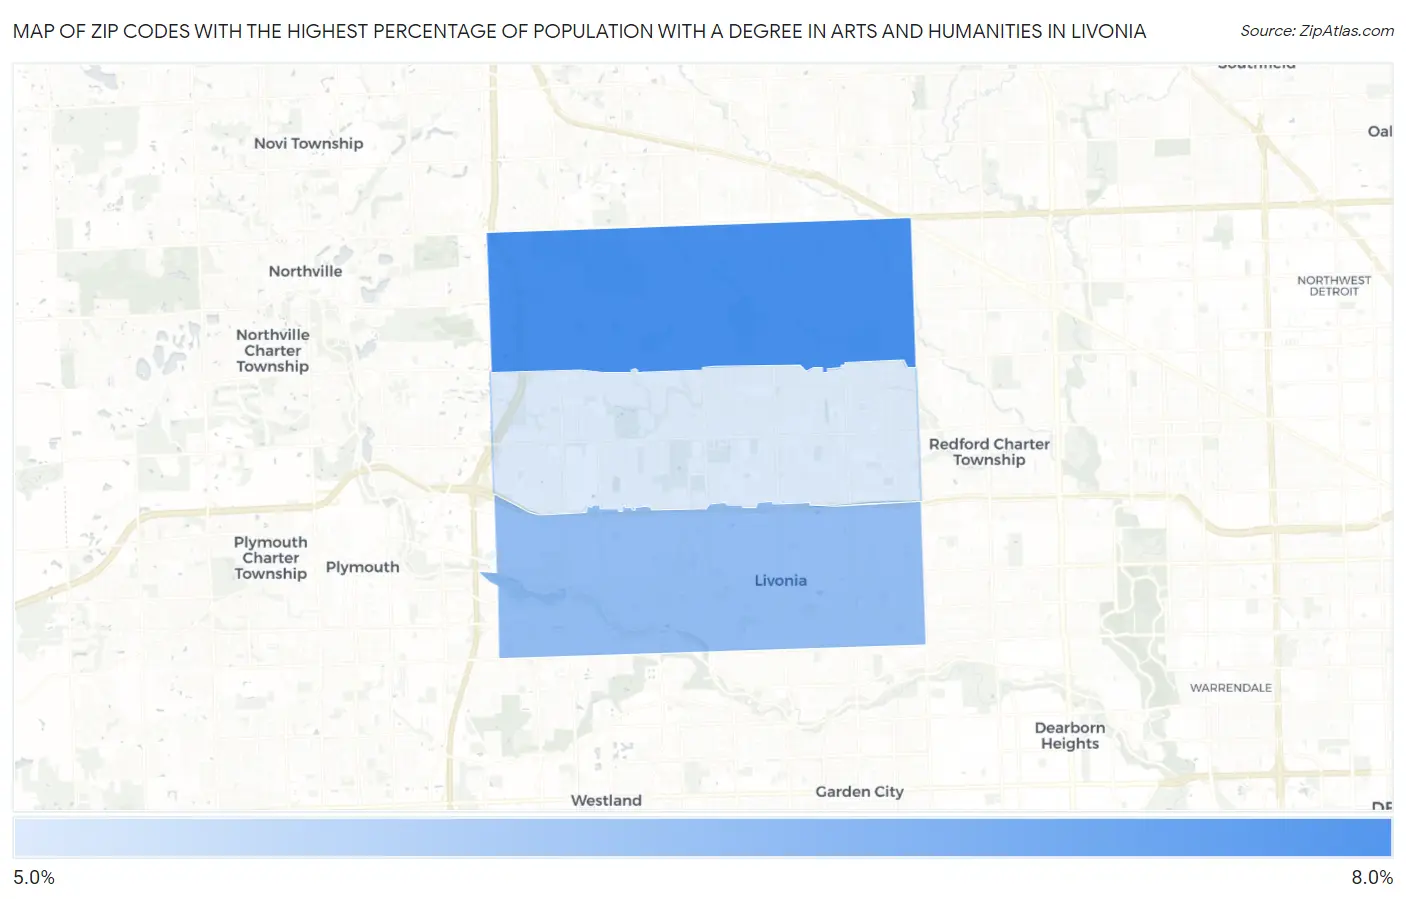
Map of Zip Codes with the Highest Percentage of Population with a Degree in Arts and Humanities in Livonia
0.0%
8.0%
Zip Codes with the Highest Percentage of Population with a Degree in Arts and Humanities in Livonia, MI
| Zip Code | % Graduates | vs State | vs National | |
| 1. | 48152 | 6.7% | 6.8%(-0.063)#517 | 6.0%(+0.754)#12,621 |
| 2. | 48150 | 6.1% | 6.8%(-0.759)#603 | 6.0%(+0.057)#14,523 |
| 3. | 48154 | 5.4% | 6.8%(-1.41)#665 | 6.0%(-0.598)#16,434 |
1
Common Questions
What are the Top Zip Codes with the Highest Percentage of Population with a Degree in Arts and Humanities in Livonia, MI?
Top Zip Codes with the Highest Percentage of Population with a Degree in Arts and Humanities in Livonia, MI are:
What zip code has the Highest Percentage of Population with a Degree in Arts and Humanities in Livonia, MI?
48152 has the Highest Percentage of Population with a Degree in Arts and Humanities in Livonia, MI with 6.7%.
What is the Percentage of Population with a Degree in Arts and Humanities in Livonia, MI?
Percentage of Population with a Degree in Arts and Humanities in Livonia is 6.0%.
What is the Percentage of Population with a Degree in Arts and Humanities in Michigan?
Percentage of Population with a Degree in Arts and Humanities in Michigan is 6.8%.
What is the Percentage of Population with a Degree in Arts and Humanities in the United States?
Percentage of Population with a Degree in Arts and Humanities in the United States is 6.0%.