Zip Codes with the Highest Percentage of Population Employed in Life, Physical & Social Science in Utica, MI
RELATED REPORTS & OPTIONS
Life, Physical & Social Science
Utica
Compare Zip Codes
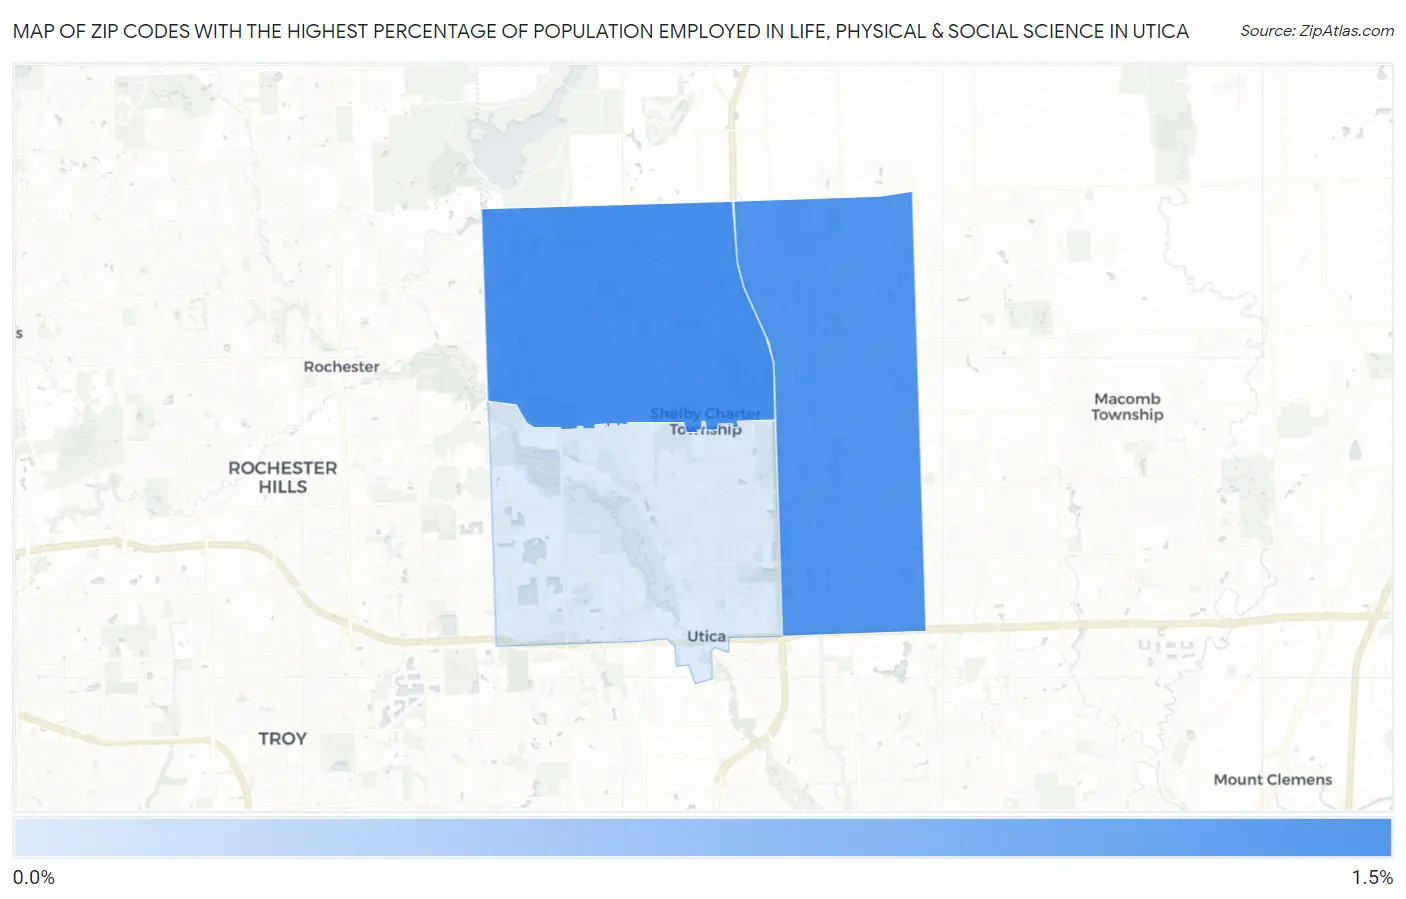
Map of Zip Codes with the Highest Percentage of Population Employed in Life, Physical & Social Science in Utica
0.0%
1.5%
Zip Codes with the Highest Percentage of Population Employed in Life, Physical & Social Science in Utica, MI
| Zip Code | % Employed | vs State | vs National | |
| 1. | 48316 | 1.1% | 0.88%(+0.218)#200 | 1.1%(+0.011)#8,206 |
| 2. | 48315 | 1.1% | 0.88%(+0.169)#217 | 1.1%(-0.038)#8,602 |
| 3. | 48317 | 0.32% | 0.88%(-0.561)#567 | 1.1%(-0.768)#16,762 |
1
Common Questions
What are the Top Zip Codes with the Highest Percentage of Population Employed in Life, Physical & Social Science in Utica, MI?
Top Zip Codes with the Highest Percentage of Population Employed in Life, Physical & Social Science in Utica, MI are:
What zip code has the Highest Percentage of Population Employed in Life, Physical & Social Science in Utica, MI?
48316 has the Highest Percentage of Population Employed in Life, Physical & Social Science in Utica, MI with 1.1%.
What is the Percentage of Population Employed in Life, Physical & Social Science in Utica, MI?
Percentage of Population Employed in Life, Physical & Social Science in Utica is 1.1%.
What is the Percentage of Population Employed in Life, Physical & Social Science in Michigan?
Percentage of Population Employed in Life, Physical & Social Science in Michigan is 0.88%.
What is the Percentage of Population Employed in Life, Physical & Social Science in the United States?
Percentage of Population Employed in Life, Physical & Social Science in the United States is 1.1%.