Zip Codes with the Highest Percentage of Population Employed in Legal Services & Support in Utica, MI
RELATED REPORTS & OPTIONS
Legal Services & Support
Utica
Compare Zip Codes
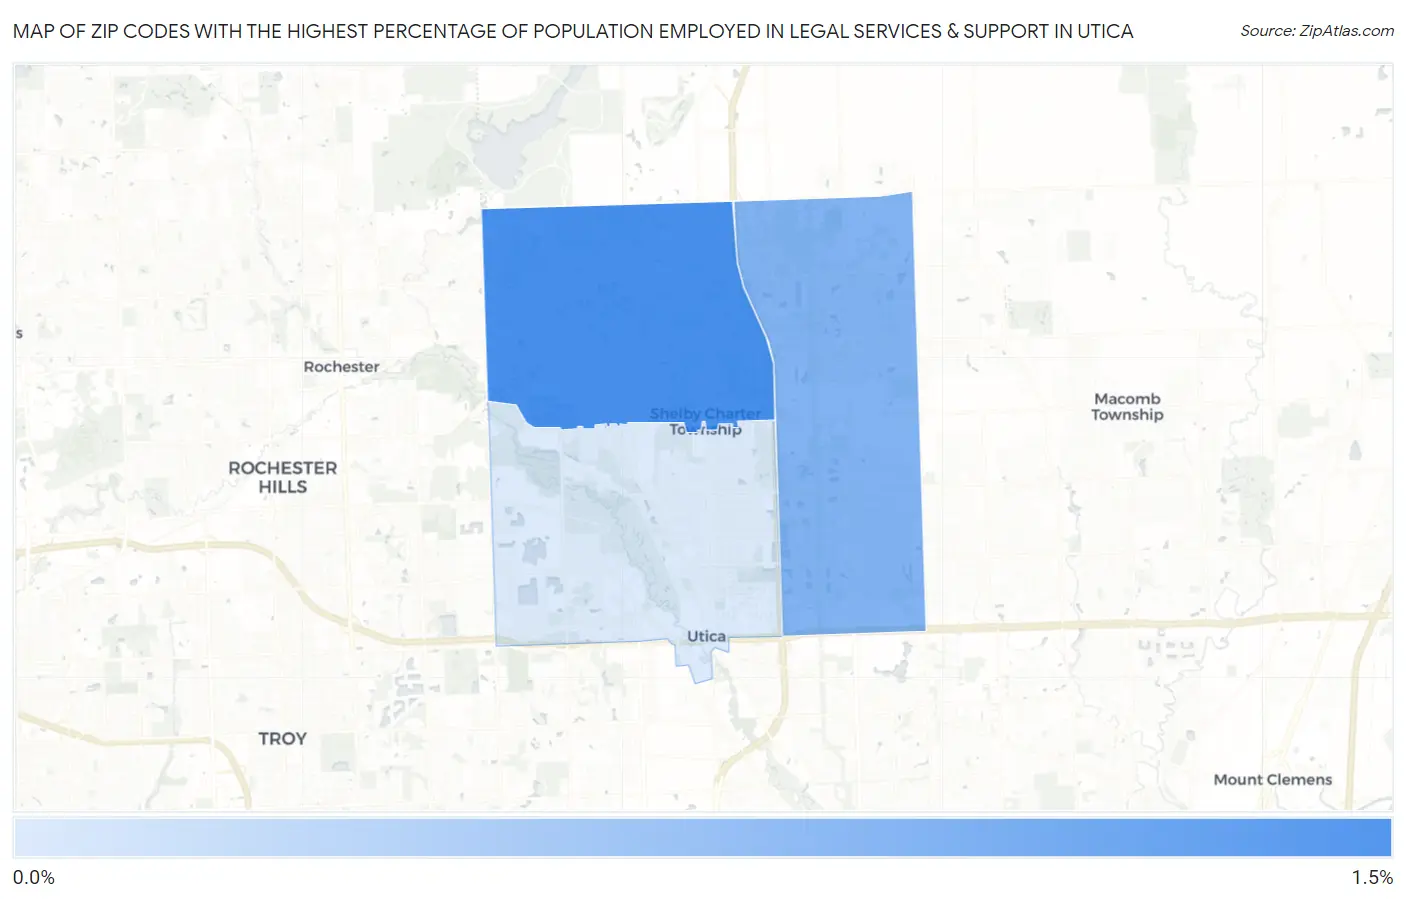
Map of Zip Codes with the Highest Percentage of Population Employed in Legal Services & Support in Utica
0.0%
1.5%
Zip Codes with the Highest Percentage of Population Employed in Legal Services & Support in Utica, MI
| Zip Code | % Employed | vs State | vs National | |
| 1. | 48316 | 1.2% | 0.89%(+0.295)#158 | 1.2%(-0.004)#6,646 |
| 2. | 48315 | 0.89% | 0.89%(-0.000)#229 | 1.2%(-0.299)#8,736 |
| 3. | 48317 | 0.41% | 0.89%(-0.472)#423 | 1.2%(-0.770)#13,693 |
1
Common Questions
What are the Top Zip Codes with the Highest Percentage of Population Employed in Legal Services & Support in Utica, MI?
Top Zip Codes with the Highest Percentage of Population Employed in Legal Services & Support in Utica, MI are:
What zip code has the Highest Percentage of Population Employed in Legal Services & Support in Utica, MI?
48316 has the Highest Percentage of Population Employed in Legal Services & Support in Utica, MI with 1.2%.
What is the Percentage of Population Employed in Legal Services & Support in Utica, MI?
Percentage of Population Employed in Legal Services & Support in Utica is 0.35%.
What is the Percentage of Population Employed in Legal Services & Support in Michigan?
Percentage of Population Employed in Legal Services & Support in Michigan is 0.89%.
What is the Percentage of Population Employed in Legal Services & Support in the United States?
Percentage of Population Employed in Legal Services & Support in the United States is 1.2%.