Zip Codes with the Highest Percentage of Population Employed in Accommodation & Food Services in Holland, MI
RELATED REPORTS & OPTIONS
Accommodation & Food Services
Holland
Compare Zip Codes
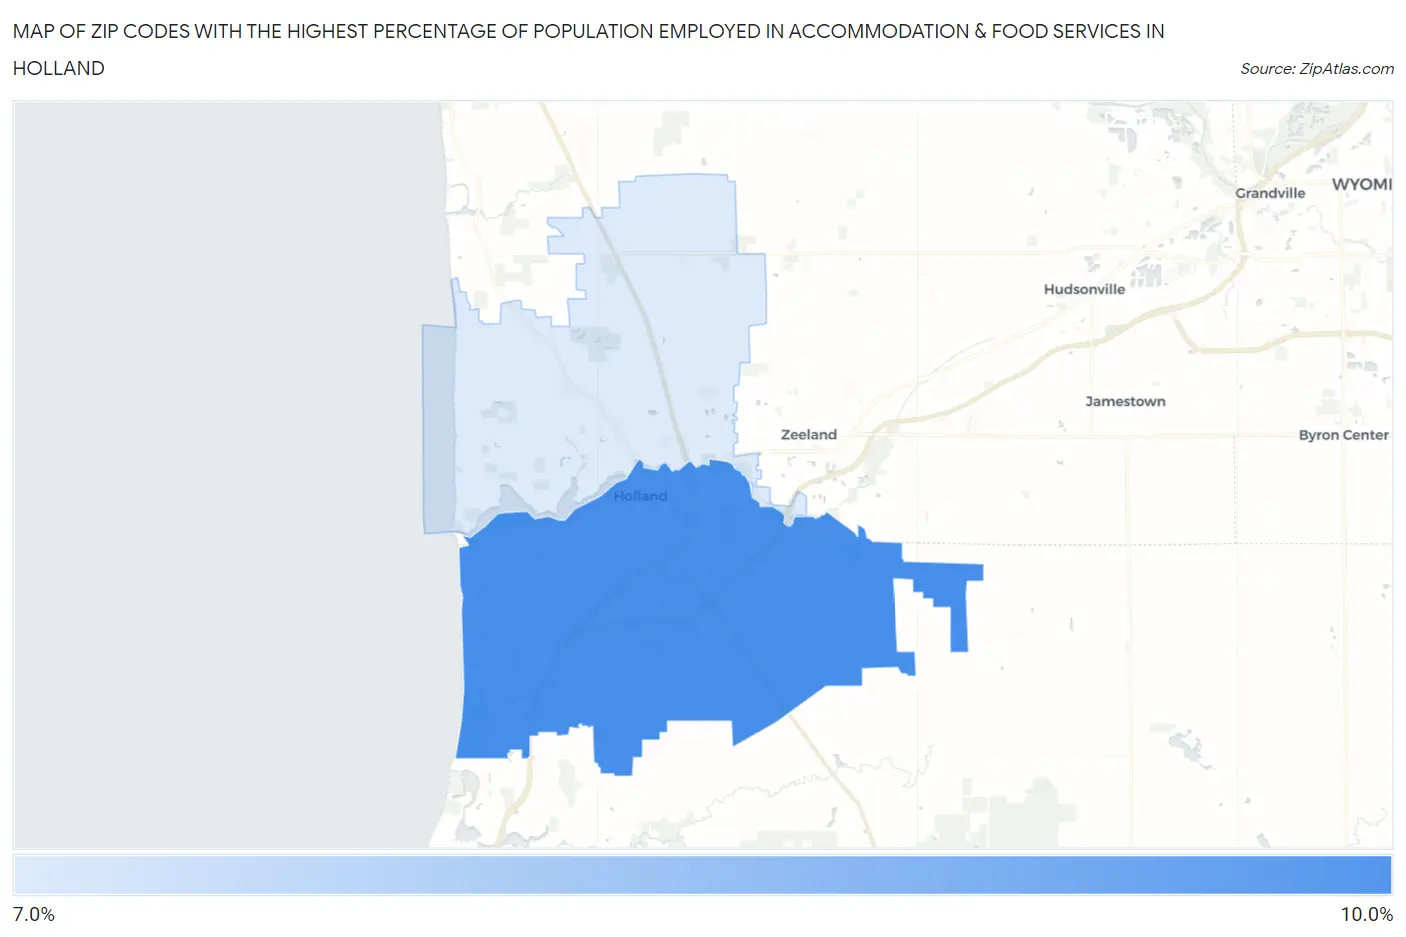
Map of Zip Codes with the Highest Percentage of Population Employed in Accommodation & Food Services in Holland
0.0%
10.0%
Zip Codes with the Highest Percentage of Population Employed in Accommodation & Food Services in Holland, MI
| Zip Code | % Employed | vs State | vs National | |
| 1. | 49423 | 8.5% | 7.1%(+1.37)#250 | 6.9%(+1.57)#6,894 |
| 2. | 49424 | 7.2% | 7.1%(+0.111)#373 | 6.9%(+0.314)#9,818 |
1
Common Questions
What are the Top Zip Codes with the Highest Percentage of Population Employed in Accommodation & Food Services in Holland, MI?
Top Zip Codes with the Highest Percentage of Population Employed in Accommodation & Food Services in Holland, MI are:
What zip code has the Highest Percentage of Population Employed in Accommodation & Food Services in Holland, MI?
49423 has the Highest Percentage of Population Employed in Accommodation & Food Services in Holland, MI with 8.5%.
What is the Percentage of Population Employed in Accommodation & Food Services in Holland, MI?
Percentage of Population Employed in Accommodation & Food Services in Holland is 8.9%.
What is the Percentage of Population Employed in Accommodation & Food Services in Michigan?
Percentage of Population Employed in Accommodation & Food Services in Michigan is 7.1%.
What is the Percentage of Population Employed in Accommodation & Food Services in the United States?
Percentage of Population Employed in Accommodation & Food Services in the United States is 6.9%.