Zip Codes with the Highest Percentage of Population Employed in Architecture & Engineering in Clarkston, MI
RELATED REPORTS & OPTIONS
Architecture & Engineering
Clarkston
Compare Zip Codes
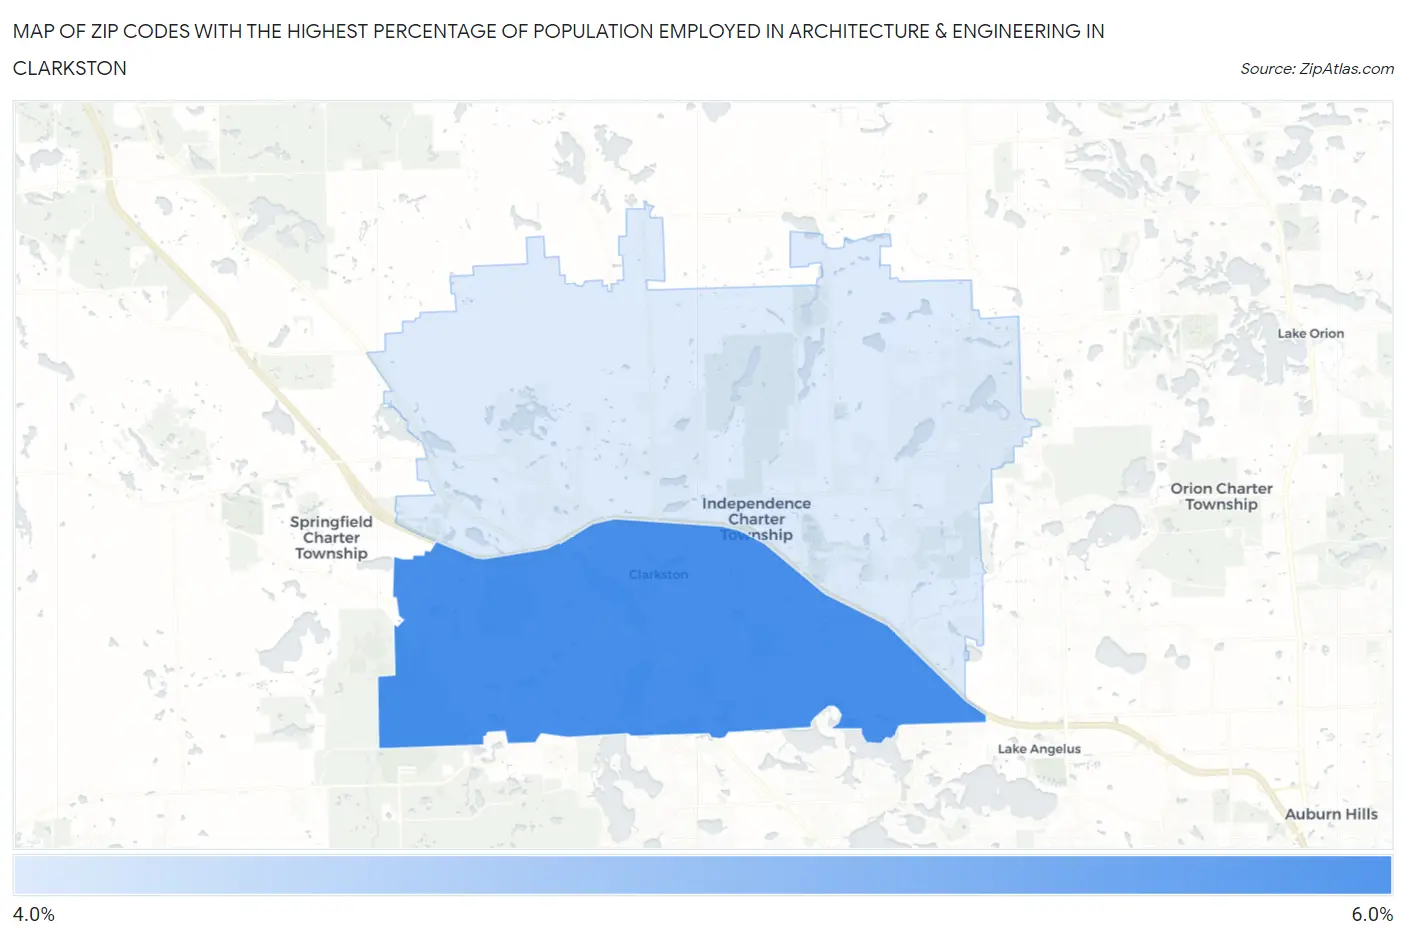
Map of Zip Codes with the Highest Percentage of Population Employed in Architecture & Engineering in Clarkston
0.0%
6.0%
Zip Codes with the Highest Percentage of Population Employed in Architecture & Engineering in Clarkston, MI
| Zip Code | % Employed | vs State | vs National | |
| 1. | 48346 | 5.8% | 3.4%(+2.42)#82 | 2.1%(+3.64)#1,179 |
| 2. | 48348 | 4.9% | 3.4%(+1.53)#122 | 2.1%(+2.75)#1,744 |
1
Common Questions
What are the Top Zip Codes with the Highest Percentage of Population Employed in Architecture & Engineering in Clarkston, MI?
Top Zip Codes with the Highest Percentage of Population Employed in Architecture & Engineering in Clarkston, MI are:
What zip code has the Highest Percentage of Population Employed in Architecture & Engineering in Clarkston, MI?
48346 has the Highest Percentage of Population Employed in Architecture & Engineering in Clarkston, MI with 5.8%.
What is the Percentage of Population Employed in Architecture & Engineering in Michigan?
Percentage of Population Employed in Architecture & Engineering in Michigan is 3.4%.
What is the Percentage of Population Employed in Architecture & Engineering in the United States?
Percentage of Population Employed in Architecture & Engineering in the United States is 2.1%.