Zip Codes with the Highest Percentage of Population Employed in Food Preparation & Serving in Towson, MD
RELATED REPORTS & OPTIONS
Food Preparation & Serving
Towson
Compare Zip Codes
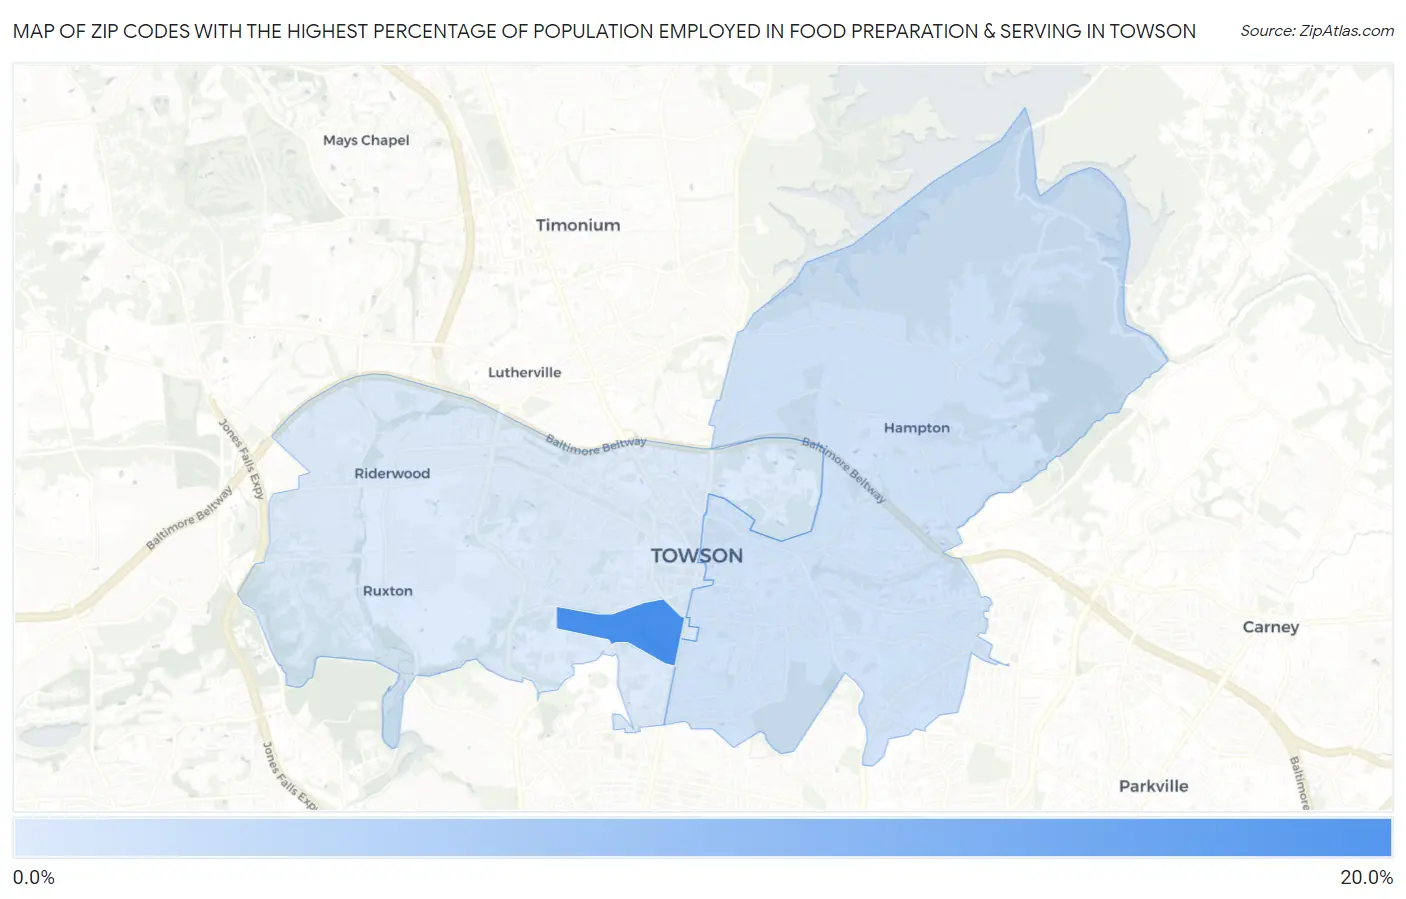
Map of Zip Codes with the Highest Percentage of Population Employed in Food Preparation & Serving in Towson
0.0%
20.0%
Zip Codes with the Highest Percentage of Population Employed in Food Preparation & Serving in Towson, MD
| Zip Code | % Employed | vs State | vs National | |
| 1. | 21252 | 18.9% | 4.4%(+14.5)#8 | 5.3%(+13.6)#575 |
| 2. | 21286 | 5.9% | 4.4%(+1.53)#92 | 5.3%(+0.629)#9,622 |
| 3. | 21204 | 4.9% | 4.4%(+0.479)#156 | 5.3%(-0.426)#13,516 |
1
Common Questions
What are the Top Zip Codes with the Highest Percentage of Population Employed in Food Preparation & Serving in Towson, MD?
Top Zip Codes with the Highest Percentage of Population Employed in Food Preparation & Serving in Towson, MD are:
What zip code has the Highest Percentage of Population Employed in Food Preparation & Serving in Towson, MD?
21252 has the Highest Percentage of Population Employed in Food Preparation & Serving in Towson, MD with 18.9%.
What is the Percentage of Population Employed in Food Preparation & Serving in Towson, MD?
Percentage of Population Employed in Food Preparation & Serving in Towson is 5.8%.
What is the Percentage of Population Employed in Food Preparation & Serving in Maryland?
Percentage of Population Employed in Food Preparation & Serving in Maryland is 4.4%.
What is the Percentage of Population Employed in Food Preparation & Serving in the United States?
Percentage of Population Employed in Food Preparation & Serving in the United States is 5.3%.