Zip Codes with the Highest Percentage of Population Employed in Food Preparation & Serving in Haverhill, MA
RELATED REPORTS & OPTIONS
Food Preparation & Serving
Haverhill
Compare Zip Codes
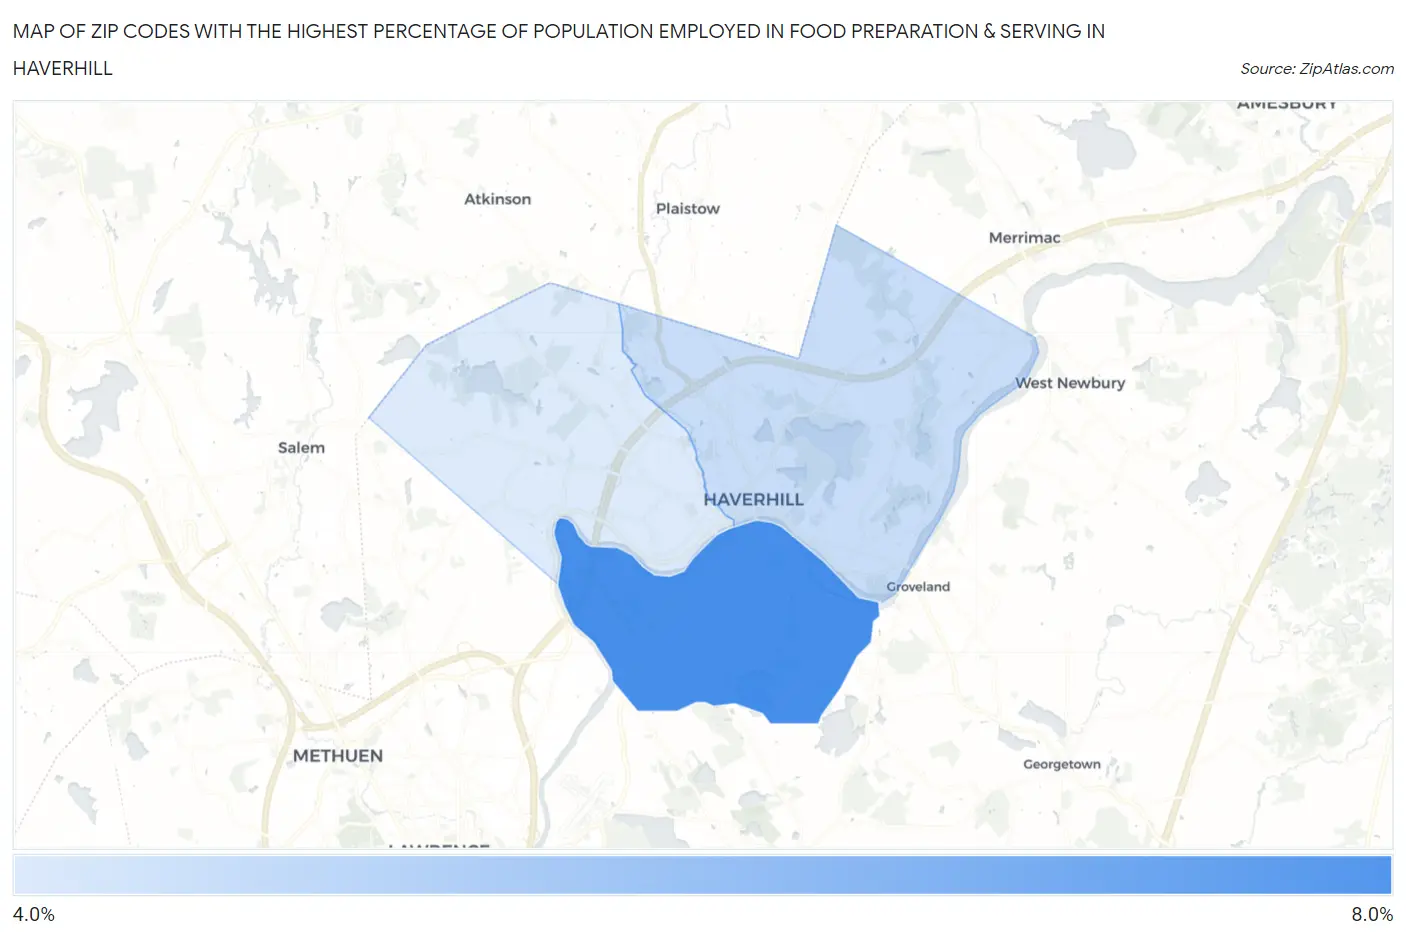
Map of Zip Codes with the Highest Percentage of Population Employed in Food Preparation & Serving in Haverhill
0.0%
8.0%
Zip Codes with the Highest Percentage of Population Employed in Food Preparation & Serving in Haverhill, MA
| Zip Code | % Employed | vs State | vs National | |
| 1. | 01835 | 6.8% | 4.6%(+2.19)#76 | 5.3%(+1.51)#7,064 |
| 2. | 01830 | 4.7% | 4.6%(+0.135)#192 | 5.3%(-0.540)#13,968 |
| 3. | 01832 | 4.4% | 4.6%(-0.173)#223 | 5.3%(-0.848)#15,246 |
1
Common Questions
What are the Top Zip Codes with the Highest Percentage of Population Employed in Food Preparation & Serving in Haverhill, MA?
Top Zip Codes with the Highest Percentage of Population Employed in Food Preparation & Serving in Haverhill, MA are:
What zip code has the Highest Percentage of Population Employed in Food Preparation & Serving in Haverhill, MA?
01835 has the Highest Percentage of Population Employed in Food Preparation & Serving in Haverhill, MA with 6.8%.
What is the Percentage of Population Employed in Food Preparation & Serving in Haverhill, MA?
Percentage of Population Employed in Food Preparation & Serving in Haverhill is 5.1%.
What is the Percentage of Population Employed in Food Preparation & Serving in Massachusetts?
Percentage of Population Employed in Food Preparation & Serving in Massachusetts is 4.6%.
What is the Percentage of Population Employed in Food Preparation & Serving in the United States?
Percentage of Population Employed in Food Preparation & Serving in the United States is 5.3%.