Zip Codes with the Highest Percentage of Population with a Degree in Visual and Performing Arts in Haverhill, MA
RELATED REPORTS & OPTIONS
Visual and Performing Arts
Haverhill
Compare Zip Codes
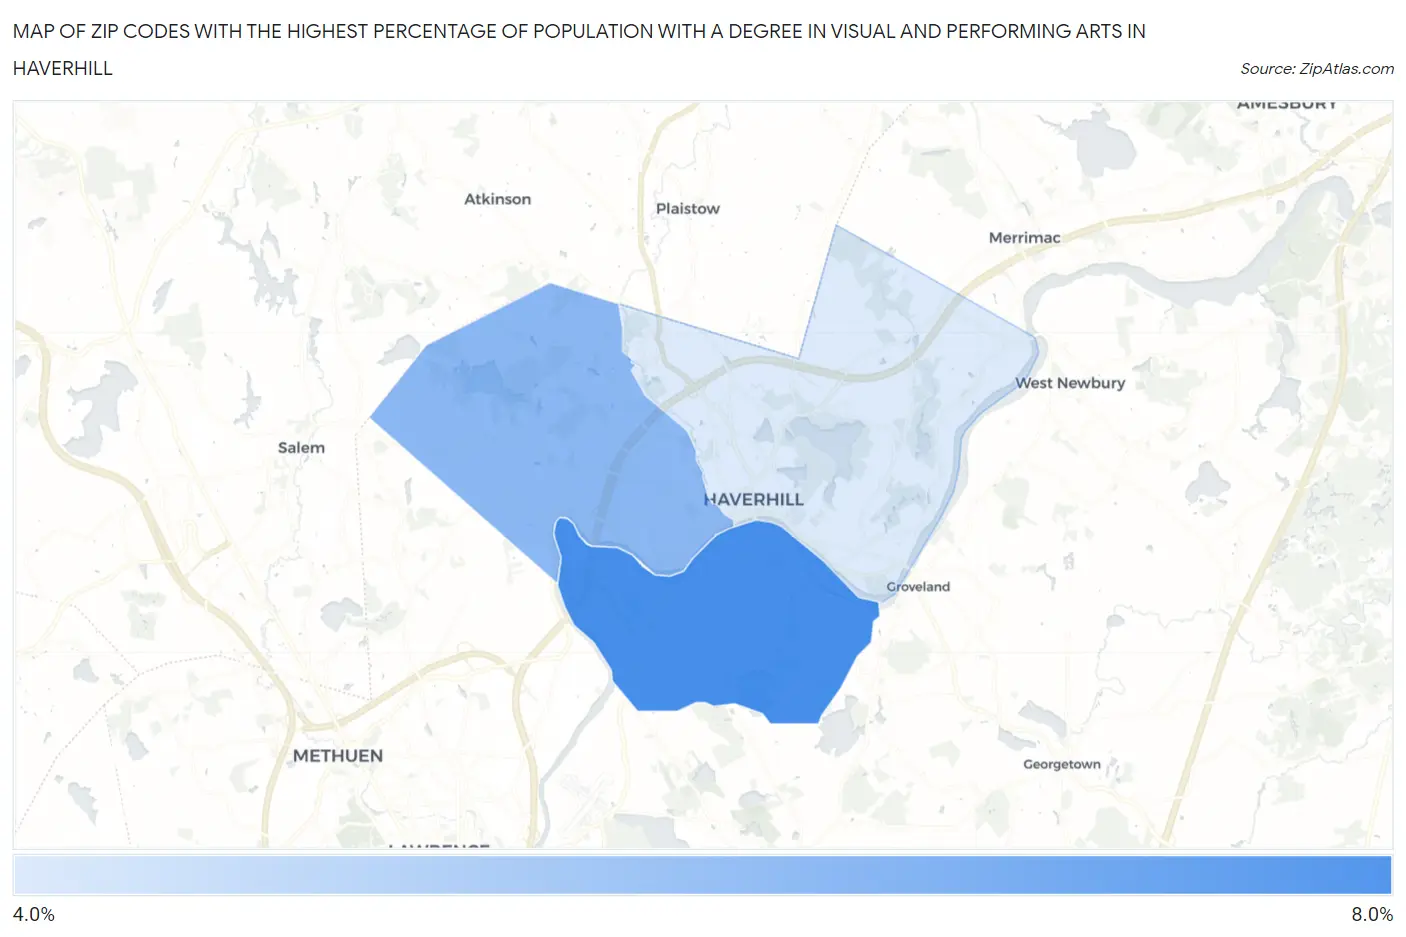
Map of Zip Codes with the Highest Percentage of Population with a Degree in Visual and Performing Arts in Haverhill
0.0%
8.0%
Zip Codes with the Highest Percentage of Population with a Degree in Visual and Performing Arts in Haverhill, MA
| Zip Code | % Graduates | vs State | vs National | |
| 1. | 01835 | 6.4% | 4.7%(+1.67)#112 | 4.3%(+2.13)#4,355 |
| 2. | 01832 | 5.5% | 4.7%(+0.769)#173 | 4.3%(+1.23)#5,711 |
| 3. | 01830 | 4.4% | 4.7%(-0.360)#251 | 4.3%(+0.103)#8,203 |
1
Common Questions
What are the Top Zip Codes with the Highest Percentage of Population with a Degree in Visual and Performing Arts in Haverhill, MA?
Top Zip Codes with the Highest Percentage of Population with a Degree in Visual and Performing Arts in Haverhill, MA are:
What zip code has the Highest Percentage of Population with a Degree in Visual and Performing Arts in Haverhill, MA?
01835 has the Highest Percentage of Population with a Degree in Visual and Performing Arts in Haverhill, MA with 6.4%.
What is the Percentage of Population with a Degree in Visual and Performing Arts in Haverhill, MA?
Percentage of Population with a Degree in Visual and Performing Arts in Haverhill is 5.3%.
What is the Percentage of Population with a Degree in Visual and Performing Arts in Massachusetts?
Percentage of Population with a Degree in Visual and Performing Arts in Massachusetts is 4.7%.
What is the Percentage of Population with a Degree in Visual and Performing Arts in the United States?
Percentage of Population with a Degree in Visual and Performing Arts in the United States is 4.3%.