Zip Codes with the Highest Percentage of Population Employed in Food Preparation & Serving in Lexington, MA
RELATED REPORTS & OPTIONS
Food Preparation & Serving
Lexington
Compare Zip Codes
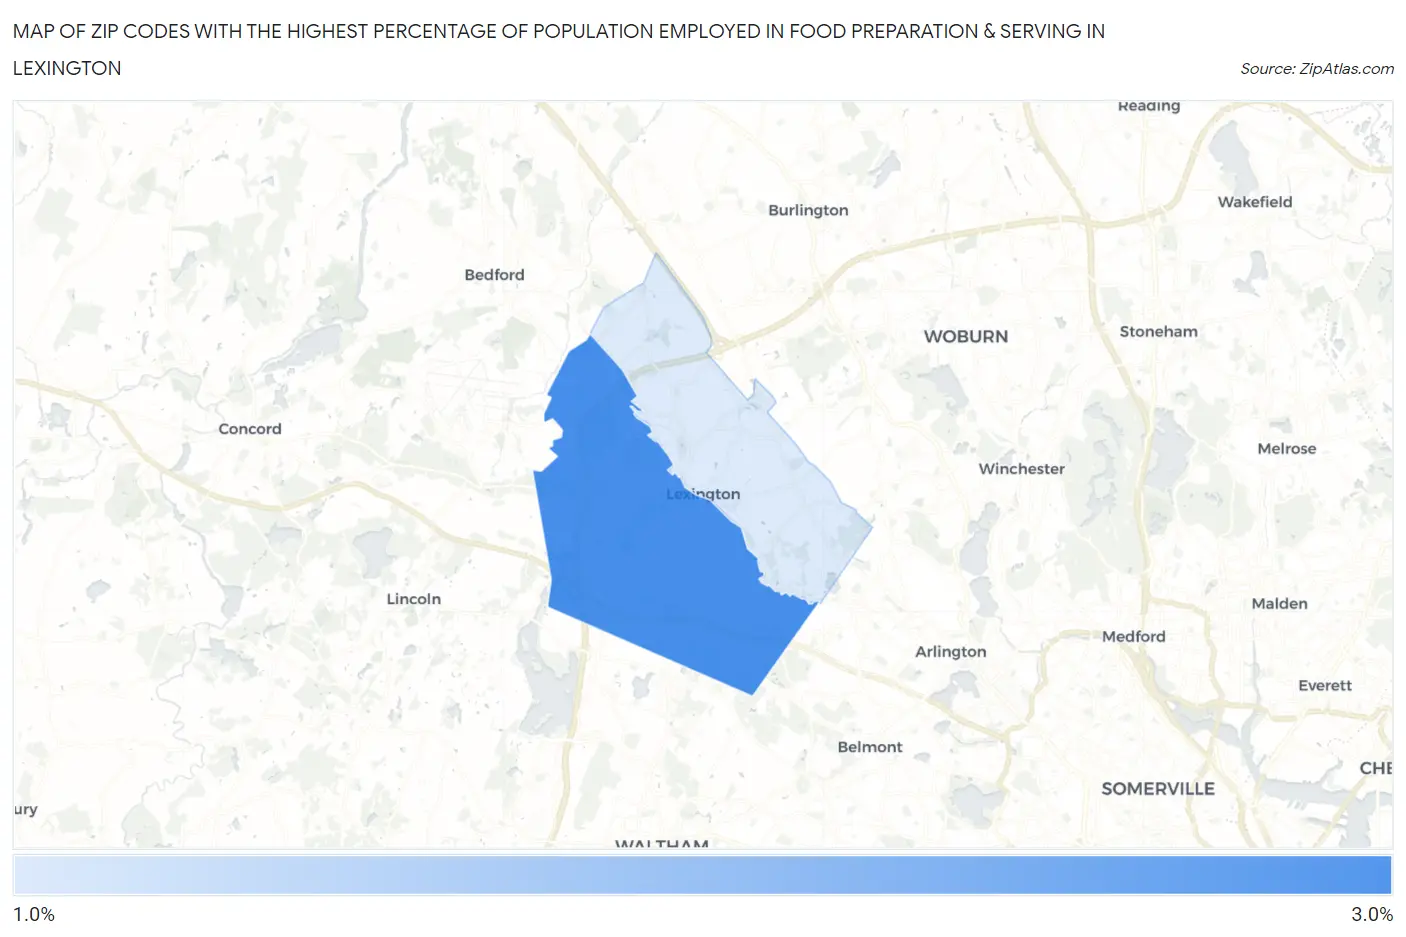
Map of Zip Codes with the Highest Percentage of Population Employed in Food Preparation & Serving in Lexington
0.0%
3.0%
Zip Codes with the Highest Percentage of Population Employed in Food Preparation & Serving in Lexington, MA
| Zip Code | % Employed | vs State | vs National | |
| 1. | 02421 | 2.8% | 4.6%(-1.79)#348 | 5.3%(-2.47)#22,004 |
| 2. | 02420 | 1.3% | 4.6%(-3.34)#457 | 5.3%(-4.01)#26,463 |
1
Common Questions
What are the Top Zip Codes with the Highest Percentage of Population Employed in Food Preparation & Serving in Lexington, MA?
Top Zip Codes with the Highest Percentage of Population Employed in Food Preparation & Serving in Lexington, MA are:
What zip code has the Highest Percentage of Population Employed in Food Preparation & Serving in Lexington, MA?
02421 has the Highest Percentage of Population Employed in Food Preparation & Serving in Lexington, MA with 2.8%.
What is the Percentage of Population Employed in Food Preparation & Serving in Lexington, MA?
Percentage of Population Employed in Food Preparation & Serving in Lexington is 2.1%.
What is the Percentage of Population Employed in Food Preparation & Serving in Massachusetts?
Percentage of Population Employed in Food Preparation & Serving in Massachusetts is 4.6%.
What is the Percentage of Population Employed in Food Preparation & Serving in the United States?
Percentage of Population Employed in Food Preparation & Serving in the United States is 5.3%.