Zip Codes with the Highest Percentage of Population Employed in Administrative & Support Services in Haverhill, MA
RELATED REPORTS & OPTIONS
Administrative & Support Services
Haverhill
Compare Zip Codes
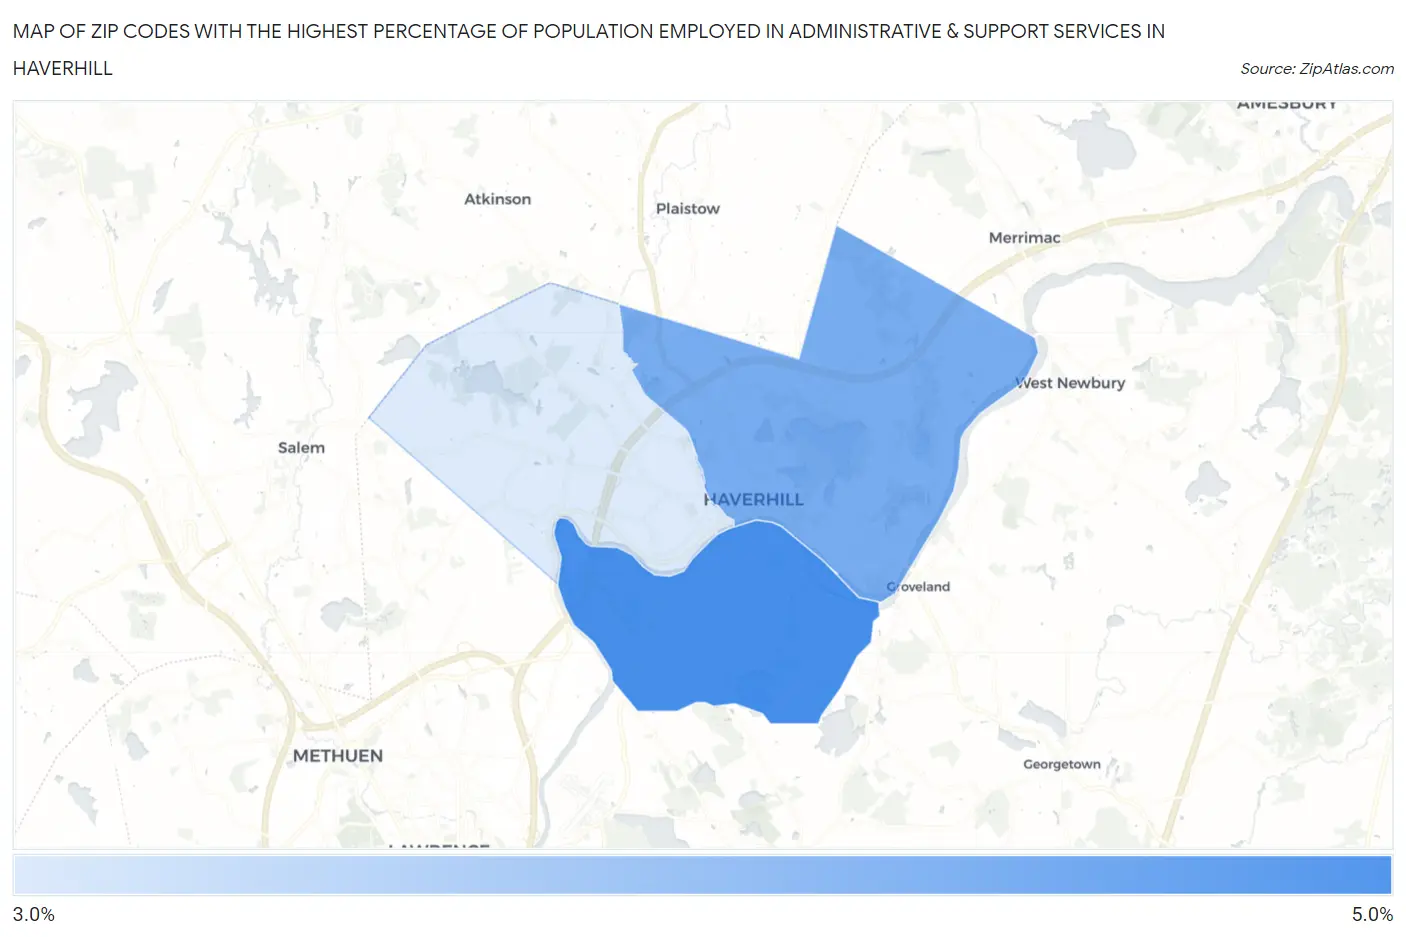
Map of Zip Codes with the Highest Percentage of Population Employed in Administrative & Support Services in Haverhill
0.0%
5.0%
Zip Codes with the Highest Percentage of Population Employed in Administrative & Support Services in Haverhill, MA
| Zip Code | % Employed | vs State | vs National | |
| 1. | 01835 | 4.9% | 3.6%(+1.28)#101 | 4.1%(+0.772)#7,344 |
| 2. | 01830 | 4.3% | 3.6%(+0.642)#131 | 4.1%(+0.137)#9,490 |
| 3. | 01832 | 3.0% | 3.6%(-0.642)#263 | 4.1%(-1.15)#15,464 |
1
Common Questions
What are the Top Zip Codes with the Highest Percentage of Population Employed in Administrative & Support Services in Haverhill, MA?
Top Zip Codes with the Highest Percentage of Population Employed in Administrative & Support Services in Haverhill, MA are:
What zip code has the Highest Percentage of Population Employed in Administrative & Support Services in Haverhill, MA?
01835 has the Highest Percentage of Population Employed in Administrative & Support Services in Haverhill, MA with 4.9%.
What is the Percentage of Population Employed in Administrative & Support Services in Haverhill, MA?
Percentage of Population Employed in Administrative & Support Services in Haverhill is 4.0%.
What is the Percentage of Population Employed in Administrative & Support Services in Massachusetts?
Percentage of Population Employed in Administrative & Support Services in Massachusetts is 3.6%.
What is the Percentage of Population Employed in Administrative & Support Services in the United States?
Percentage of Population Employed in Administrative & Support Services in the United States is 4.1%.