Zip Codes with the Highest Percentage of Population Employed in Food Preparation & Serving in Lowell, MA
RELATED REPORTS & OPTIONS
Food Preparation & Serving
Lowell
Compare Zip Codes
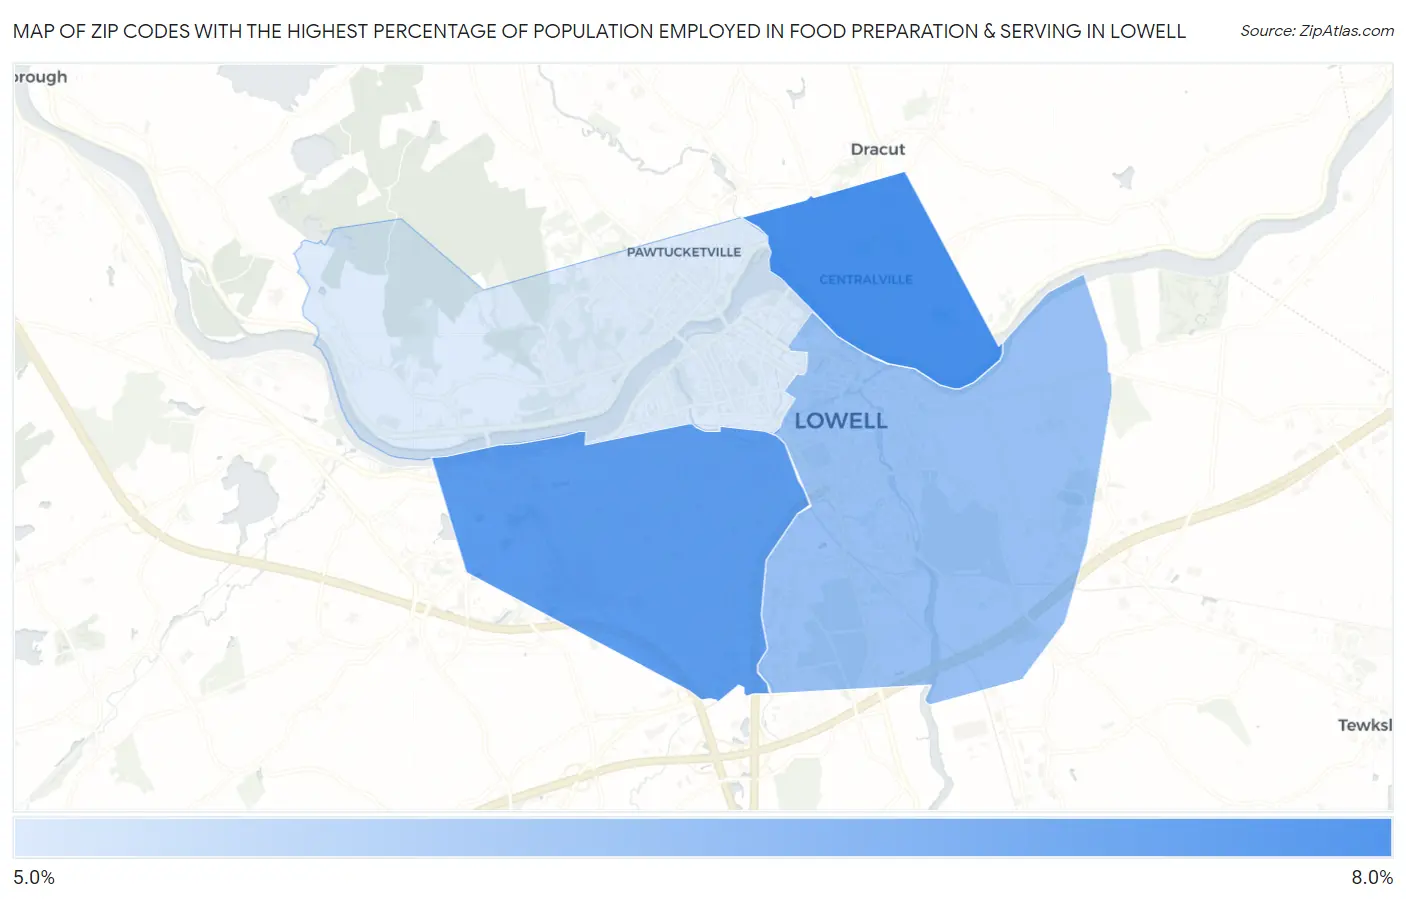
Map of Zip Codes with the Highest Percentage of Population Employed in Food Preparation & Serving in Lowell
0.0%
8.0%
Zip Codes with the Highest Percentage of Population Employed in Food Preparation & Serving in Lowell, MA
| Zip Code | % Employed | vs State | vs National | |
| 1. | 01850 | 6.1% | 4.6%(+1.52)#104 | 5.3%(+0.849)#8,914 |
| 2. | 01851 | 6.0% | 4.6%(+1.41)#112 | 5.3%(+0.731)#9,291 |
| 3. | 01852 | 5.7% | 4.6%(+1.07)#135 | 5.3%(+0.397)#10,409 |
| 4. | 01854 | 5.3% | 4.6%(+0.682)#154 | 5.3%(+0.007)#11,794 |
1
Common Questions
What are the Top 3 Zip Codes with the Highest Percentage of Population Employed in Food Preparation & Serving in Lowell, MA?
Top 3 Zip Codes with the Highest Percentage of Population Employed in Food Preparation & Serving in Lowell, MA are:
What zip code has the Highest Percentage of Population Employed in Food Preparation & Serving in Lowell, MA?
01850 has the Highest Percentage of Population Employed in Food Preparation & Serving in Lowell, MA with 6.1%.
What is the Percentage of Population Employed in Food Preparation & Serving in Lowell, MA?
Percentage of Population Employed in Food Preparation & Serving in Lowell is 5.7%.
What is the Percentage of Population Employed in Food Preparation & Serving in Massachusetts?
Percentage of Population Employed in Food Preparation & Serving in Massachusetts is 4.6%.
What is the Percentage of Population Employed in Food Preparation & Serving in the United States?
Percentage of Population Employed in Food Preparation & Serving in the United States is 5.3%.