Zip Codes with the Highest Percentage of Population Employed in Accommodation & Food Services in Haverhill, MA
RELATED REPORTS & OPTIONS
Accommodation & Food Services
Haverhill
Compare Zip Codes
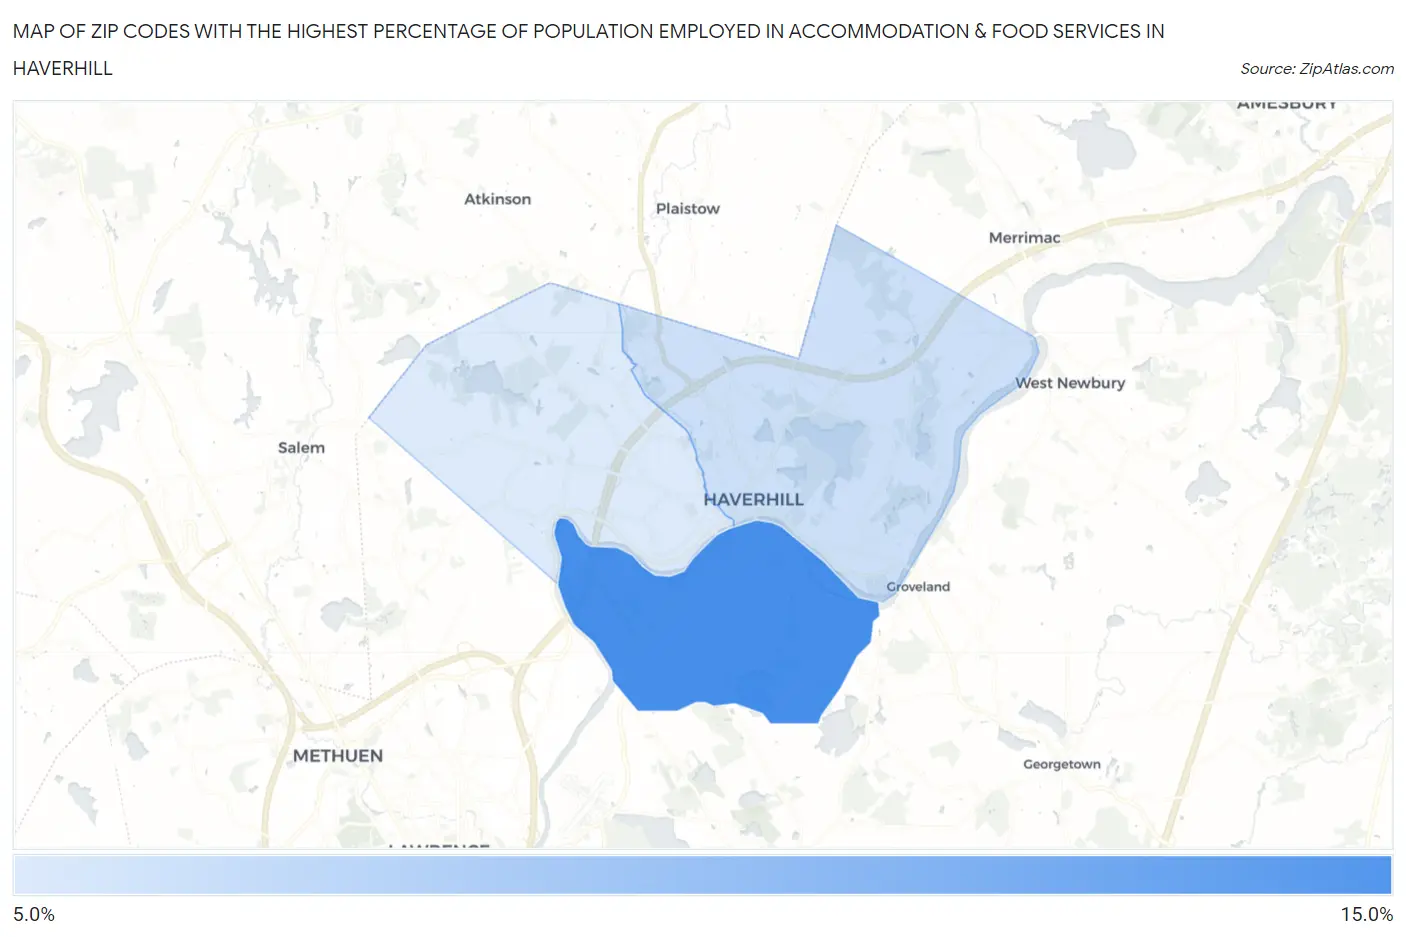
Map of Zip Codes with the Highest Percentage of Population Employed in Accommodation & Food Services in Haverhill
0.0%
15.0%
Zip Codes with the Highest Percentage of Population Employed in Accommodation & Food Services in Haverhill, MA
| Zip Code | % Employed | vs State | vs National | |
| 1. | 01835 | 11.0% | 5.8%(+5.22)#34 | 6.9%(+4.10)#3,568 |
| 2. | 01830 | 6.9% | 5.8%(+1.13)#145 | 6.9%(+0.012)#10,611 |
| 3. | 01832 | 6.4% | 5.8%(+0.668)#167 | 6.9%(-0.451)#12,061 |
1
Common Questions
What are the Top Zip Codes with the Highest Percentage of Population Employed in Accommodation & Food Services in Haverhill, MA?
Top Zip Codes with the Highest Percentage of Population Employed in Accommodation & Food Services in Haverhill, MA are:
What zip code has the Highest Percentage of Population Employed in Accommodation & Food Services in Haverhill, MA?
01835 has the Highest Percentage of Population Employed in Accommodation & Food Services in Haverhill, MA with 11.0%.
What is the Percentage of Population Employed in Accommodation & Food Services in Haverhill, MA?
Percentage of Population Employed in Accommodation & Food Services in Haverhill is 7.7%.
What is the Percentage of Population Employed in Accommodation & Food Services in Massachusetts?
Percentage of Population Employed in Accommodation & Food Services in Massachusetts is 5.8%.
What is the Percentage of Population Employed in Accommodation & Food Services in the United States?
Percentage of Population Employed in Accommodation & Food Services in the United States is 6.9%.